
Financial Management: Principles & Applications








Description: Financial Management: Principles Applications Thirteenth Edition Chapter 11 Investment Decision Criteria Copyright 2018, 2014, 2011 Pearson Education, Inc. All Rights Reserved Learning Objectives (1 of 2) Understand how to identify the
Related Topics
Download Presentation
"Financial Management: Principles & Applications" is the property of its rightful owner. Permission is granted to download and print the materials on this website for personal, non-commercial use only, and to display it on your personal computer provided you do not modify the materials and that you retain all copyright notices contained in the materials. By downloading content from our website, you accept the terms of this agreement.
Presentation Transcript
slide1. Financial Management:
Principles & Applications Thirteenth Edition Chapter 11 Investment Decision Criteria Copyright © 2018, 2014, 2011 Pearson Education, Inc. All Rights Reserved<br>
slide2. Learning Objectives (1 of 2) Understand how to identify the sources and types of profitable investment opportunities.
Evaluate investment opportunities using net present value and describe why net present value is the best measure to use.<br>
slide3. Learning Objectives (2 of 2) Use the profitability index, internal rate of return, and payback criteria to evaluate investment opportunities.
Understand current business practice with respect to the use of capital-budgeting criteria.<br>
slide4. Principles Applied in This Chapter Principle 1: Money Has a Time Value.
Principle 2: There is a Risk-Return Tradeoff.
Principle 3: Cash Flows Are the Source of Value.
Principle 5: Individuals Respond to Incentives.<br>
slide5. 11.1 AN OVERVIEW OF CAPITAL BUDGETING<br>
slide6. Disney’s Capital Budgeting Decision: Three Important Lessons (1 of 2) Disney’s decision to invest $17.5 million to build Disneyland park in California in 1955 is an example of a major capital budgeting decision. How did this decision impact Disney? What important lessons can we learn from Disney theme park story?<br>
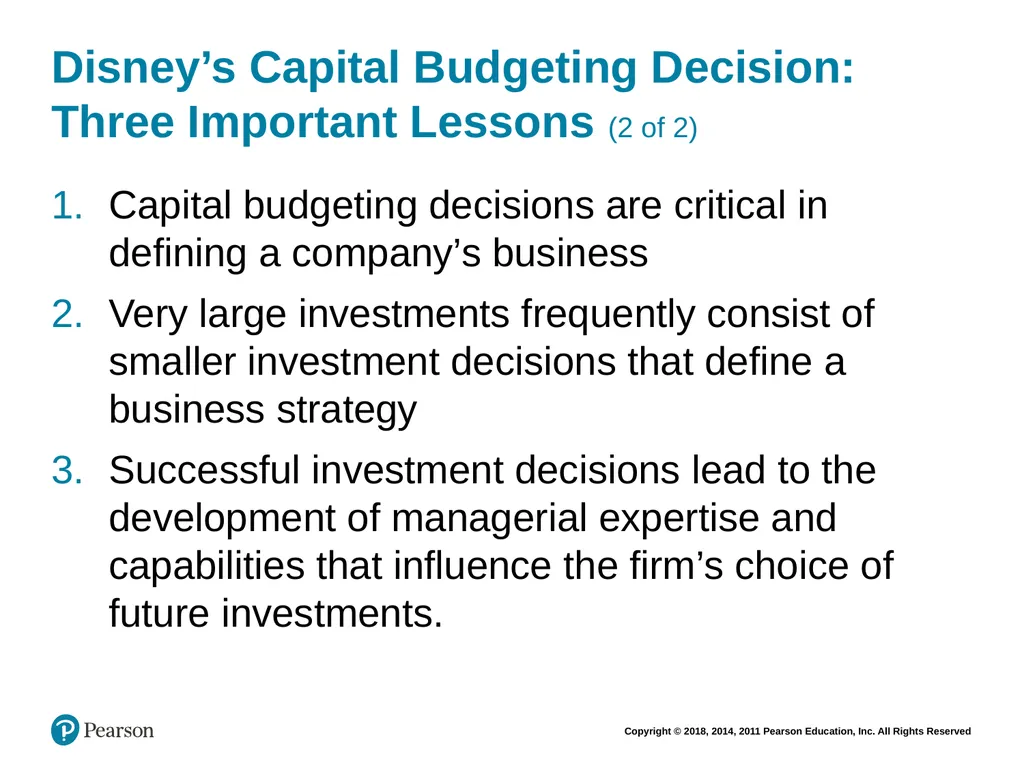
slide7. Disney’s Capital Budgeting Decision: Three Important Lessons (2 of 2) Capital budgeting decisions are critical in defining a company’s business
Very large investments frequently consist of smaller investment decisions that define a business strategy
Successful investment decisions lead to the development of managerial expertise and capabilities that influence the firm’s choice of future investments.<br>
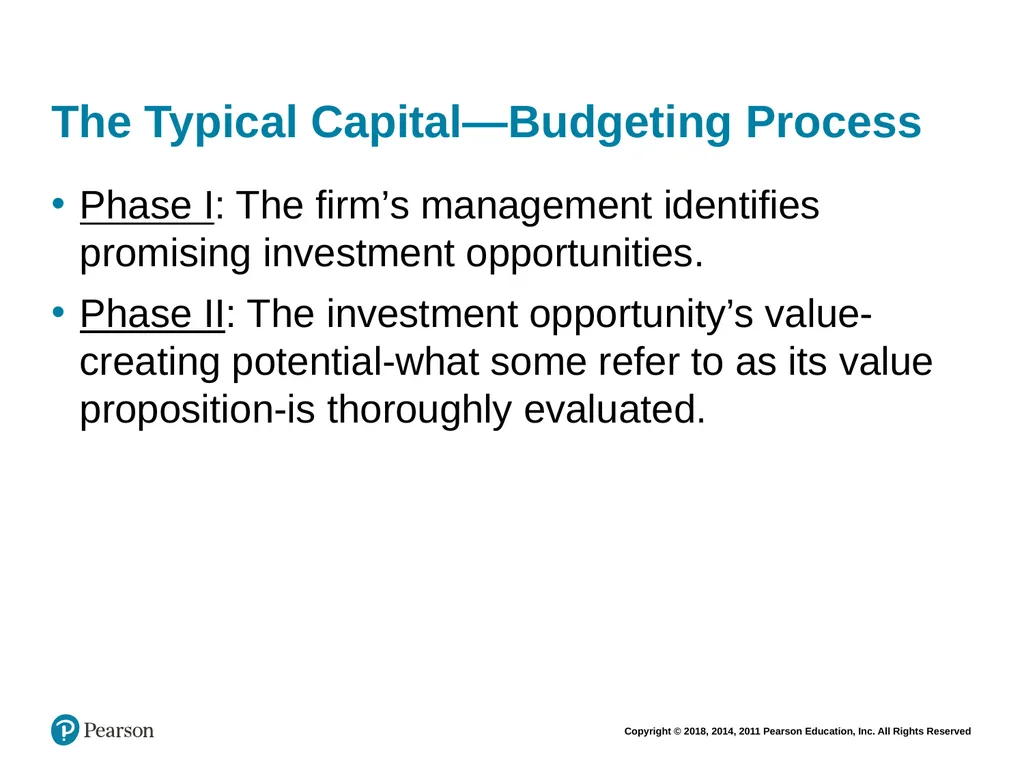
slide8. The Typical Capital—Budgeting Process Phase I: The firm’s management identifies promising investment opportunities.
Phase II: The investment opportunity’s value-creating potential-what some refer to as its value proposition-is thoroughly evaluated.<br>
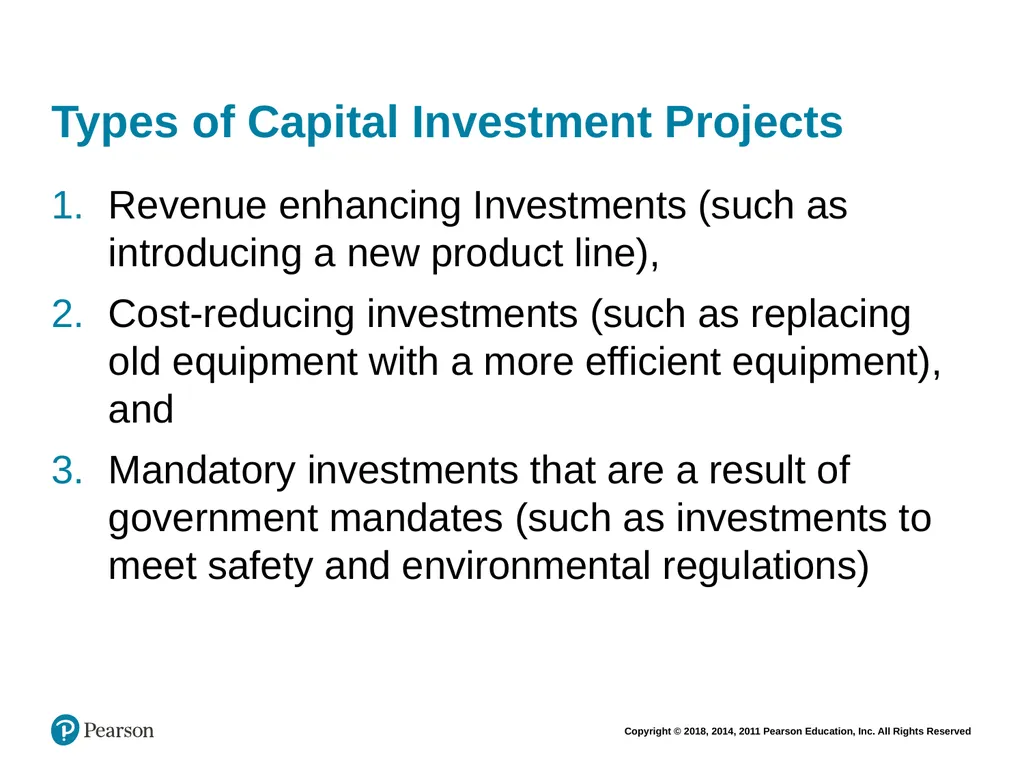
slide9. Types of Capital Investment Projects Revenue enhancing Investments (such as introducing a new product line),
Cost-reducing investments (such as replacing old equipment with a more efficient equipment), and
Mandatory investments that are a result of government mandates (such as investments to meet safety and environmental regulations)<br>
slide10. 11.2 NET PRESENT VALUE<br>
slide11. Net Present Value The net present value (NPV) is the difference between the present value of cash inflows and the cash outflows. NPV estimates the amount of wealth that the project creates.
Decision Criteria: Investment projects should be accepted if the NPV of the project is positive and should be rejected if the NPV is negative.<br>
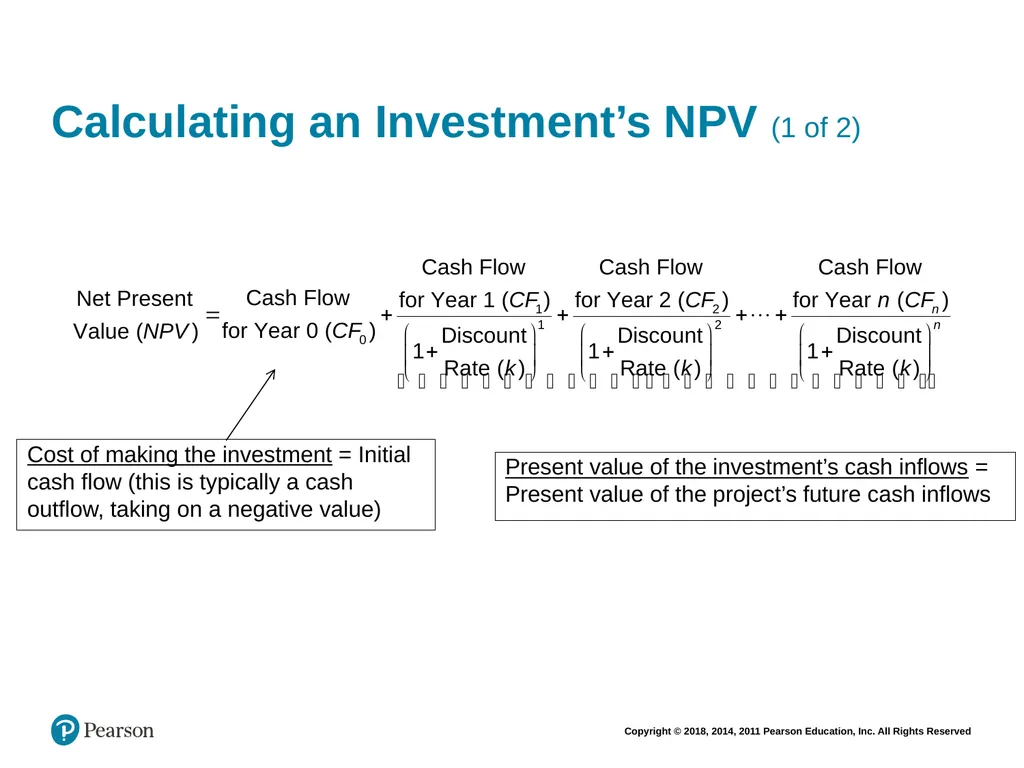
slide12. Calculating an Investment’s NPV (1 of 2) Cost of making the investment = Initial cash flow (this is typically a cash outflow, taking on a negative value) Present value of the investment’s cash inflows = Present value of the project’s future cash inflows<br>
slide13. Calculating an Investment’s NPV (2 of 2) NPV reflects the first three principles: The project’s cash flows are used to measure the benefits the project provides (Principle 3, cash flows are the source of value), cash flows are discounted back to the present (Principle 1, money has time value), and the discount rate used to discount the cash flows back to the present reflects the risk in the future cash flows (Principle 2, There is a risk-return tradeoff)<br>
slide14. CHECKPOINT 11.1: CHECK YOURSELF Calculating the NPV<br>
slide15. The Problem Saber Electronics provides specialty manufacturing services to defense contractors located in the Seattle, Washington area. The initial outlay is $3 million and, management estimates that the firm might generate cash flows for years one through five equal to $500,000; $750,000; $1,500,000; $2,000,000; and $2,000,000. Saber uses a 20% discount rate for projects of this type. Is this a good investment opportunity?<br>
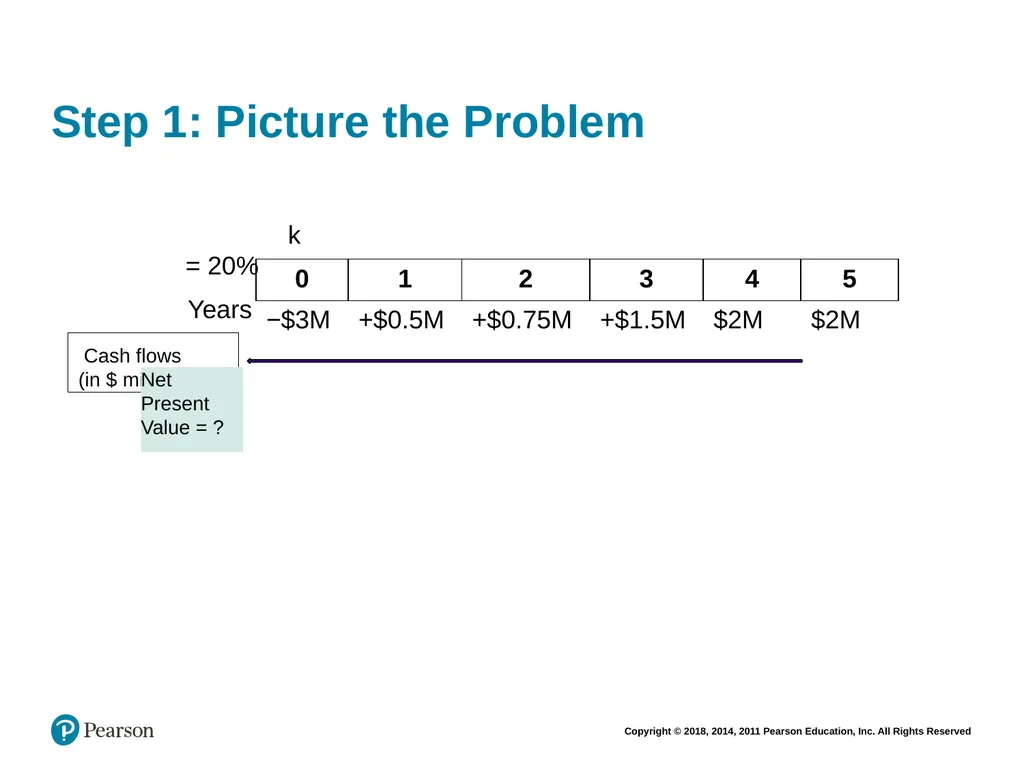
slide16. Step 1: Picture the Problem k = 20%
Years Cash flows
(in $ millions) Net
Present
Value = ?<br>
slide17. Step 2: Decide on a Solution Strategy We need to analyze if this is a good investment opportunity. We can do that by computing the Net Present Value (NPV), which requires computing the present value of all cash flows.
We can compute the NPV by using a mathematical formula, a financial calculator or a spreadsheet.<br>
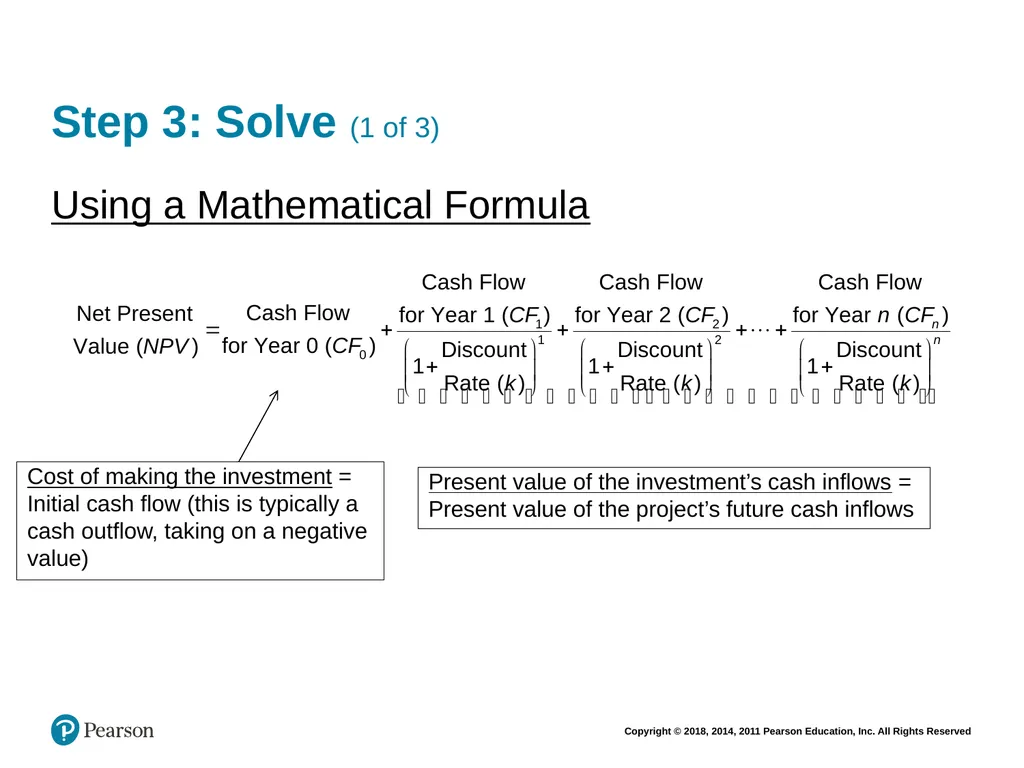
slide18. Step 3: Solve (1 of 3) Using a Mathematical Formula Cost of making the investment = Initial cash flow (this is typically a cash outflow, taking on a negative value) Present value of the investment’s cash inflows = Present value of the project’s future cash inflows<br>
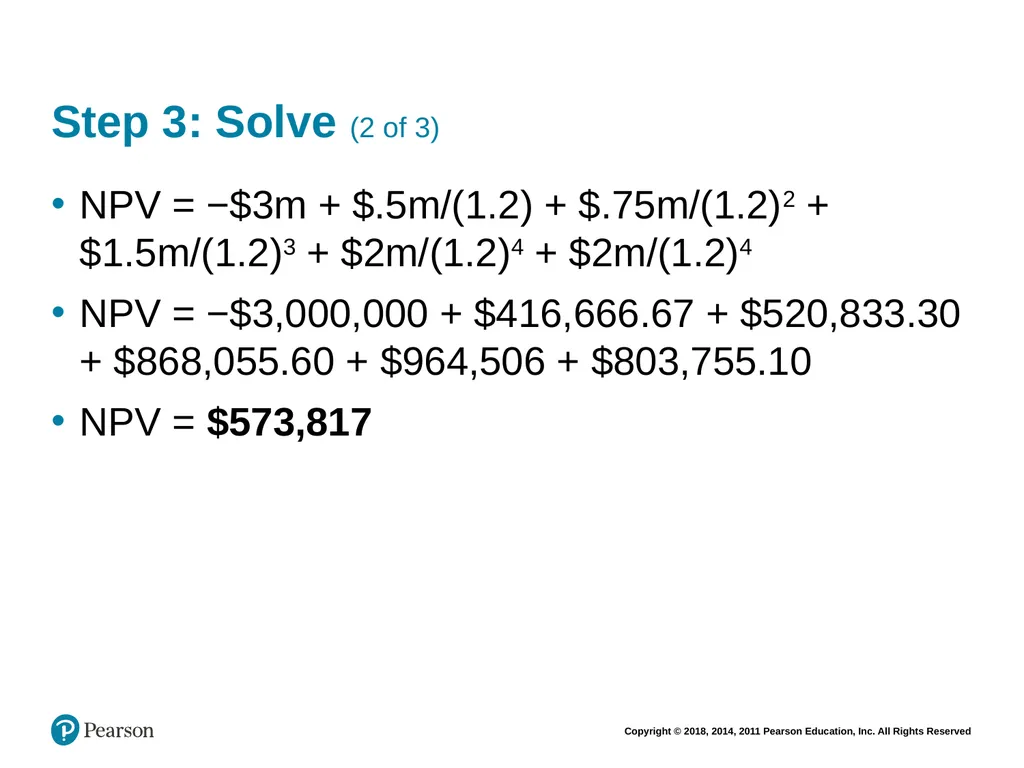
slide19. Step 3: Solve (2 of 3) NPV = −$3m + $.5m/(1.2) + $.75m/(1.2)2 + $1.5m/(1.2)3 + $2m/(1.2)4 + $2m/(1.2)4
NPV = −$3,000,000 + $416,666.67 + $520,833.30 + $868,055.60 + $964,506 + $803,755.10
NPV = $573,817<br>
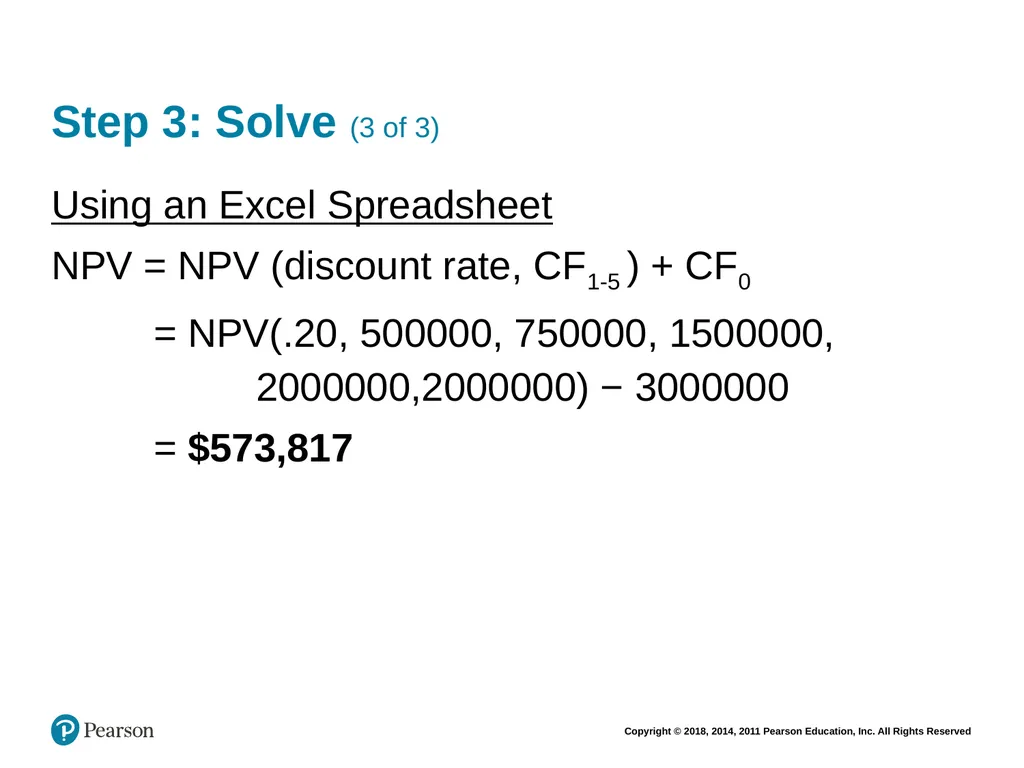
slide20. Step 3: Solve (3 of 3) Using an Excel Spreadsheet
NPV = NPV (discount rate, CF1-5 ) + CF0
= NPV(.20, 500000, 750000, 1500000, 2000000,2000000) − 3000000
= $573,817<br>
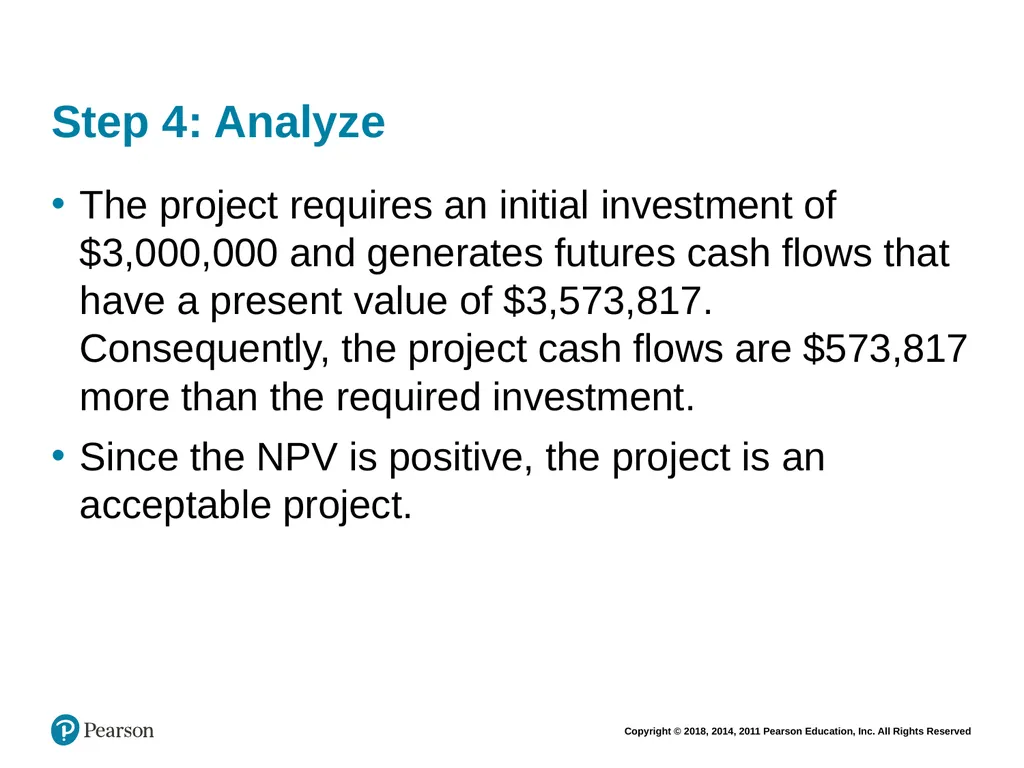
slide21. Step 4: Analyze The project requires an initial investment of $3,000,000 and generates futures cash flows that have a present value of $3,573,817. Consequently, the project cash flows are $573,817 more than the required investment.
Since the NPV is positive, the project is an acceptable project.<br>
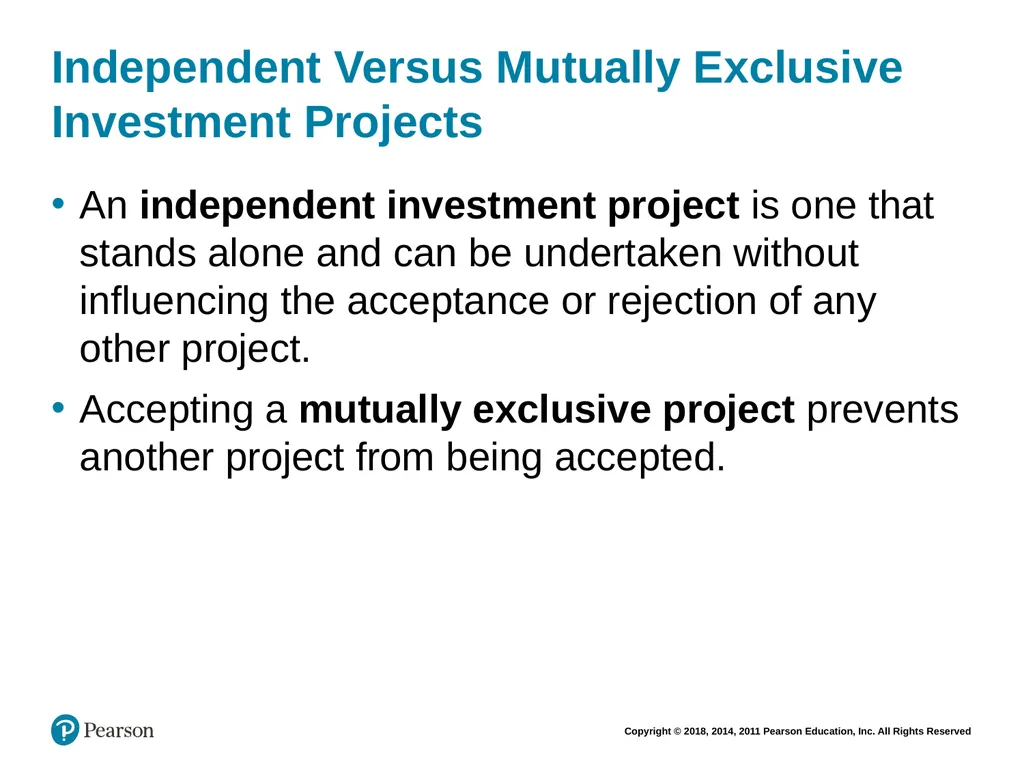
slide22. Independent Versus Mutually Exclusive Investment Projects An independent investment project is one that stands alone and can be undertaken without influencing the acceptance or rejection of any other project.
Accepting a mutually exclusive project prevents another project from being accepted.<br>
slide23. Evaluating an Independent Investment Opportunity It requires two steps to evaluate:
Calculate NPV;
Accept the project if NPV is positive and reject if it is negative.<br>
slide24. Evaluating Mutually Exclusive Investment Opportunities Following are two situations where firm is faced with mutually exclusive projects:
Substitutes – When a firm is analyzing two or more alternative investments, and each performs the same function.
Firm Constraints – Firm faces constraints such as limited managerial time or limited financial capital that limit its ability to invest in every positive NPV project.<br>
slide25. Choosing Between Mutually Exclusive Investments (1 of 2) If mutually exclusive investments have equal lives, we will calculate the NPVs and choose the one with the higher NPV.
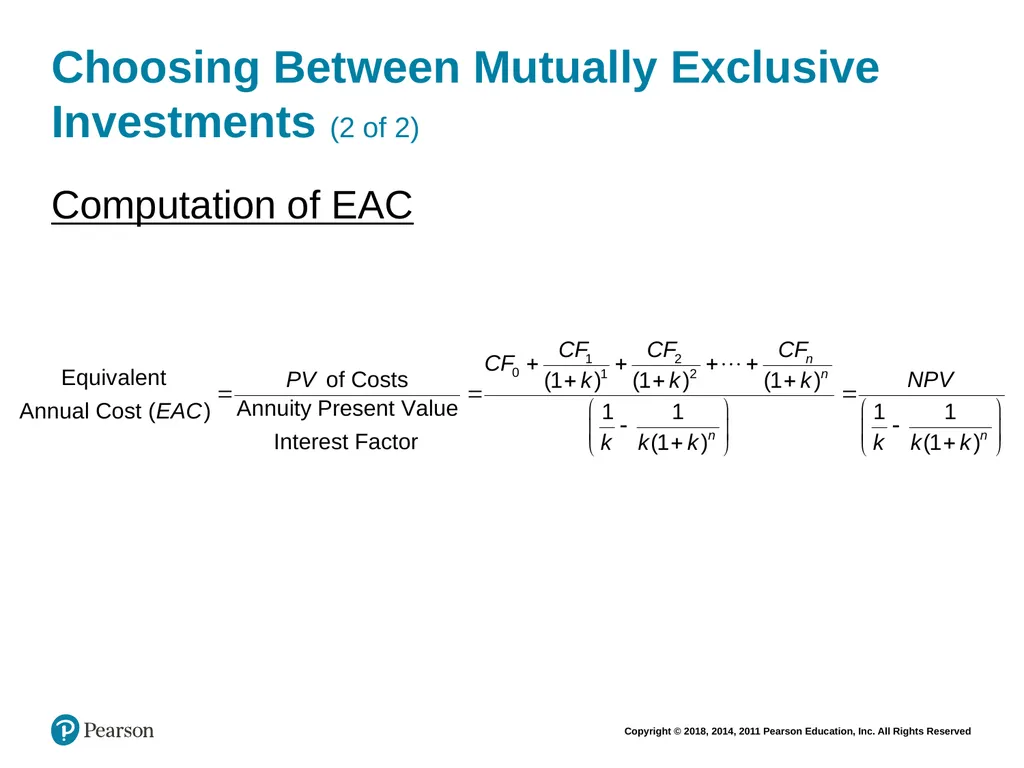
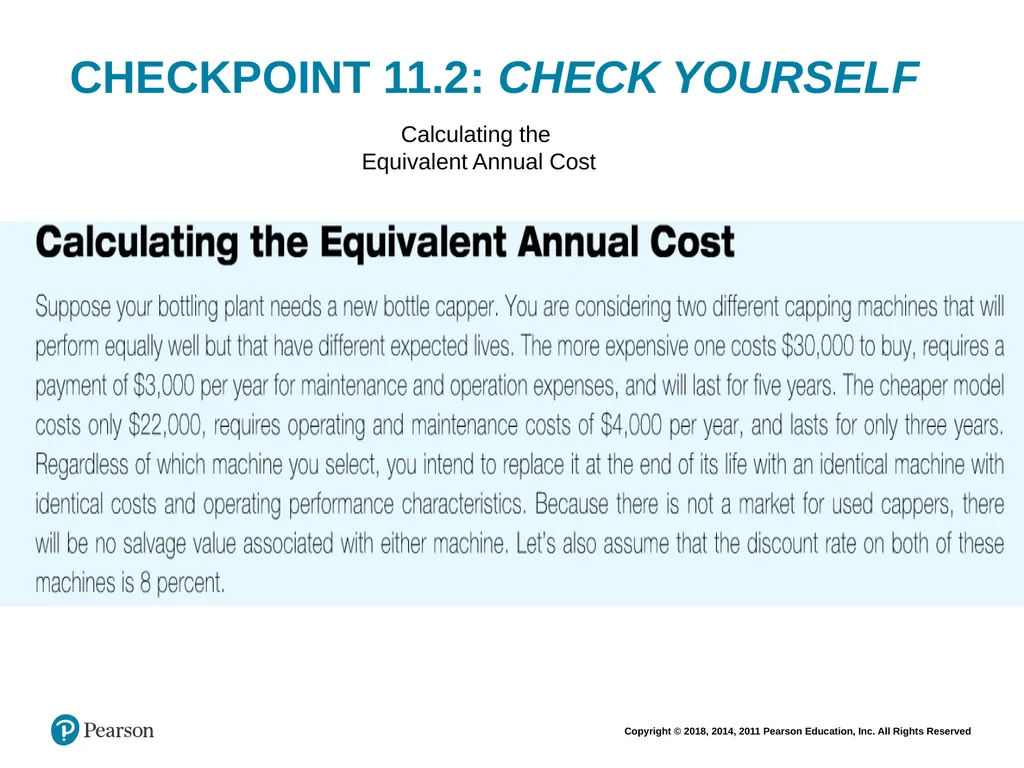
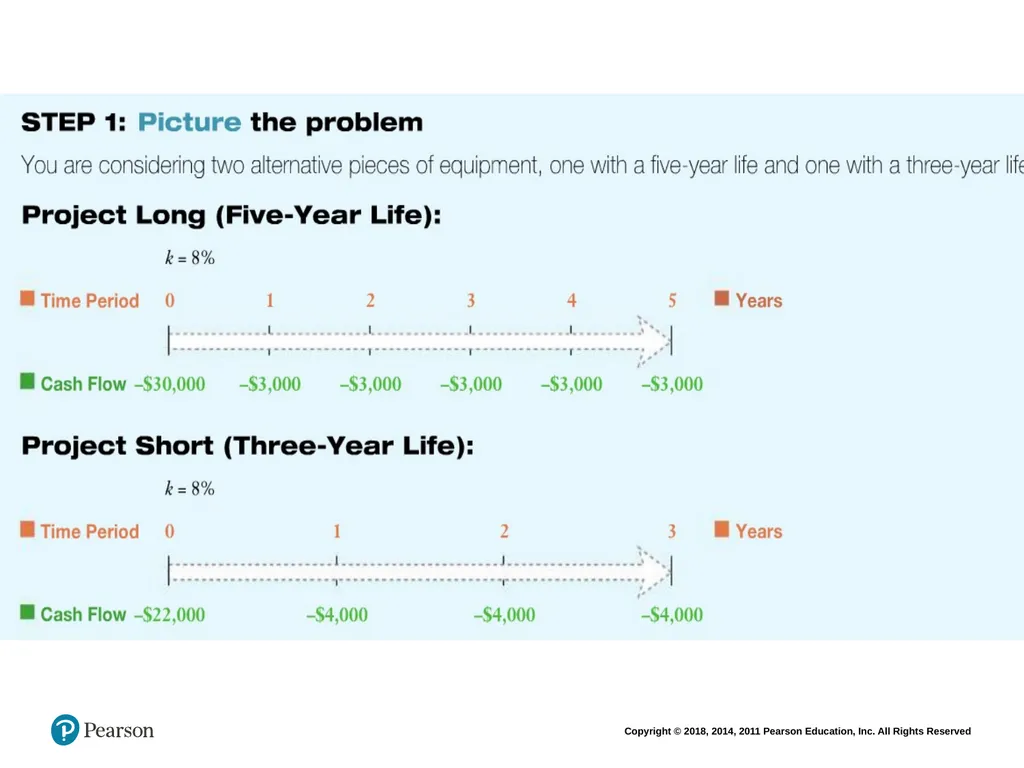
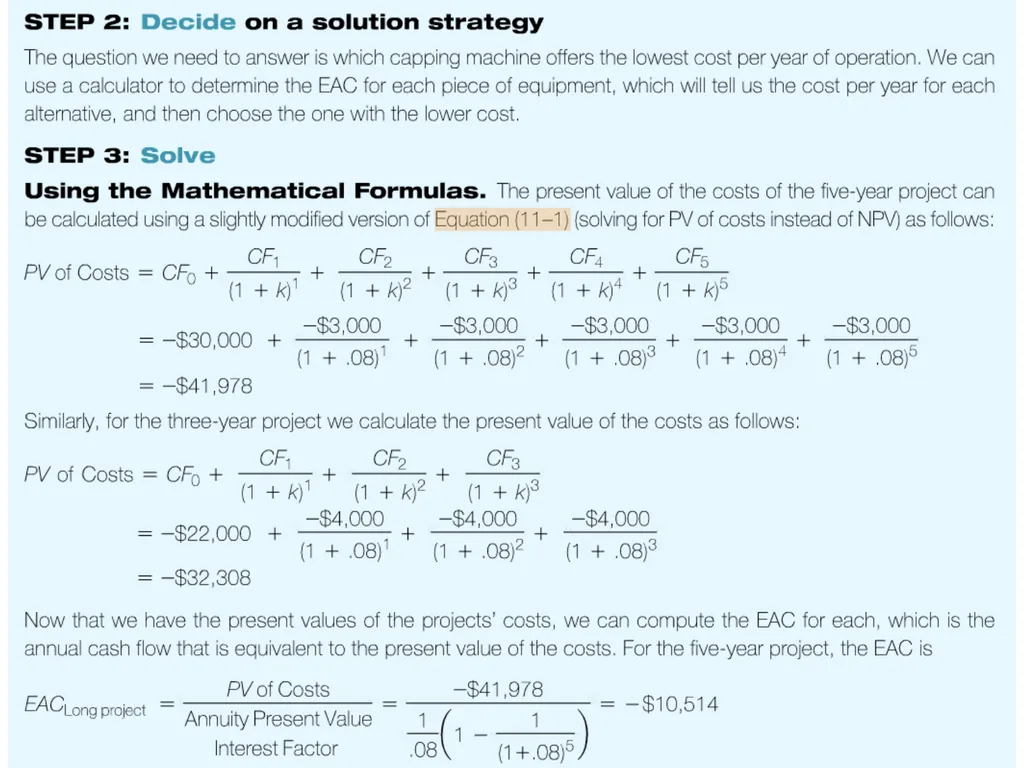
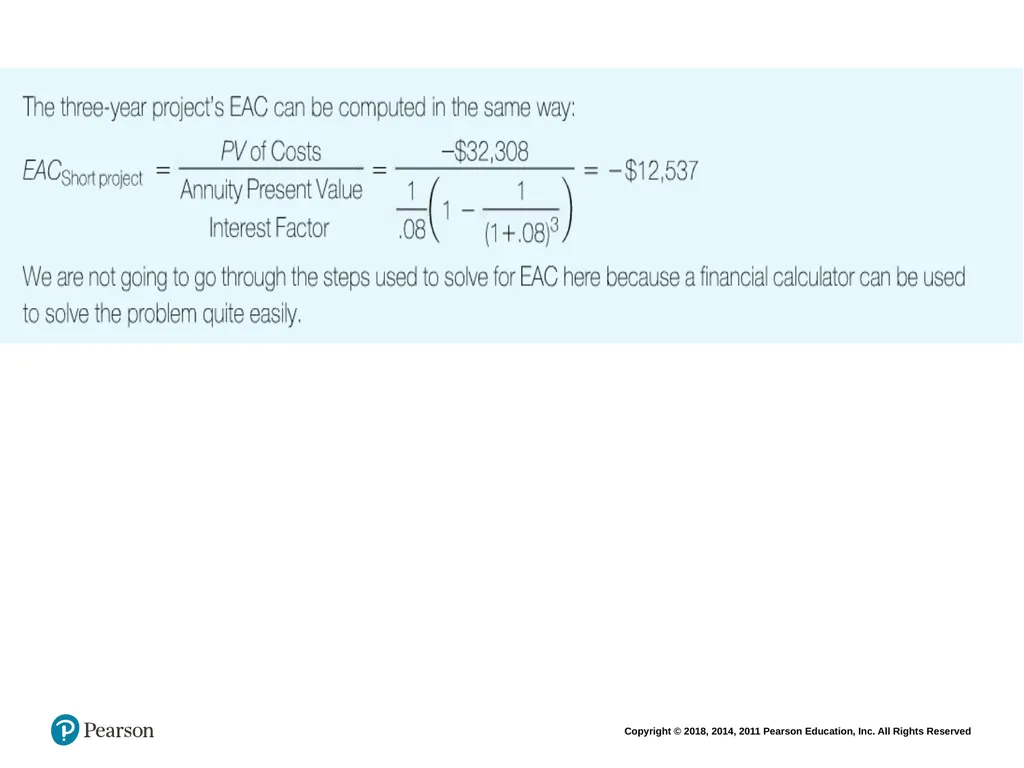
If mutually exclusive investments do not have equal lives, we must calculate the Equivalent Annual Cost (EAC). The EAC technique provides an estimate of the annual cost of owning and operating the investment over its lifetime. We will then select the one that has a lower EAC.<br>
slide26. Choosing Between Mutually Exclusive Investments (2 of 2) Computation of EAC<br>
slide27. CHECKPOINT 11.2: CHECK YOURSELF Calculating the
Equivalent Annual Cost<br>
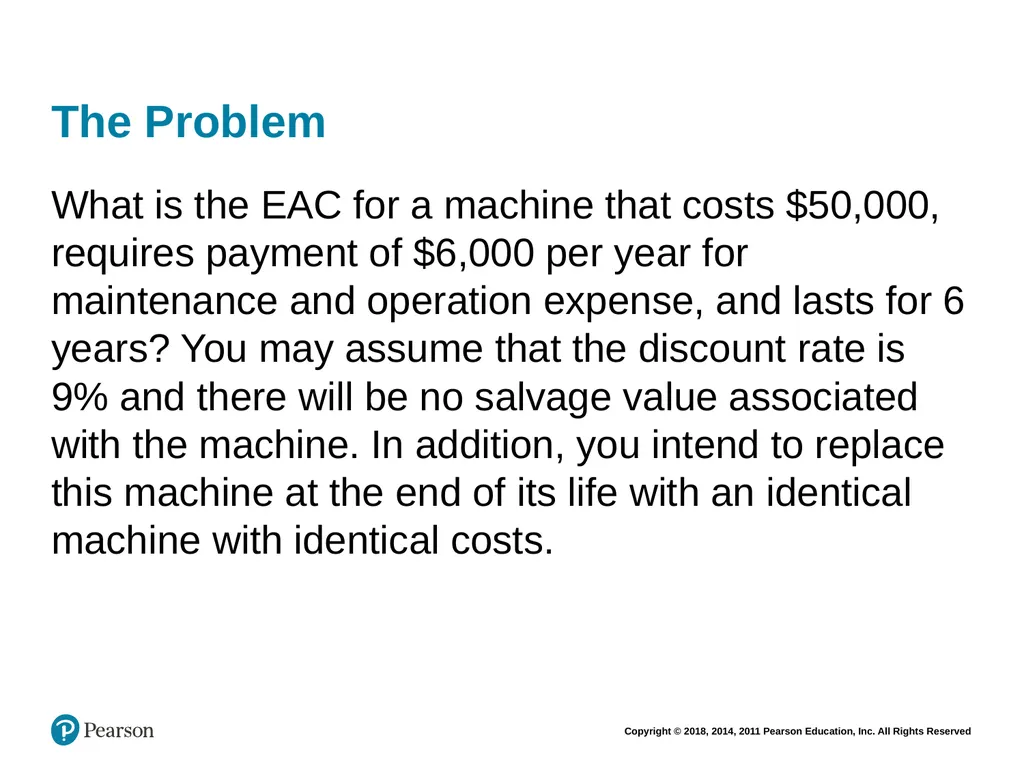
slide31. The Problem What is the EAC for a machine that costs $50,000, requires payment of $6,000 per year for maintenance and operation expense, and lasts for 6 years? You may assume that the discount rate is 9% and there will be no salvage value associated with the machine. In addition, you intend to replace this machine at the end of its life with an identical machine with identical costs.<br>
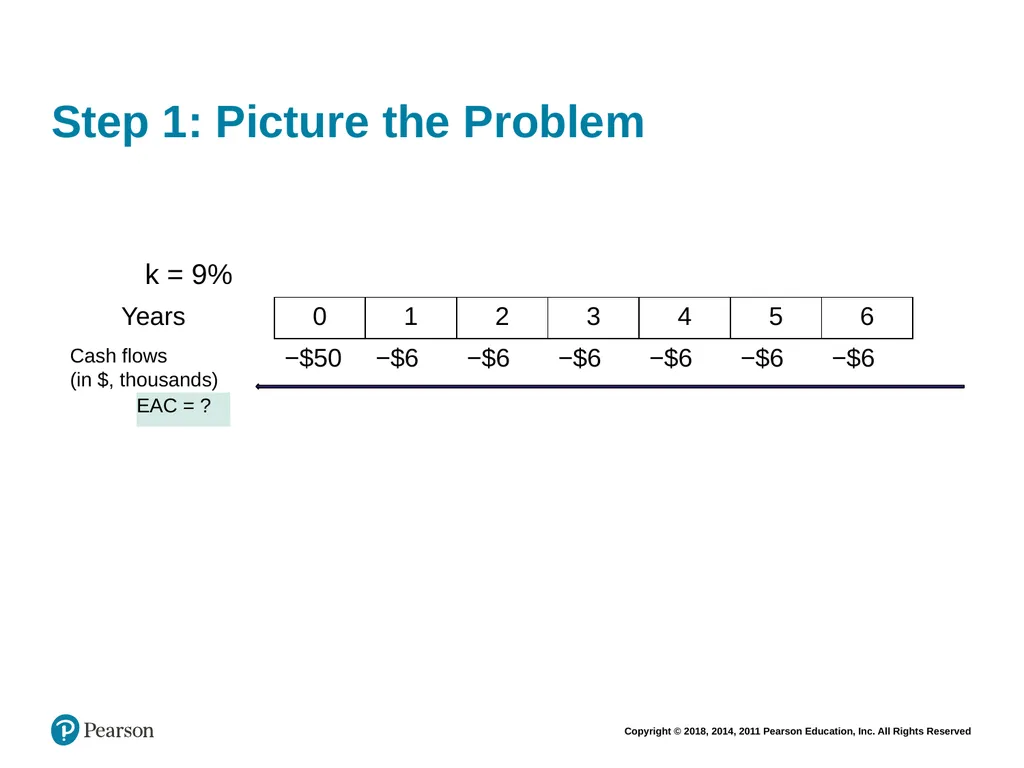
slide32. Step 1: Picture the Problem k = 9% Cash flows (in $, thousands) EAC = ?<br>
slide33. Step 2: Decide on a Solution Strategy Here we need to calculate the EAC, which will tell us the annual cost for a machine that lasts 6 years.
EAC can be computed using a mathematical formula or financial calculator.<br>
slide34. Step 3: Solve (1 of 5) Using a Mathematical Formula
It requires 2 steps:
Computation of NPV
Computation of EAC<br>
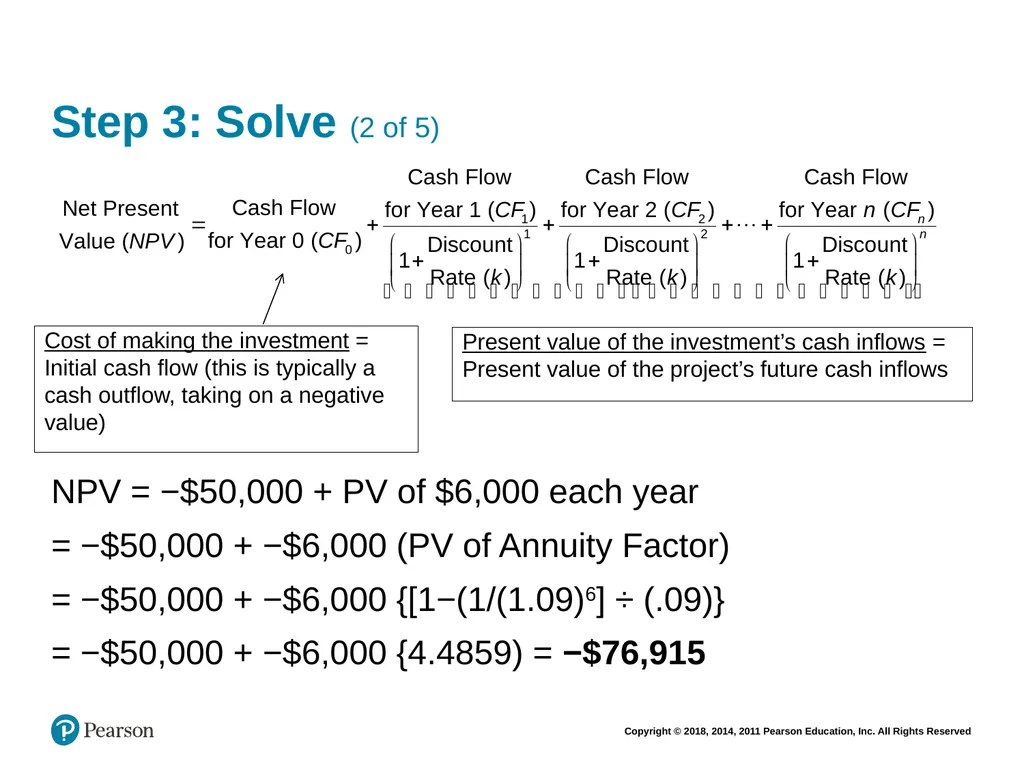
slide35. Step 3: Solve (2 of 5) Cost of making the investment = Initial cash flow (this is typically a cash outflow, taking on a negative value) Present value of the investment’s cash inflows = Present value of the project’s future cash inflows NPV = −$50,000 + PV of $6,000 each year
= −$50,000 + −$6,000 (PV of Annuity Factor)
= −$50,000 + −$6,000 {[1−(1/(1.09)6] ÷ (.09)}
= −$50,000 + −$6,000 {4.4859) = −$76,915<br>
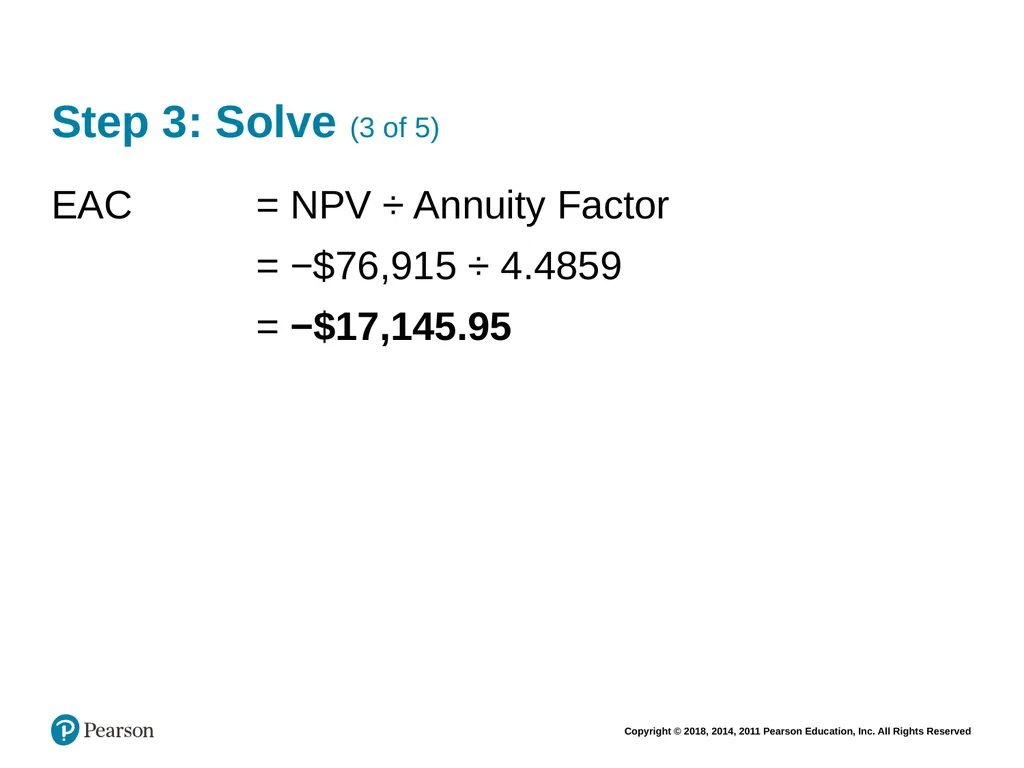
slide36. Step 3: Solve (3 of 5) EAC = NPV ÷ Annuity Factor
= −$76,915 ÷ 4.4859
= −$17,145.95<br>
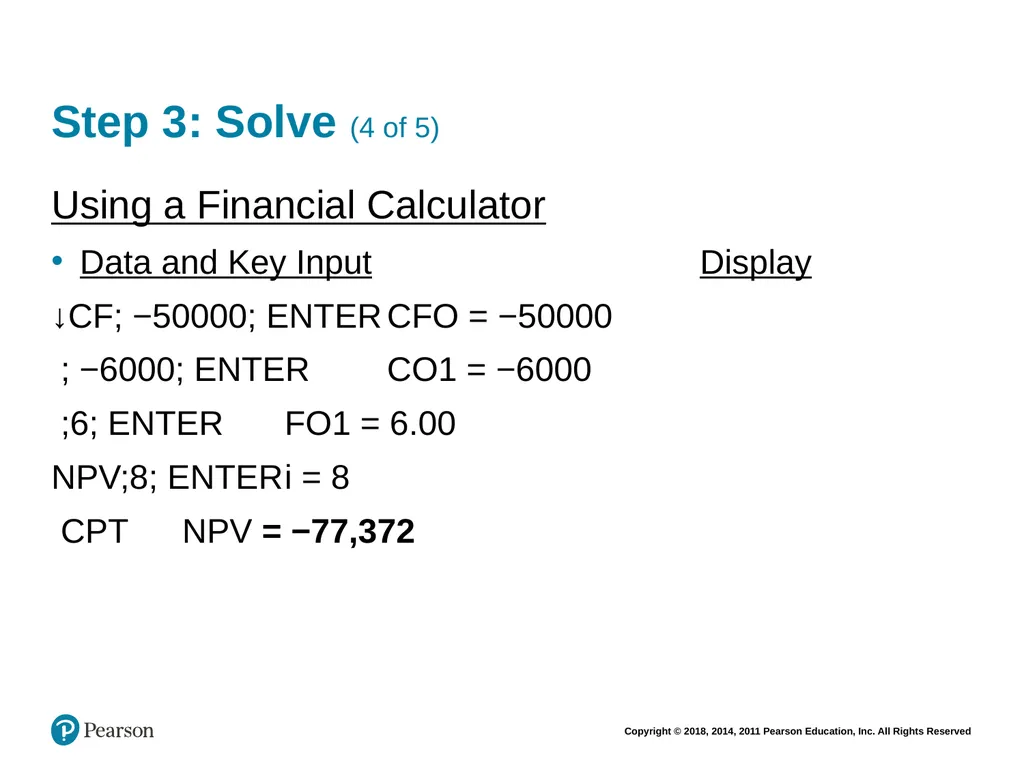
slide37. Step 3: Solve (4 of 5) Using a Financial Calculator
Data and Key Input Display
↓CF; −50000; ENTER CFO = −50000
; −6000; ENTER CO1 = −6000
;6; ENTER FO1 = 6.00
NPV;8; ENTER i = 8
CPT NPV = −77,372<br>
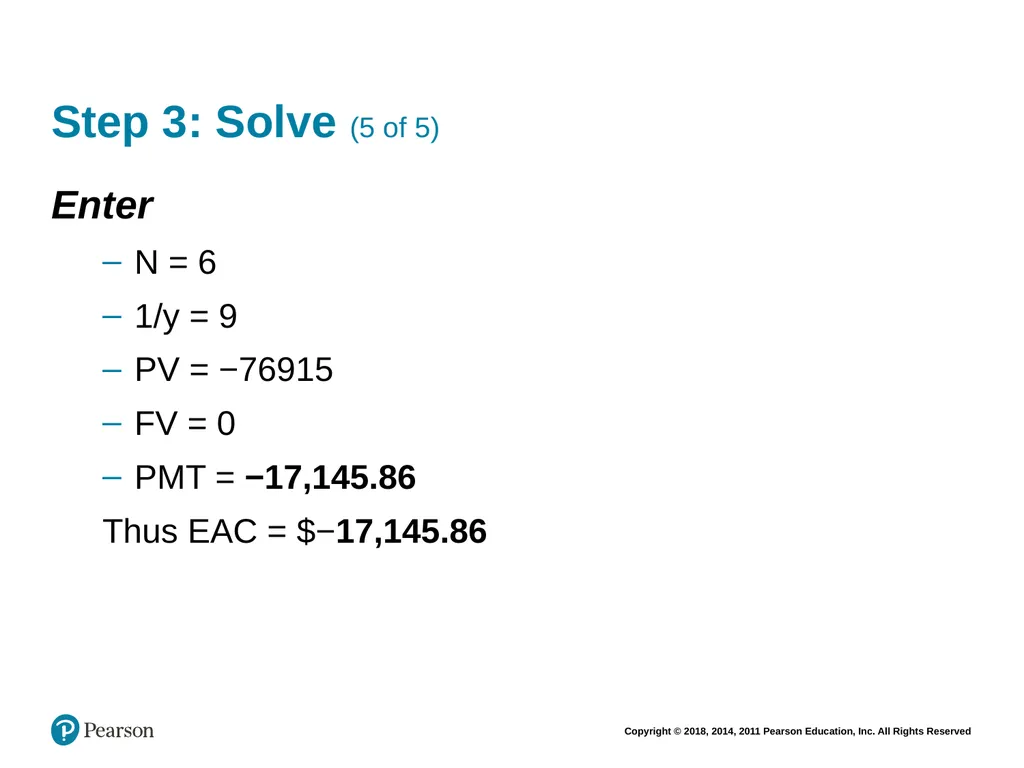
slide38. Step 3: Solve (5 of 5) Enter
N = 6
1/y = 9
PV = −76915
FV = 0
PMT = −17,145.86
Thus EAC = $−17,145.86<br>
slide39. Step 4: Analyze EAC indicates the annual cost that is adjusted for time value of money. Here EAC is equal to $17,145.86.<br>
slide40. 11.3 OTHER INVESTMENT CRITERIA<br>
slide41. Profitability Index (1 of 2) The profitability index (PI) is a cost-benefit ratio equal to the present value of an investment’s future cash flows divided by its initial cost.<br>
slide42. Profitability Index (2 of 2) Decision Criteria:
If PI is greater than one, the NPV will be positive and the investment should be accepted
When PI is less than one, which indicates a bad investment, NPV will be negative and the project should be rejected.<br>
slide43. CHECKPOINT 11.3: CHECK YOURSELF Calculating the Profitability Index<br>
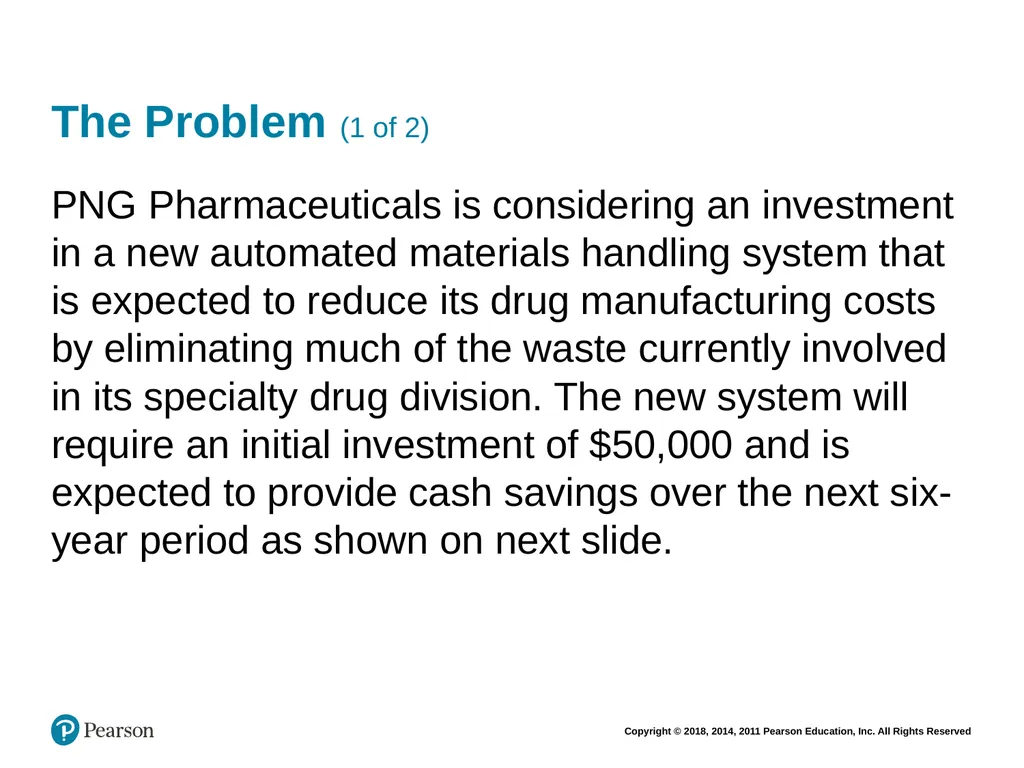
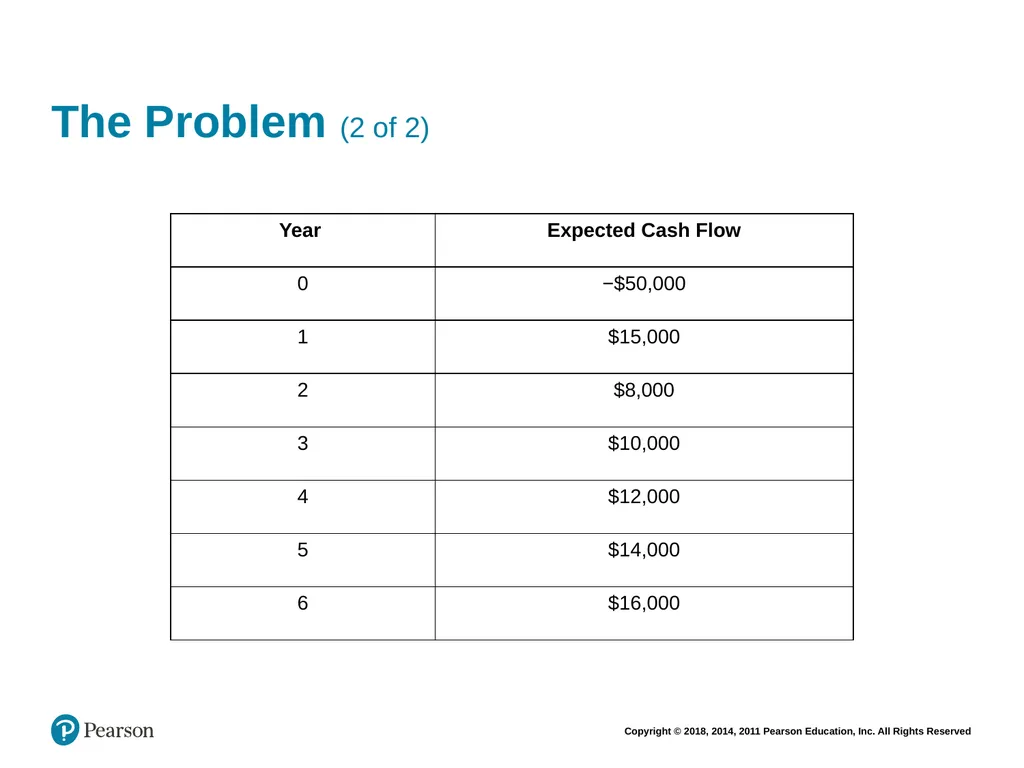
slide44. The Problem (1 of 2) PNG Pharmaceuticals is considering an investment in a new automated materials handling system that is expected to reduce its drug manufacturing costs by eliminating much of the waste currently involved in its specialty drug division. The new system will require an initial investment of $50,000 and is expected to provide cash savings over the next six-year period as shown on next slide.<br>
slide45. The Problem (2 of 2)<br>
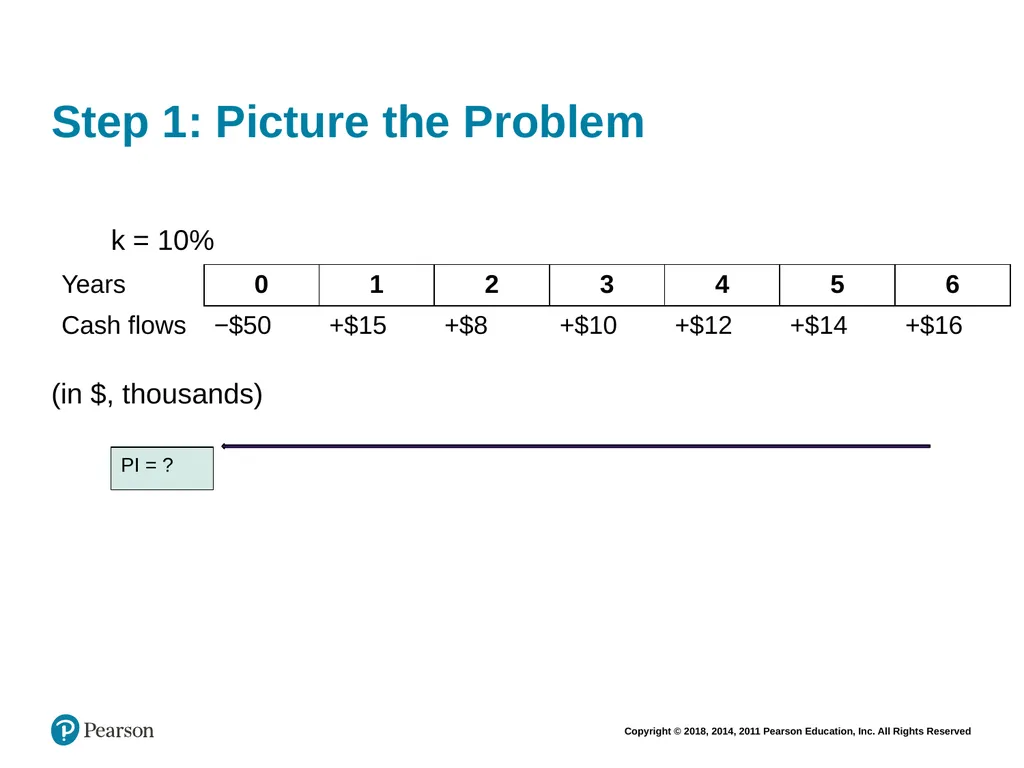
slide46. Step 1: Picture the Problem k = 10% (in $, thousands) PI = ?<br>
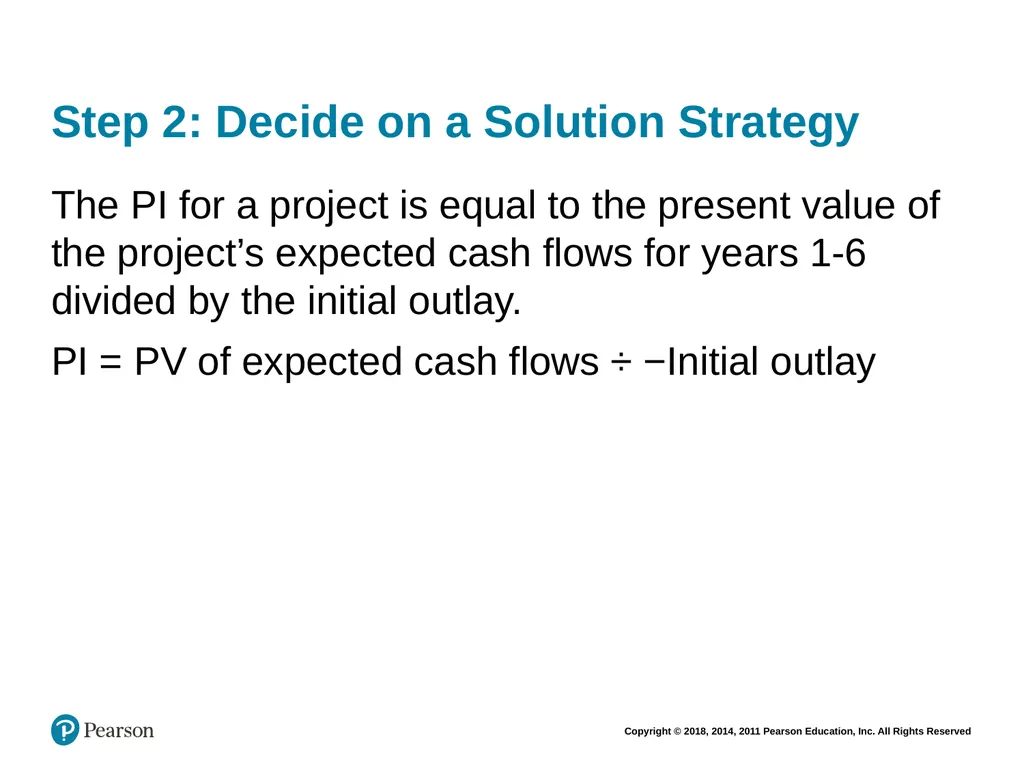
slide47. Step 2: Decide on a Solution Strategy The PI for a project is equal to the present value of the project’s expected cash flows for years 1-6 divided by the initial outlay.
PI = PV of expected cash flows ÷ −Initial outlay<br>
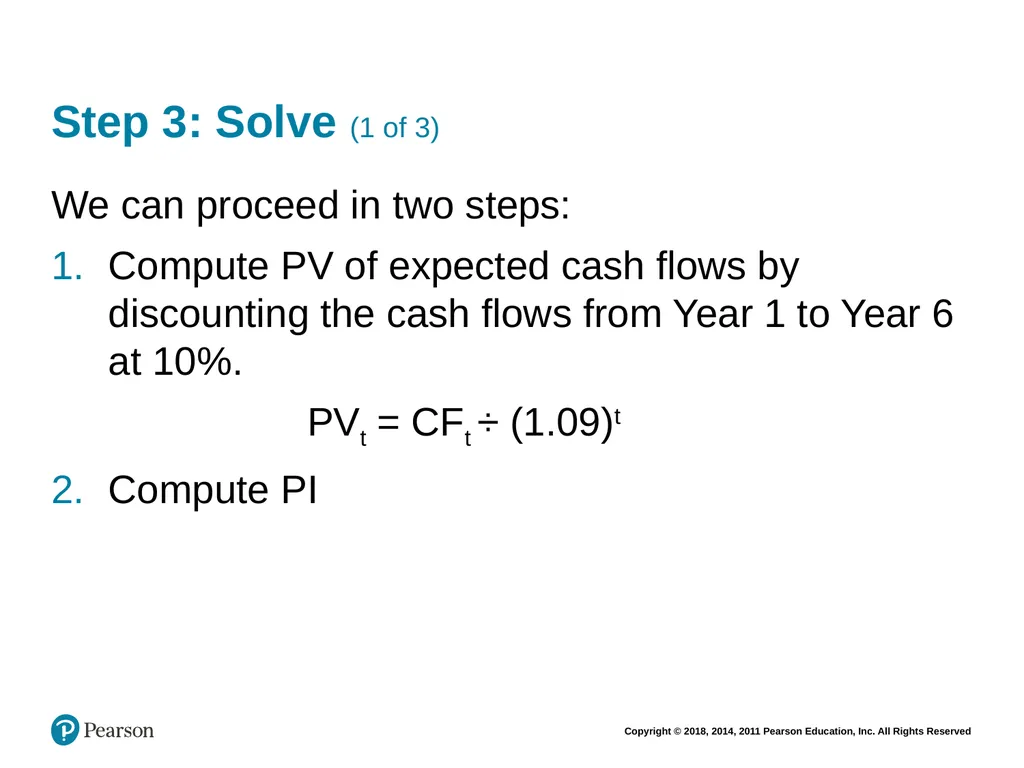
slide48. Step 3: Solve (1 of 3) We can proceed in two steps:
Compute PV of expected cash flows by discounting the cash flows from Year 1 to Year 6 at 10%.
PVt = CFt ÷ (1.09)t
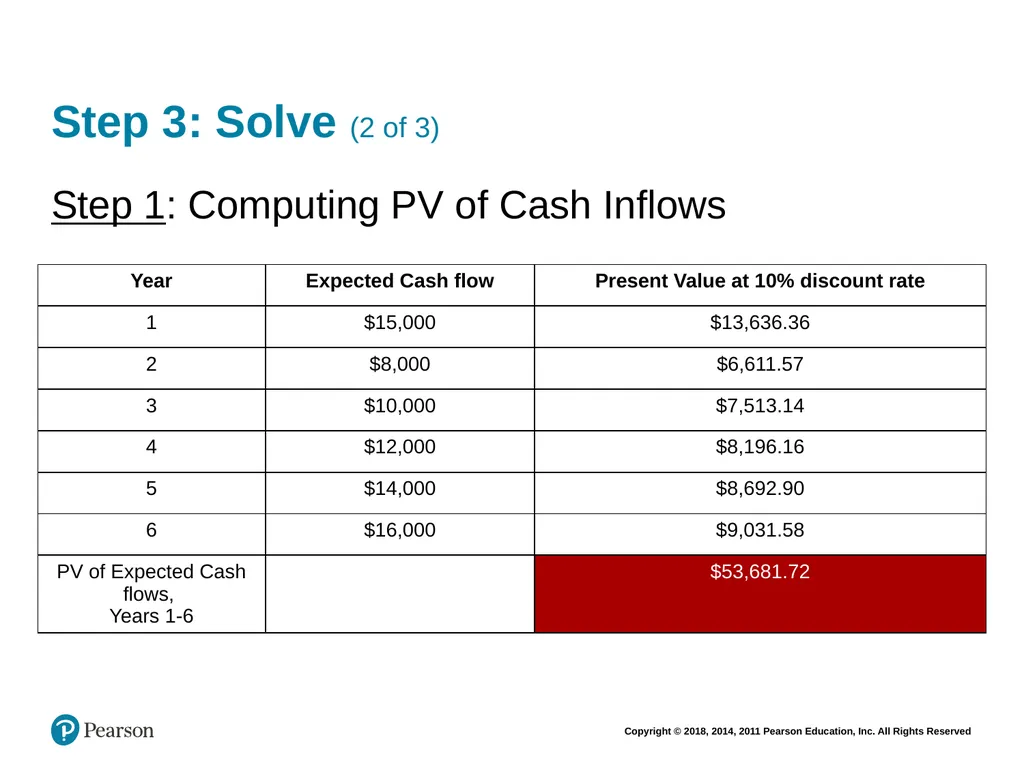
Compute PI<br>
slide49. Step 3: Solve (2 of 3) Step 1: Computing PV of Cash Inflows<br>
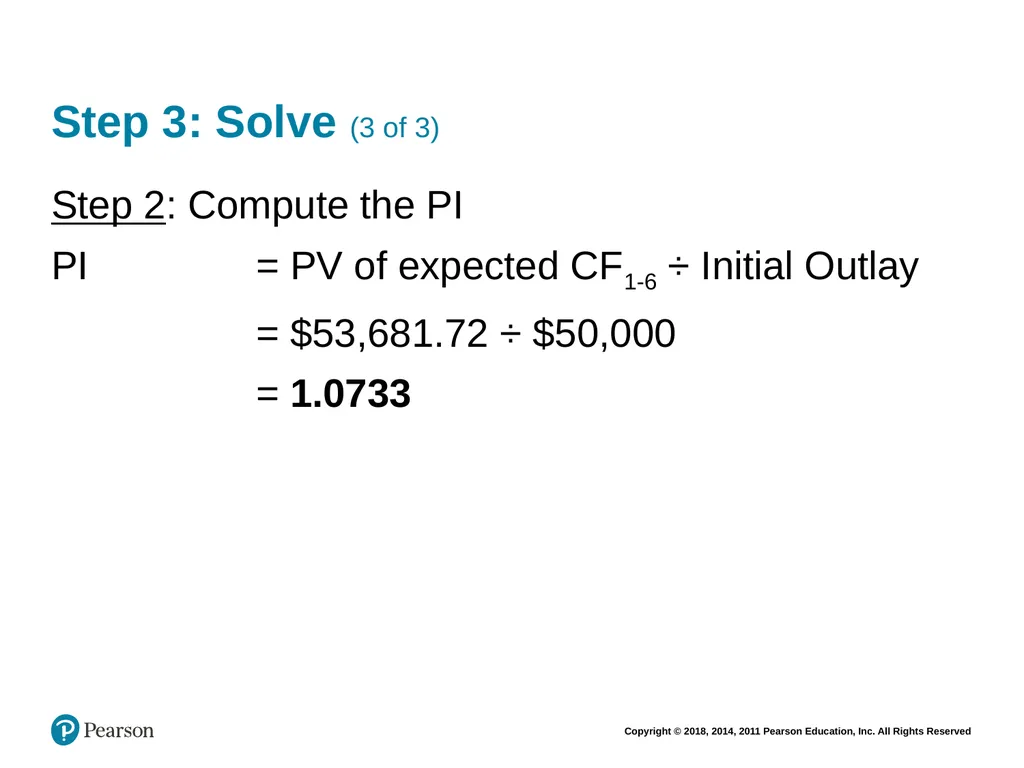
slide50. Step 3: Solve (3 of 3) Step 2: Compute the PI
PI = PV of expected CF1-6 ÷ Initial Outlay
= $53,681.72 ÷ $50,000
= 1.0733<br>
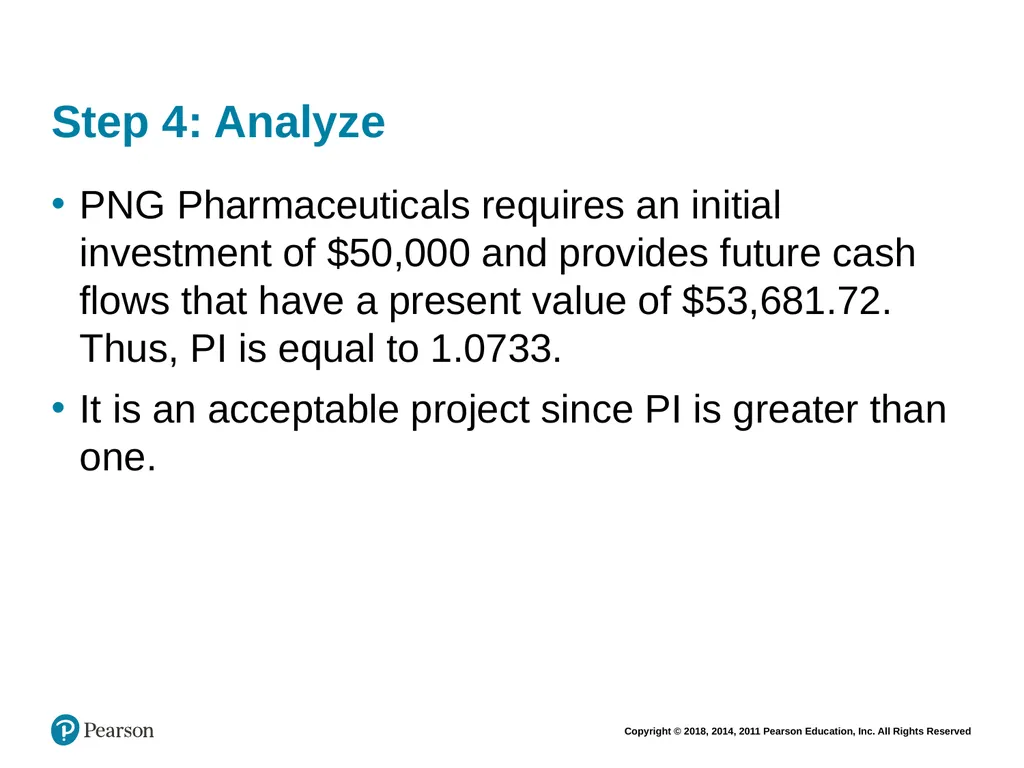
slide51. Step 4: Analyze PNG Pharmaceuticals requires an initial investment of $50,000 and provides future cash flows that have a present value of $53,681.72. Thus, PI is equal to 1.0733.
It is an acceptable project since PI is greater than one.<br>
slide52. Internal Rate of Return (1 of 3) The internal rate of return (IRR) of an investment is analogous to the yield to maturity (YTM) on a bond as defined in Chapter 9. Specifically, the IRR is the discount rate that results in a zero NPV for the project.<br>
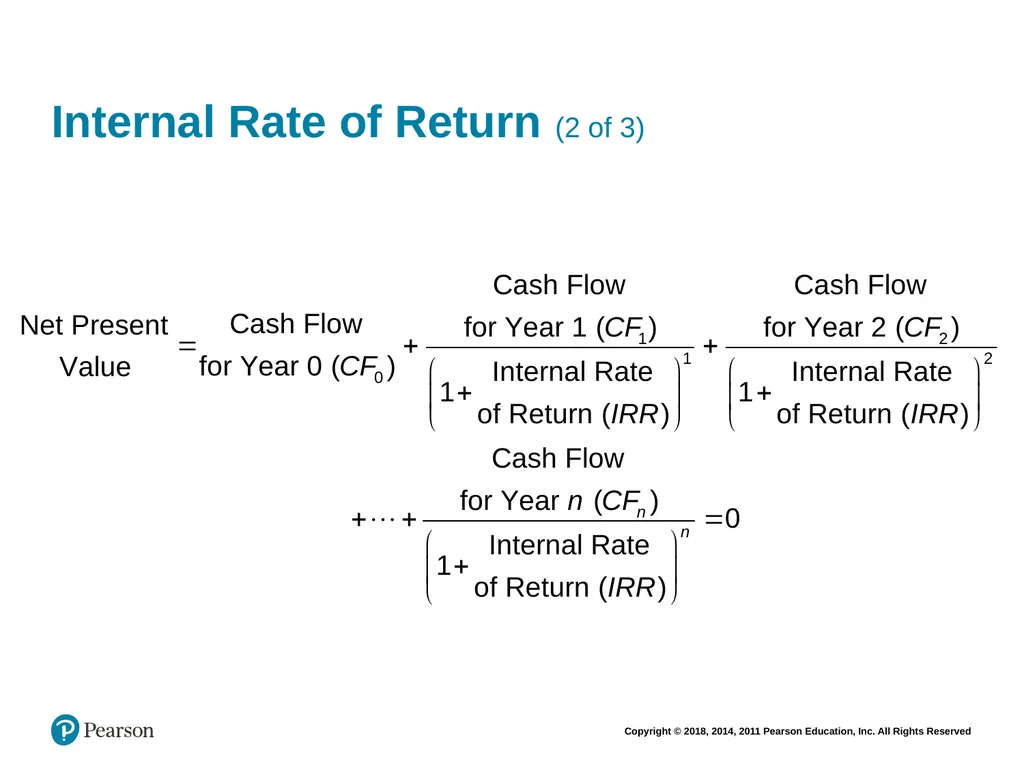
slide53. Internal Rate of Return (2 of 3)<br>
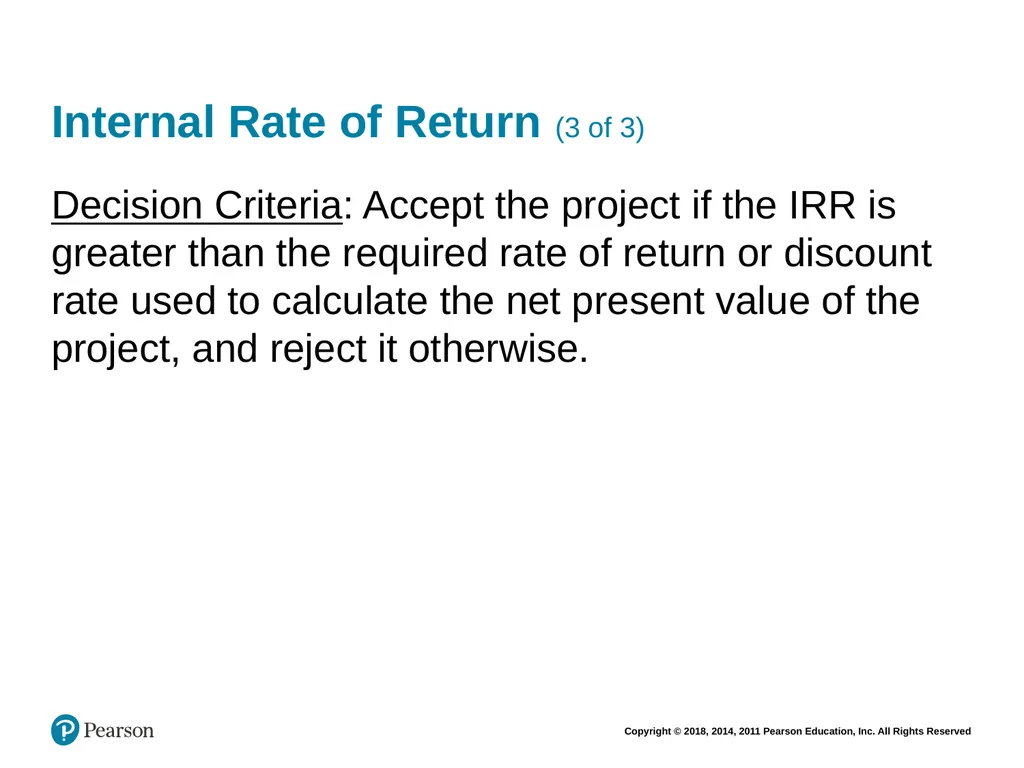
slide54. Internal Rate of Return (3 of 3) Decision Criteria: Accept the project if the IRR is greater than the required rate of return or discount rate used to calculate the net present value of the project, and reject it otherwise.<br>
slide55. CHECKPOINT 11.4: CHECK YOURSELF Calculating the IRR<br>
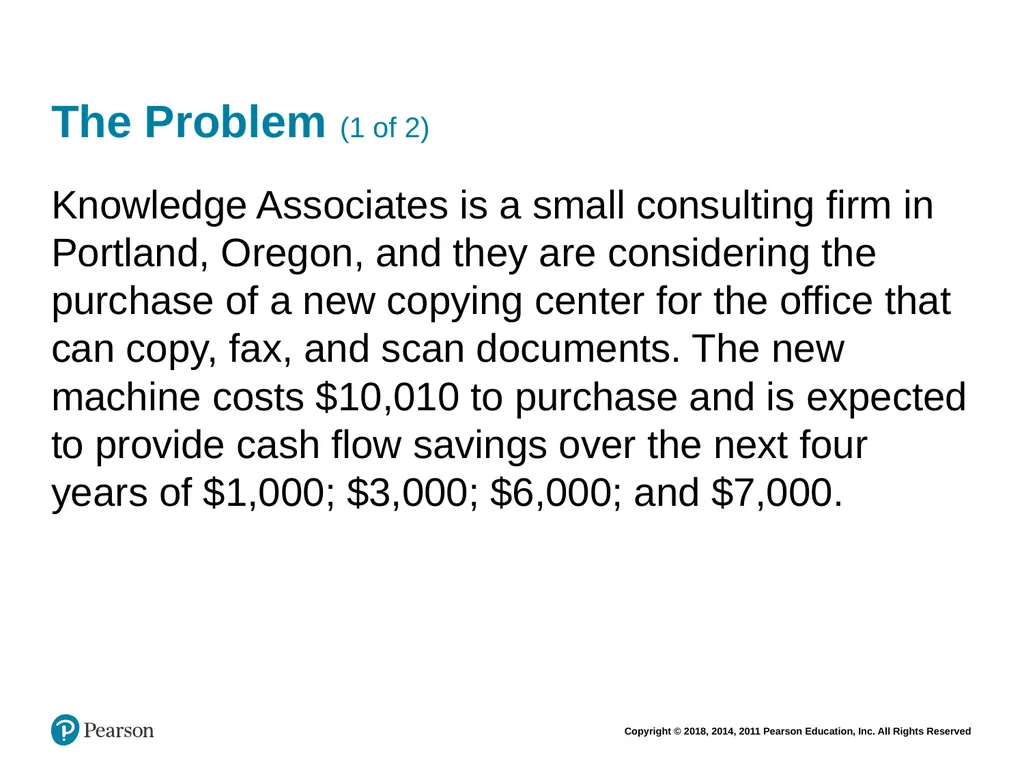
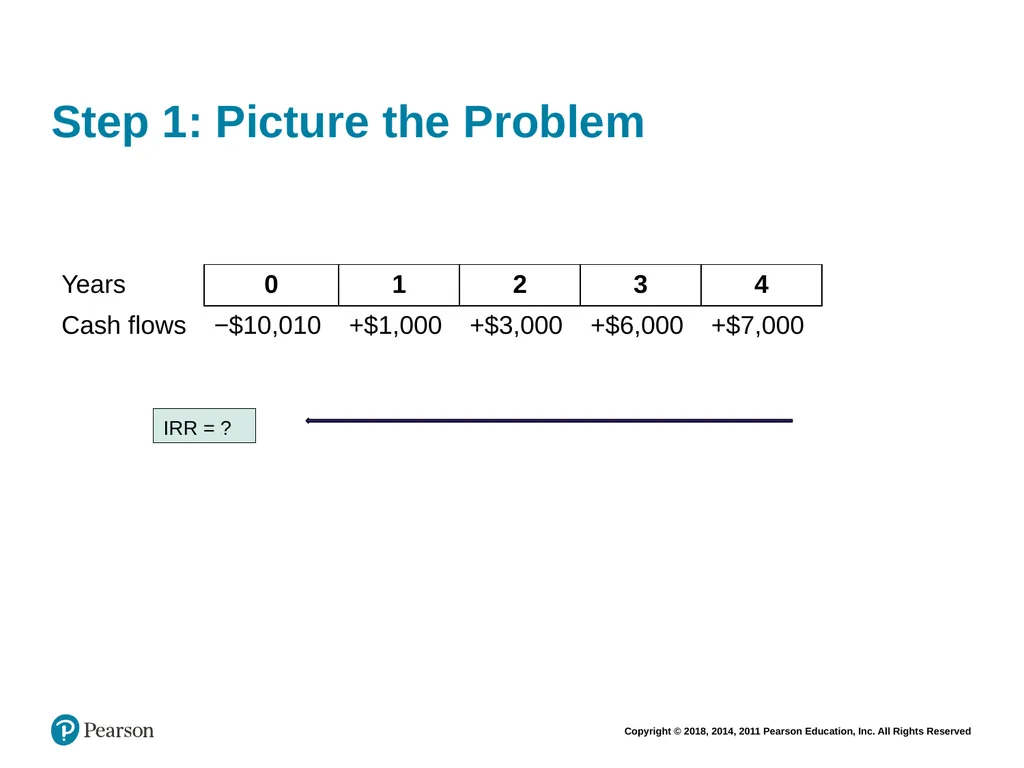
slide56. The Problem (1 of 2) Knowledge Associates is a small consulting firm in Portland, Oregon, and they are considering the purchase of a new copying center for the office that can copy, fax, and scan documents. The new machine costs $10,010 to purchase and is expected to provide cash flow savings over the next four years of $1,000; $3,000; $6,000; and $7,000.<br>
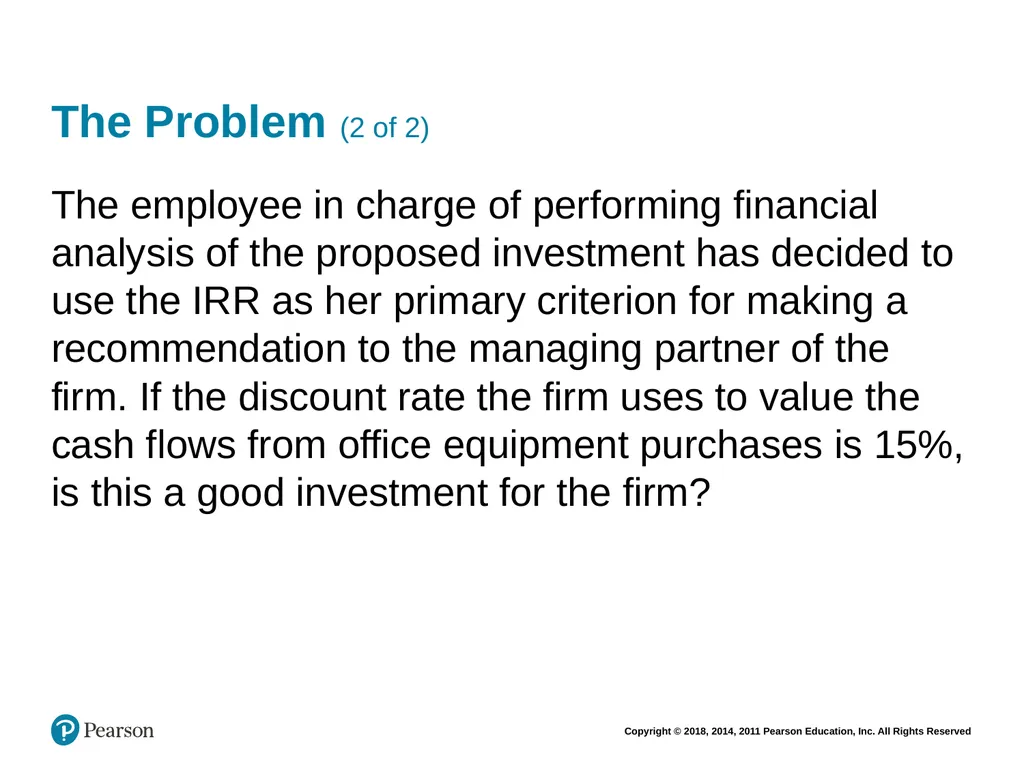
slide57. The Problem (2 of 2) The employee in charge of performing financial analysis of the proposed investment has decided to use the IRR as her primary criterion for making a recommendation to the managing partner of the firm. If the discount rate the firm uses to value the cash flows from office equipment purchases is 15%, is this a good investment for the firm?<br>
slide58. Step 1: Picture the Problem IRR = ?<br>
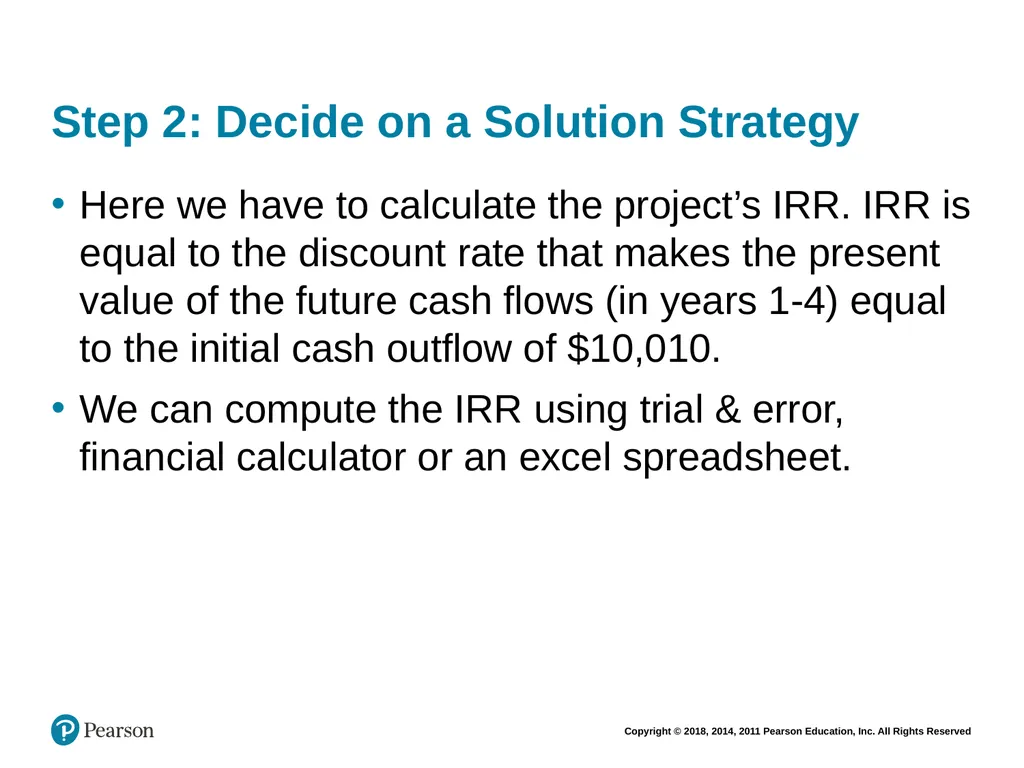
slide59. Step 2: Decide on a Solution Strategy Here we have to calculate the project’s IRR. IRR is equal to the discount rate that makes the present value of the future cash flows (in years 1-4) equal to the initial cash outflow of $10,010.
We can compute the IRR using trial & error, financial calculator or an excel spreadsheet.<br>
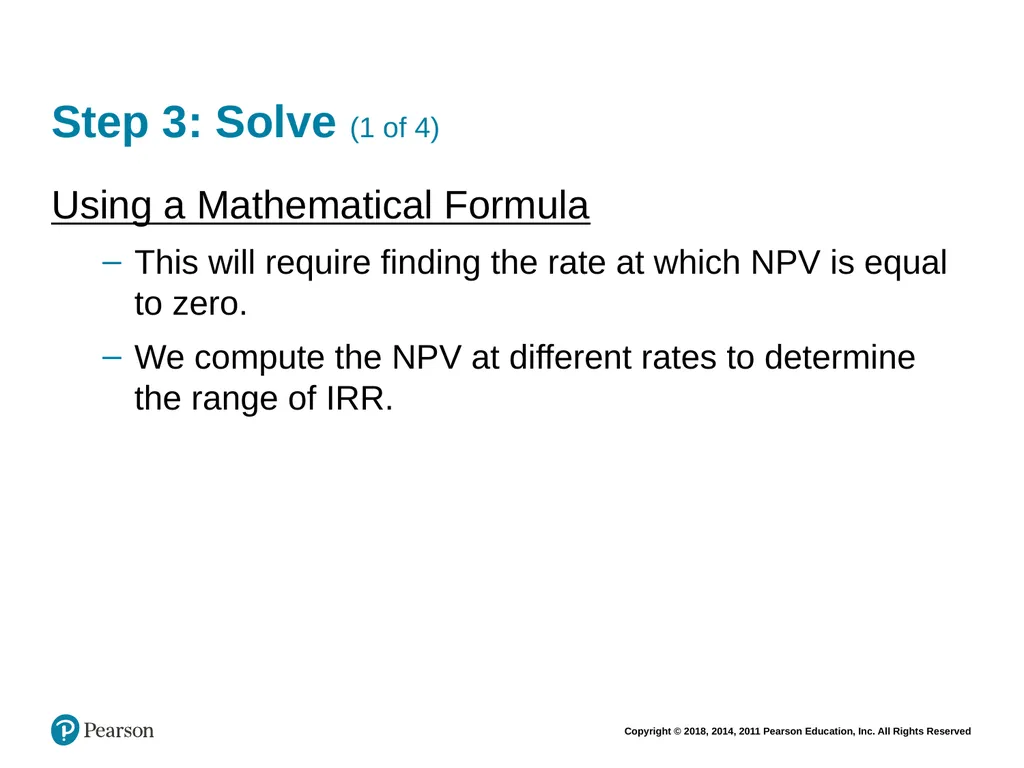
slide60. Step 3: Solve (1 of 4) Using a Mathematical Formula
This will require finding the rate at which NPV is equal to zero.
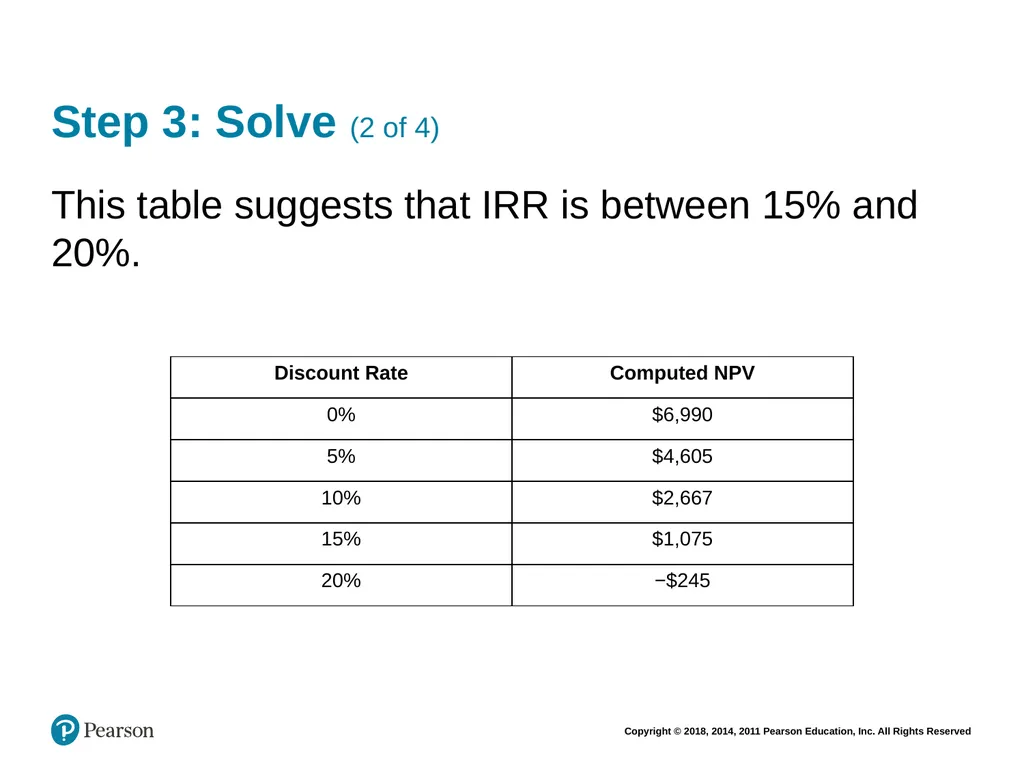
We compute the NPV at different rates to determine the range of IRR.<br>
slide61. Step 3: Solve (2 of 4) This table suggests that IRR is between 15% and 20%.<br>
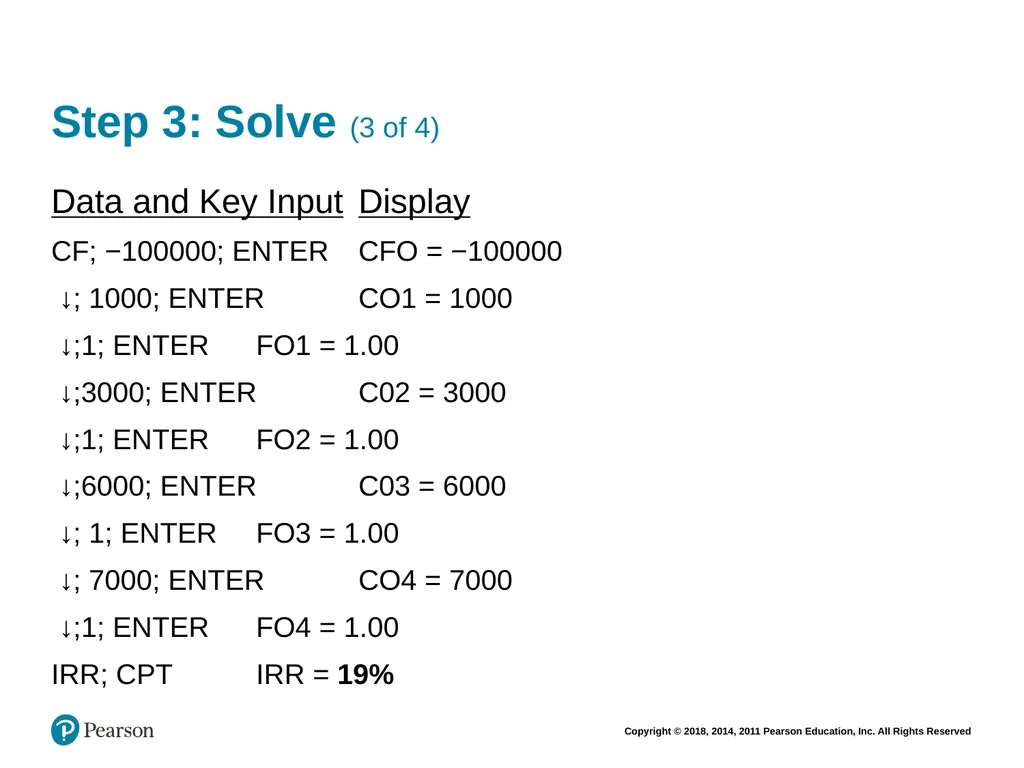
slide62. Step 3: Solve (3 of 4) Data and Key Input Display
CF; −100000; ENTER CFO = −100000
↓; 1000; ENTER CO1 = 1000
↓;1; ENTER FO1 = 1.00
↓;3000; ENTER C02 = 3000
↓;1; ENTER FO2 = 1.00
↓;6000; ENTER C03 = 6000
↓; 1; ENTER FO3 = 1.00
↓; 7000; ENTER CO4 = 7000
↓;1; ENTER FO4 = 1.00
IRR; CPT IRR = 19%<br>
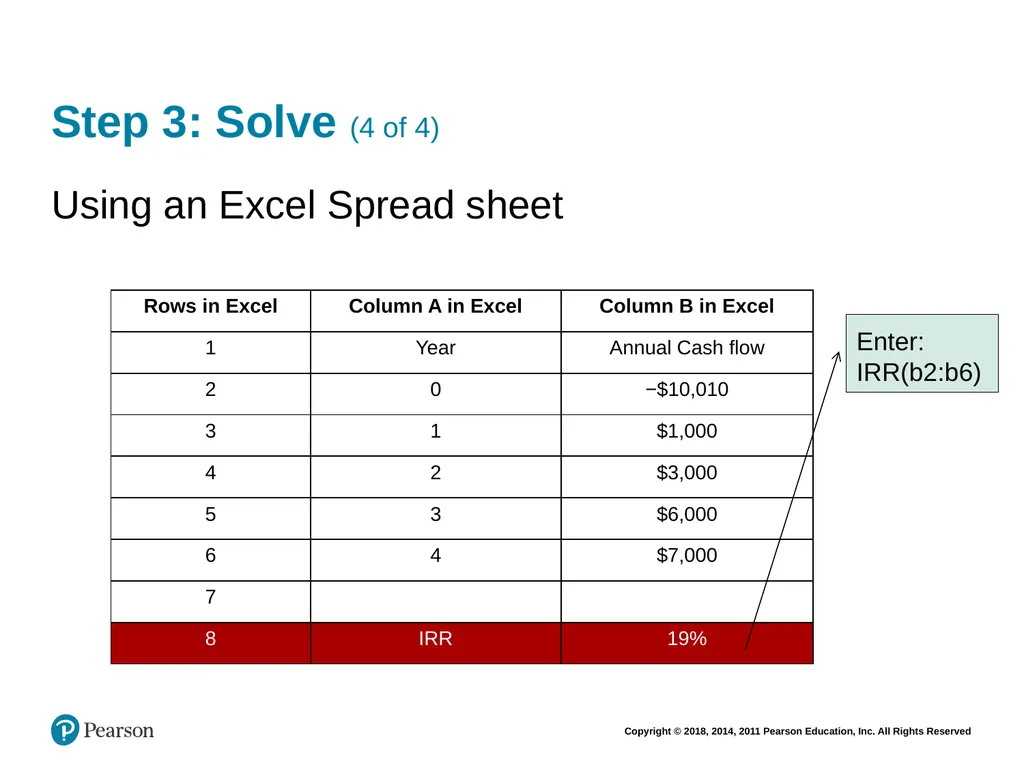
slide63. Step 3: Solve (4 of 4) Using an Excel Spread sheet Enter:
IRR(b2:b6)<br>
slide64. Step 4: Analyze The new copying center requires an initial investment of $10,010 and provides future cash flows that offer a return of 19%. Since the firm has decided 15% as the minimum acceptable return, this is a good investment for the firm.<br>
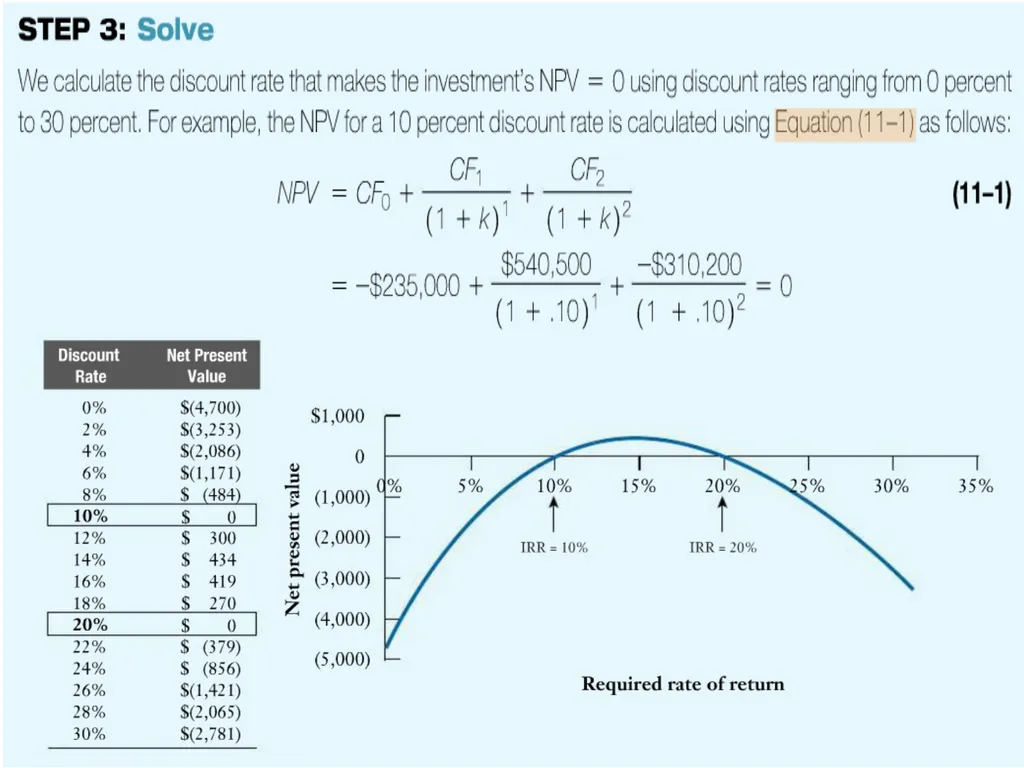
slide65. Complications with IRR: Multiple Rates of Return When the first cash flow is negative and the subsequent cash flows are positive, there is one unique IRR. However, there can be multiple values for the IRR when at least one of the later cash flow is negative. Checkpoint 11.5 demonstrates a project that has two IRRs.<br>
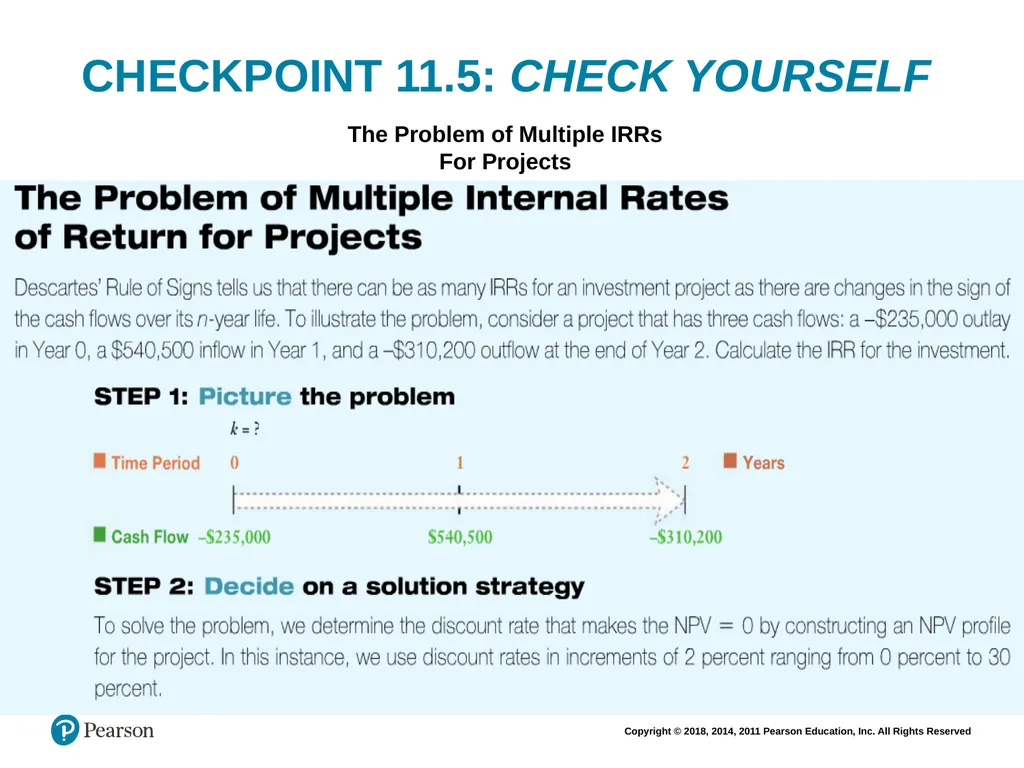
slide66. CHECKPOINT 11.5: CHECK YOURSELF The Problem of Multiple IRRs
For Projects<br>
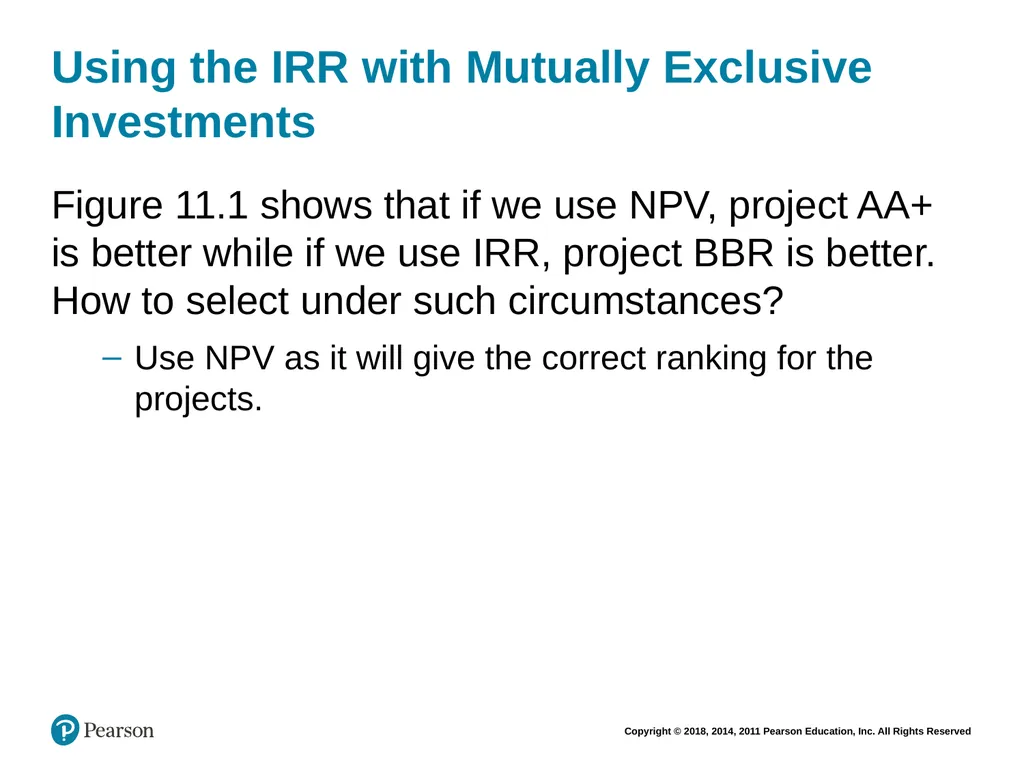
slide68. Using the IRR with Mutually Exclusive Investments Figure 11.1 shows that if we use NPV, project AA+ is better while if we use IRR, project BBR is better. How to select under such circumstances?
Use NPV as it will give the correct ranking for the projects.<br>
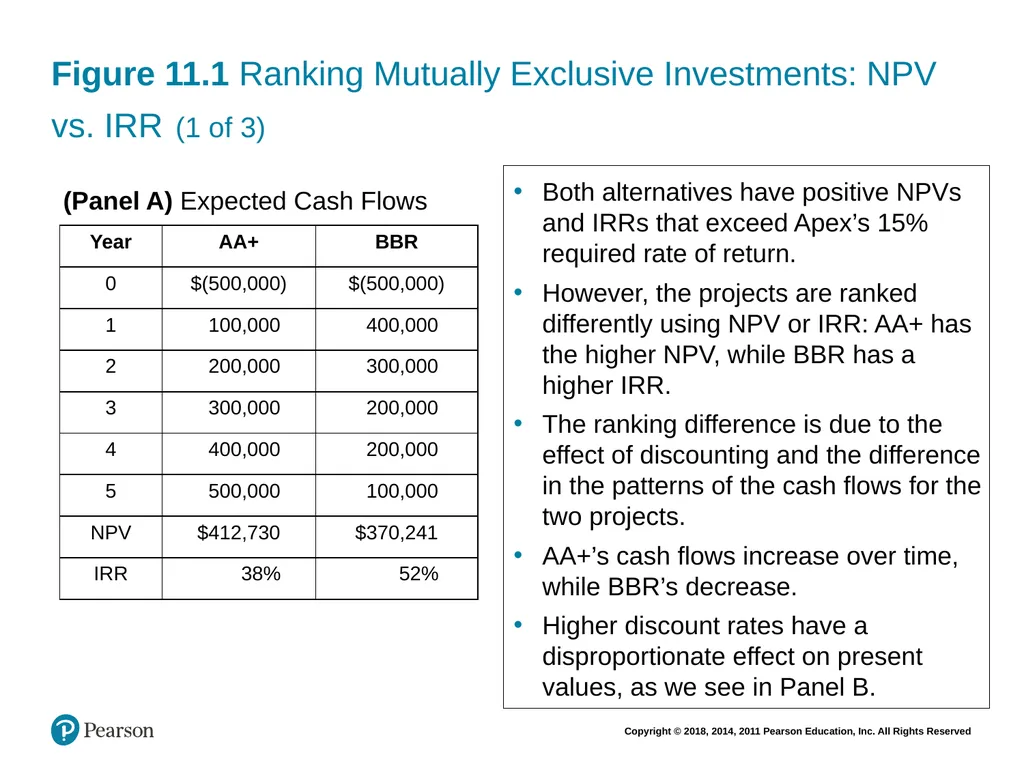
slide69. Figure 11.1 Ranking Mutually Exclusive Investments: NPV vs. IRR (1 of 3) (Panel A) Expected Cash Flows Both alternatives have positive NPVs and IRRs that exceed Apex’s 15% required rate of return.
However, the projects are ranked differently using NPV or IRR: AA+ has the higher NPV, while BBR has a higher IRR.
The ranking difference is due to the effect of discounting and the difference in the patterns of the cash flows for the two projects.
AA+’s cash flows increase over time, while BBR’s decrease.
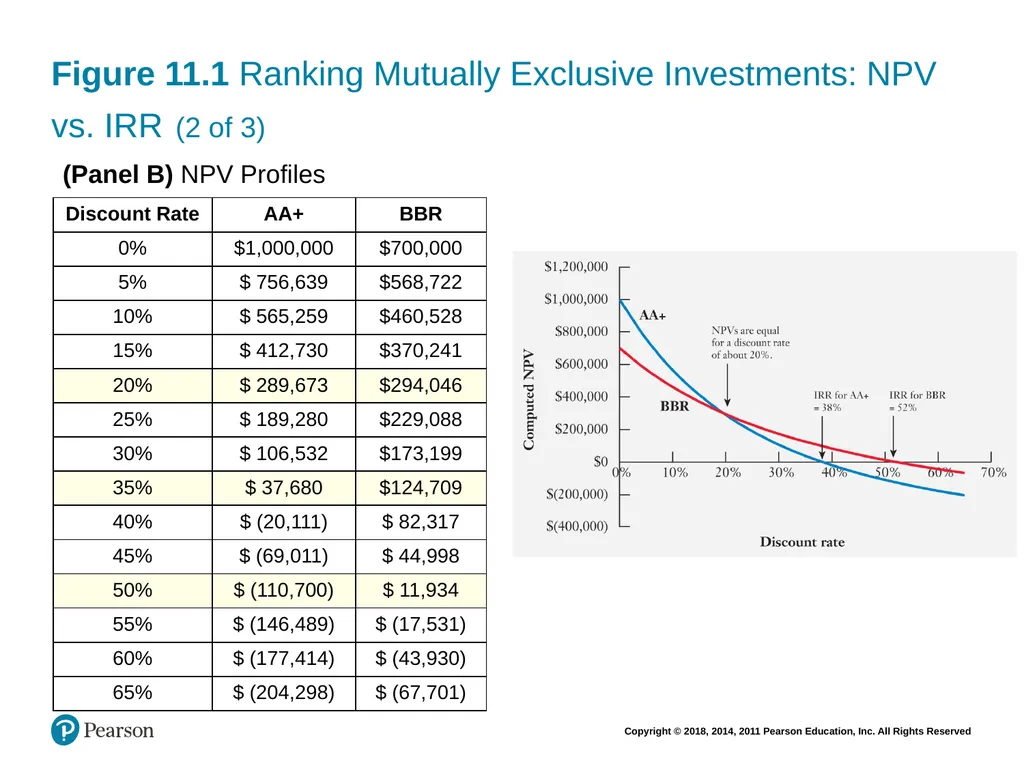
Higher discount rates have a disproportionate effect on present values, as we see in Panel B.<br>
slide70. Figure 11.1 Ranking Mutually Exclusive Investments: NPV vs. IRR (2 of 3) (Panel B) NPV Profiles<br>
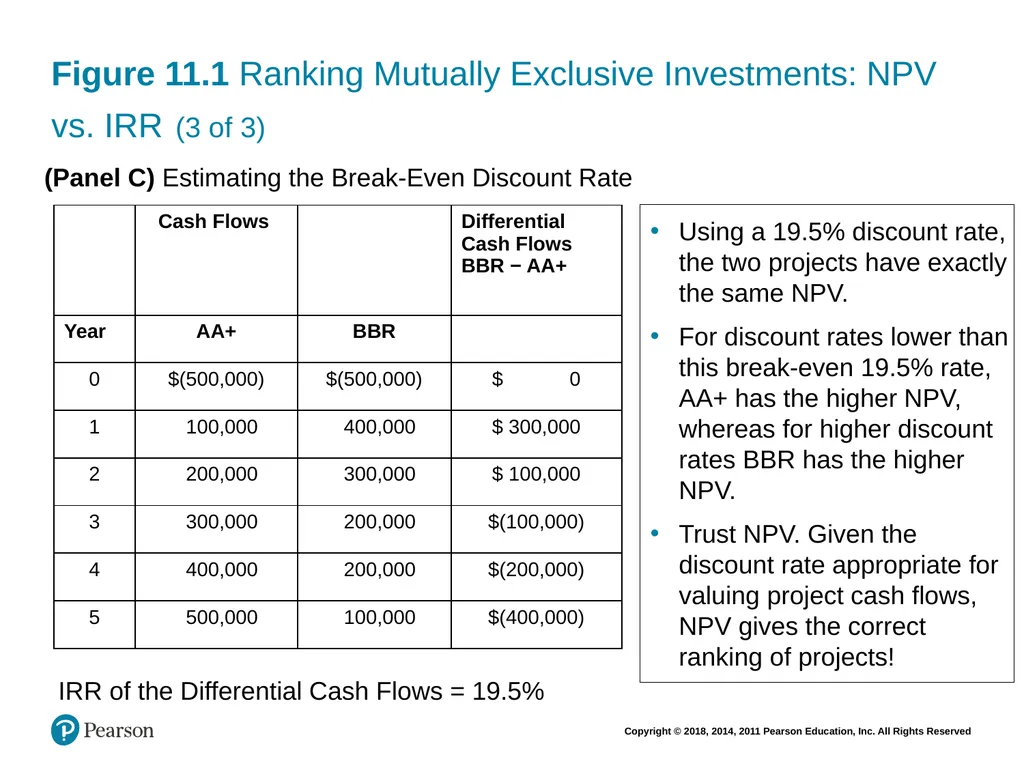
slide71. Figure 11.1 Ranking Mutually Exclusive Investments: NPV vs. IRR (3 of 3) (Panel C) Estimating the Break-Even Discount Rate IRR of the Differential Cash Flows = 19.5% Using a 19.5% discount rate, the two projects have exactly the same NPV.
For discount rates lower than this break-even 19.5% rate, AA+ has the higher NPV, whereas for higher discount rates BBR has the higher NPV.
Trust NPV. Given the discount rate appropriate for valuing project cash flows, NPV gives the correct ranking of projects!<br>
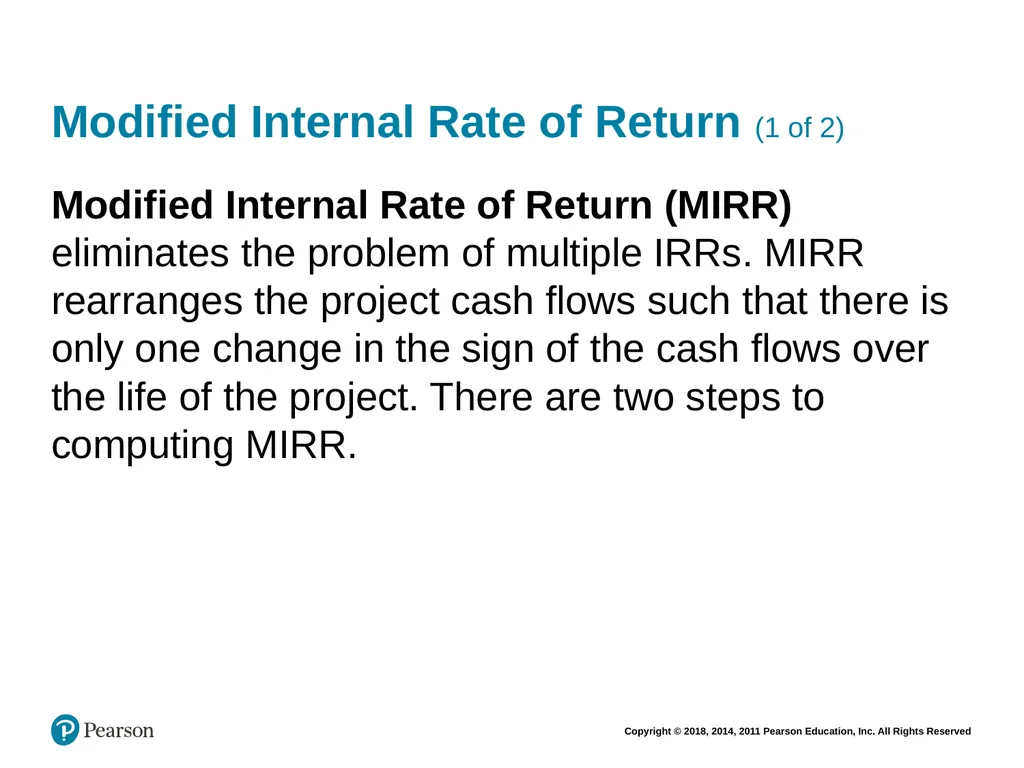
slide72. Modified Internal Rate of Return (1 of 2) Modified Internal Rate of Return (MIRR) eliminates the problem of multiple IRRs. MIRR rearranges the project cash flows such that there is only one change in the sign of the cash flows over the life of the project. There are two steps to computing MIRR.<br>
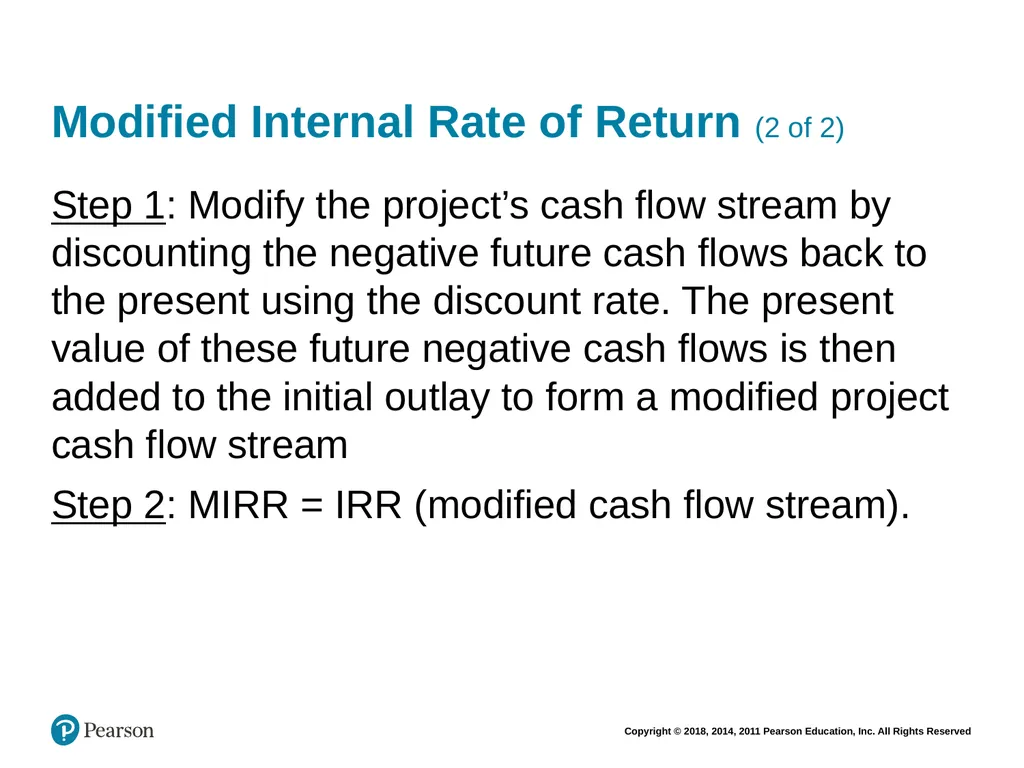
slide73. Modified Internal Rate of Return (2 of 2) Step 1: Modify the project’s cash flow stream by discounting the negative future cash flows back to the present using the discount rate. The present value of these future negative cash flows is then added to the initial outlay to form a modified project cash flow stream
Step 2: MIRR = IRR (modified cash flow stream).<br>
slide74. CHECKPOINT 11.6: CHECK YOURSELF Calculating the MIRR
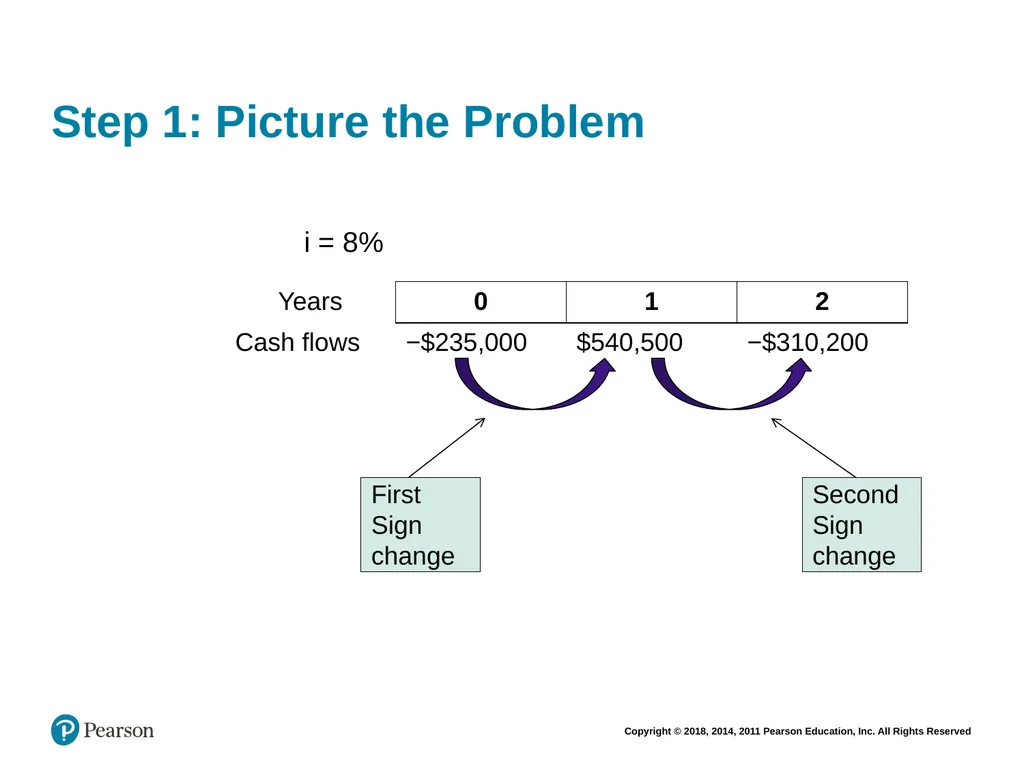
Analyze the MIRR for the preceding problem where the required rate of return used to discount the cash flows is 8%. What is the MIRR?<br>
slide75. Step 1: Picture the Problem i = 8% First
Sign
change Second
Sign
change<br>
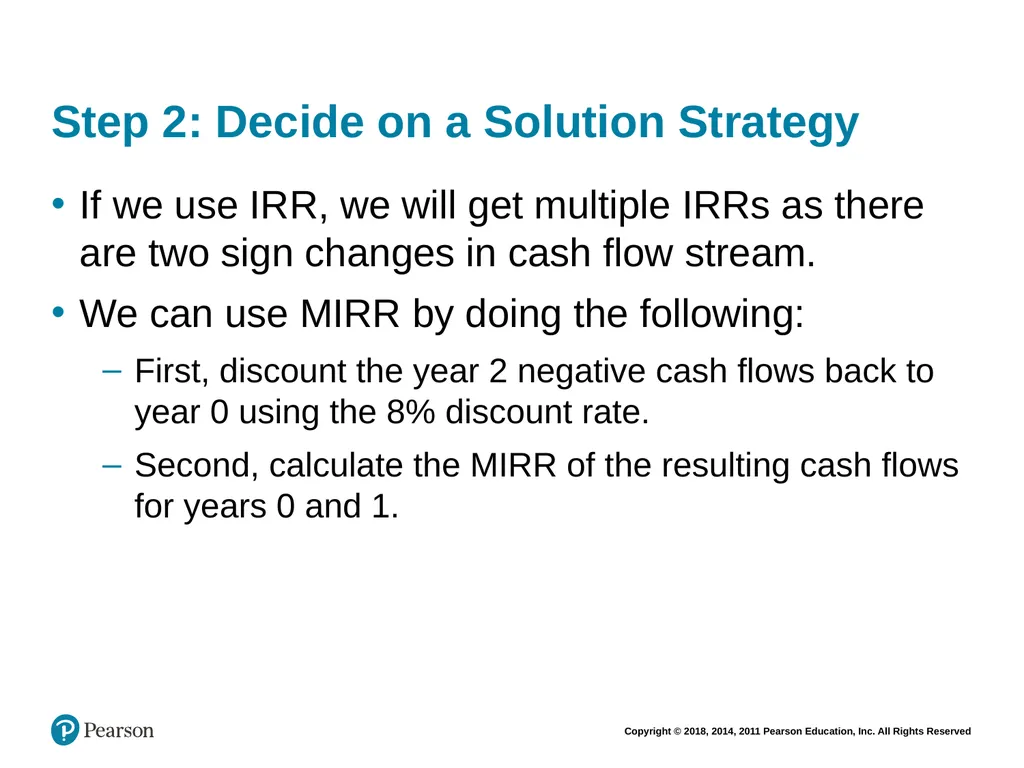
slide76. Step 2: Decide on a Solution Strategy If we use IRR, we will get multiple IRRs as there are two sign changes in cash flow stream.
We can use MIRR by doing the following:
First, discount the year 2 negative cash flows back to year 0 using the 8% discount rate.
Second, calculate the MIRR of the resulting cash flows for years 0 and 1.<br>
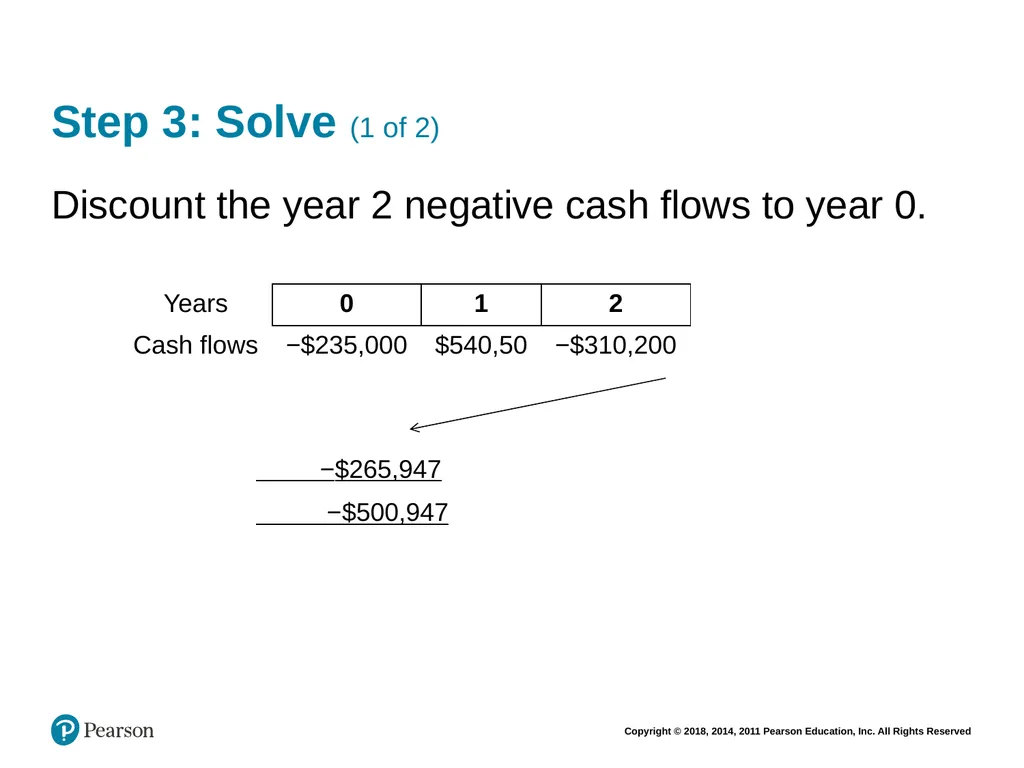
slide77. Step 3: Solve (1 of 2) Discount the year 2 negative cash flows to year 0.
−$265,947
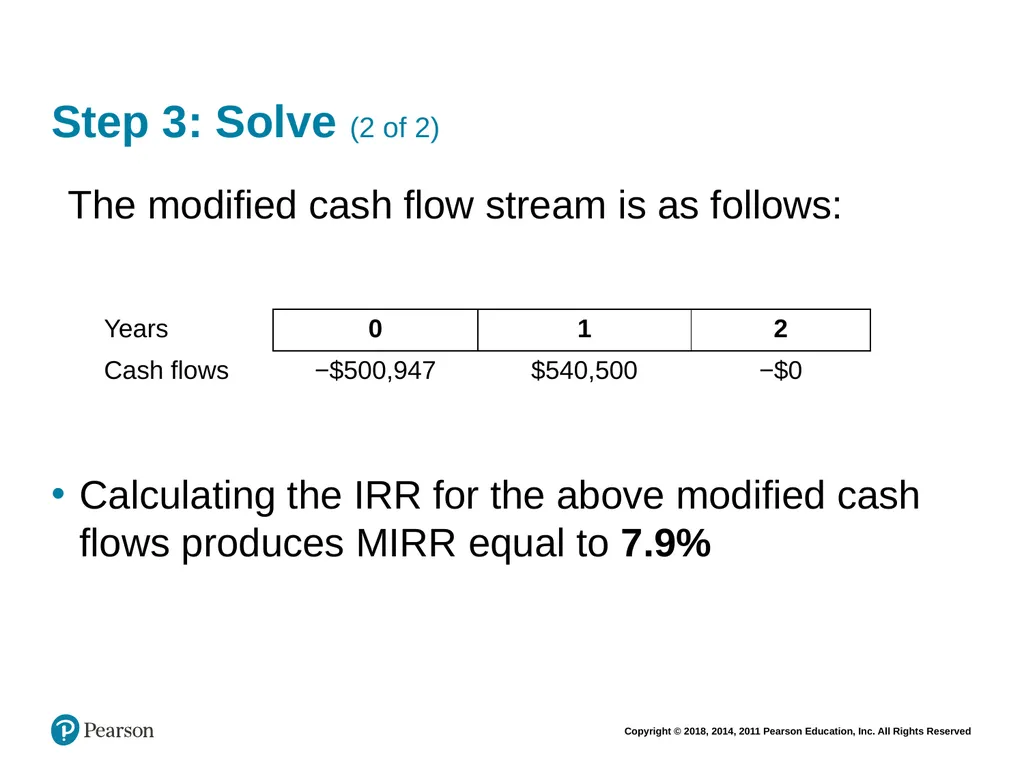
−$500,947<br>
slide78. Step 3: Solve (2 of 2) The modified cash flow stream is as follows: Calculating the IRR for the above modified cash flows produces MIRR equal to 7.9%<br>
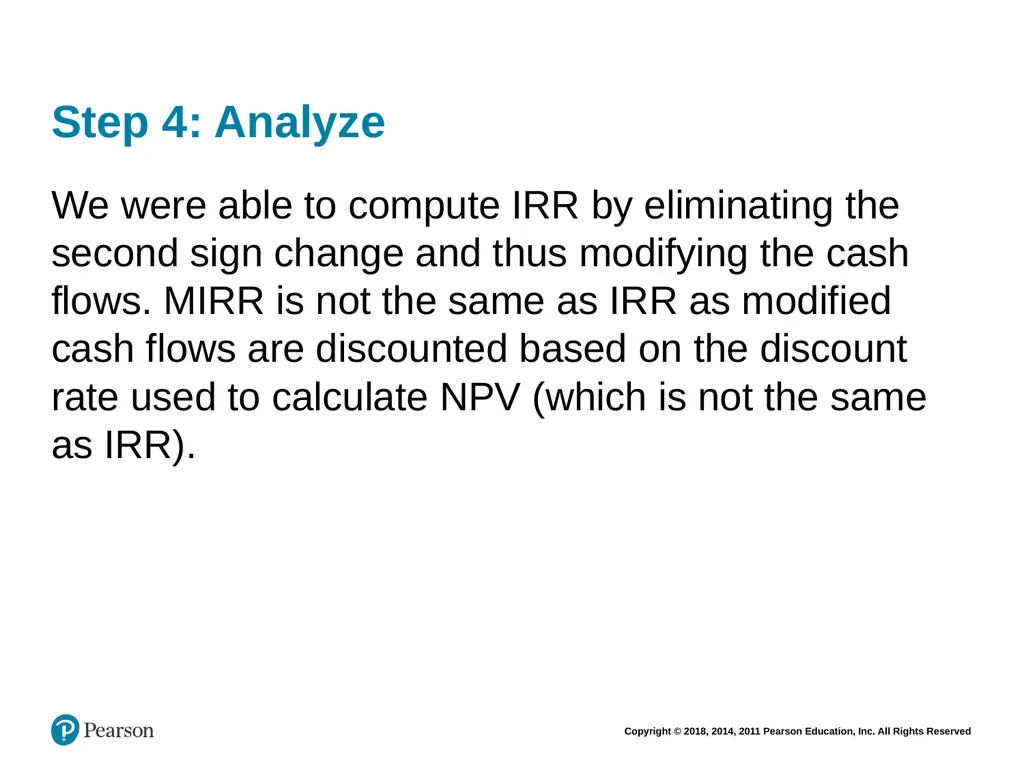
slide79. Step 4: Analyze We were able to compute IRR by eliminating the second sign change and thus modifying the cash flows. MIRR is not the same as IRR as modified cash flows are discounted based on the discount rate used to calculate NPV (which is not the same as IRR).<br>
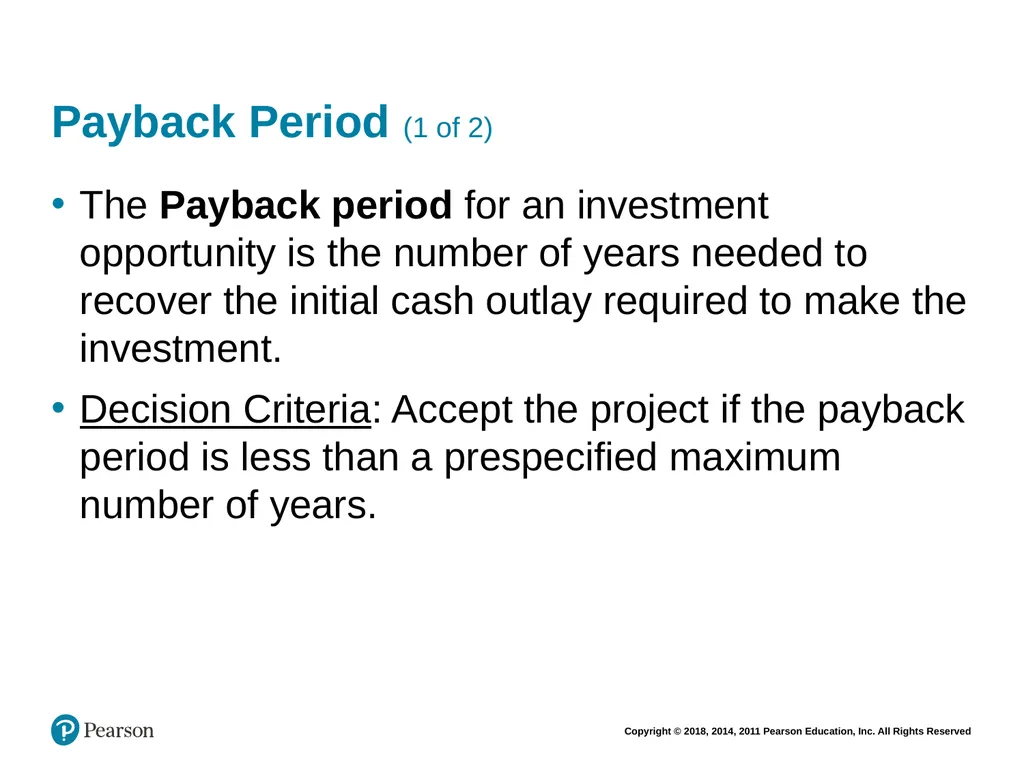
slide80. Payback Period (1 of 2) The Payback period for an investment opportunity is the number of years needed to recover the initial cash outlay required to make the investment.
Decision Criteria: Accept the project if the payback period is less than a prespecified maximum number of years.<br>
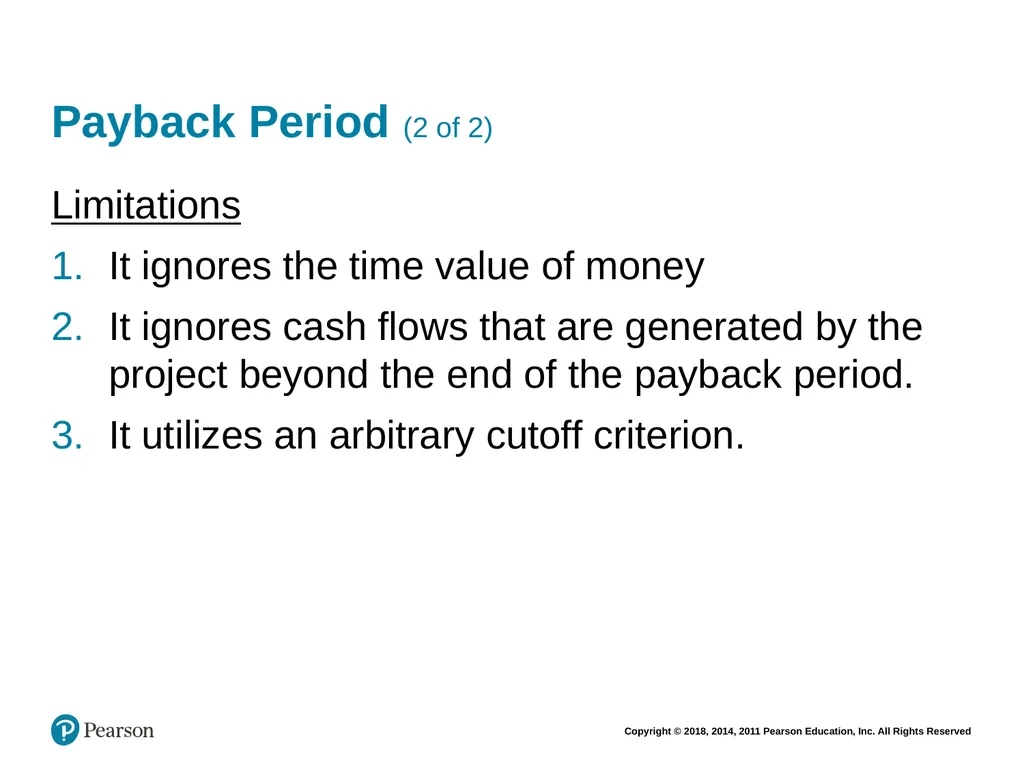
slide81. Payback Period (2 of 2) Limitations
It ignores the time value of money
It ignores cash flows that are generated by the project beyond the end of the payback period.
It utilizes an arbitrary cutoff criterion.<br>
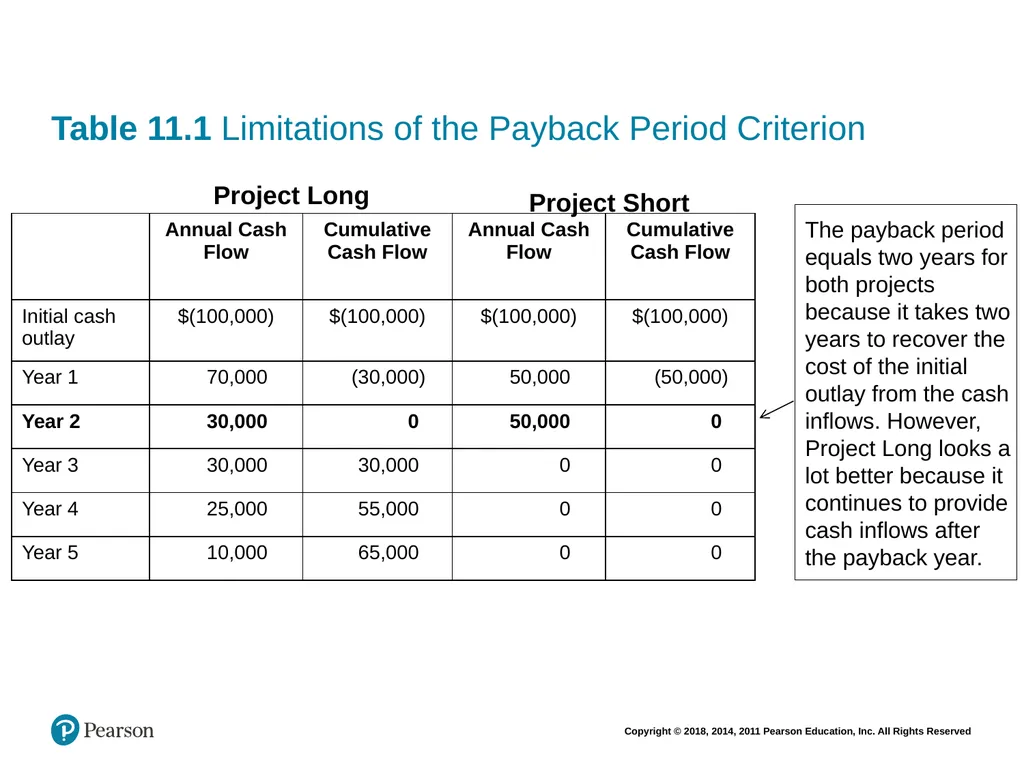
slide82. Table 11.1 Limitations of the Payback Period Criterion Project Long Project Short The payback period equals two years for both projects because it takes two years to recover the cost of the initial outlay from the cash inflows. However, Project Long looks a lot better because it continues to provide cash inflows after the payback year.<br>
slide83. Discounted Payback Period Discounted payback period approach is similar except that it uses discounted cash flows to calculate the payback period.
Decision Criteria: Accept the project if its discounted payback period is less than the pre-specified number of years.<br>
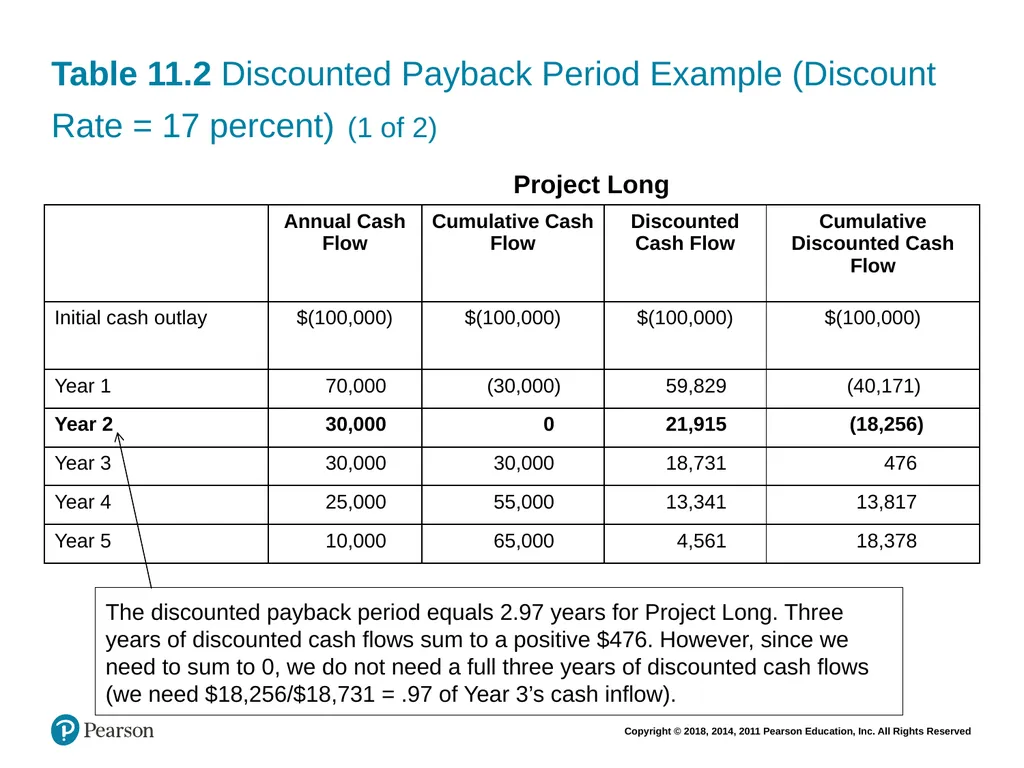
slide84. Table 11.2 Discounted Payback Period Example (Discount Rate = 17 percent) (1 of 2) Project Long The discounted payback period equals 2.97 years for Project Long. Three years of discounted cash flows sum to a positive $476. However, since we need to sum to 0, we do not need a full three years of discounted cash flows (we need $18,256/$18,731 = .97 of Year 3’s cash inflow).<br>
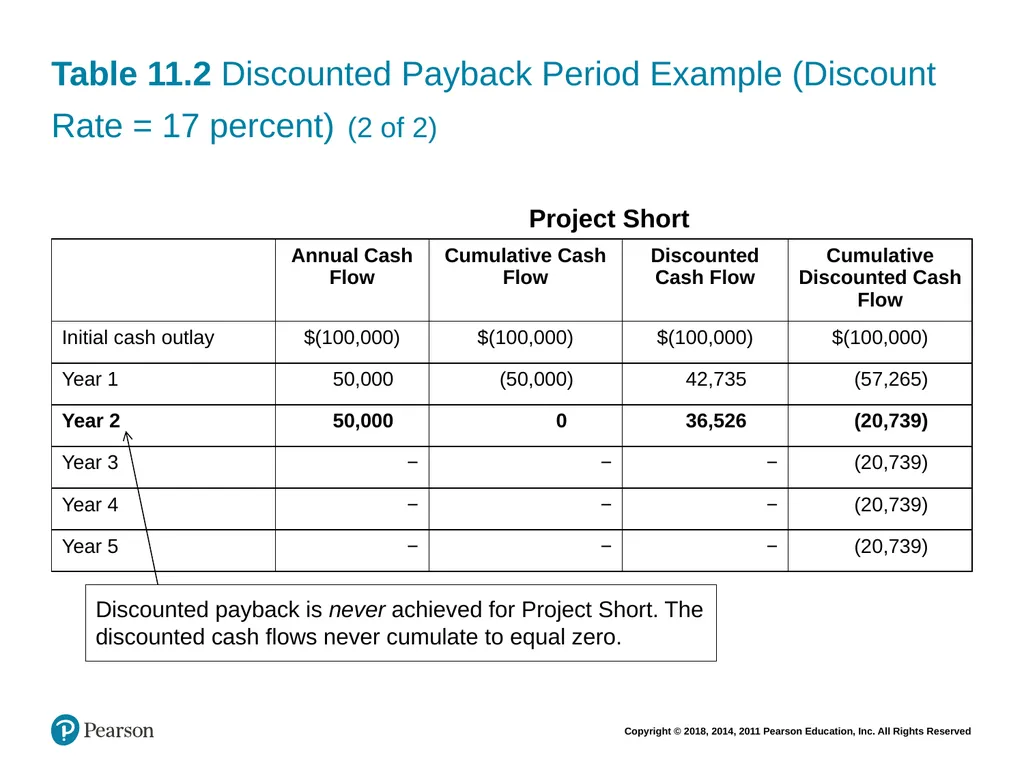
slide85. Table 11.2 Discounted Payback Period Example (Discount Rate = 17 percent) (2 of 2) Project Short Discounted payback is never achieved for Project Short. The discounted cash flows never cumulate to equal zero.<br>
slide86. 11.4 A GLANCE AT ACTUAL CAPITAL BUDGETING PRACTICES<br>
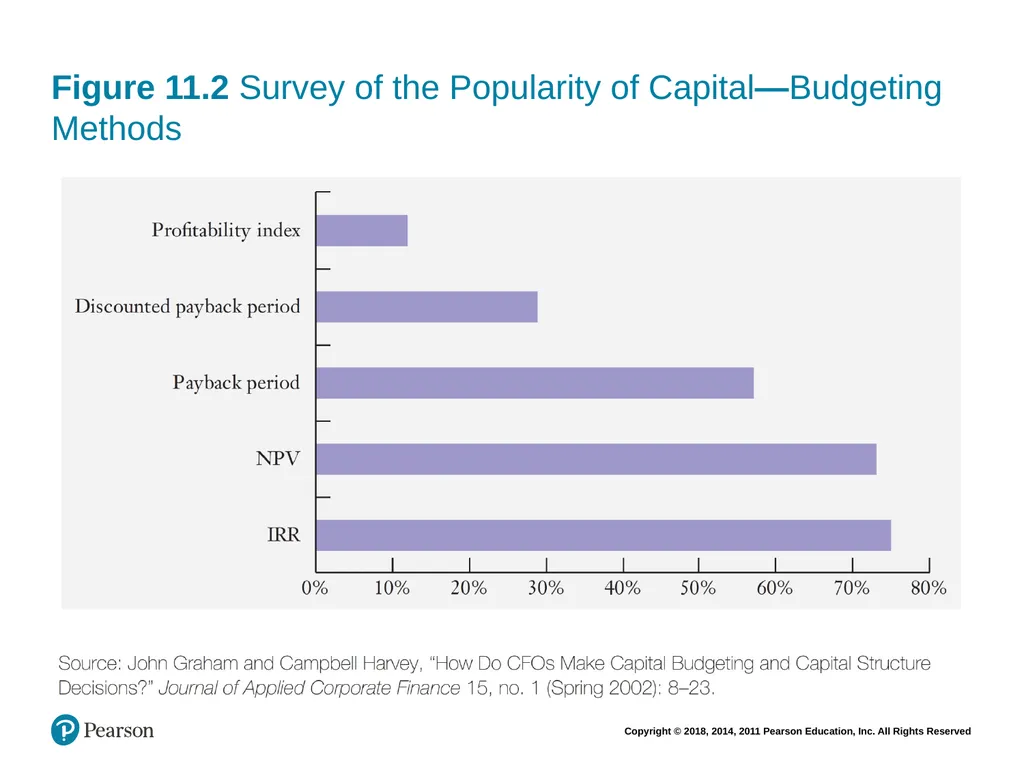
slide87. A Glance at Actual Capital Budgeting Practices Figure 11.2 provides the results of a survey of the CFOs of large US firms, showing the popularity of various tools.
The results show that NPV and IRR methods are by far the most widely used methods, although more than half the firms surveyed did use the Payback method.<br>
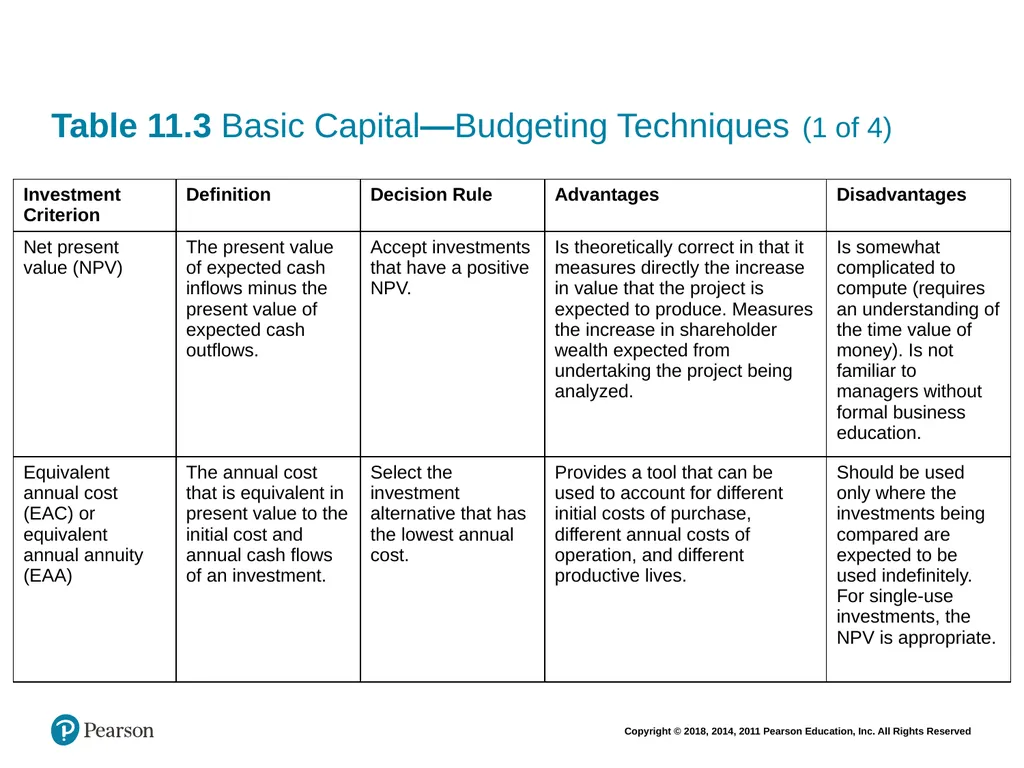
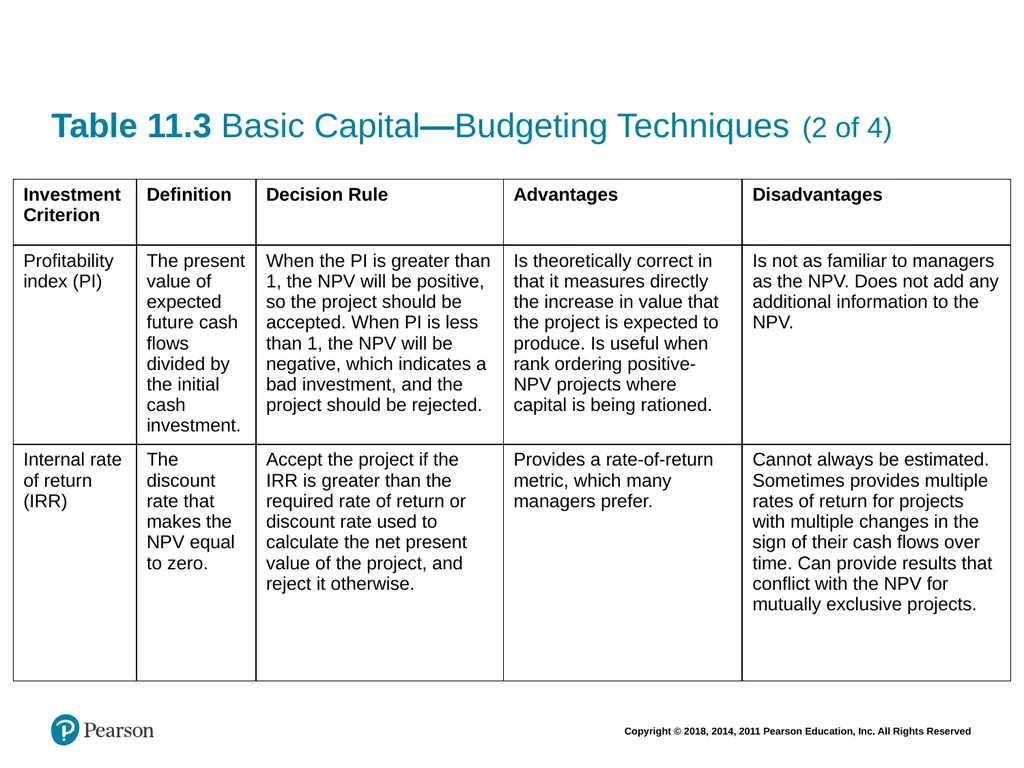
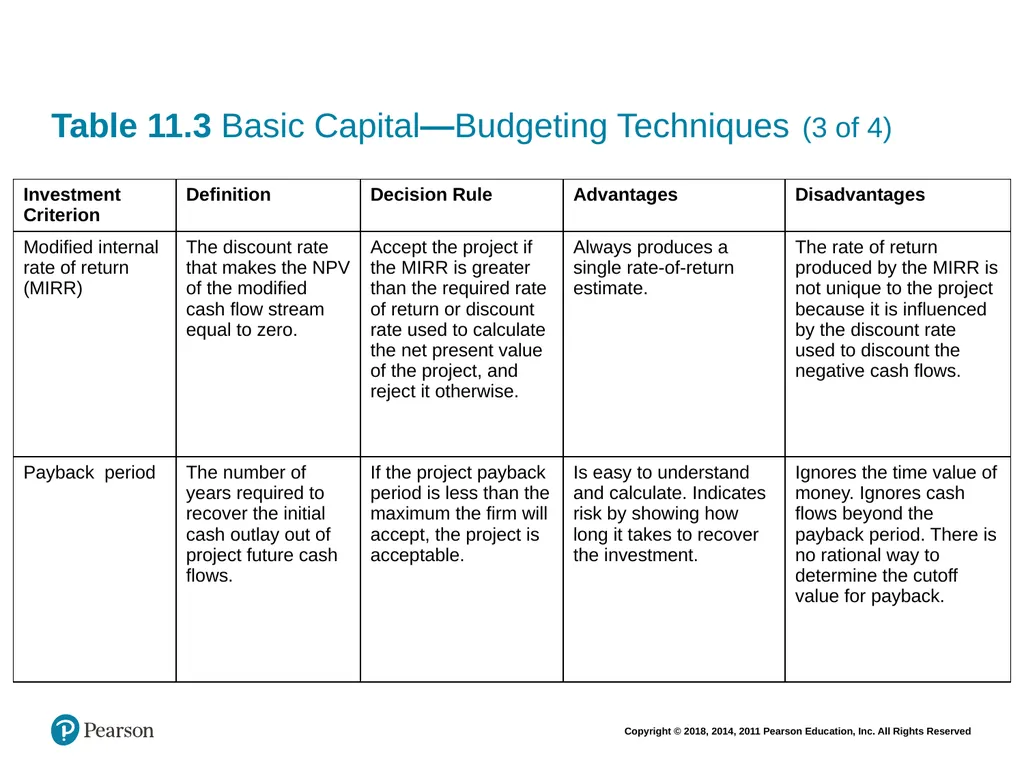
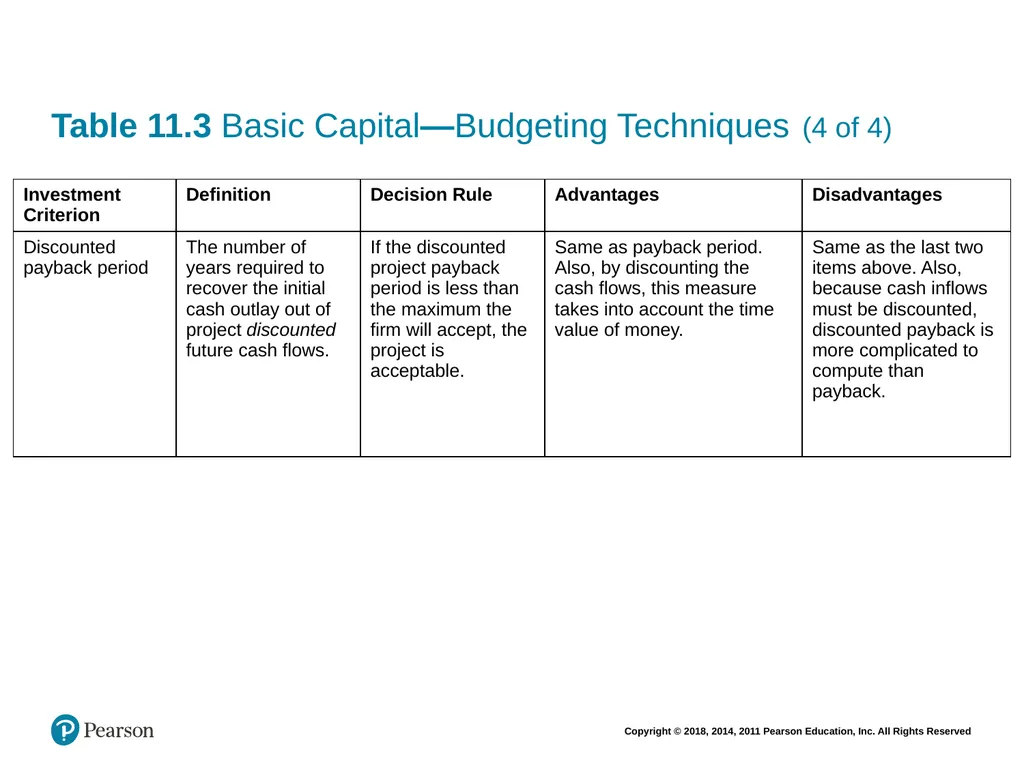
slide88. Figure 11.2 Survey of the Popularity of Capital—Budgeting Methods<br>
slide89. Table 11.3 Basic Capital—Budgeting Techniques (1 of 4)<br>
slide90. Table 11.3 Basic Capital—Budgeting Techniques (2 of 4)<br>
slide91. Table 11.3 Basic Capital—Budgeting Techniques (3 of 4)<br>
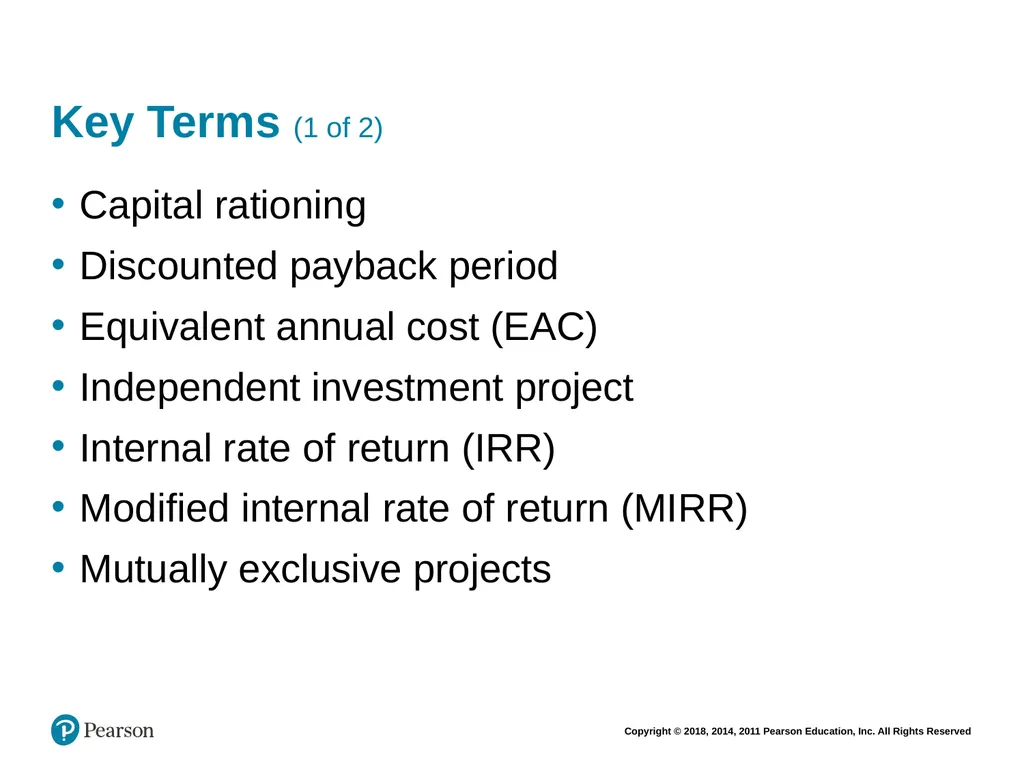
slide92. Table 11.3 Basic Capital—Budgeting Techniques (4 of 4)<br>
slide93. Key Terms (1 of 2) Capital rationing
Discounted payback period
Equivalent annual cost (EAC)
Independent investment project
Internal rate of return (IRR)
Modified internal rate of return (MIRR)
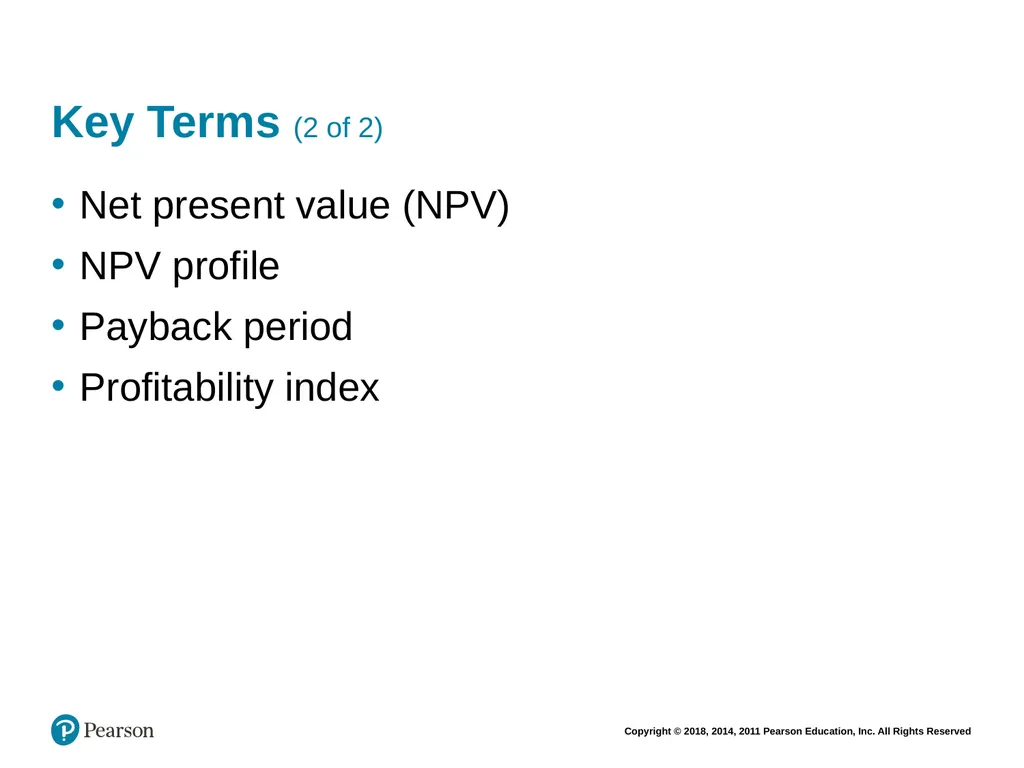
Mutually exclusive projects<br>
slide94. Key Terms (2 of 2) Net present value (NPV)
NPV profile
Payback period
Profitability index<br>
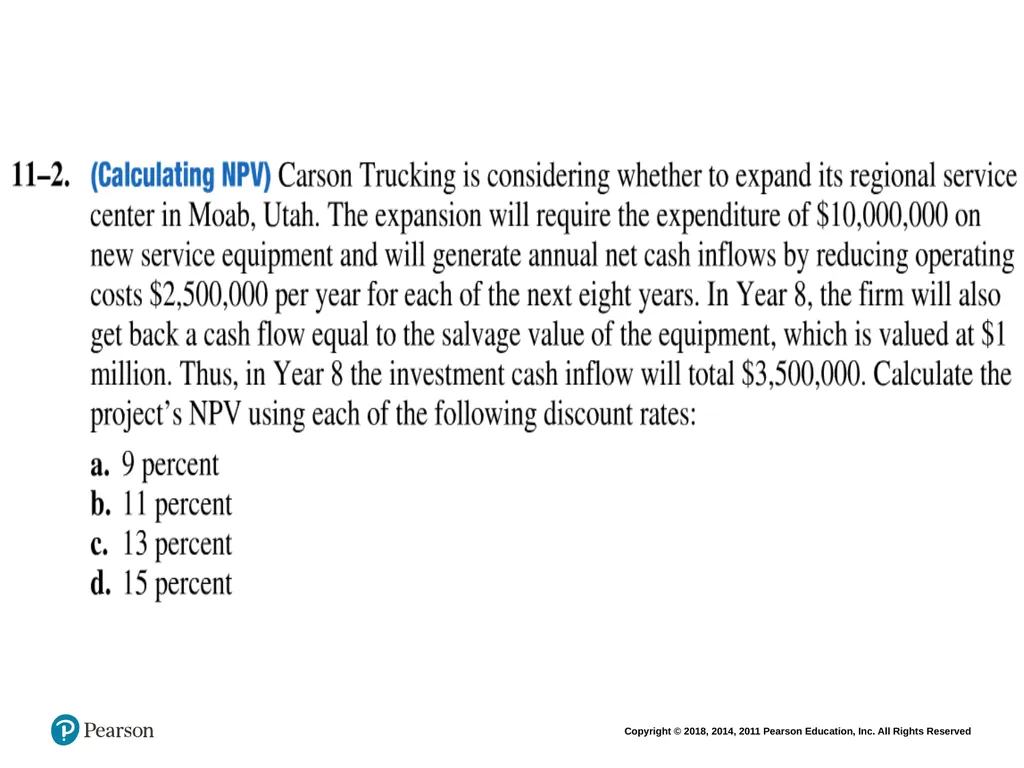
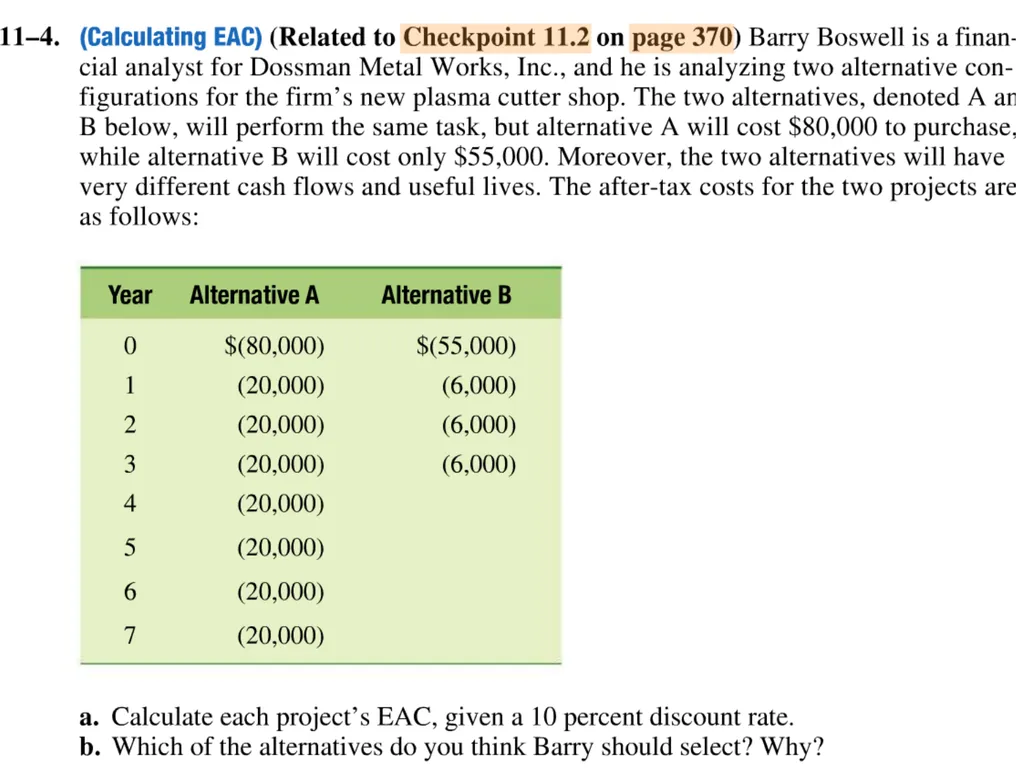
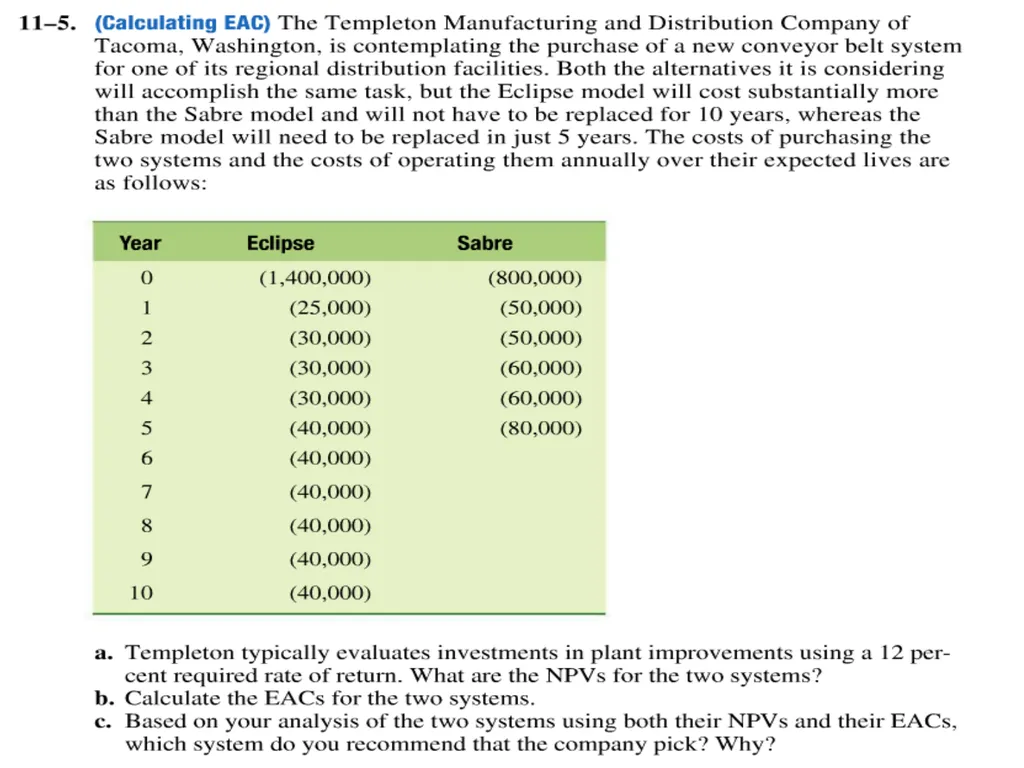
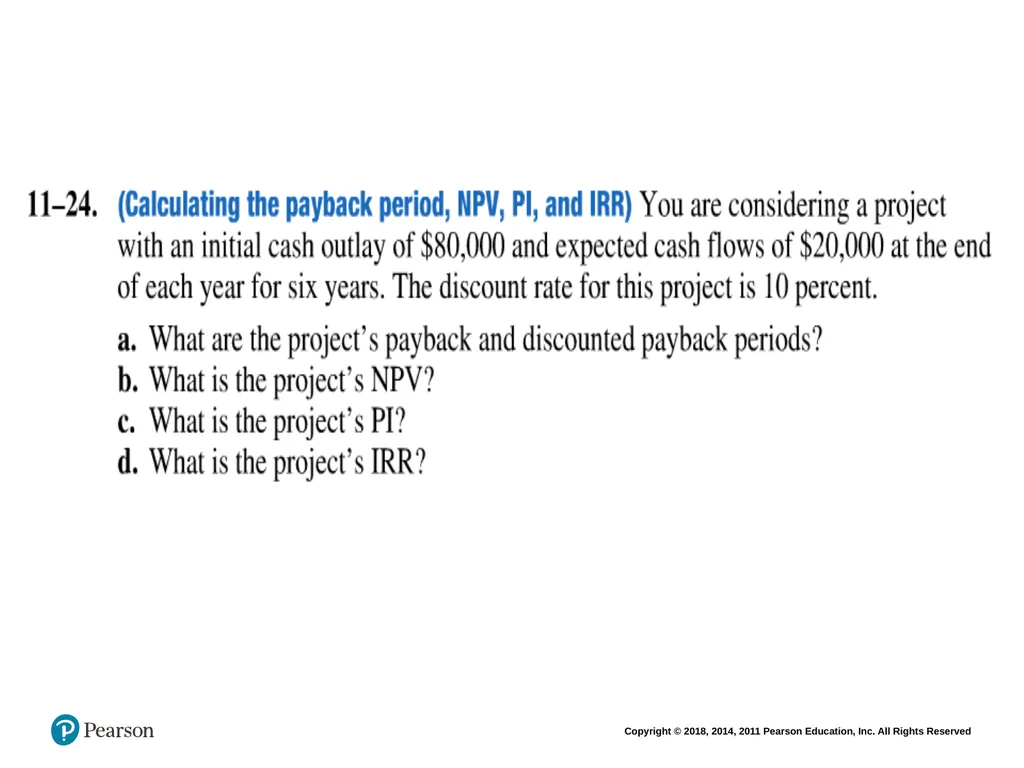
slide95. Practice Questions<br>
slide101. Copyright<br>
slide2. Learning Objectives (1 of 2) Understand how to identify the sources and types of profitable investment opportunities.
Evaluate investment opportunities using net present value and describe why net present value is the best measure to use.<br>
slide3. Learning Objectives (2 of 2) Use the profitability index, internal rate of return, and payback criteria to evaluate investment opportunities.
Understand current business practice with respect to the use of capital-budgeting criteria.<br>
slide4. Principles Applied in This Chapter Principle 1: Money Has a Time Value.
Principle 2: There is a Risk-Return Tradeoff.
Principle 3: Cash Flows Are the Source of Value.
Principle 5: Individuals Respond to Incentives.<br>
slide5. 11.1 AN OVERVIEW OF CAPITAL BUDGETING<br>
slide6. Disney’s Capital Budgeting Decision: Three Important Lessons (1 of 2) Disney’s decision to invest $17.5 million to build Disneyland park in California in 1955 is an example of a major capital budgeting decision. How did this decision impact Disney? What important lessons can we learn from Disney theme park story?<br>
slide7. Disney’s Capital Budgeting Decision: Three Important Lessons (2 of 2) Capital budgeting decisions are critical in defining a company’s business
Very large investments frequently consist of smaller investment decisions that define a business strategy
Successful investment decisions lead to the development of managerial expertise and capabilities that influence the firm’s choice of future investments.<br>
slide8. The Typical Capital—Budgeting Process Phase I: The firm’s management identifies promising investment opportunities.
Phase II: The investment opportunity’s value-creating potential-what some refer to as its value proposition-is thoroughly evaluated.<br>
slide9. Types of Capital Investment Projects Revenue enhancing Investments (such as introducing a new product line),
Cost-reducing investments (such as replacing old equipment with a more efficient equipment), and
Mandatory investments that are a result of government mandates (such as investments to meet safety and environmental regulations)<br>
slide10. 11.2 NET PRESENT VALUE<br>
slide11. Net Present Value The net present value (NPV) is the difference between the present value of cash inflows and the cash outflows. NPV estimates the amount of wealth that the project creates.
Decision Criteria: Investment projects should be accepted if the NPV of the project is positive and should be rejected if the NPV is negative.<br>
slide12. Calculating an Investment’s NPV (1 of 2) Cost of making the investment = Initial cash flow (this is typically a cash outflow, taking on a negative value) Present value of the investment’s cash inflows = Present value of the project’s future cash inflows<br>
slide13. Calculating an Investment’s NPV (2 of 2) NPV reflects the first three principles: The project’s cash flows are used to measure the benefits the project provides (Principle 3, cash flows are the source of value), cash flows are discounted back to the present (Principle 1, money has time value), and the discount rate used to discount the cash flows back to the present reflects the risk in the future cash flows (Principle 2, There is a risk-return tradeoff)<br>
slide14. CHECKPOINT 11.1: CHECK YOURSELF Calculating the NPV<br>
slide15. The Problem Saber Electronics provides specialty manufacturing services to defense contractors located in the Seattle, Washington area. The initial outlay is $3 million and, management estimates that the firm might generate cash flows for years one through five equal to $500,000; $750,000; $1,500,000; $2,000,000; and $2,000,000. Saber uses a 20% discount rate for projects of this type. Is this a good investment opportunity?<br>
slide16. Step 1: Picture the Problem k = 20%
Years Cash flows
(in $ millions) Net
Present
Value = ?<br>
slide17. Step 2: Decide on a Solution Strategy We need to analyze if this is a good investment opportunity. We can do that by computing the Net Present Value (NPV), which requires computing the present value of all cash flows.
We can compute the NPV by using a mathematical formula, a financial calculator or a spreadsheet.<br>
slide18. Step 3: Solve (1 of 3) Using a Mathematical Formula Cost of making the investment = Initial cash flow (this is typically a cash outflow, taking on a negative value) Present value of the investment’s cash inflows = Present value of the project’s future cash inflows<br>
slide19. Step 3: Solve (2 of 3) NPV = −$3m + $.5m/(1.2) + $.75m/(1.2)2 + $1.5m/(1.2)3 + $2m/(1.2)4 + $2m/(1.2)4
NPV = −$3,000,000 + $416,666.67 + $520,833.30 + $868,055.60 + $964,506 + $803,755.10
NPV = $573,817<br>
slide20. Step 3: Solve (3 of 3) Using an Excel Spreadsheet
NPV = NPV (discount rate, CF1-5 ) + CF0
= NPV(.20, 500000, 750000, 1500000, 2000000,2000000) − 3000000
= $573,817<br>
slide21. Step 4: Analyze The project requires an initial investment of $3,000,000 and generates futures cash flows that have a present value of $3,573,817. Consequently, the project cash flows are $573,817 more than the required investment.
Since the NPV is positive, the project is an acceptable project.<br>
slide22. Independent Versus Mutually Exclusive Investment Projects An independent investment project is one that stands alone and can be undertaken without influencing the acceptance or rejection of any other project.
Accepting a mutually exclusive project prevents another project from being accepted.<br>
slide23. Evaluating an Independent Investment Opportunity It requires two steps to evaluate:
Calculate NPV;
Accept the project if NPV is positive and reject if it is negative.<br>
slide24. Evaluating Mutually Exclusive Investment Opportunities Following are two situations where firm is faced with mutually exclusive projects:
Substitutes – When a firm is analyzing two or more alternative investments, and each performs the same function.
Firm Constraints – Firm faces constraints such as limited managerial time or limited financial capital that limit its ability to invest in every positive NPV project.<br>
slide25. Choosing Between Mutually Exclusive Investments (1 of 2) If mutually exclusive investments have equal lives, we will calculate the NPVs and choose the one with the higher NPV.
If mutually exclusive investments do not have equal lives, we must calculate the Equivalent Annual Cost (EAC). The EAC technique provides an estimate of the annual cost of owning and operating the investment over its lifetime. We will then select the one that has a lower EAC.<br>
slide26. Choosing Between Mutually Exclusive Investments (2 of 2) Computation of EAC<br>
slide27. CHECKPOINT 11.2: CHECK YOURSELF Calculating the
Equivalent Annual Cost<br>
slide31. The Problem What is the EAC for a machine that costs $50,000, requires payment of $6,000 per year for maintenance and operation expense, and lasts for 6 years? You may assume that the discount rate is 9% and there will be no salvage value associated with the machine. In addition, you intend to replace this machine at the end of its life with an identical machine with identical costs.<br>
slide32. Step 1: Picture the Problem k = 9% Cash flows (in $, thousands) EAC = ?<br>
slide33. Step 2: Decide on a Solution Strategy Here we need to calculate the EAC, which will tell us the annual cost for a machine that lasts 6 years.
EAC can be computed using a mathematical formula or financial calculator.<br>
slide34. Step 3: Solve (1 of 5) Using a Mathematical Formula
It requires 2 steps:
Computation of NPV
Computation of EAC<br>
slide35. Step 3: Solve (2 of 5) Cost of making the investment = Initial cash flow (this is typically a cash outflow, taking on a negative value) Present value of the investment’s cash inflows = Present value of the project’s future cash inflows NPV = −$50,000 + PV of $6,000 each year
= −$50,000 + −$6,000 (PV of Annuity Factor)
= −$50,000 + −$6,000 {[1−(1/(1.09)6] ÷ (.09)}
= −$50,000 + −$6,000 {4.4859) = −$76,915<br>
slide36. Step 3: Solve (3 of 5) EAC = NPV ÷ Annuity Factor
= −$76,915 ÷ 4.4859
= −$17,145.95<br>
slide37. Step 3: Solve (4 of 5) Using a Financial Calculator
Data and Key Input Display
↓CF; −50000; ENTER CFO = −50000
; −6000; ENTER CO1 = −6000
;6; ENTER FO1 = 6.00
NPV;8; ENTER i = 8
CPT NPV = −77,372<br>
slide38. Step 3: Solve (5 of 5) Enter
N = 6
1/y = 9
PV = −76915
FV = 0
PMT = −17,145.86
Thus EAC = $−17,145.86<br>
slide39. Step 4: Analyze EAC indicates the annual cost that is adjusted for time value of money. Here EAC is equal to $17,145.86.<br>
slide40. 11.3 OTHER INVESTMENT CRITERIA<br>
slide41. Profitability Index (1 of 2) The profitability index (PI) is a cost-benefit ratio equal to the present value of an investment’s future cash flows divided by its initial cost.<br>
slide42. Profitability Index (2 of 2) Decision Criteria:
If PI is greater than one, the NPV will be positive and the investment should be accepted
When PI is less than one, which indicates a bad investment, NPV will be negative and the project should be rejected.<br>
slide43. CHECKPOINT 11.3: CHECK YOURSELF Calculating the Profitability Index<br>
slide44. The Problem (1 of 2) PNG Pharmaceuticals is considering an investment in a new automated materials handling system that is expected to reduce its drug manufacturing costs by eliminating much of the waste currently involved in its specialty drug division. The new system will require an initial investment of $50,000 and is expected to provide cash savings over the next six-year period as shown on next slide.<br>
slide45. The Problem (2 of 2)<br>
slide46. Step 1: Picture the Problem k = 10% (in $, thousands) PI = ?<br>
slide47. Step 2: Decide on a Solution Strategy The PI for a project is equal to the present value of the project’s expected cash flows for years 1-6 divided by the initial outlay.
PI = PV of expected cash flows ÷ −Initial outlay<br>
slide48. Step 3: Solve (1 of 3) We can proceed in two steps:
Compute PV of expected cash flows by discounting the cash flows from Year 1 to Year 6 at 10%.
PVt = CFt ÷ (1.09)t
Compute PI<br>
slide49. Step 3: Solve (2 of 3) Step 1: Computing PV of Cash Inflows<br>
slide50. Step 3: Solve (3 of 3) Step 2: Compute the PI
PI = PV of expected CF1-6 ÷ Initial Outlay
= $53,681.72 ÷ $50,000
= 1.0733<br>
slide51. Step 4: Analyze PNG Pharmaceuticals requires an initial investment of $50,000 and provides future cash flows that have a present value of $53,681.72. Thus, PI is equal to 1.0733.
It is an acceptable project since PI is greater than one.<br>
slide52. Internal Rate of Return (1 of 3) The internal rate of return (IRR) of an investment is analogous to the yield to maturity (YTM) on a bond as defined in Chapter 9. Specifically, the IRR is the discount rate that results in a zero NPV for the project.<br>
slide53. Internal Rate of Return (2 of 3)<br>
slide54. Internal Rate of Return (3 of 3) Decision Criteria: Accept the project if the IRR is greater than the required rate of return or discount rate used to calculate the net present value of the project, and reject it otherwise.<br>
slide55. CHECKPOINT 11.4: CHECK YOURSELF Calculating the IRR<br>
slide56. The Problem (1 of 2) Knowledge Associates is a small consulting firm in Portland, Oregon, and they are considering the purchase of a new copying center for the office that can copy, fax, and scan documents. The new machine costs $10,010 to purchase and is expected to provide cash flow savings over the next four years of $1,000; $3,000; $6,000; and $7,000.<br>
slide57. The Problem (2 of 2) The employee in charge of performing financial analysis of the proposed investment has decided to use the IRR as her primary criterion for making a recommendation to the managing partner of the firm. If the discount rate the firm uses to value the cash flows from office equipment purchases is 15%, is this a good investment for the firm?<br>
slide58. Step 1: Picture the Problem IRR = ?<br>
slide59. Step 2: Decide on a Solution Strategy Here we have to calculate the project’s IRR. IRR is equal to the discount rate that makes the present value of the future cash flows (in years 1-4) equal to the initial cash outflow of $10,010.
We can compute the IRR using trial & error, financial calculator or an excel spreadsheet.<br>
slide60. Step 3: Solve (1 of 4) Using a Mathematical Formula
This will require finding the rate at which NPV is equal to zero.
We compute the NPV at different rates to determine the range of IRR.<br>
slide61. Step 3: Solve (2 of 4) This table suggests that IRR is between 15% and 20%.<br>
slide62. Step 3: Solve (3 of 4) Data and Key Input Display
CF; −100000; ENTER CFO = −100000
↓; 1000; ENTER CO1 = 1000
↓;1; ENTER FO1 = 1.00
↓;3000; ENTER C02 = 3000
↓;1; ENTER FO2 = 1.00
↓;6000; ENTER C03 = 6000
↓; 1; ENTER FO3 = 1.00
↓; 7000; ENTER CO4 = 7000
↓;1; ENTER FO4 = 1.00
IRR; CPT IRR = 19%<br>
slide63. Step 3: Solve (4 of 4) Using an Excel Spread sheet Enter:
IRR(b2:b6)<br>
slide64. Step 4: Analyze The new copying center requires an initial investment of $10,010 and provides future cash flows that offer a return of 19%. Since the firm has decided 15% as the minimum acceptable return, this is a good investment for the firm.<br>
slide65. Complications with IRR: Multiple Rates of Return When the first cash flow is negative and the subsequent cash flows are positive, there is one unique IRR. However, there can be multiple values for the IRR when at least one of the later cash flow is negative. Checkpoint 11.5 demonstrates a project that has two IRRs.<br>
slide66. CHECKPOINT 11.5: CHECK YOURSELF The Problem of Multiple IRRs
For Projects<br>
slide68. Using the IRR with Mutually Exclusive Investments Figure 11.1 shows that if we use NPV, project AA+ is better while if we use IRR, project BBR is better. How to select under such circumstances?
Use NPV as it will give the correct ranking for the projects.<br>
slide69. Figure 11.1 Ranking Mutually Exclusive Investments: NPV vs. IRR (1 of 3) (Panel A) Expected Cash Flows Both alternatives have positive NPVs and IRRs that exceed Apex’s 15% required rate of return.
However, the projects are ranked differently using NPV or IRR: AA+ has the higher NPV, while BBR has a higher IRR.
The ranking difference is due to the effect of discounting and the difference in the patterns of the cash flows for the two projects.
AA+’s cash flows increase over time, while BBR’s decrease.
Higher discount rates have a disproportionate effect on present values, as we see in Panel B.<br>
slide70. Figure 11.1 Ranking Mutually Exclusive Investments: NPV vs. IRR (2 of 3) (Panel B) NPV Profiles<br>
slide71. Figure 11.1 Ranking Mutually Exclusive Investments: NPV vs. IRR (3 of 3) (Panel C) Estimating the Break-Even Discount Rate IRR of the Differential Cash Flows = 19.5% Using a 19.5% discount rate, the two projects have exactly the same NPV.
For discount rates lower than this break-even 19.5% rate, AA+ has the higher NPV, whereas for higher discount rates BBR has the higher NPV.
Trust NPV. Given the discount rate appropriate for valuing project cash flows, NPV gives the correct ranking of projects!<br>
slide72. Modified Internal Rate of Return (1 of 2) Modified Internal Rate of Return (MIRR) eliminates the problem of multiple IRRs. MIRR rearranges the project cash flows such that there is only one change in the sign of the cash flows over the life of the project. There are two steps to computing MIRR.<br>
slide73. Modified Internal Rate of Return (2 of 2) Step 1: Modify the project’s cash flow stream by discounting the negative future cash flows back to the present using the discount rate. The present value of these future negative cash flows is then added to the initial outlay to form a modified project cash flow stream
Step 2: MIRR = IRR (modified cash flow stream).<br>
slide74. CHECKPOINT 11.6: CHECK YOURSELF Calculating the MIRR
Analyze the MIRR for the preceding problem where the required rate of return used to discount the cash flows is 8%. What is the MIRR?<br>
slide75. Step 1: Picture the Problem i = 8% First
Sign
change Second
Sign
change<br>
slide76. Step 2: Decide on a Solution Strategy If we use IRR, we will get multiple IRRs as there are two sign changes in cash flow stream.
We can use MIRR by doing the following:
First, discount the year 2 negative cash flows back to year 0 using the 8% discount rate.
Second, calculate the MIRR of the resulting cash flows for years 0 and 1.<br>
slide77. Step 3: Solve (1 of 2) Discount the year 2 negative cash flows to year 0.
−$265,947
−$500,947<br>
slide78. Step 3: Solve (2 of 2) The modified cash flow stream is as follows: Calculating the IRR for the above modified cash flows produces MIRR equal to 7.9%<br>
slide79. Step 4: Analyze We were able to compute IRR by eliminating the second sign change and thus modifying the cash flows. MIRR is not the same as IRR as modified cash flows are discounted based on the discount rate used to calculate NPV (which is not the same as IRR).<br>
slide80. Payback Period (1 of 2) The Payback period for an investment opportunity is the number of years needed to recover the initial cash outlay required to make the investment.
Decision Criteria: Accept the project if the payback period is less than a prespecified maximum number of years.<br>
slide81. Payback Period (2 of 2) Limitations
It ignores the time value of money
It ignores cash flows that are generated by the project beyond the end of the payback period.
It utilizes an arbitrary cutoff criterion.<br>
slide82. Table 11.1 Limitations of the Payback Period Criterion Project Long Project Short The payback period equals two years for both projects because it takes two years to recover the cost of the initial outlay from the cash inflows. However, Project Long looks a lot better because it continues to provide cash inflows after the payback year.<br>
slide83. Discounted Payback Period Discounted payback period approach is similar except that it uses discounted cash flows to calculate the payback period.
Decision Criteria: Accept the project if its discounted payback period is less than the pre-specified number of years.<br>
slide84. Table 11.2 Discounted Payback Period Example (Discount Rate = 17 percent) (1 of 2) Project Long The discounted payback period equals 2.97 years for Project Long. Three years of discounted cash flows sum to a positive $476. However, since we need to sum to 0, we do not need a full three years of discounted cash flows (we need $18,256/$18,731 = .97 of Year 3’s cash inflow).<br>
slide85. Table 11.2 Discounted Payback Period Example (Discount Rate = 17 percent) (2 of 2) Project Short Discounted payback is never achieved for Project Short. The discounted cash flows never cumulate to equal zero.<br>
slide86. 11.4 A GLANCE AT ACTUAL CAPITAL BUDGETING PRACTICES<br>
slide87. A Glance at Actual Capital Budgeting Practices Figure 11.2 provides the results of a survey of the CFOs of large US firms, showing the popularity of various tools.
The results show that NPV and IRR methods are by far the most widely used methods, although more than half the firms surveyed did use the Payback method.<br>
slide88. Figure 11.2 Survey of the Popularity of Capital—Budgeting Methods<br>
slide89. Table 11.3 Basic Capital—Budgeting Techniques (1 of 4)<br>
slide90. Table 11.3 Basic Capital—Budgeting Techniques (2 of 4)<br>
slide91. Table 11.3 Basic Capital—Budgeting Techniques (3 of 4)<br>
slide92. Table 11.3 Basic Capital—Budgeting Techniques (4 of 4)<br>
slide93. Key Terms (1 of 2) Capital rationing
Discounted payback period
Equivalent annual cost (EAC)
Independent investment project
Internal rate of return (IRR)
Modified internal rate of return (MIRR)
Mutually exclusive projects<br>
slide94. Key Terms (2 of 2) Net present value (NPV)
NPV profile
Payback period
Profitability index<br>
slide95. Practice Questions<br>
slide101. Copyright<br>