
Financial Payment System Modeling for Polymetallic
SN
Published · 40 slides · 0 views
1 / 1

Description
Financial Payment System Modeling for Polymetallic Nodules Richard Roth, Randolph Kirchain, Tom Peacock, Carlos Munoz Royo Materials System Laboratory Massachusetts Institute of Technology Presentation to International Seabed Authority Open
Related Topics
Share
Embed code
Download this presentation From Below
"Financial Payment System Modeling for Polymetallic" is the property of its rightful owner. Permission is granted to download and print the materials on this website for personal, non-commercial use only, and to display it on your personal computer provided you do not modify the materials and that you retain all copyright notices contained in the materials. By downloading content from our website, you accept the terms of this agreement.
Presentation Transcript
01
Financial Payment System Modeling for Polymetallic Nodules Richard Roth, Randolph Kirchain, Tom Peacock, Carlos Munoz Royo
Materials System Laboratory
Massachusetts Institute of Technology
Presentation to International Seabed Authority Open Ended Working Group on Financial Modeling Kingston, Jamaica November 7, 2022<br>
Presentation to International Seabed Authority Open Ended Working Group on Financial Modeling Kingston, Jamaica November 7, 2022<br>
02
Agenda Review of Financial Payment System Options
Influence of Sponsor State Tax
Metal Price Basis for Royalty Calculations Mix of Mn metals vs Mn rich slag/ore<br>
Influence of Sponsor State Tax
Metal Price Basis for Royalty Calculations Mix of Mn metals vs Mn rich slag/ore<br>
03
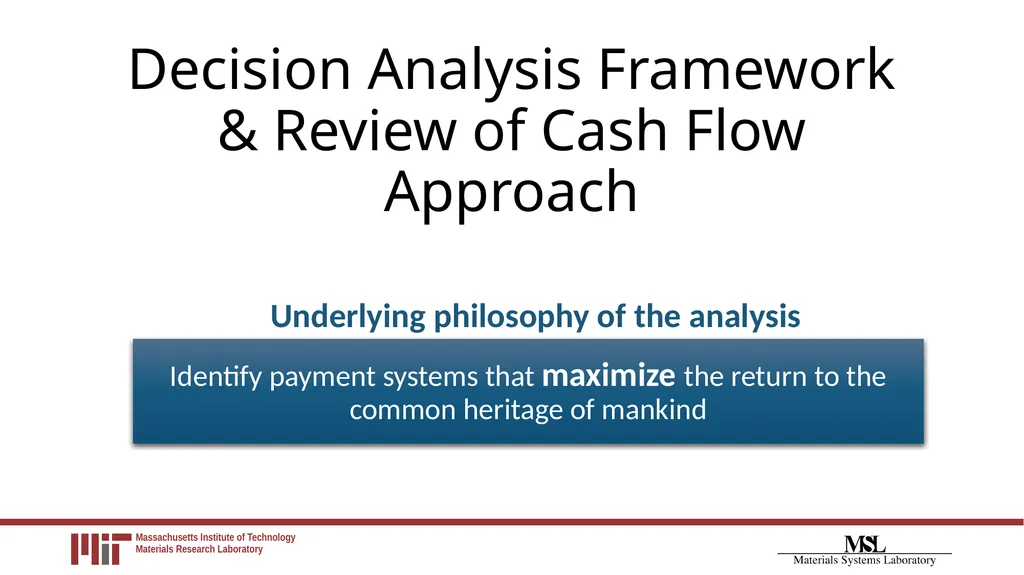
Decision Analysis Framework
& Review of Cash Flow Approach Identify payment systems that maximize the return to the common heritage of mankind Underlying philosophy of the analysis<br>
04
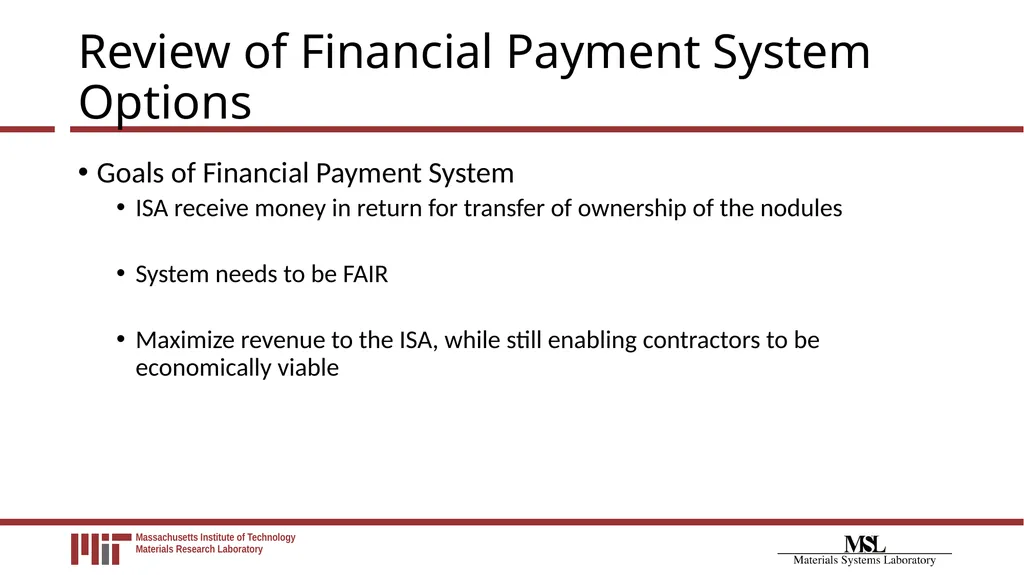
Review of Financial Payment System Options Goals of Financial Payment System
ISA receive money in return for transfer of ownership of the nodules
System needs to be FAIR
Maximize revenue to the ISA, while still enabling contractors to be economically viable<br>
ISA receive money in return for transfer of ownership of the nodules
System needs to be FAIR
Maximize revenue to the ISA, while still enabling contractors to be economically viable<br>
05
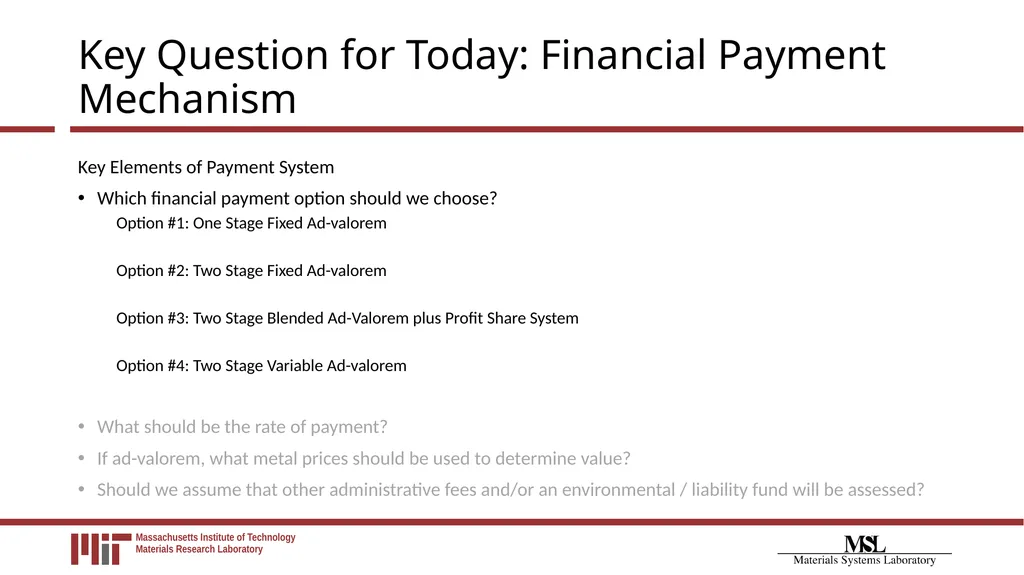
Key Question for Today: Financial Payment Mechanism Key Elements of Payment System
Which financial payment option should we choose?
Option #1: One Stage Fixed Ad-valorem
Option #2: Two Stage Fixed Ad-valorem
Option #3: Two Stage Blended Ad-Valorem plus Profit Share System
Option #4: Two Stage Variable Ad-valorem
What should be the rate of payment?
If ad-valorem, what metal prices should be used to determine value?
Should we assume that other administrative fees and/or an environmental / liability fund will be assessed?<br>
Which financial payment option should we choose?
Option #1: One Stage Fixed Ad-valorem
Option #2: Two Stage Fixed Ad-valorem
Option #3: Two Stage Blended Ad-Valorem plus Profit Share System
Option #4: Two Stage Variable Ad-valorem
What should be the rate of payment?
If ad-valorem, what metal prices should be used to determine value?
Should we assume that other administrative fees and/or an environmental / liability fund will be assessed?<br>
06
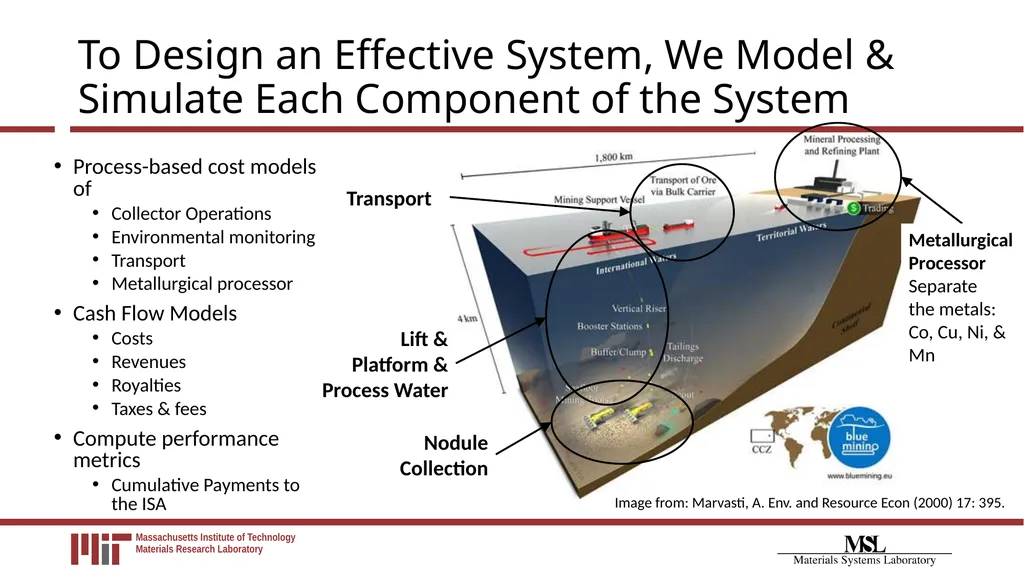
To Design an Effective System, We Model & Simulate Each Component of the System Process-based cost models of
Collector Operations
Environmental monitoring
Transport
Metallurgical processor
Cash Flow Models
Costs
Revenues
Royalties
Taxes & fees
Compute performance metrics
Cumulative Payments to the ISA Image from: Marvasti, A. Env. and Resource Econ (2000) 17: 395.<br>
Collector Operations
Environmental monitoring
Transport
Metallurgical processor
Cash Flow Models
Costs
Revenues
Royalties
Taxes & fees
Compute performance metrics
Cumulative Payments to the ISA Image from: Marvasti, A. Env. and Resource Econ (2000) 17: 395.<br>
07
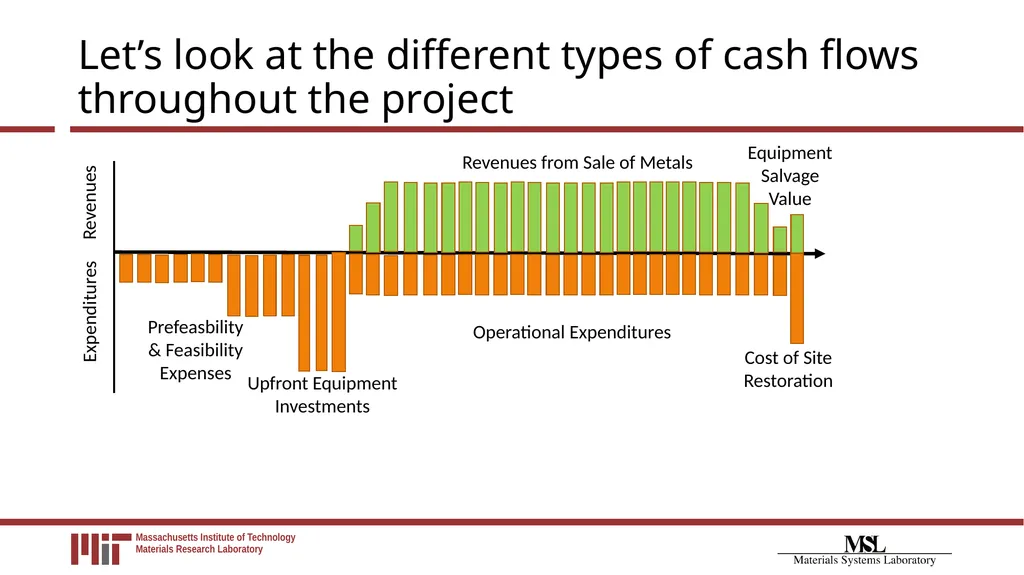
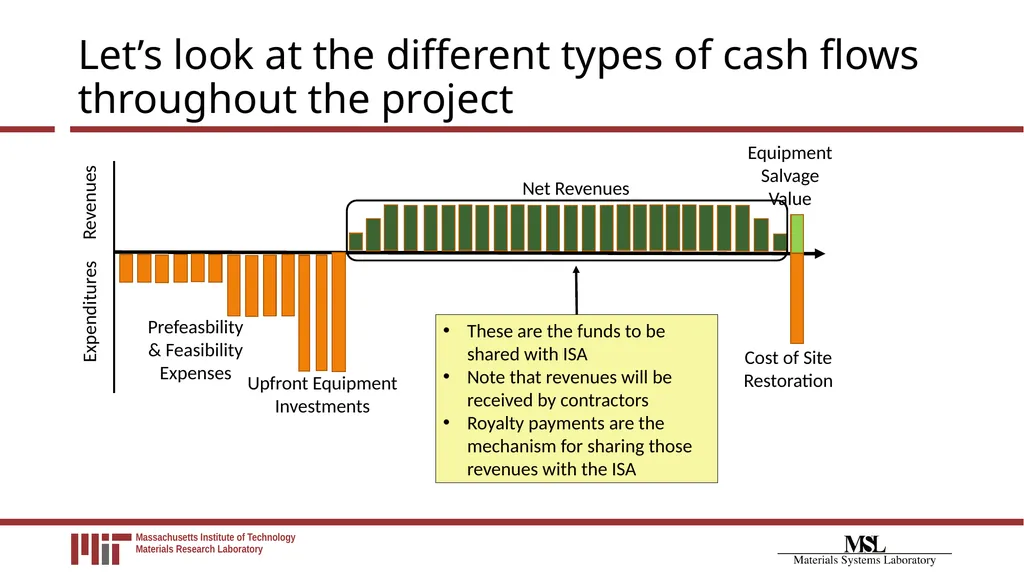
Let’s look at the different types of cash flows throughout the project Revenues Expenditures<br>
08
Let’s look at the different types of cash flows throughout the project Revenues Expenditures Net Revenues These are the funds to be shared with ISA
Note that revenues will be received by contractors
Royalty payments are the mechanism for sharing those revenues with the ISA<br>
Note that revenues will be received by contractors
Royalty payments are the mechanism for sharing those revenues with the ISA<br>
09
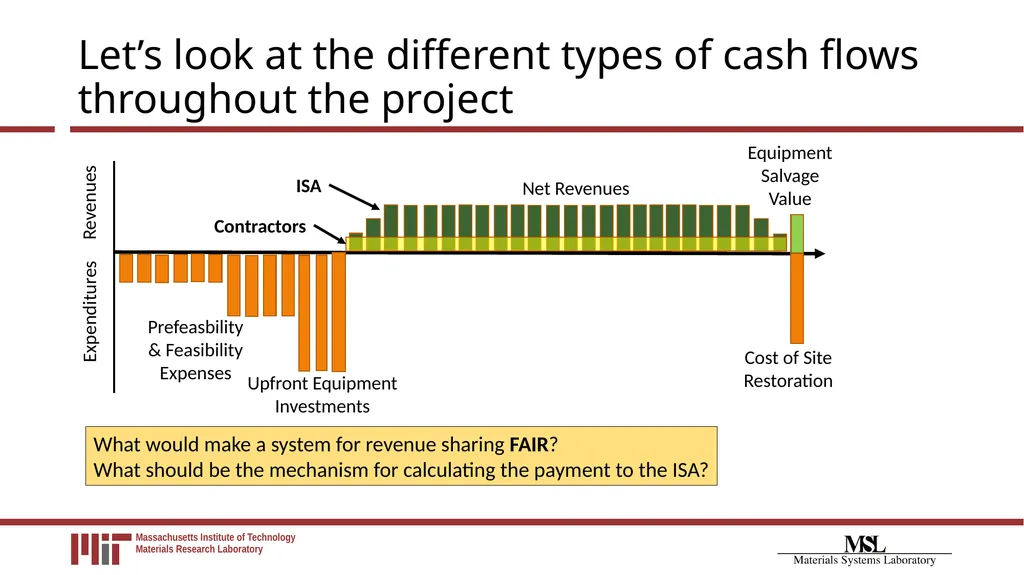
Let’s look at the different types of cash flows throughout the project Revenues Expenditures Net Revenues What would make a system for revenue sharing FAIR?
What should be the mechanism for calculating the payment to the ISA? ISA Contractors<br>
What should be the mechanism for calculating the payment to the ISA? ISA Contractors<br>
10
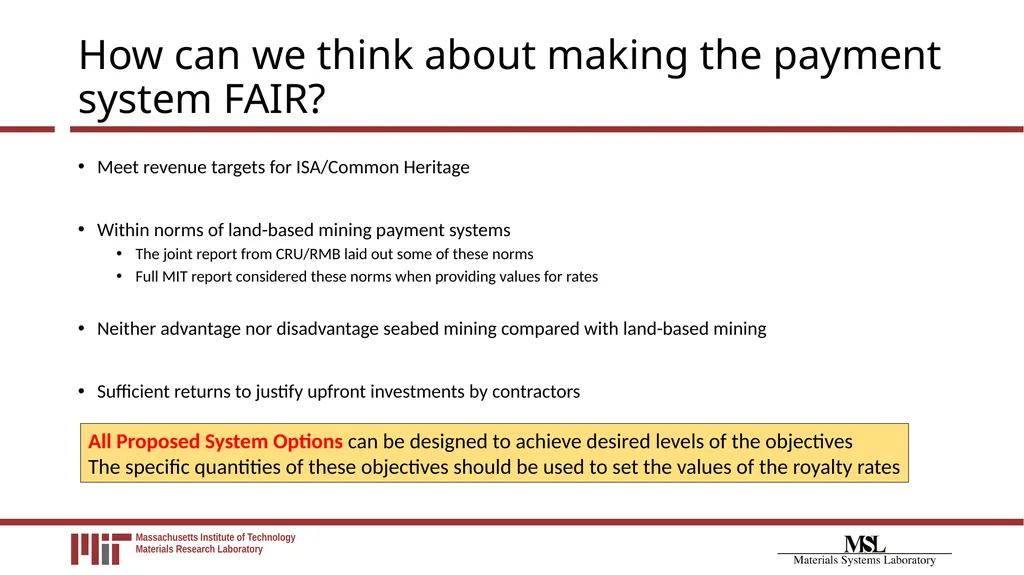
How can we think about making the payment system FAIR? Meet revenue targets for ISA/Common Heritage
Within norms of land-based mining payment systems
The joint report from CRU/RMB laid out some of these norms
Full MIT report considered these norms when providing values for rates
Neither advantage nor disadvantage seabed mining compared with land-based mining
Sufficient returns to justify upfront investments by contractors All Proposed System Options can be designed to achieve desired levels of the objectives
The specific quantities of these objectives should be used to set the values of the royalty rates<br>
Within norms of land-based mining payment systems
The joint report from CRU/RMB laid out some of these norms
Full MIT report considered these norms when providing values for rates
Neither advantage nor disadvantage seabed mining compared with land-based mining
Sufficient returns to justify upfront investments by contractors All Proposed System Options can be designed to achieve desired levels of the objectives
The specific quantities of these objectives should be used to set the values of the royalty rates<br>
11
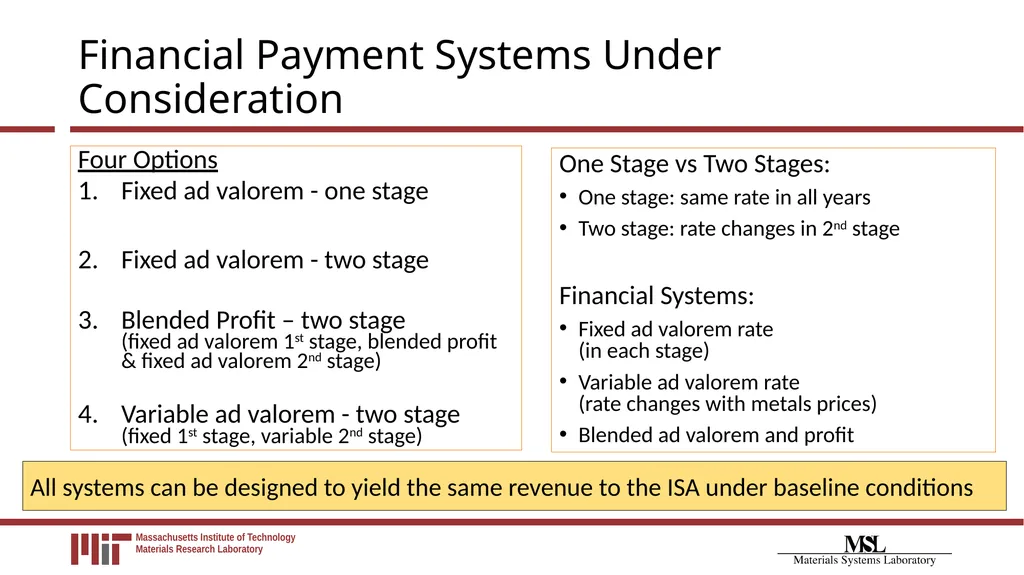
Financial Payment Systems Under Consideration One Stage vs Two Stages:
One stage: same rate in all years
Two stage: rate changes in 2nd stage
Financial Systems:
Fixed ad valorem rate (in each stage)
Variable ad valorem rate (rate changes with metals prices)
Blended ad valorem and profit Four Options
Fixed ad valorem - one stage
Fixed ad valorem - two stage
Blended Profit – two stage (fixed ad valorem 1st stage, blended profit & fixed ad valorem 2nd stage)
Variable ad valorem - two stage (fixed 1st stage, variable 2nd stage) All systems can be designed to yield the same revenue to the ISA under baseline conditions<br>
One stage: same rate in all years
Two stage: rate changes in 2nd stage
Financial Systems:
Fixed ad valorem rate (in each stage)
Variable ad valorem rate (rate changes with metals prices)
Blended ad valorem and profit Four Options
Fixed ad valorem - one stage
Fixed ad valorem - two stage
Blended Profit – two stage (fixed ad valorem 1st stage, blended profit & fixed ad valorem 2nd stage)
Variable ad valorem - two stage (fixed 1st stage, variable 2nd stage) All systems can be designed to yield the same revenue to the ISA under baseline conditions<br>
12
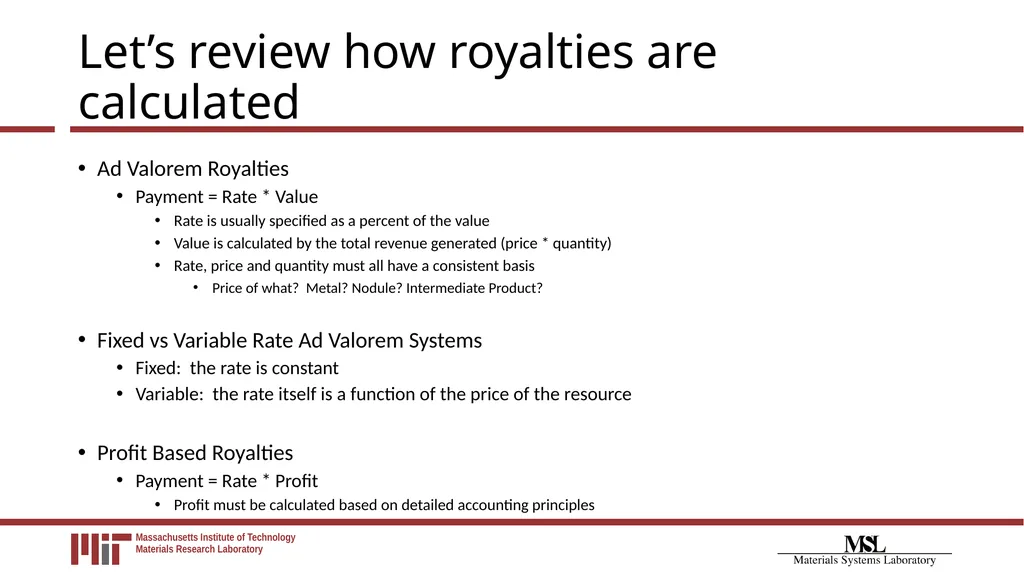
Let’s review how royalties are calculated Ad Valorem Royalties
Payment = Rate * Value
Rate is usually specified as a percent of the value
Value is calculated by the total revenue generated (price * quantity)
Rate, price and quantity must all have a consistent basis
Price of what? Metal? Nodule? Intermediate Product?
Fixed vs Variable Rate Ad Valorem Systems
Fixed: the rate is constant
Variable: the rate itself is a function of the price of the resource
Profit Based Royalties
Payment = Rate * Profit
Profit must be calculated based on detailed accounting principles<br>
Payment = Rate * Value
Rate is usually specified as a percent of the value
Value is calculated by the total revenue generated (price * quantity)
Rate, price and quantity must all have a consistent basis
Price of what? Metal? Nodule? Intermediate Product?
Fixed vs Variable Rate Ad Valorem Systems
Fixed: the rate is constant
Variable: the rate itself is a function of the price of the resource
Profit Based Royalties
Payment = Rate * Profit
Profit must be calculated based on detailed accounting principles<br>
13
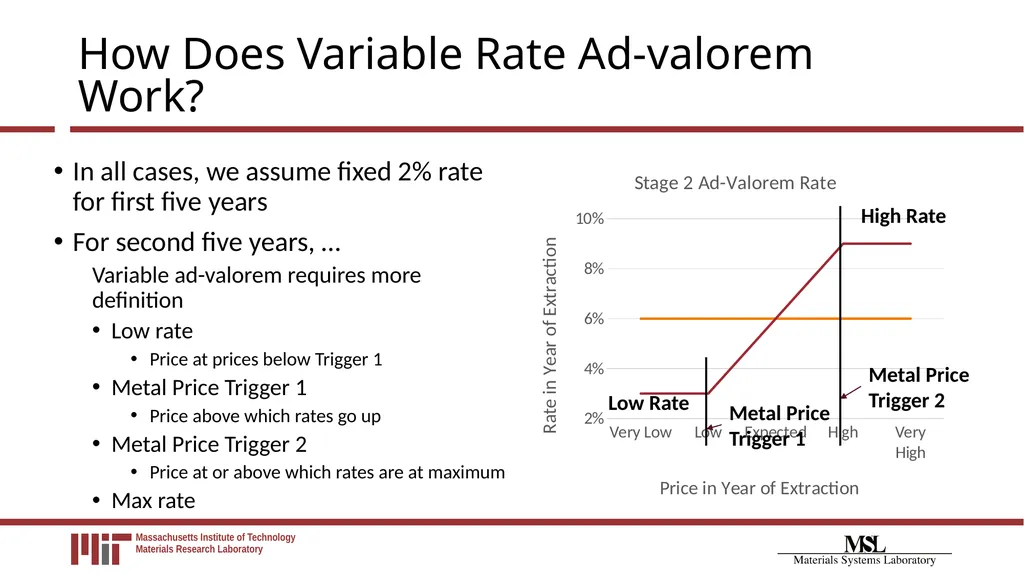
How Does Variable Rate Ad-valorem Work? In all cases, we assume fixed 2% rate for first five years
For second five years, …
Variable ad-valorem requires more definition
Low rate
Price at prices below Trigger 1
Metal Price Trigger 1
Price above which rates go up
Metal Price Trigger 2
Price at or above which rates are at maximum
Max rate Low Rate Metal Price
Trigger 1 Metal Price
Trigger 2 High Rate<br>
For second five years, …
Variable ad-valorem requires more definition
Low rate
Price at prices below Trigger 1
Metal Price Trigger 1
Price above which rates go up
Metal Price Trigger 2
Price at or above which rates are at maximum
Max rate Low Rate Metal Price
Trigger 1 Metal Price
Trigger 2 High Rate<br>
14
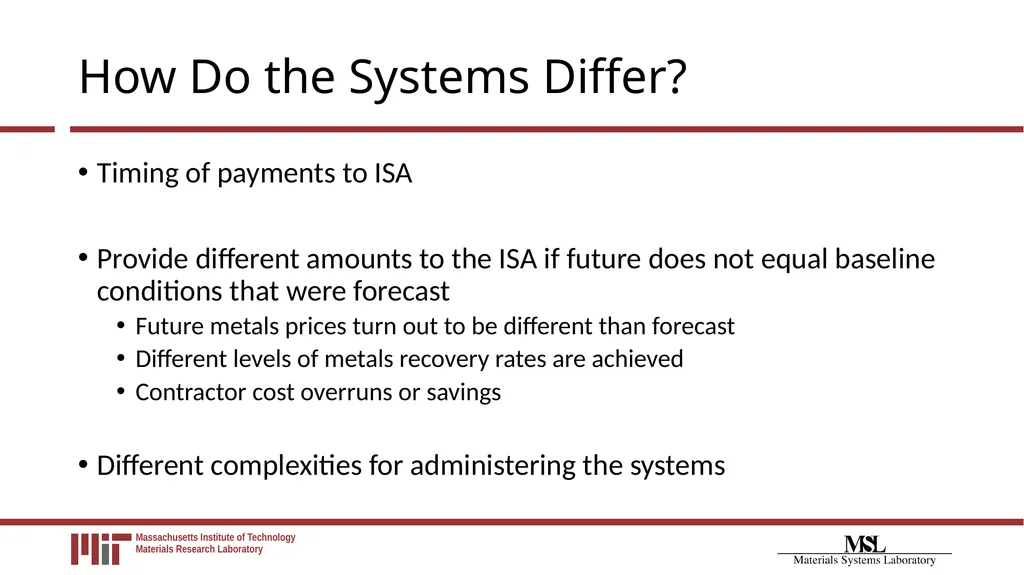
How Do the Systems Differ? Timing of payments to ISA
Provide different amounts to the ISA if future does not equal baseline conditions that were forecast
Future metals prices turn out to be different than forecast
Different levels of metals recovery rates are achieved
Contractor cost overruns or savings
Different complexities for administering the systems<br>
Provide different amounts to the ISA if future does not equal baseline conditions that were forecast
Future metals prices turn out to be different than forecast
Different levels of metals recovery rates are achieved
Contractor cost overruns or savings
Different complexities for administering the systems<br>
15
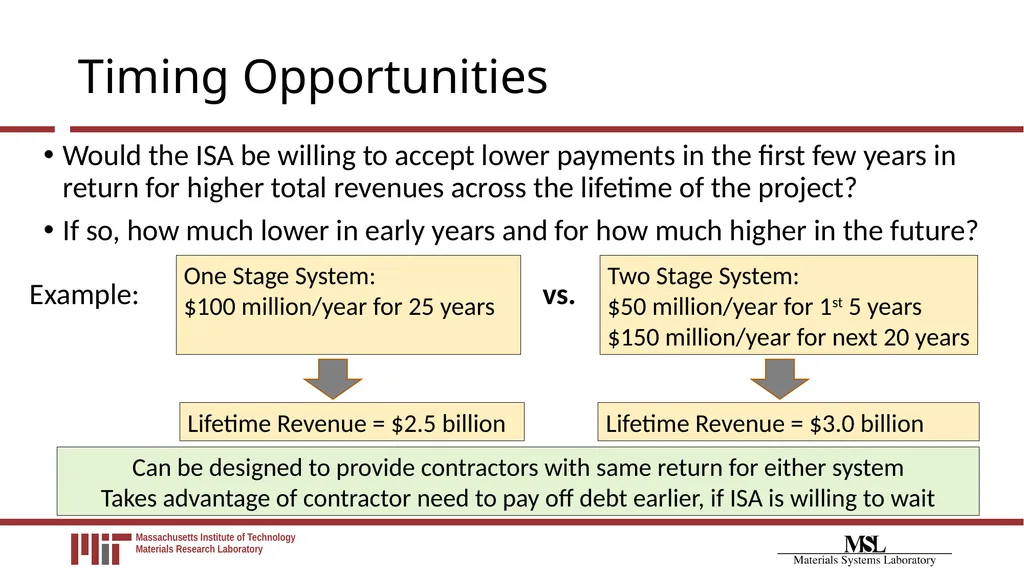
Timing Opportunities Would the ISA be willing to accept lower payments in the first few years in return for higher total revenues across the lifetime of the project?
If so, how much lower in early years and for how much higher in the future? One Stage System:
$100 million/year for 25 years Two Stage System:
$50 million/year for 1st 5 years
$150 million/year for next 20 years Lifetime Revenue = $2.5 billion Lifetime Revenue = $3.0 billion vs. Example: Can be designed to provide contractors with same return for either system
Takes advantage of contractor need to pay off debt earlier, if ISA is willing to wait<br>
If so, how much lower in early years and for how much higher in the future? One Stage System:
$100 million/year for 25 years Two Stage System:
$50 million/year for 1st 5 years
$150 million/year for next 20 years Lifetime Revenue = $2.5 billion Lifetime Revenue = $3.0 billion vs. Example: Can be designed to provide contractors with same return for either system
Takes advantage of contractor need to pay off debt earlier, if ISA is willing to wait<br>
16
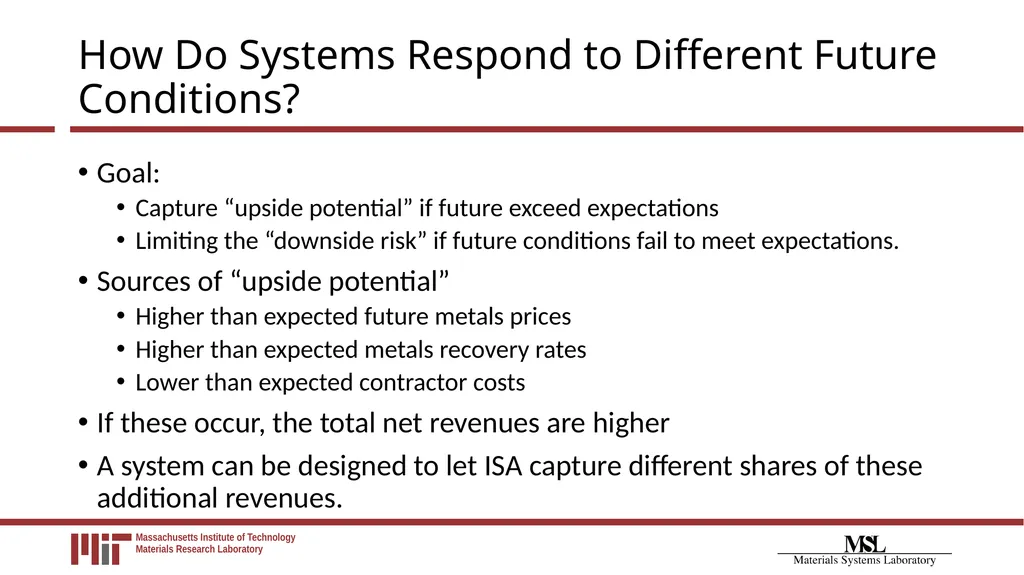
How Do Systems Respond to Different Future Conditions? Goal:
Capture “upside potential” if future exceed expectations
Limiting the “downside risk” if future conditions fail to meet expectations.
Sources of “upside potential”
Higher than expected future metals prices
Higher than expected metals recovery rates
Lower than expected contractor costs
If these occur, the total net revenues are higher
A system can be designed to let ISA capture different shares of these additional revenues.<br>
Capture “upside potential” if future exceed expectations
Limiting the “downside risk” if future conditions fail to meet expectations.
Sources of “upside potential”
Higher than expected future metals prices
Higher than expected metals recovery rates
Lower than expected contractor costs
If these occur, the total net revenues are higher
A system can be designed to let ISA capture different shares of these additional revenues.<br>
17
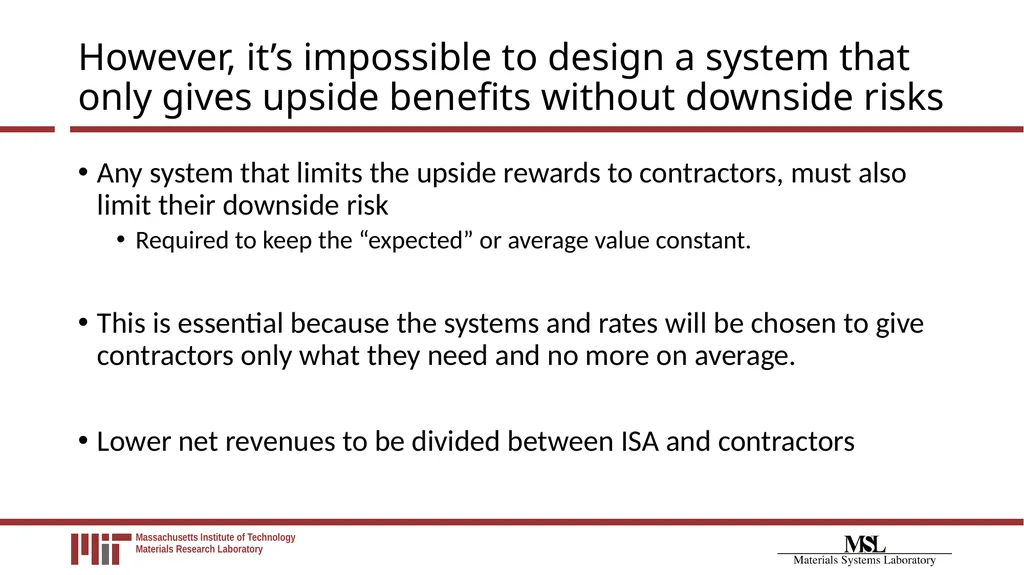
However, it’s impossible to design a system that only gives upside benefits without downside risks Any system that limits the upside rewards to contractors, must also limit their downside risk
Required to keep the “expected” or average value constant.
This is essential because the systems and rates will be chosen to give contractors only what they need and no more on average.
Lower net revenues to be divided between ISA and contractors<br>
Required to keep the “expected” or average value constant.
This is essential because the systems and rates will be chosen to give contractors only what they need and no more on average.
Lower net revenues to be divided between ISA and contractors<br>
18
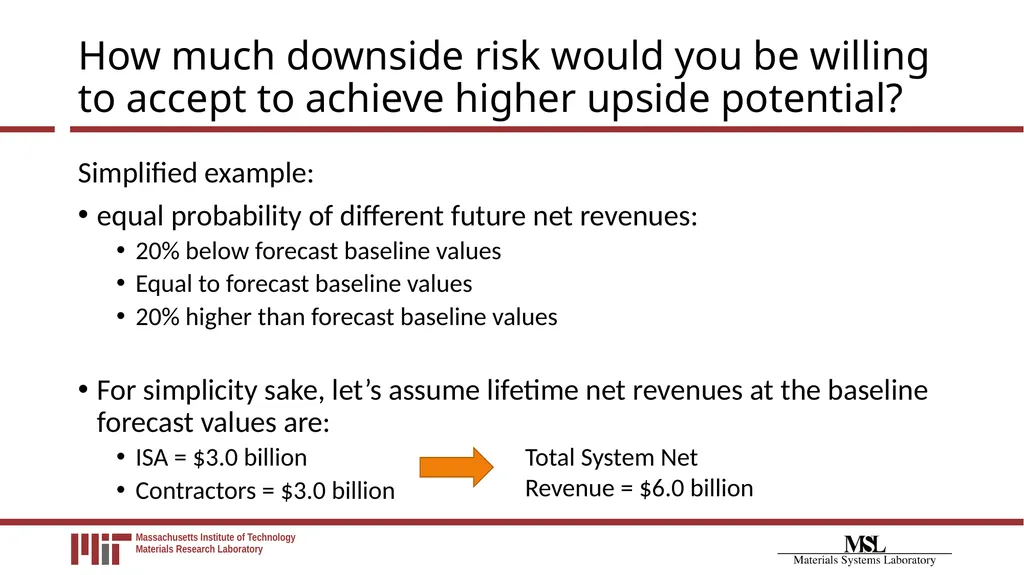
How much downside risk would you be willing to accept to achieve higher upside potential? Simplified example:
equal probability of different future net revenues:
20% below forecast baseline values
Equal to forecast baseline values
20% higher than forecast baseline values
For simplicity sake, let’s assume lifetime net revenues at the baseline forecast values are:
ISA = $3.0 billion
Contractors = $3.0 billion Total System Net Revenue = $6.0 billion<br>
equal probability of different future net revenues:
20% below forecast baseline values
Equal to forecast baseline values
20% higher than forecast baseline values
For simplicity sake, let’s assume lifetime net revenues at the baseline forecast values are:
ISA = $3.0 billion
Contractors = $3.0 billion Total System Net Revenue = $6.0 billion<br>
19
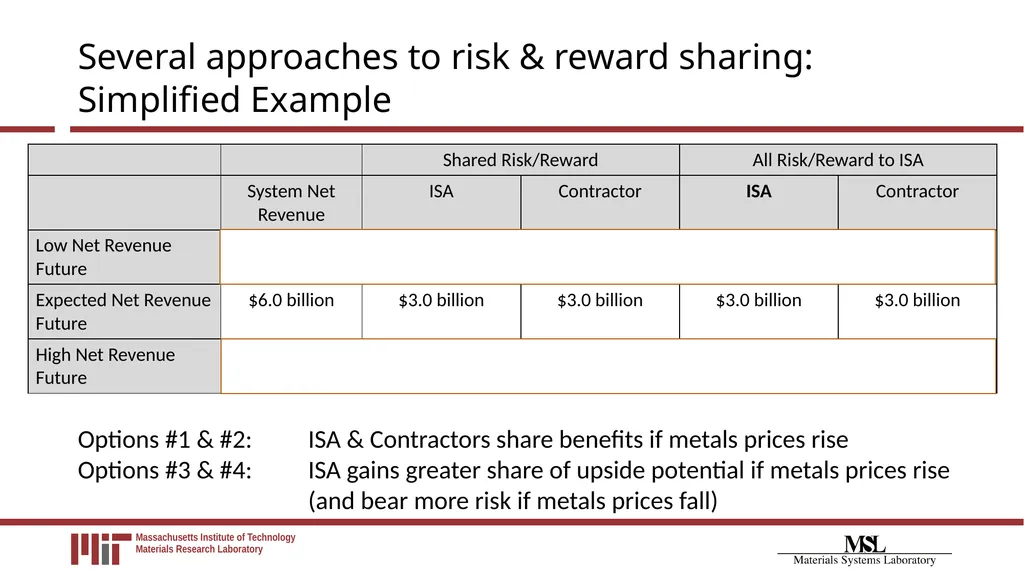
Several approaches to risk & reward sharing:
Simplified Example Options #1 & #2: ISA & Contractors share benefits if metals prices rise
Options #3 & #4: ISA gains greater share of upside potential if metals prices rise (and bear more risk if metals prices fall)<br>
Options #3 & #4: ISA gains greater share of upside potential if metals prices rise (and bear more risk if metals prices fall)<br>
20
Adminstrative Complexity:
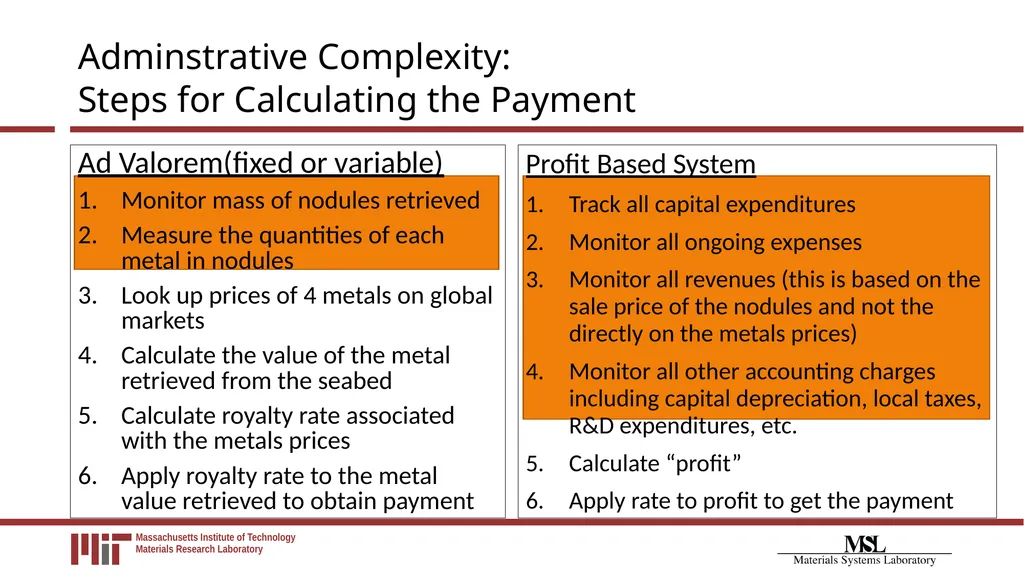
Steps for Calculating the Payment Ad Valorem(fixed or variable)
Monitor mass of nodules retrieved
Measure the quantities of each metal in nodules
Look up prices of 4 metals on global markets
Calculate the value of the metal retrieved from the seabed
Calculate royalty rate associated with the metals prices
Apply royalty rate to the metal value retrieved to obtain payment Profit Based System
Track all capital expenditures
Monitor all ongoing expenses
Monitor all revenues (this is based on the sale price of the nodules and not the directly on the metals prices)
Monitor all other accounting charges including capital depreciation, local taxes, R&D expenditures, etc.
Calculate “profit”
Apply rate to profit to get the payment<br>
Monitor mass of nodules retrieved
Measure the quantities of each metal in nodules
Look up prices of 4 metals on global markets
Calculate the value of the metal retrieved from the seabed
Calculate royalty rate associated with the metals prices
Apply royalty rate to the metal value retrieved to obtain payment Profit Based System
Track all capital expenditures
Monitor all ongoing expenses
Monitor all revenues (this is based on the sale price of the nodules and not the directly on the metals prices)
Monitor all other accounting charges including capital depreciation, local taxes, R&D expenditures, etc.
Calculate “profit”
Apply rate to profit to get the payment<br>
21
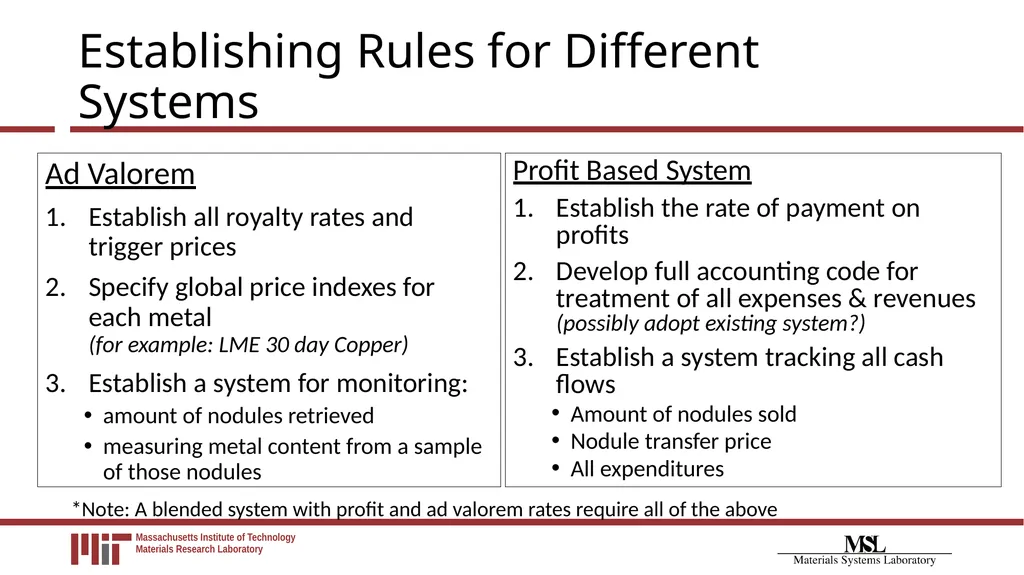
Establishing Rules for Different Systems Ad Valorem
Establish all royalty rates and trigger prices
Specify global price indexes for each metal (for example: LME 30 day Copper)
Establish a system for monitoring:
amount of nodules retrieved
measuring metal content from a sample of those nodules Profit Based System
Establish the rate of payment on profits
Develop full accounting code for treatment of all expenses & revenues (possibly adopt existing system?)
Establish a system tracking all cash flows
Amount of nodules sold
Nodule transfer price
All expenditures *Note: A blended system with profit and ad valorem rates require all of the above<br>
Establish all royalty rates and trigger prices
Specify global price indexes for each metal (for example: LME 30 day Copper)
Establish a system for monitoring:
amount of nodules retrieved
measuring metal content from a sample of those nodules Profit Based System
Establish the rate of payment on profits
Develop full accounting code for treatment of all expenses & revenues (possibly adopt existing system?)
Establish a system tracking all cash flows
Amount of nodules sold
Nodule transfer price
All expenditures *Note: A blended system with profit and ad valorem rates require all of the above<br>
22
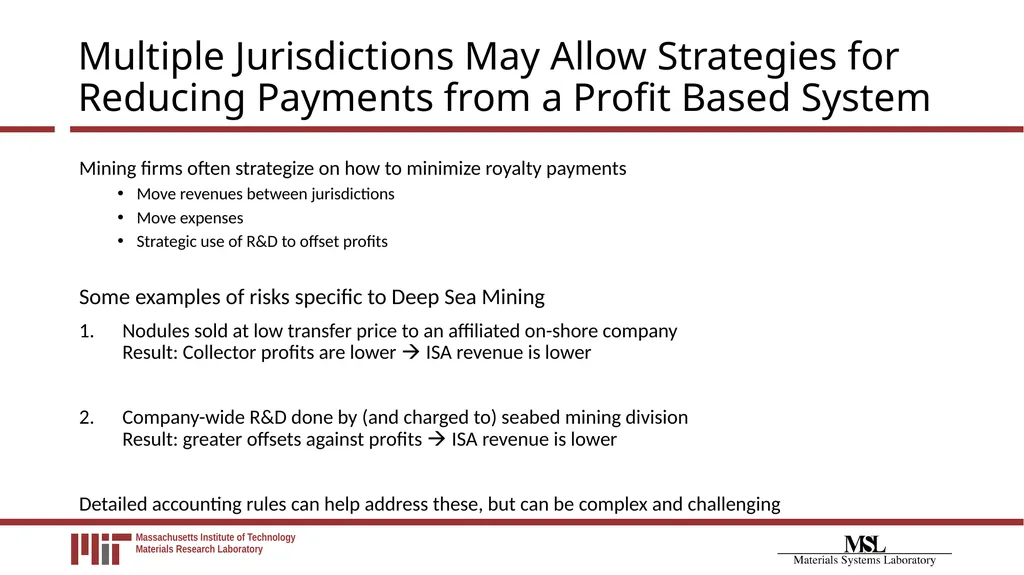
Multiple Jurisdictions May Allow Strategies for Reducing Payments from a Profit Based System Mining firms often strategize on how to minimize royalty payments
Move revenues between jurisdictions
Move expenses
Strategic use of R&D to offset profits
Some examples of risks specific to Deep Sea Mining
Nodules sold at low transfer price to an affiliated on-shore company Result: Collector profits are lower ISA revenue is lower
Company-wide R&D done by (and charged to) seabed mining division Result: greater offsets against profits ISA revenue is lower
Detailed accounting rules can help address these, but can be complex and challenging<br>
Move revenues between jurisdictions
Move expenses
Strategic use of R&D to offset profits
Some examples of risks specific to Deep Sea Mining
Nodules sold at low transfer price to an affiliated on-shore company Result: Collector profits are lower ISA revenue is lower
Company-wide R&D done by (and charged to) seabed mining division Result: greater offsets against profits ISA revenue is lower
Detailed accounting rules can help address these, but can be complex and challenging<br>
23
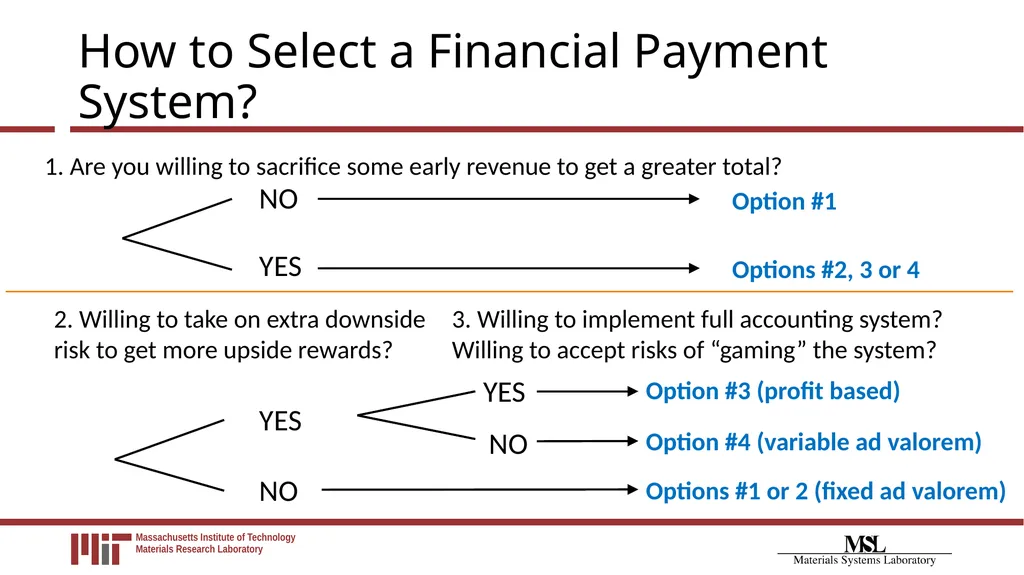
How to Select a Financial Payment System? 1. Are you willing to sacrifice some early revenue to get a greater total? 3. Willing to implement full accounting system? Willing to accept risks of “gaming” the system? NO YES YES NO 2. Willing to take on extra downside risk to get more upside rewards? YES NO Option #1 Options #2, 3 or 4 Option #3 (profit based) Option #4 (variable ad valorem) Options #1 or 2 (fixed ad valorem)<br>
24
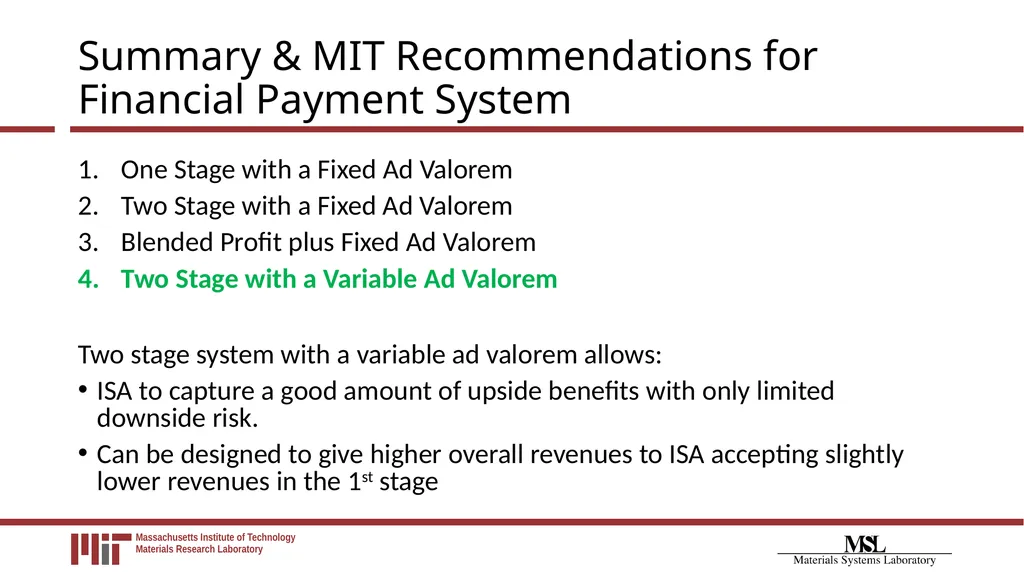
Summary & MIT Recommendations for Financial Payment System One Stage with a Fixed Ad Valorem
Two Stage with a Fixed Ad Valorem
Blended Profit plus Fixed Ad Valorem
Two Stage with a Variable Ad Valorem
Two stage system with a variable ad valorem allows:
ISA to capture a good amount of upside benefits with only limited downside risk.
Can be designed to give higher overall revenues to ISA accepting slightly lower revenues in the 1st stage<br>
Two Stage with a Fixed Ad Valorem
Blended Profit plus Fixed Ad Valorem
Two Stage with a Variable Ad Valorem
Two stage system with a variable ad valorem allows:
ISA to capture a good amount of upside benefits with only limited downside risk.
Can be designed to give higher overall revenues to ISA accepting slightly lower revenues in the 1st stage<br>
25
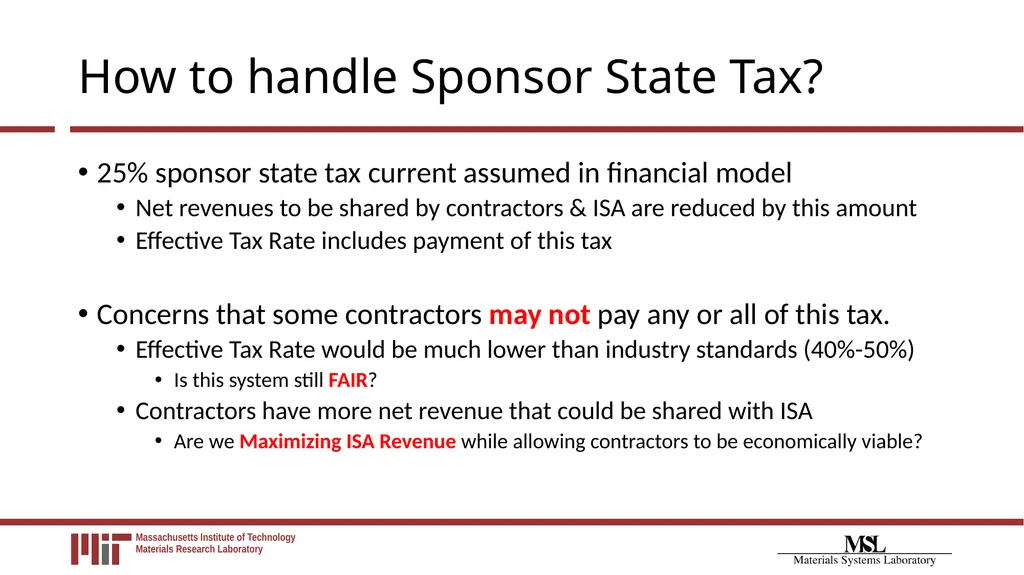
How to handle Sponsor State Tax? 25% sponsor state tax current assumed in financial model
Net revenues to be shared by contractors & ISA are reduced by this amount
Effective Tax Rate includes payment of this tax
Concerns that some contractors may not pay any or all of this tax.
Effective Tax Rate would be much lower than industry standards (40%-50%)
Is this system still FAIR?
Contractors have more net revenue that could be shared with ISA
Are we Maximizing ISA Revenue while allowing contractors to be economically viable?<br>
Net revenues to be shared by contractors & ISA are reduced by this amount
Effective Tax Rate includes payment of this tax
Concerns that some contractors may not pay any or all of this tax.
Effective Tax Rate would be much lower than industry standards (40%-50%)
Is this system still FAIR?
Contractors have more net revenue that could be shared with ISA
Are we Maximizing ISA Revenue while allowing contractors to be economically viable?<br>
26
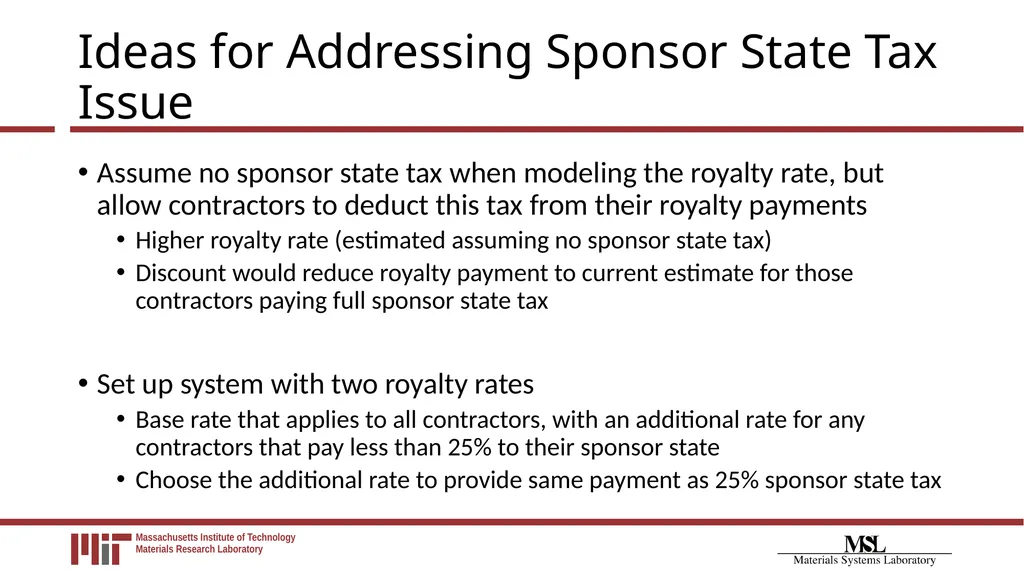
Ideas for Addressing Sponsor State Tax Issue Assume no sponsor state tax when modeling the royalty rate, but allow contractors to deduct this tax from their royalty payments
Higher royalty rate (estimated assuming no sponsor state tax)
Discount would reduce royalty payment to current estimate for those contractors paying full sponsor state tax
Set up system with two royalty rates
Base rate that applies to all contractors, with an additional rate for any contractors that pay less than 25% to their sponsor state
Choose the additional rate to provide same payment as 25% sponsor state tax<br>
Higher royalty rate (estimated assuming no sponsor state tax)
Discount would reduce royalty payment to current estimate for those contractors paying full sponsor state tax
Set up system with two royalty rates
Base rate that applies to all contractors, with an additional rate for any contractors that pay less than 25% to their sponsor state
Choose the additional rate to provide same payment as 25% sponsor state tax<br>
27
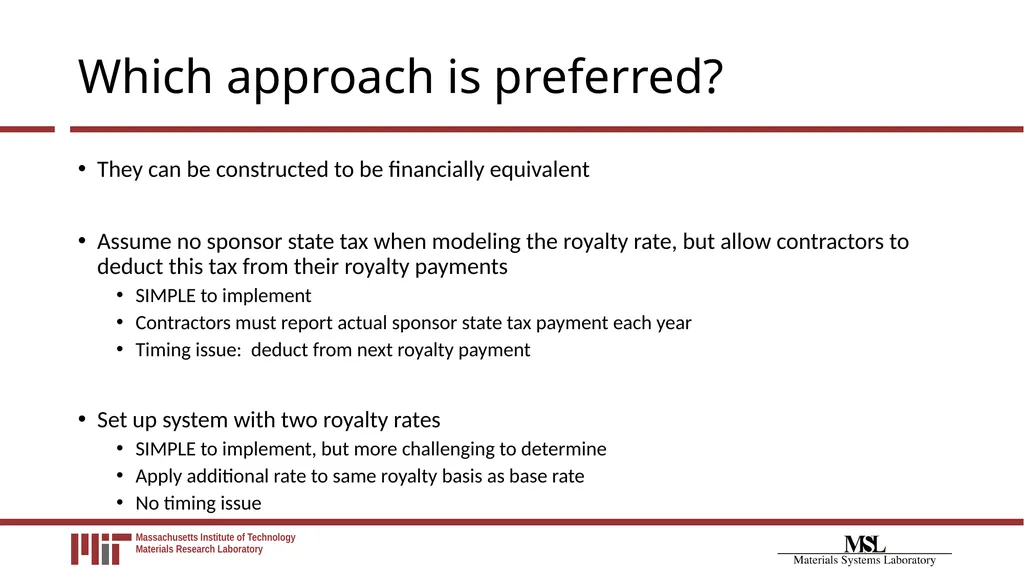
Which approach is preferred? They can be constructed to be financially equivalent
Assume no sponsor state tax when modeling the royalty rate, but allow contractors to deduct this tax from their royalty payments
SIMPLE to implement
Contractors must report actual sponsor state tax payment each year
Timing issue: deduct from next royalty payment
Set up system with two royalty rates
SIMPLE to implement, but more challenging to determine
Apply additional rate to same royalty basis as base rate
No timing issue<br>
Assume no sponsor state tax when modeling the royalty rate, but allow contractors to deduct this tax from their royalty payments
SIMPLE to implement
Contractors must report actual sponsor state tax payment each year
Timing issue: deduct from next royalty payment
Set up system with two royalty rates
SIMPLE to implement, but more challenging to determine
Apply additional rate to same royalty basis as base rate
No timing issue<br>
28
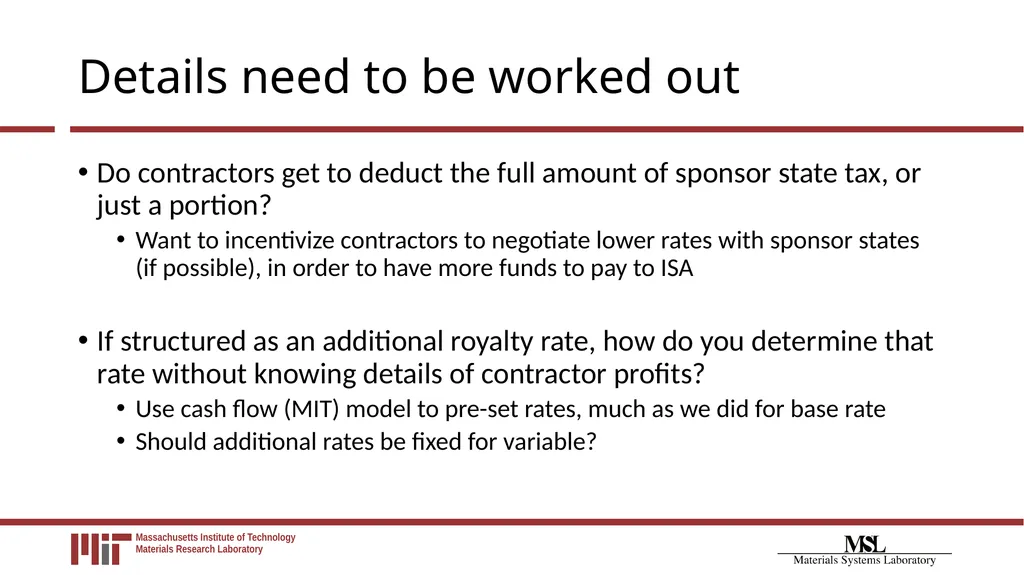
Details need to be worked out Do contractors get to deduct the full amount of sponsor state tax, or just a portion?
Want to incentivize contractors to negotiate lower rates with sponsor states (if possible), in order to have more funds to pay to ISA
If structured as an additional royalty rate, how do you determine that rate without knowing details of contractor profits?
Use cash flow (MIT) model to pre-set rates, much as we did for base rate
Should additional rates be fixed for variable?<br>
Want to incentivize contractors to negotiate lower rates with sponsor states (if possible), in order to have more funds to pay to ISA
If structured as an additional royalty rate, how do you determine that rate without knowing details of contractor profits?
Use cash flow (MIT) model to pre-set rates, much as we did for base rate
Should additional rates be fixed for variable?<br>
29
Nodule Value Determination
Issue of Manganese<br>
30
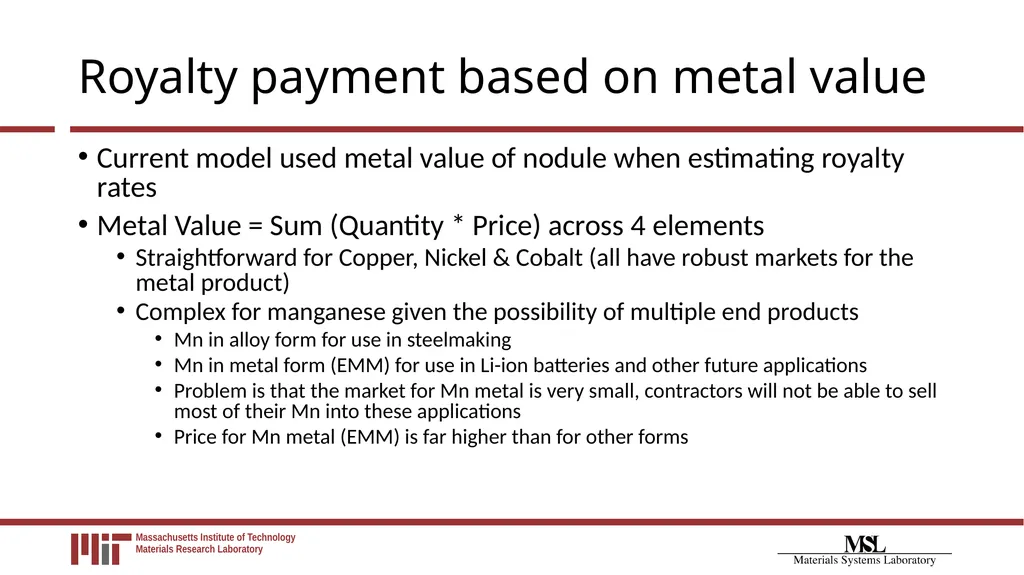
Royalty payment based on metal value Current model used metal value of nodule when estimating royalty rates
Metal Value = Sum (Quantity * Price) across 4 elements
Straightforward for Copper, Nickel & Cobalt (all have robust markets for the metal product)
Complex for manganese given the possibility of multiple end products
Mn in alloy form for use in steelmaking
Mn in metal form (EMM) for use in Li-ion batteries and other future applications
Problem is that the market for Mn metal is very small, contractors will not be able to sell most of their Mn into these applications
Price for Mn metal (EMM) is far higher than for other forms<br>
Metal Value = Sum (Quantity * Price) across 4 elements
Straightforward for Copper, Nickel & Cobalt (all have robust markets for the metal product)
Complex for manganese given the possibility of multiple end products
Mn in alloy form for use in steelmaking
Mn in metal form (EMM) for use in Li-ion batteries and other future applications
Problem is that the market for Mn metal is very small, contractors will not be able to sell most of their Mn into these applications
Price for Mn metal (EMM) is far higher than for other forms<br>
31
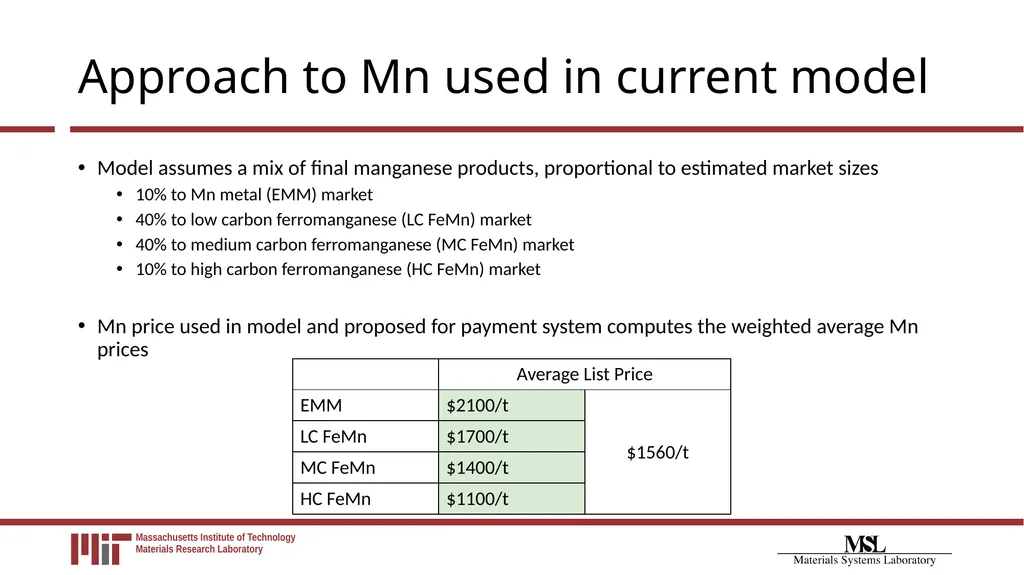
Approach to Mn used in current model Model assumes a mix of final manganese products, proportional to estimated market sizes
10% to Mn metal (EMM) market
40% to low carbon ferromanganese (LC FeMn) market
40% to medium carbon ferromanganese (MC FeMn) market
10% to high carbon ferromanganese (HC FeMn) market
Mn price used in model and proposed for payment system computes the weighted average Mn prices<br>
10% to Mn metal (EMM) market
40% to low carbon ferromanganese (LC FeMn) market
40% to medium carbon ferromanganese (MC FeMn) market
10% to high carbon ferromanganese (HC FeMn) market
Mn price used in model and proposed for payment system computes the weighted average Mn prices<br>
32
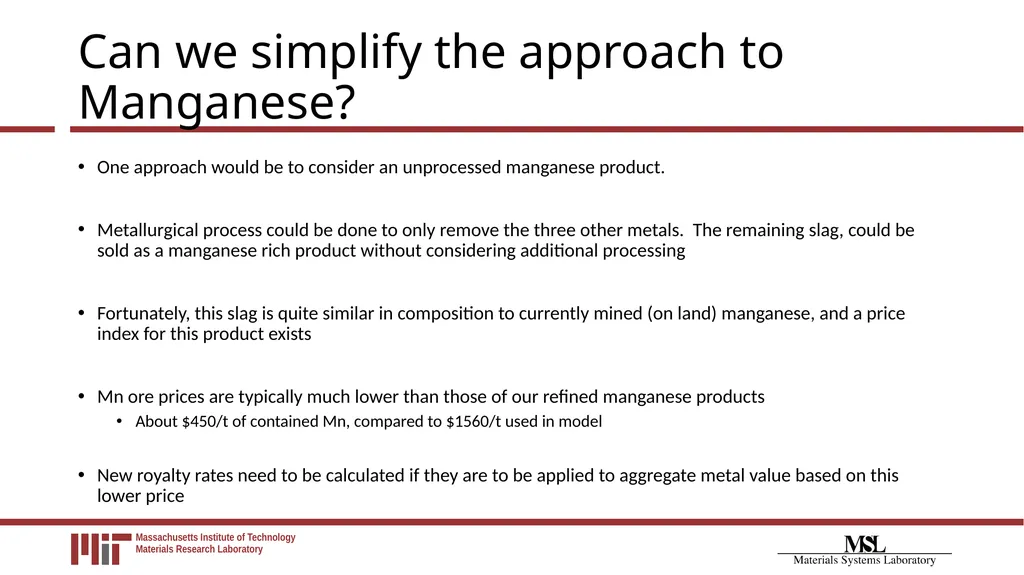
Can we simplify the approach to Manganese? One approach would be to consider an unprocessed manganese product.
Metallurgical process could be done to only remove the three other metals. The remaining slag, could be sold as a manganese rich product without considering additional processing
Fortunately, this slag is quite similar in composition to currently mined (on land) manganese, and a price index for this product exists
Mn ore prices are typically much lower than those of our refined manganese products
About $450/t of contained Mn, compared to $1560/t used in model
New royalty rates need to be calculated if they are to be applied to aggregate metal value based on this lower price<br>
Metallurgical process could be done to only remove the three other metals. The remaining slag, could be sold as a manganese rich product without considering additional processing
Fortunately, this slag is quite similar in composition to currently mined (on land) manganese, and a price index for this product exists
Mn ore prices are typically much lower than those of our refined manganese products
About $450/t of contained Mn, compared to $1560/t used in model
New royalty rates need to be calculated if they are to be applied to aggregate metal value based on this lower price<br>
33
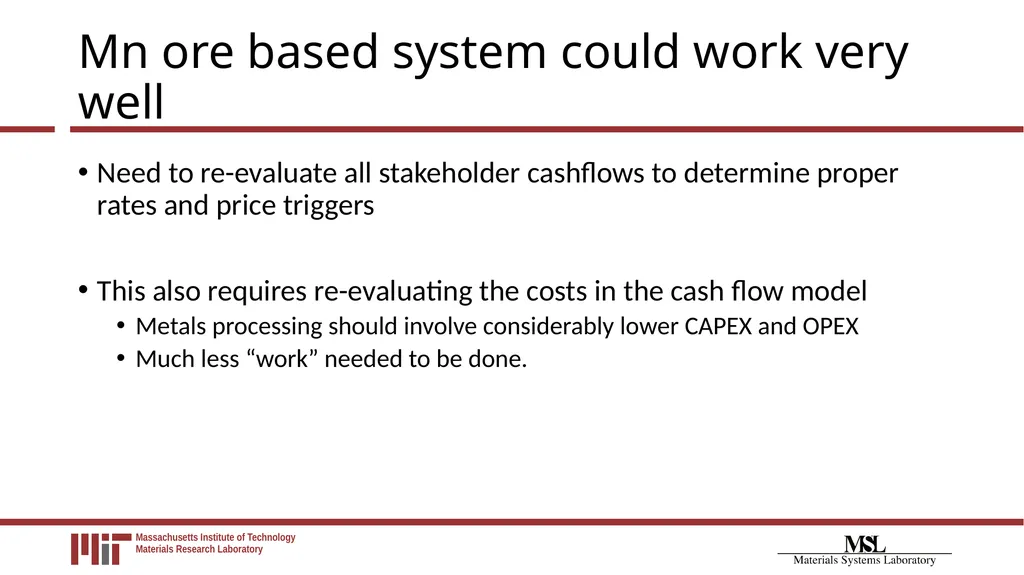
Mn ore based system could work very well Need to re-evaluate all stakeholder cashflows to determine proper rates and price triggers
This also requires re-evaluating the costs in the cash flow model
Metals processing should involve considerably lower CAPEX and OPEX
Much less “work” needed to be done.<br>
This also requires re-evaluating the costs in the cash flow model
Metals processing should involve considerably lower CAPEX and OPEX
Much less “work” needed to be done.<br>
34
Mn Issue?
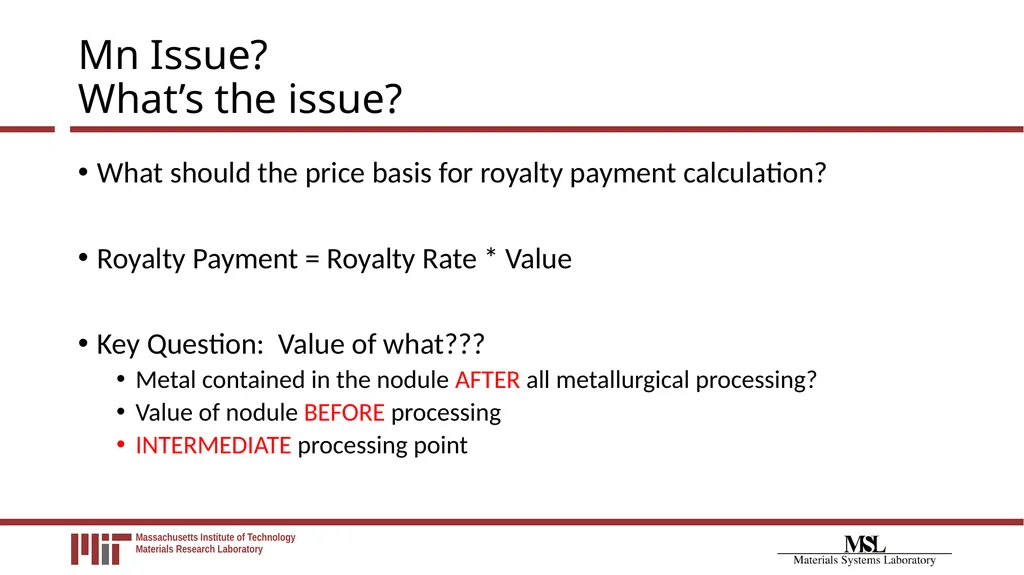
What’s the issue? What should the price basis for royalty payment calculation?
Royalty Payment = Royalty Rate * Value
Key Question: Value of what???
Metal contained in the nodule AFTER all metallurgical processing?
Value of nodule BEFORE processing
INTERMEDIATE processing point<br>
Royalty Payment = Royalty Rate * Value
Key Question: Value of what???
Metal contained in the nodule AFTER all metallurgical processing?
Value of nodule BEFORE processing
INTERMEDIATE processing point<br>
35
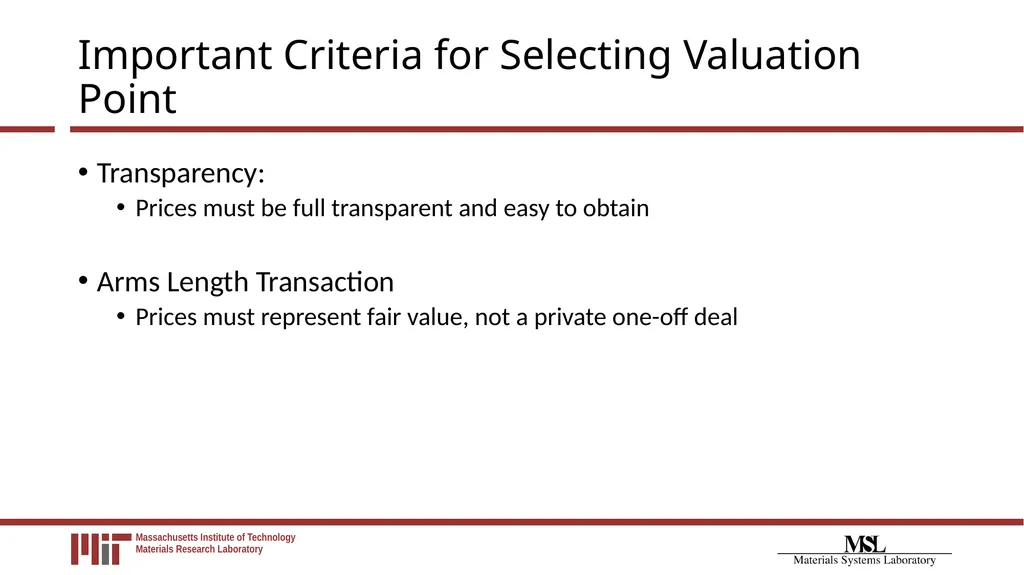
Important Criteria for Selecting Valuation Point Transparency:
Prices must be full transparent and easy to obtain
Arms Length Transaction
Prices must represent fair value, not a private one-off deal<br>
Prices must be full transparent and easy to obtain
Arms Length Transaction
Prices must represent fair value, not a private one-off deal<br>
36
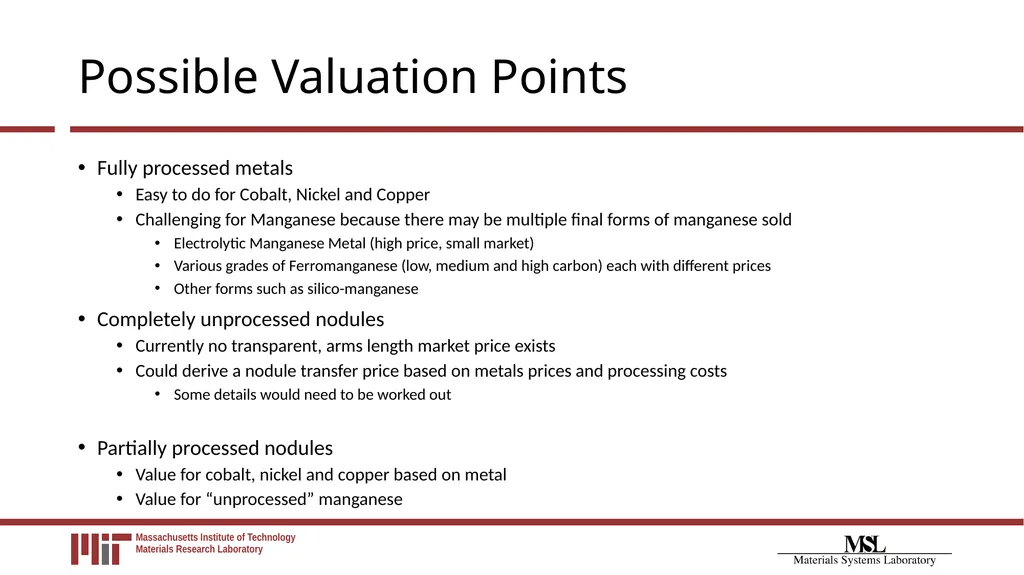
Possible Valuation Points Fully processed metals
Easy to do for Cobalt, Nickel and Copper
Challenging for Manganese because there may be multiple final forms of manganese sold
Electrolytic Manganese Metal (high price, small market)
Various grades of Ferromanganese (low, medium and high carbon) each with different prices
Other forms such as silico-manganese
Completely unprocessed nodules
Currently no transparent, arms length market price exists
Could derive a nodule transfer price based on metals prices and processing costs
Some details would need to be worked out
Partially processed nodules
Value for cobalt, nickel and copper based on metal
Value for “unprocessed” manganese<br>
Easy to do for Cobalt, Nickel and Copper
Challenging for Manganese because there may be multiple final forms of manganese sold
Electrolytic Manganese Metal (high price, small market)
Various grades of Ferromanganese (low, medium and high carbon) each with different prices
Other forms such as silico-manganese
Completely unprocessed nodules
Currently no transparent, arms length market price exists
Could derive a nodule transfer price based on metals prices and processing costs
Some details would need to be worked out
Partially processed nodules
Value for cobalt, nickel and copper based on metal
Value for “unprocessed” manganese<br>
37
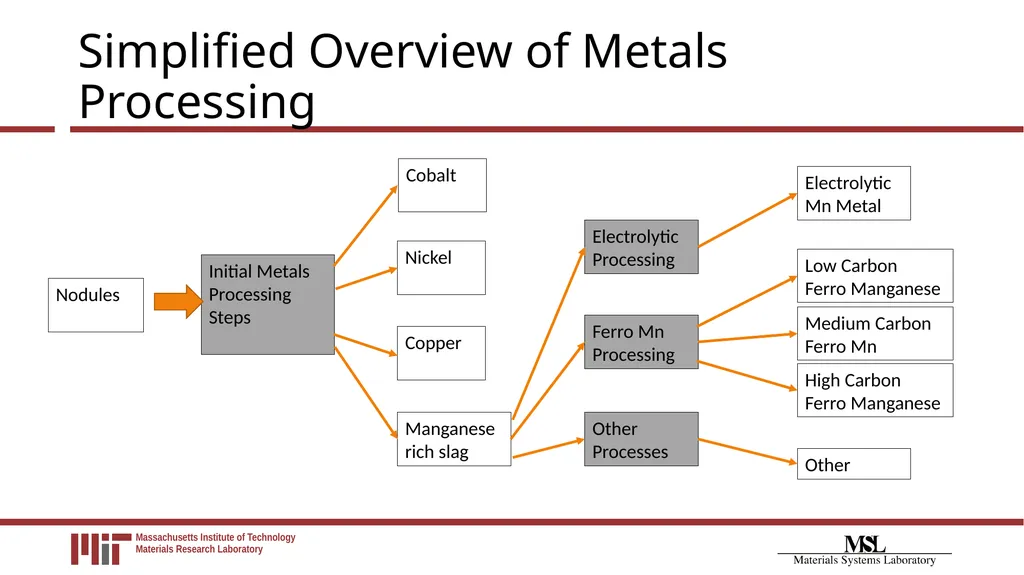
Simplified Overview of Metals Processing Initial Metals Processing Steps Nodules Nickel Cobalt Copper Manganese rich slag Electrolytic Processing Other Processes Ferro Mn Processing Electrolytic Mn Metal Low Carbon
Ferro Manganese Medium Carbon
Ferro Mn High Carbon Ferro Manganese Other<br>
Ferro Manganese Medium Carbon
Ferro Mn High Carbon Ferro Manganese Other<br>
38
Current Model Approach:
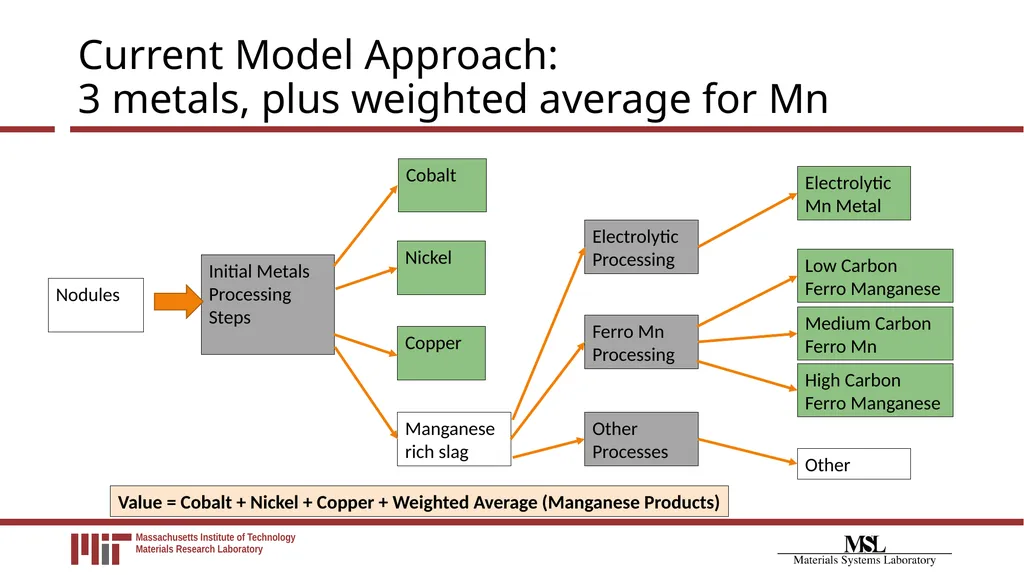
3 metals, plus weighted average for Mn Initial Metals Processing Steps Nodules Nickel Cobalt Copper Manganese rich slag Electrolytic Processing Other Processes Ferro Mn Processing Electrolytic Mn Metal Low Carbon
Ferro Manganese Medium Carbon
Ferro Mn High Carbon Ferro Manganese Other Value = Cobalt + Nickel + Copper + Weighted Average (Manganese Products)<br>
Ferro Manganese Medium Carbon
Ferro Mn High Carbon Ferro Manganese Other Value = Cobalt + Nickel + Copper + Weighted Average (Manganese Products)<br>
39
Mn ore or Mn rich slag approach Initial Metals Processing Steps Nodules Nickel Cobalt Copper Manganese rich slag Electrolytic Processing Other Processes Ferro Mn Processing Electrolytic Mn Metal Low Carbon
Ferro Manganese Medium Carbon
Ferro Mn High Carbon Ferro Manganese Other Value = Cobalt + Nickel + Copper + Mn Rich Slag<br>
Ferro Manganese Medium Carbon
Ferro Mn High Carbon Ferro Manganese Other Value = Cobalt + Nickel + Copper + Mn Rich Slag<br>
40
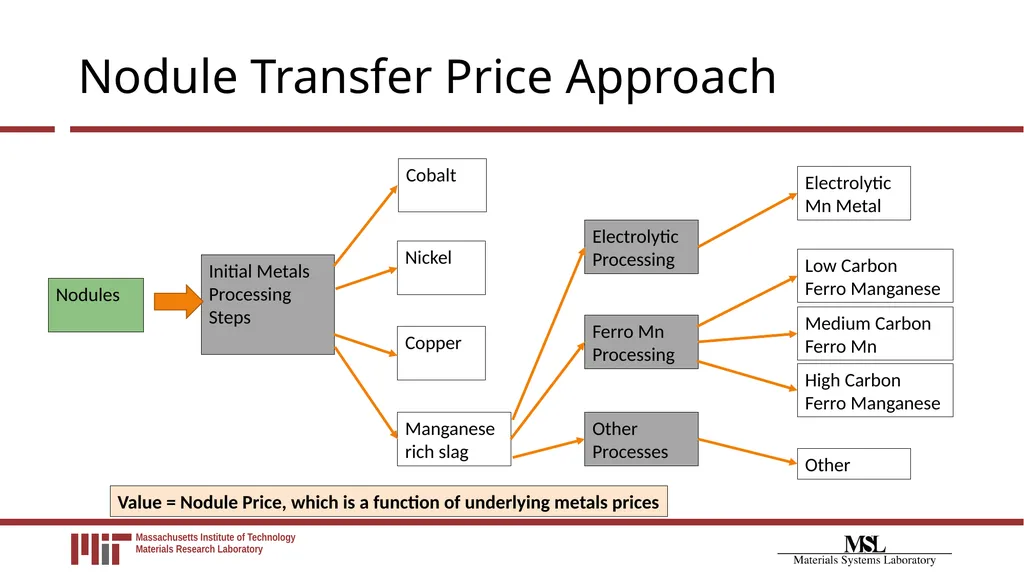
Nodule Transfer Price Approach Initial Metals Processing Steps Nodules Nickel Cobalt Copper Manganese rich slag Electrolytic Processing Other Processes Ferro Mn Processing Electrolytic Mn Metal Low Carbon
Ferro Manganese Medium Carbon
Ferro Mn High Carbon Ferro Manganese Other Value = Nodule Price, which is a function of underlying metals prices<br>
Ferro Manganese Medium Carbon
Ferro Mn High Carbon Ferro Manganese Other Value = Nodule Price, which is a function of underlying metals prices<br>