
Fixed Route Quality of Service Presentation


Description: Fixed Route Quality of Service Presentation Overview Learning objectives Performance points of view Quality of service factors Quality of service framework Quality of service measures Applications Learning Objectives Gain an understanding
Related Topics
Download Presentation
"Fixed Route Quality of Service Presentation" is the property of its rightful owner. Permission is granted to download and print the materials on this website for personal, non-commercial use only, and to display it on your personal computer provided you do not modify the materials and that you retain all copyright notices contained in the materials. By downloading content from our website, you accept the terms of this agreement.
Presentation Transcript
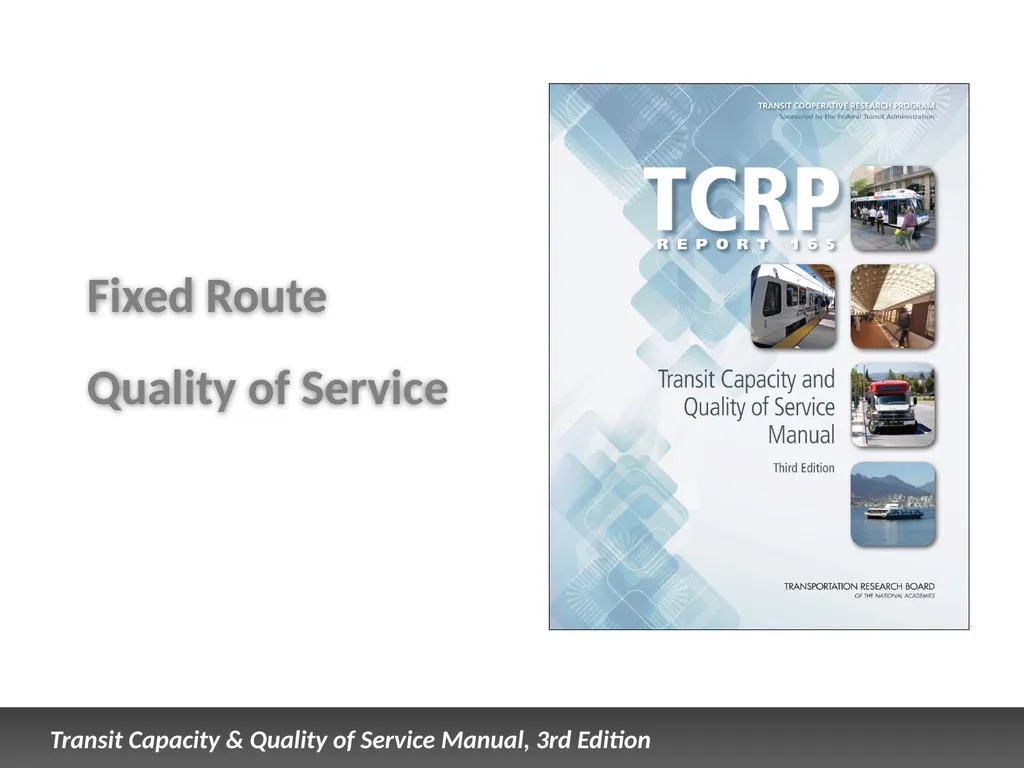
slide1. Fixed Route
Quality of Service<br>
slide2. Presentation Overview Learning objectives
Performance points of view
Quality of service factors
Quality of service framework
Quality of service measures
Applications<br>
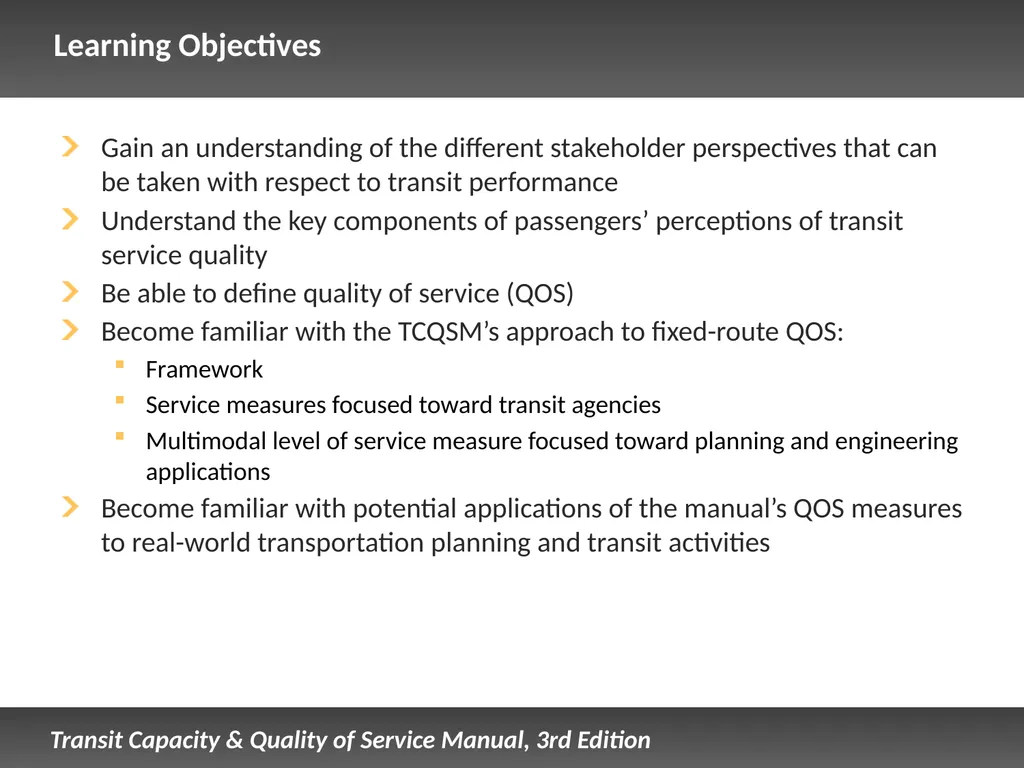
slide3. Learning Objectives Gain an understanding of the different stakeholder perspectives that can be taken with respect to transit performance
Understand the key components of passengers’ perceptions of transit service quality
Be able to define quality of service (QOS)
Become familiar with the TCQSM’s approach to fixed-route QOS:
Framework
Service measures focused toward transit agencies
Multimodal level of service measure focused toward planning and engineering applications
Become familiar with potential applications of the manual’s QOS measures to real-world transportation planning and transit activities<br>
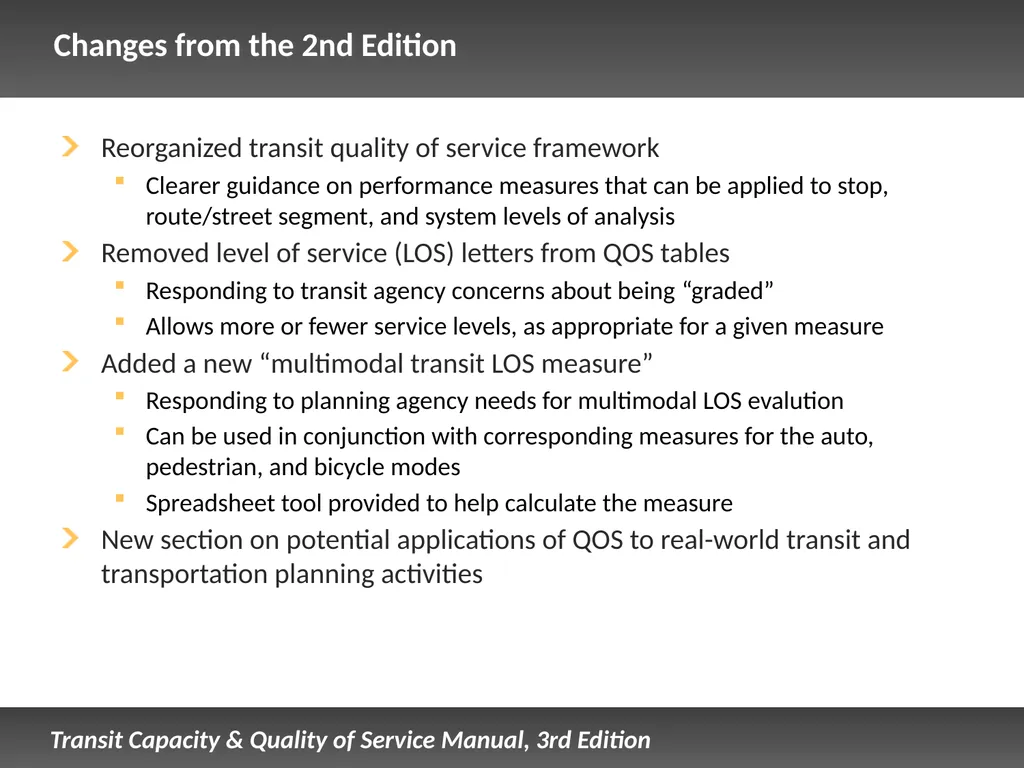
slide4. Changes from the 2nd Edition Reorganized transit quality of service framework
Clearer guidance on performance measures that can be applied to stop, route/street segment, and system levels of analysis
Removed level of service (LOS) letters from QOS tables
Responding to transit agency concerns about being “graded”
Allows more or fewer service levels, as appropriate for a given measure
Added a new “multimodal transit LOS measure”
Responding to planning agency needs for multimodal LOS evalution
Can be used in conjunction with corresponding measures for the auto, pedestrian, and bicycle modes
Spreadsheet tool provided to help calculate the measure
New section on potential applications of QOS to real-world transit and transportation planning activities<br>
slide5. Performance Points of View<br>
slide6. Transit Performance Viewpoints What aspects of transit performance might each of these groups be most interested in?
The transit agency
The community as a whole
The public works department
Transit passengers<br>
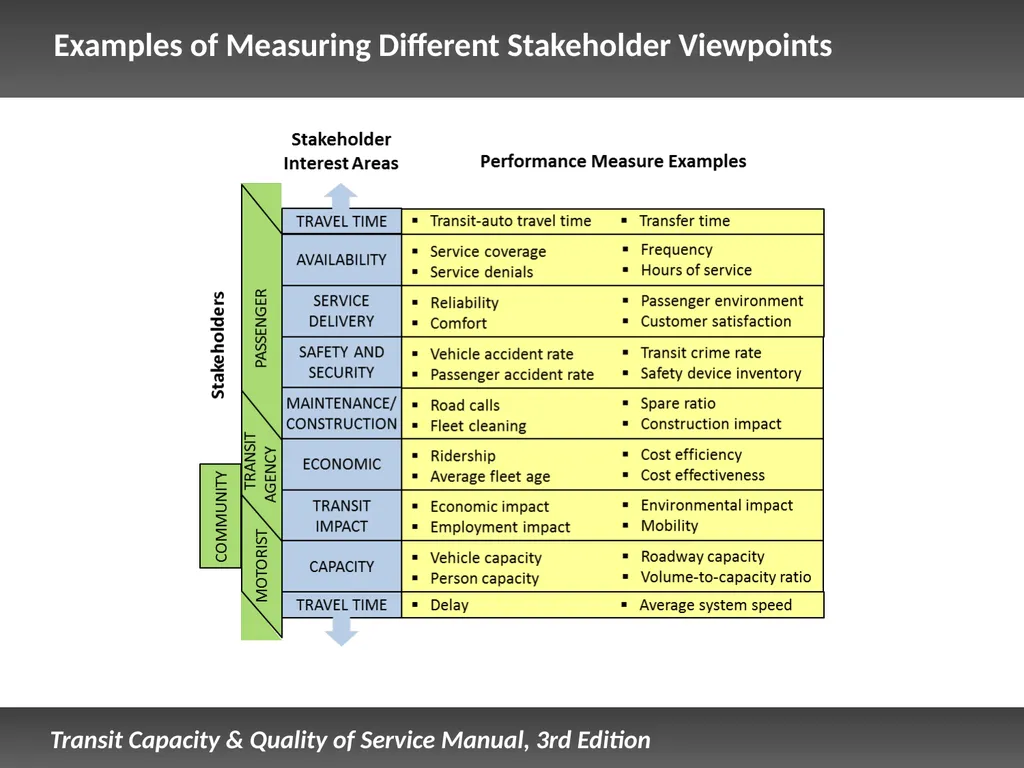
slide7. Examples of Measuring Different Stakeholder Viewpoints<br>
slide8. The Ultimate Transit Service As a passenger, what would your ideal transit service be like?<br>
slide9. The Ultimate Transit Service Since we can’t have the ultimate transit service, what trade-offs do we make?<br>
slide10. Transit Performance Viewpoints Quality of service focuses on the passenger point of view
Other points of view are also valid and need to be considered
May have conflicting objectives (e.g., passenger comfort vs. agency resources)
Best-quality passenger service may not be feasible or desirable<br>
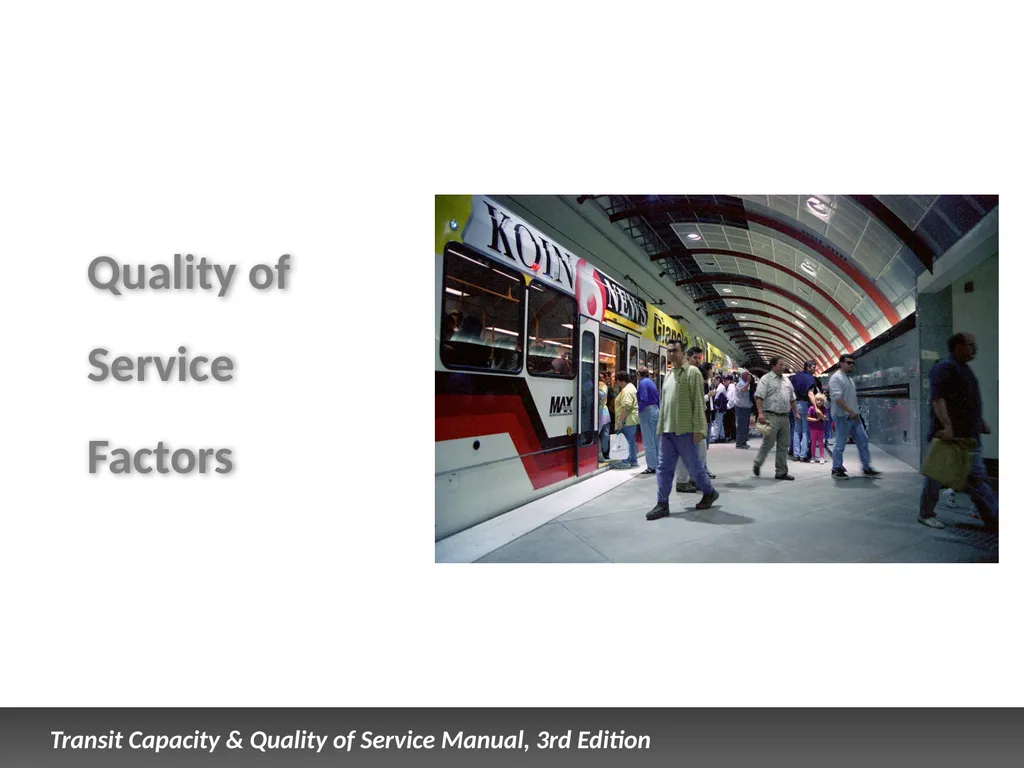
slide11. Quality of Service Factors<br>
slide12. What Matters to Customers? Customer satisfaction surveys provide insights
TCRP Project B-11 (customer satisfaction surveying methods)
Florida transit agency on-board surveys
NCHRP Project 3-92 (multimodal urban street level of service)
Typical factors:
Frequency, wait time, service span
Reliability
Service close to home, destination
Crowding
Fares, driver friendliness, safety/security<br>
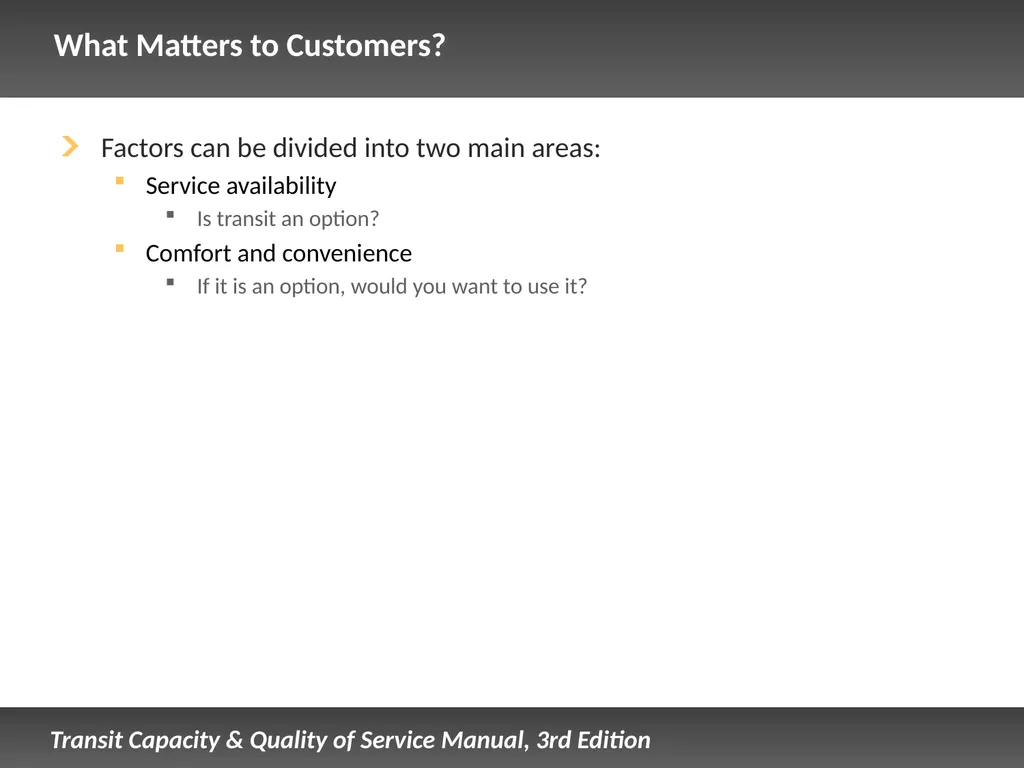
slide13. What Matters to Customers? Factors can be divided into two main areas:
Service availability
Is transit an option?
Comfort and convenience
If it is an option, would you want to use it?<br>
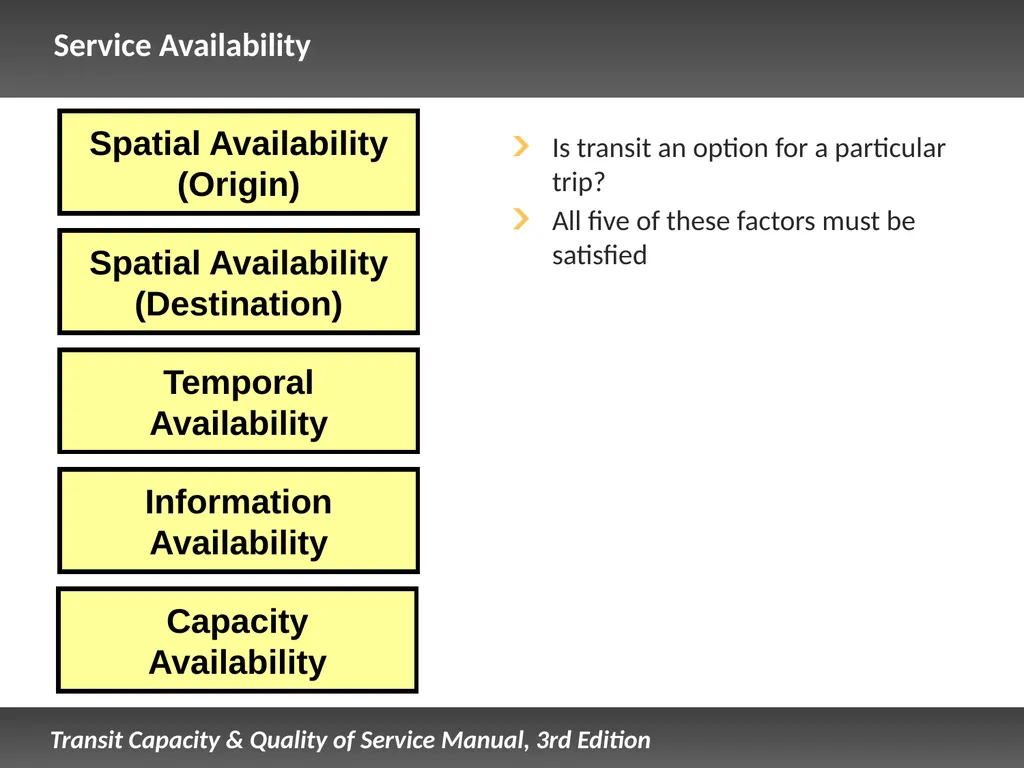
slide14. Spatial Availability (Origin) Temporal
Availability Information
Availability Spatial Availability (Destination) Service Availability Is transit an option for a particular trip?
All five of these factors must be satisfied Capacity
Availability<br>
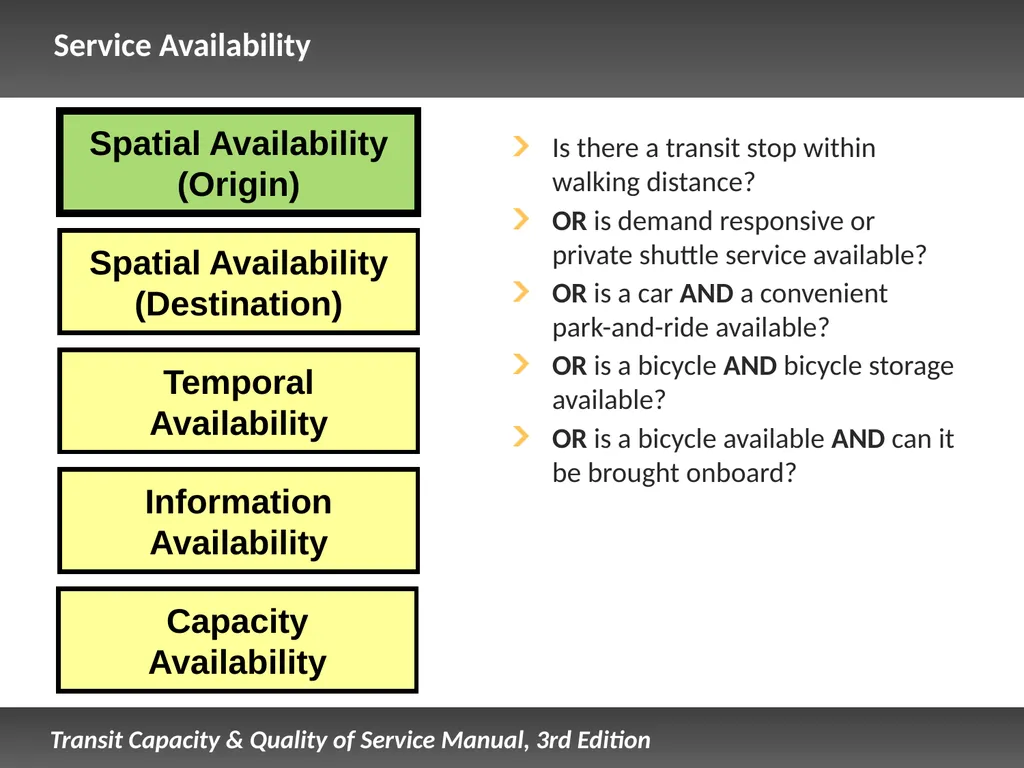
slide15. Spatial Availability (Origin) Temporal
Availability Information
Availability Spatial Availability (Destination) Service Availability Is there a transit stop within walking distance?
OR is demand responsive or private shuttle service available?
OR is a car AND a convenient park-and-ride available?
OR is a bicycle AND bicycle storage available?
OR is a bicycle available AND can it be brought onboard? Capacity
Availability<br>
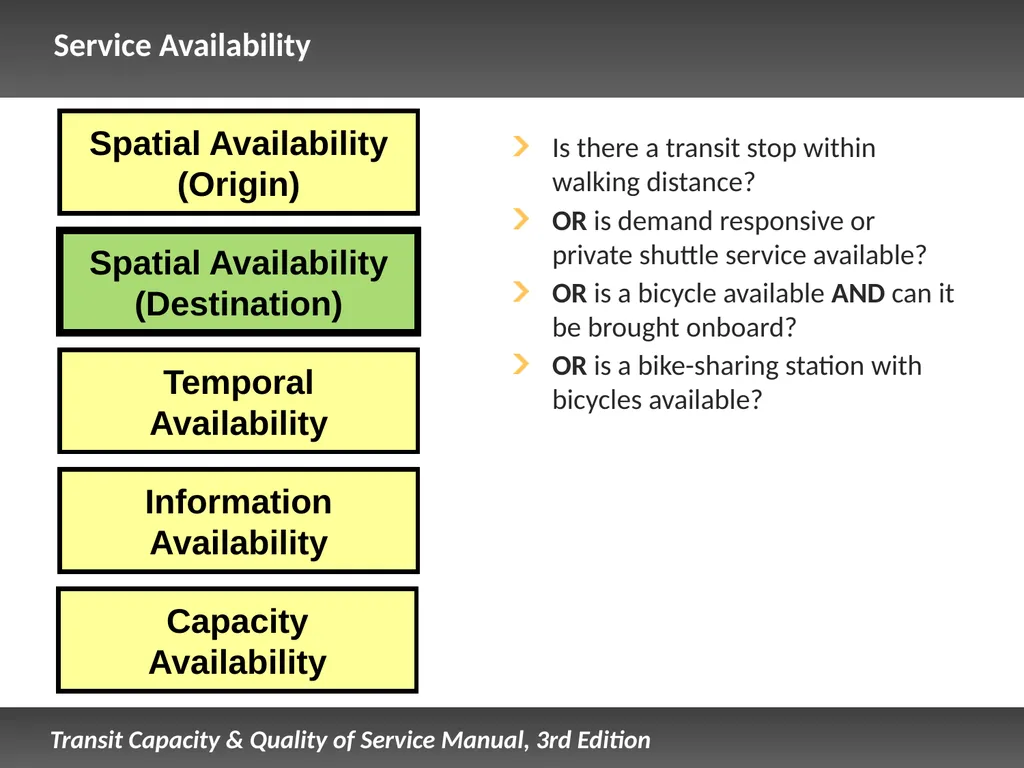
slide16. Spatial Availability (Origin) Temporal
Availability Information
Availability Spatial Availability (Destination) Service Availability Is there a transit stop within walking distance?
OR is demand responsive or private shuttle service available?
OR is a bicycle available AND can it be brought onboard?
OR is a bike-sharing station with bicycles available? Capacity
Availability<br>
slide17. Spatial Availability (Origin) Temporal
Availability Information
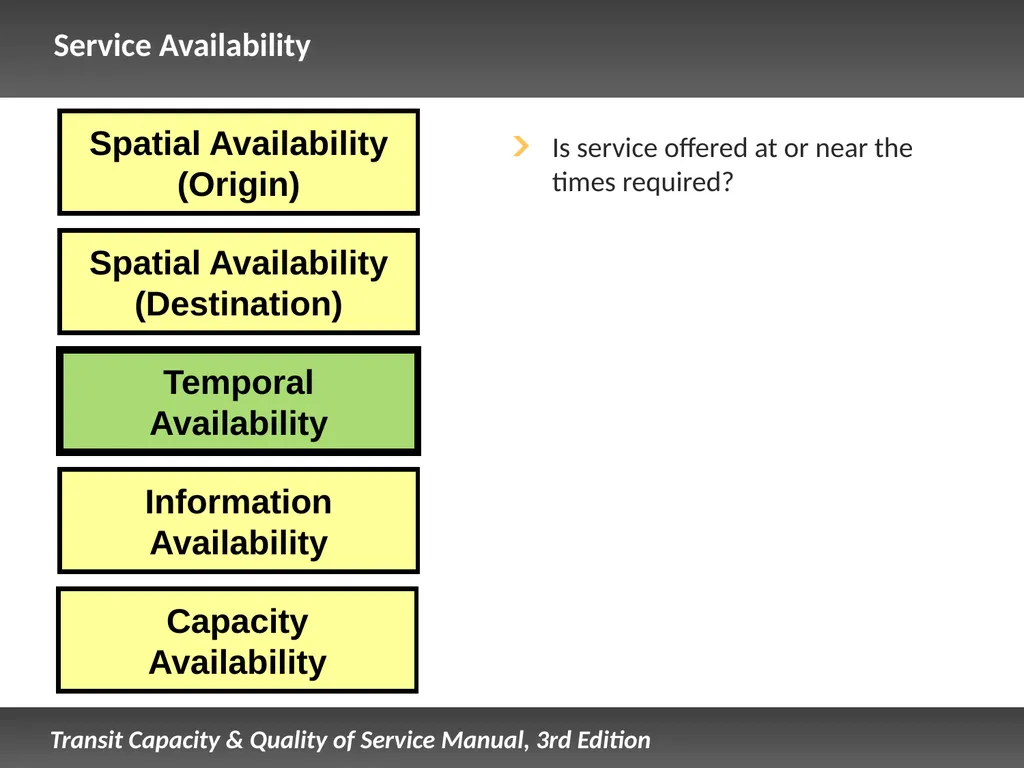
Availability Spatial Availability (Destination) Service Availability Is service offered at or near the times required? Capacity
Availability<br>
slide18. Spatial Availability (Origin) Temporal
Availability Information
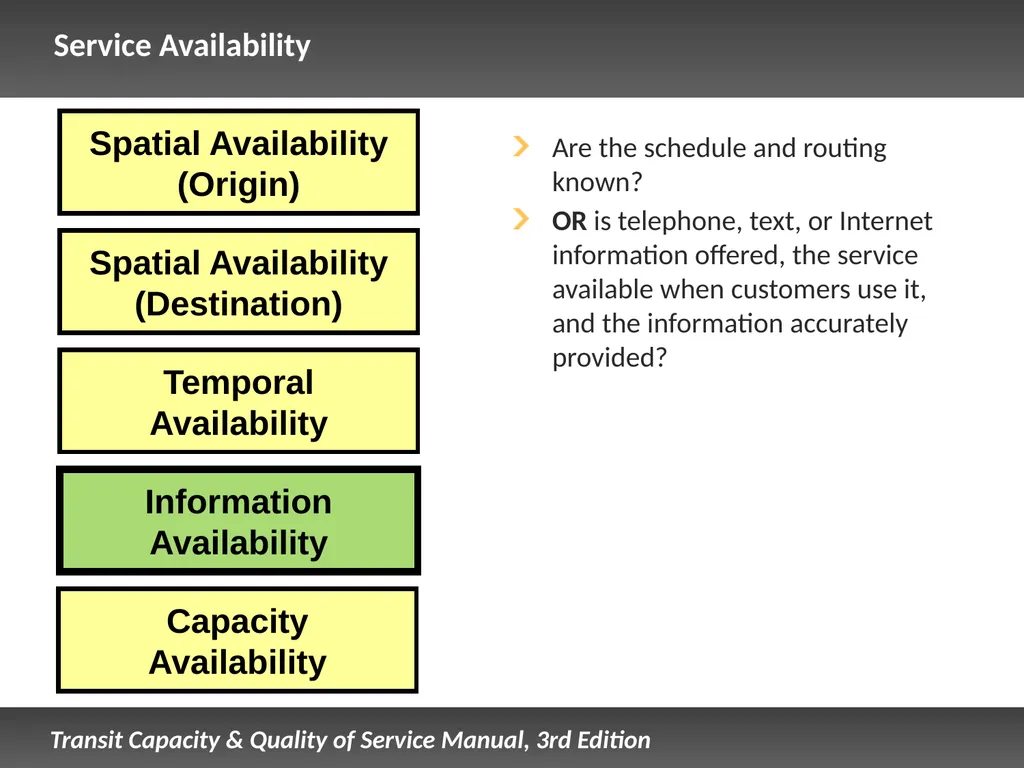
Availability Spatial Availability (Destination) Service Availability Are the schedule and routing known?
OR is telephone, text, or Internet information offered, the service available when customers use it, and the information accurately provided? Capacity
Availability<br>
slide19. Spatial Availability (Origin) Temporal
Availability Information
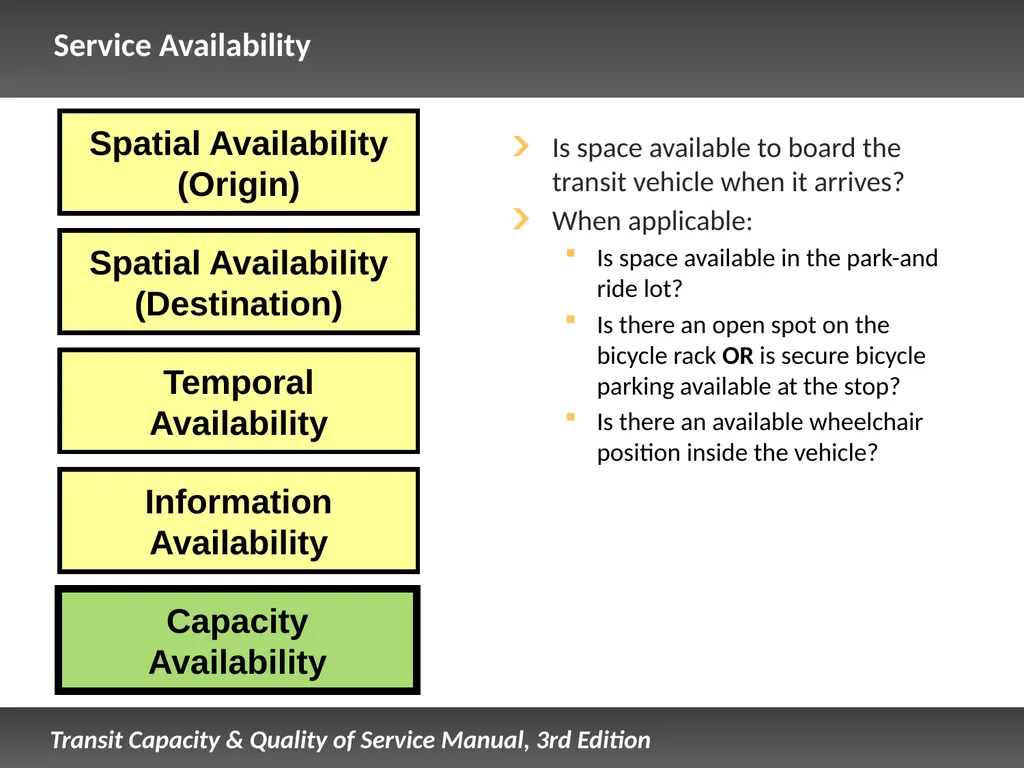
Availability Spatial Availability (Destination) Service Availability Is space available to board the transit vehicle when it arrives?
When applicable:
Is space available in the park-and ride lot?
Is there an open spot on the bicycle rack OR is secure bicycle parking available at the stop?
Is there an available wheelchair position inside the vehicle? Capacity
Availability<br>
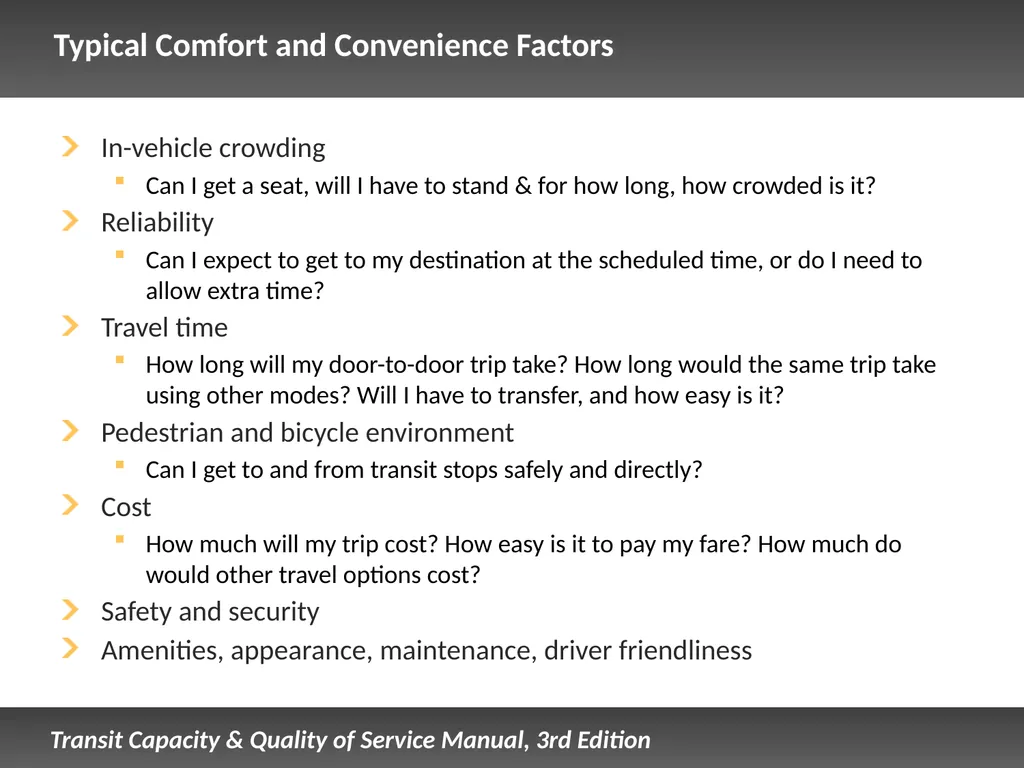
slide20. Typical Comfort and Convenience Factors In-vehicle crowding
Can I get a seat, will I have to stand & for how long, how crowded is it?
Reliability
Can I expect to get to my destination at the scheduled time, or do I need to allow extra time?
Travel time
How long will my door-to-door trip take? How long would the same trip take using other modes? Will I have to transfer, and how easy is it?
Pedestrian and bicycle environment
Can I get to and from transit stops safely and directly?
Cost
How much will my trip cost? How easy is it to pay my fare? How much do would other travel options cost?
Safety and security
Amenities, appearance, maintenance, driver friendliness<br>
slide21. Quality of Service Framework<br>
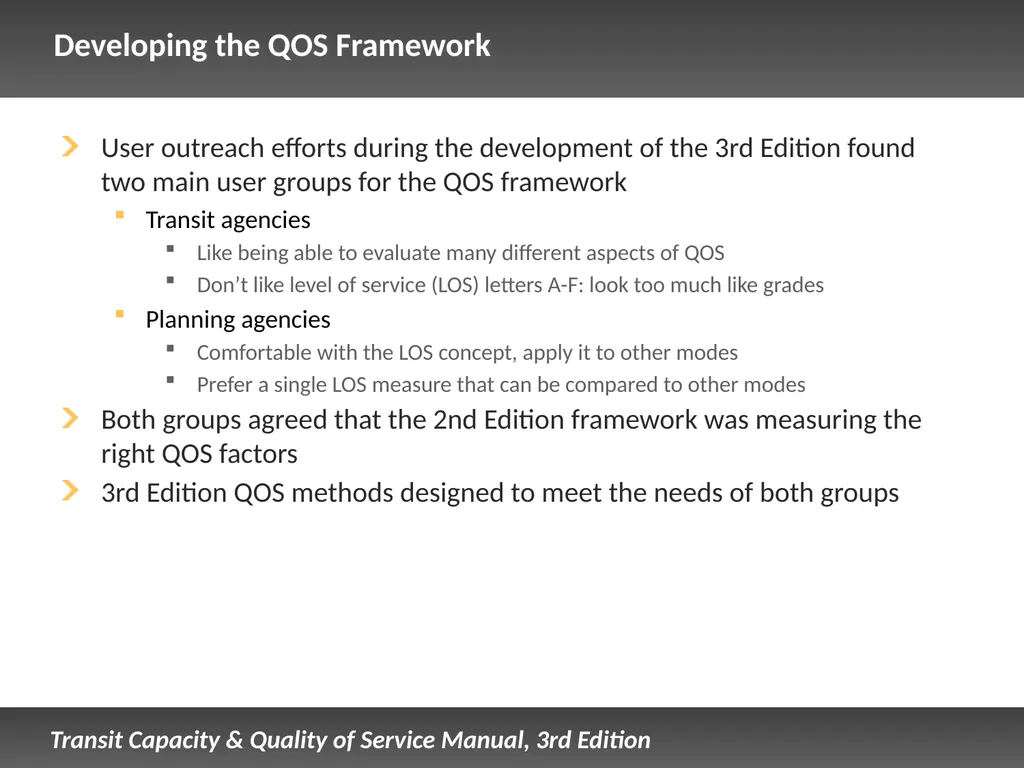
slide22. Developing the QOS Framework User outreach efforts during the development of the 3rd Edition found two main user groups for the QOS framework
Transit agencies
Like being able to evaluate many different aspects of QOS
Don’t like level of service (LOS) letters A-F: look too much like grades
Planning agencies
Comfortable with the LOS concept, apply it to other modes
Prefer a single LOS measure that can be compared to other modes
Both groups agreed that the 2nd Edition framework was measuring the right QOS factors
3rd Edition QOS methods designed to meet the needs of both groups<br>
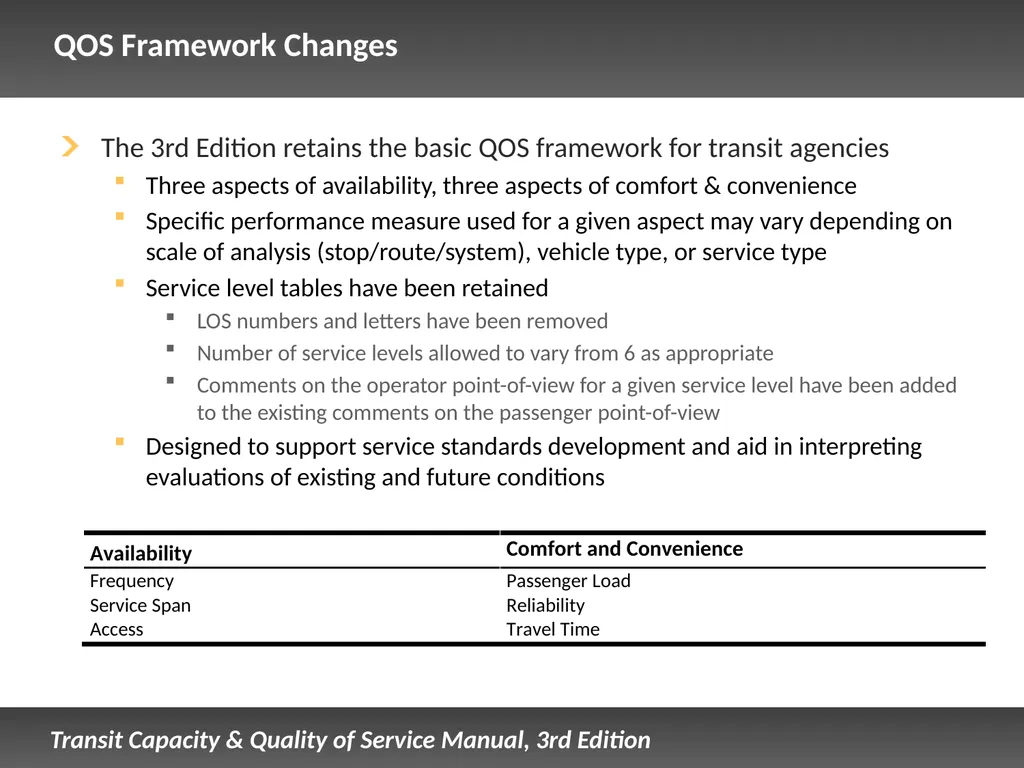
slide23. QOS Framework Changes The 3rd Edition retains the basic QOS framework for transit agencies
Three aspects of availability, three aspects of comfort & convenience
Specific performance measure used for a given aspect may vary depending on scale of analysis (stop/route/system), vehicle type, or service type
Service level tables have been retained
LOS numbers and letters have been removed
Number of service levels allowed to vary from 6 as appropriate
Comments on the operator point-of-view for a given service level have been added to the existing comments on the passenger point-of-view
Designed to support service standards development and aid in interpreting evaluations of existing and future conditions<br>
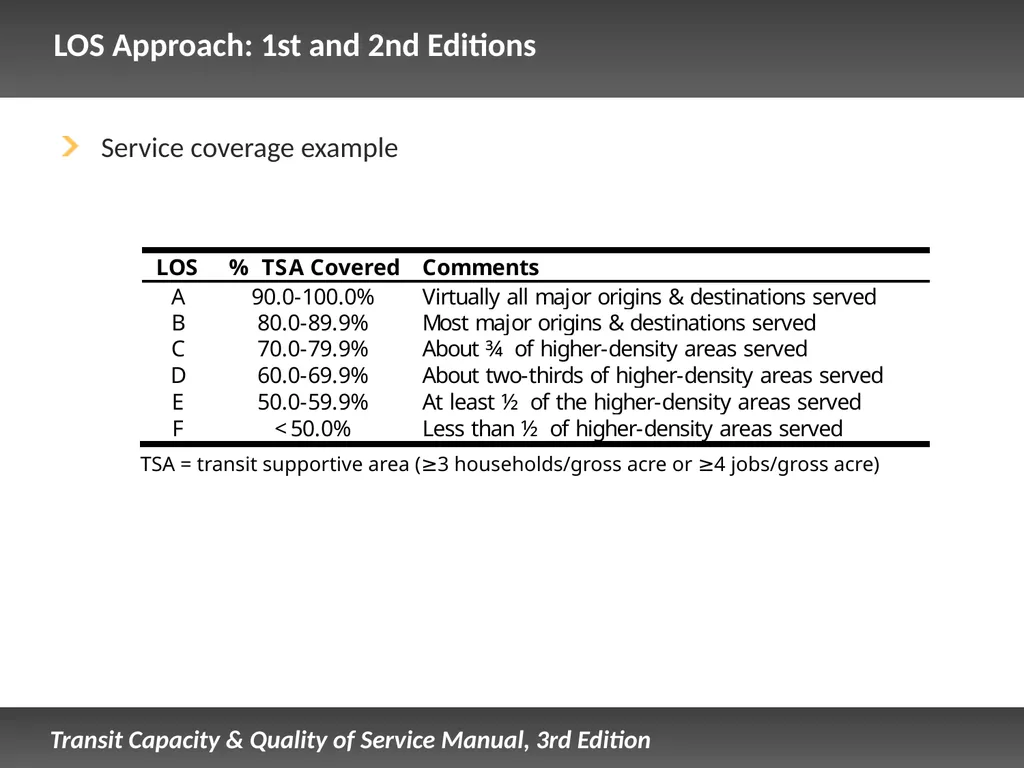
slide24. LOS Approach: 1st and 2nd Editions TSA = transit supportive area (≥3 households/gross acre or ≥4 jobs/gross acre) Service coverage example<br>
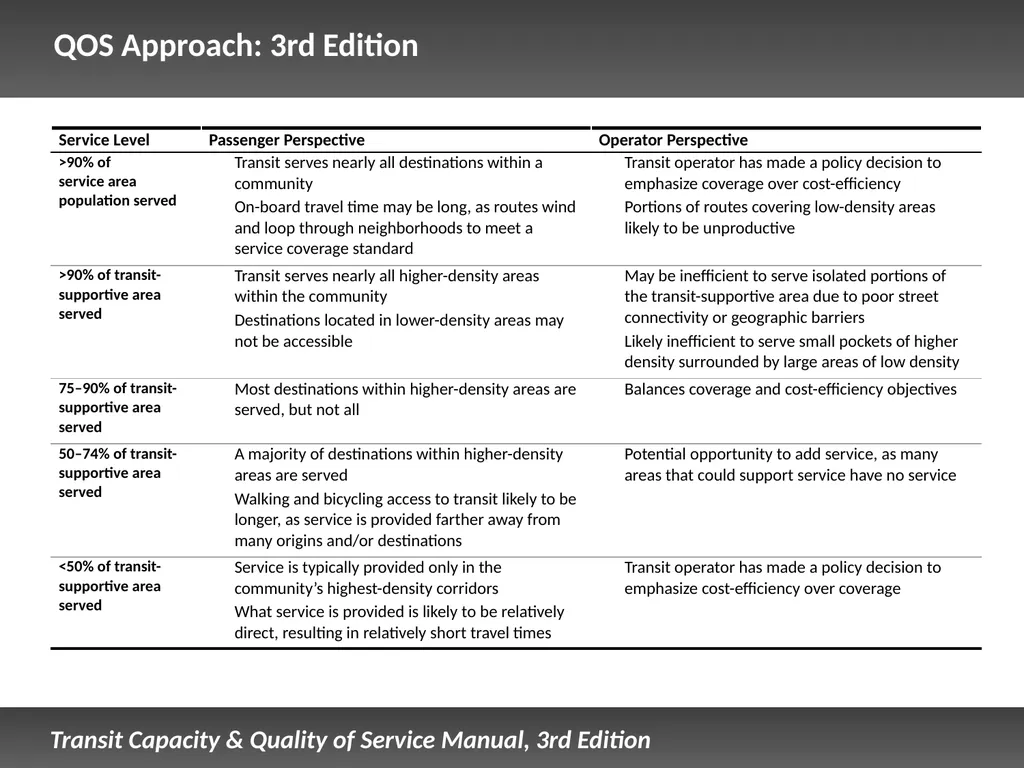
slide25. QOS Approach: 3rd Edition<br>
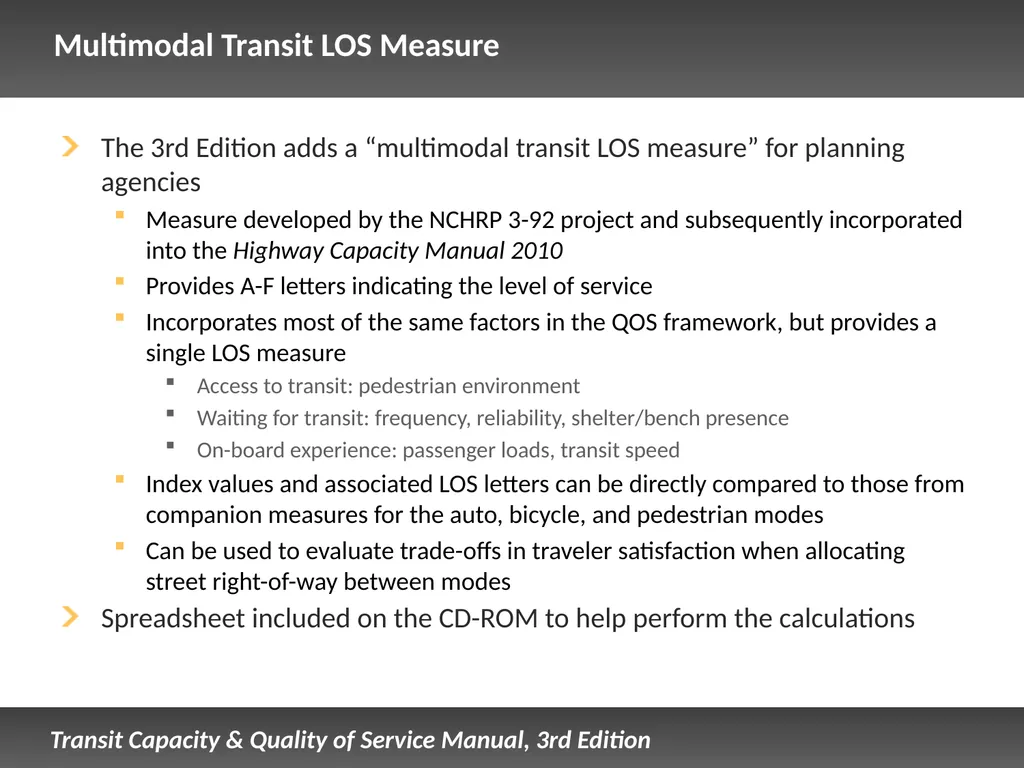
slide26. Multimodal Transit LOS Measure The 3rd Edition adds a “multimodal transit LOS measure” for planning agencies
Measure developed by the NCHRP 3-92 project and subsequently incorporated into the Highway Capacity Manual 2010
Provides A-F letters indicating the level of service
Incorporates most of the same factors in the QOS framework, but provides a single LOS measure
Access to transit: pedestrian environment
Waiting for transit: frequency, reliability, shelter/bench presence
On-board experience: passenger loads, transit speed
Index values and associated LOS letters can be directly compared to those from companion measures for the auto, bicycle, and pedestrian modes
Can be used to evaluate trade-offs in traveler satisfaction when allocating street right-of-way between modes
Spreadsheet included on the CD-ROM to help perform the calculations<br>
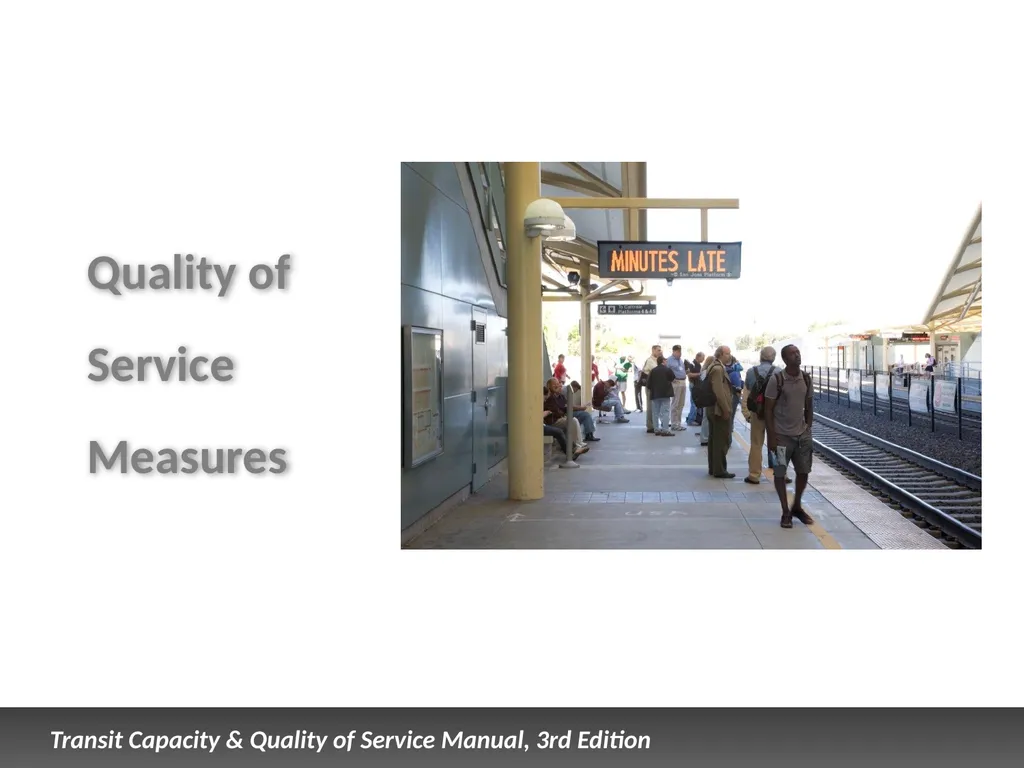
slide27. Quality of Service Measures<br>
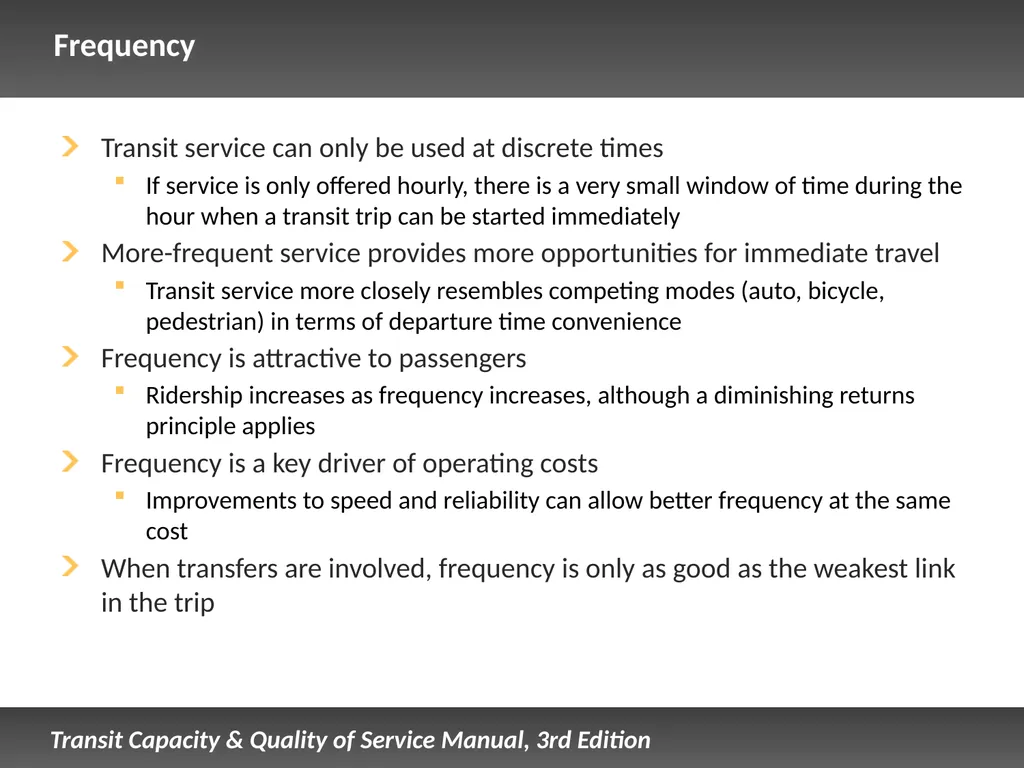
slide28. Frequency Transit service can only be used at discrete times
If service is only offered hourly, there is a very small window of time during the hour when a transit trip can be started immediately
More-frequent service provides more opportunities for immediate travel
Transit service more closely resembles competing modes (auto, bicycle, pedestrian) in terms of departure time convenience
Frequency is attractive to passengers
Ridership increases as frequency increases, although a diminishing returns principle applies
Frequency is a key driver of operating costs
Improvements to speed and reliability can allow better frequency at the same cost
When transfers are involved, frequency is only as good as the weakest link in the trip<br>
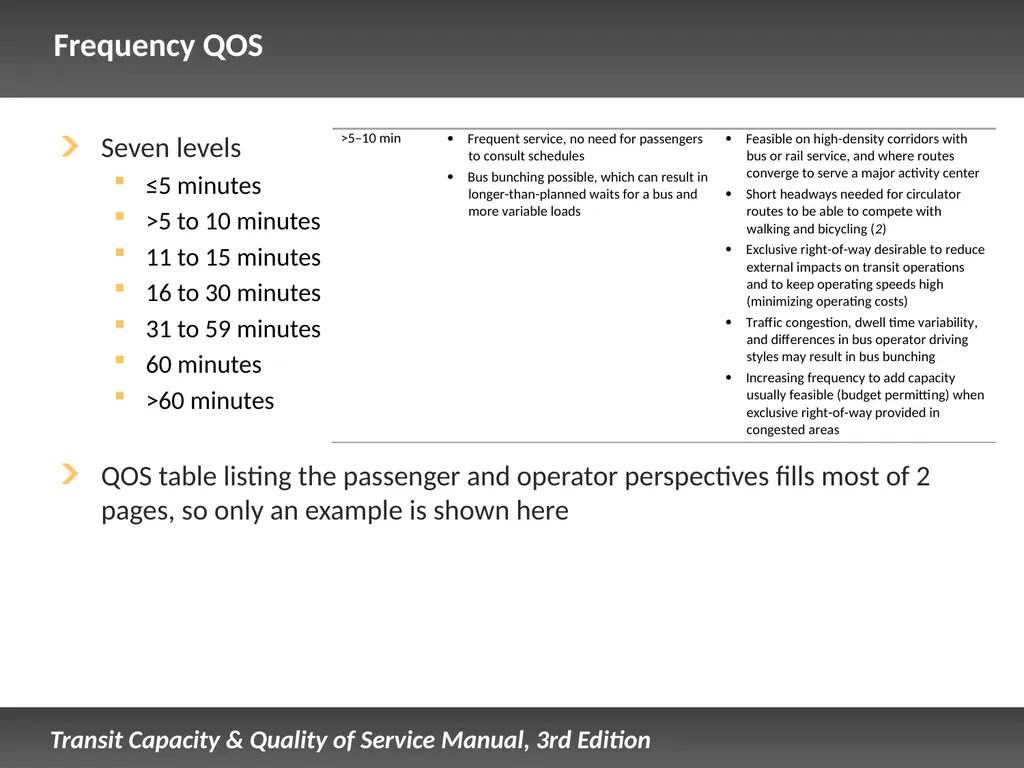
slide29. Frequency QOS Seven levels
≤5 minutes
>5 to 10 minutes
11 to 15 minutes
16 to 30 minutes
31 to 59 minutes
60 minutes
>60 minutes
QOS table listing the passenger and operator perspectives fills most of 2 pages, so only an example is shown here<br>
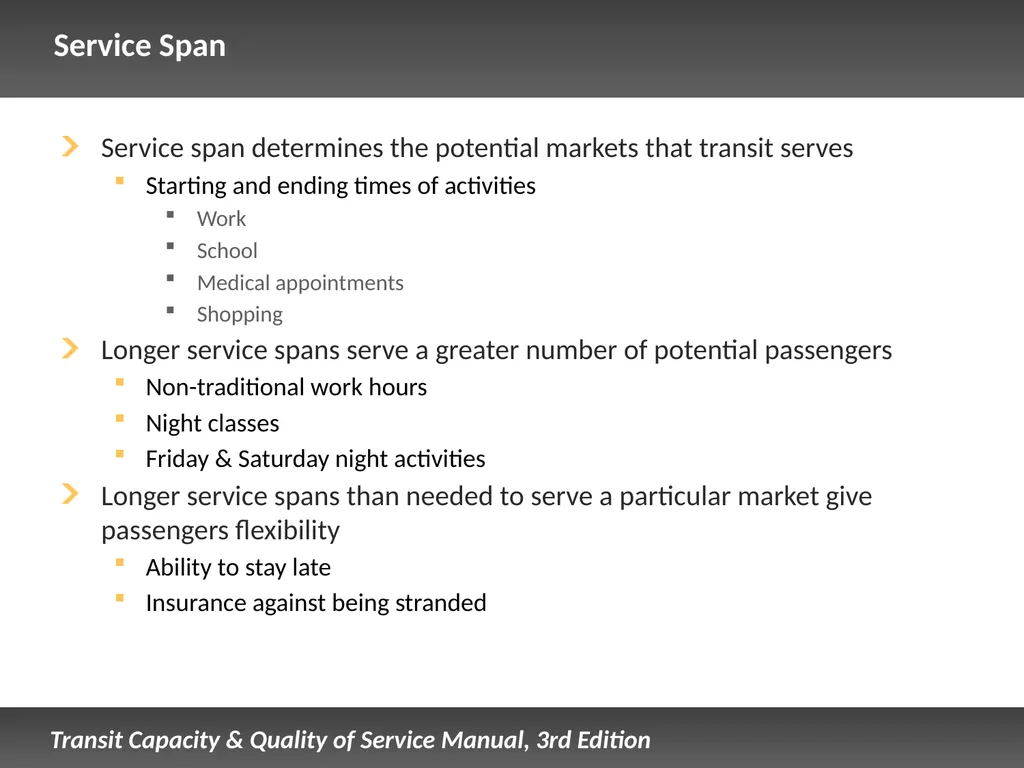
slide30. Service Span Service span determines the potential markets that transit serves
Starting and ending times of activities
Work
School
Medical appointments
Shopping
Longer service spans serve a greater number of potential passengers
Non-traditional work hours
Night classes
Friday & Saturday night activities
Longer service spans than needed to serve a particular market give passengers flexibility
Ability to stay late
Insurance against being stranded<br>
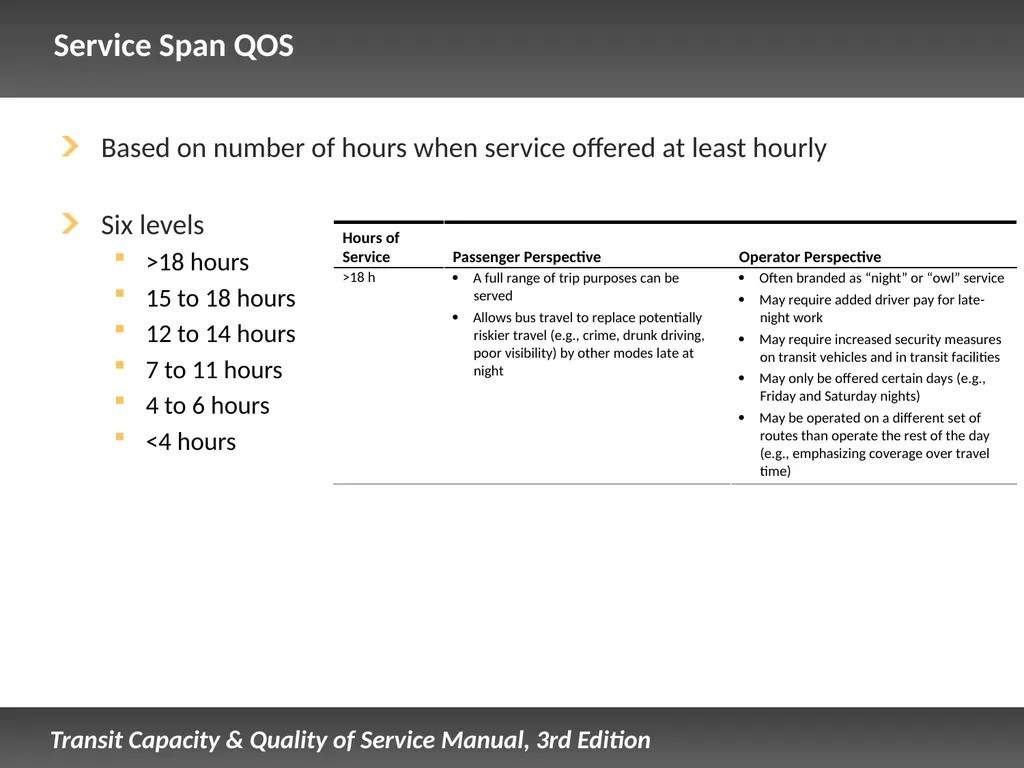
slide31. Service Span QOS Based on number of hours when service offered at least hourly
Six levels
>18 hours
15 to 18 hours
12 to 14 hours
7 to 11 hours
4 to 6 hours
<4 hours<br>
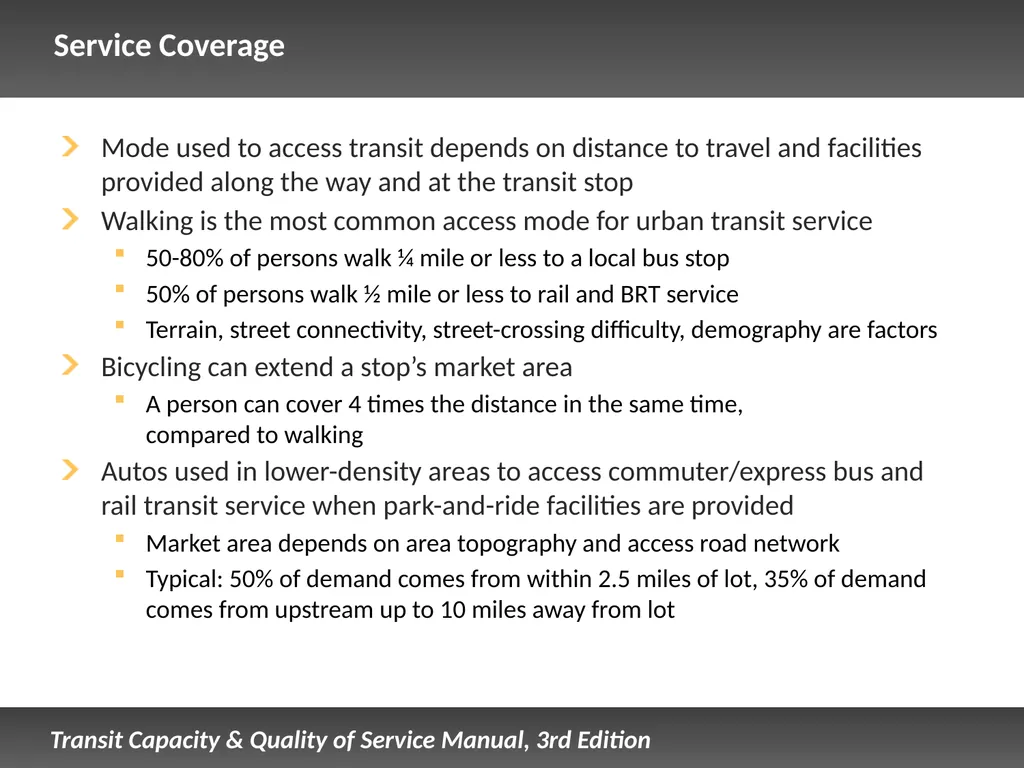
slide32. Service Coverage Mode used to access transit depends on distance to travel and facilities provided along the way and at the transit stop
Walking is the most common access mode for urban transit service
50-80% of persons walk ¼ mile or less to a local bus stop
50% of persons walk ½ mile or less to rail and BRT service
Terrain, street connectivity, street-crossing difficulty, demography are factors
Bicycling can extend a stop’s market area
A person can cover 4 times the distance in the same time, compared to walking
Autos used in lower-density areas to access commuter/express bus and rail transit service when park-and-ride facilities are provided
Market area depends on area topography and access road network
Typical: 50% of demand comes from within 2.5 miles of lot, 35% of demand comes from upstream up to 10 miles away from lot<br>
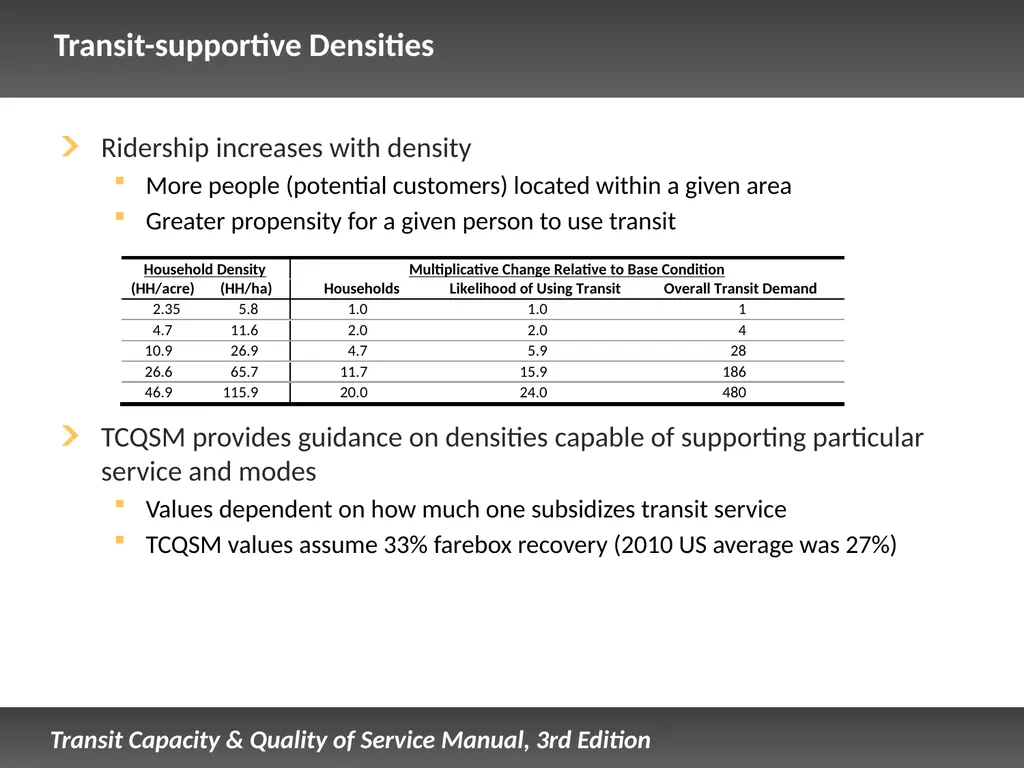
slide33. Transit-supportive Densities Ridership increases with density
More people (potential customers) located within a given area
Greater propensity for a given person to use transit
TCQSM provides guidance on densities capable of supporting particular service and modes
Values dependent on how much one subsidizes transit service
TCQSM values assume 33% farebox recovery (2010 US average was 27%)<br>
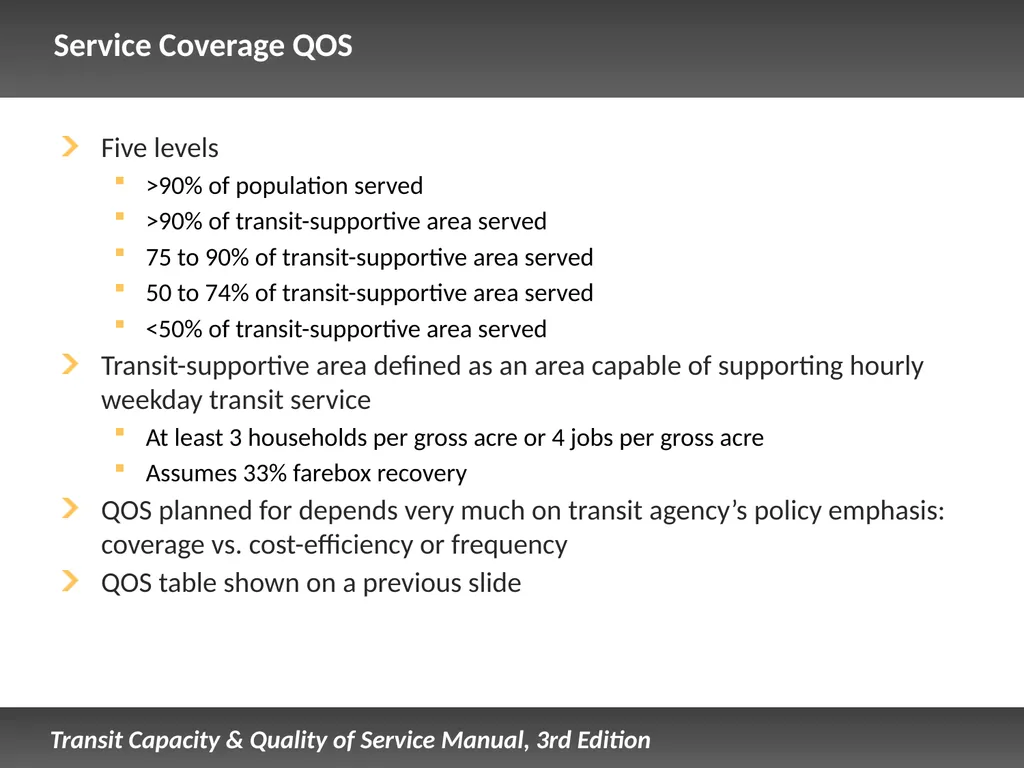
slide34. Service Coverage QOS Five levels
>90% of population served
>90% of transit-supportive area served
75 to 90% of transit-supportive area served
50 to 74% of transit-supportive area served
<50% of transit-supportive area served
Transit-supportive area defined as an area capable of supporting hourly weekday transit service
At least 3 households per gross acre or 4 jobs per gross acre
Assumes 33% farebox recovery
QOS planned for depends very much on transit agency’s policy emphasis: coverage vs. cost-efficiency or frequency
QOS table shown on a previous slide<br>
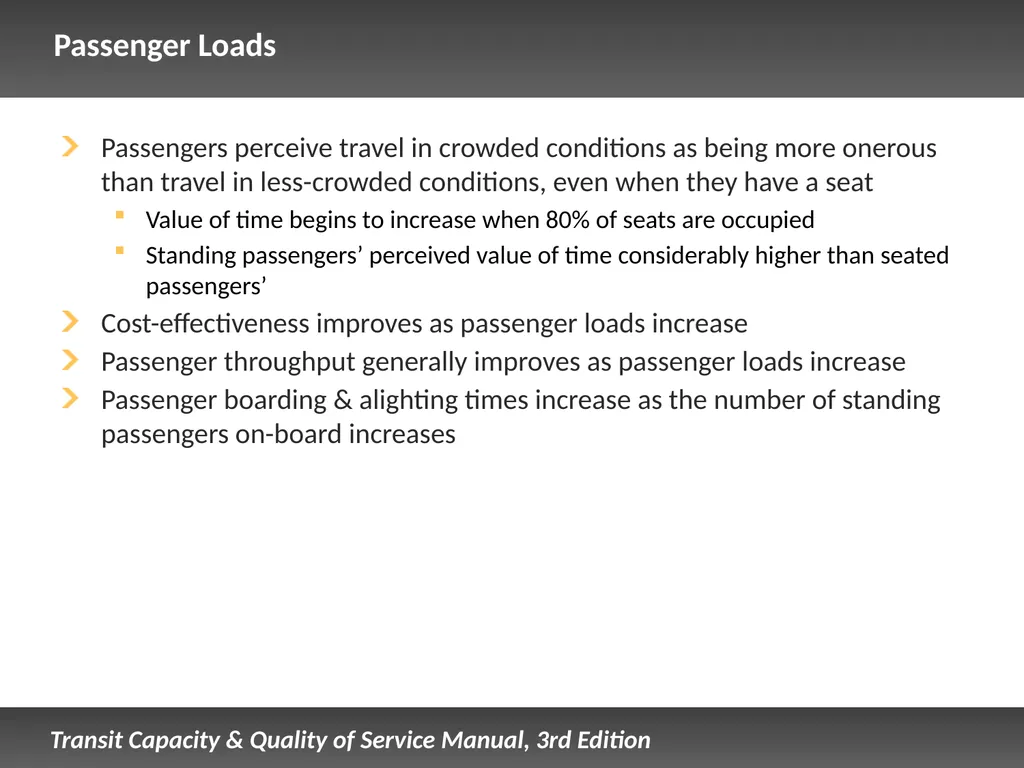
slide35. Passenger Loads Passengers perceive travel in crowded conditions as being more onerous than travel in less-crowded conditions, even when they have a seat
Value of time begins to increase when 80% of seats are occupied
Standing passengers’ perceived value of time considerably higher than seated passengers’
Cost-effectiveness improves as passenger loads increase
Passenger throughput generally improves as passenger loads increase
Passenger boarding & alighting times increase as the number of standing passengers on-board increases<br>
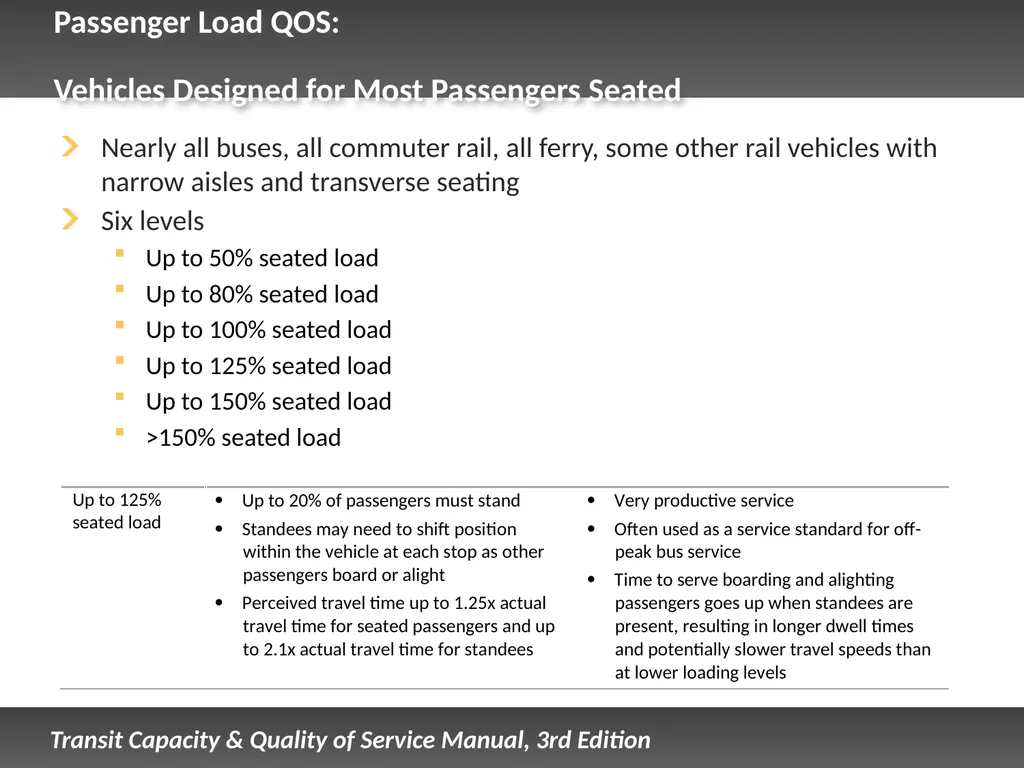
slide36. Passenger Load QOS: Vehicles Designed for Most Passengers Seated Nearly all buses, all commuter rail, all ferry, some other rail vehicles with narrow aisles and transverse seating
Six levels
Up to 50% seated load
Up to 80% seated load
Up to 100% seated load
Up to 125% seated load
Up to 150% seated load
>150% seated load<br>
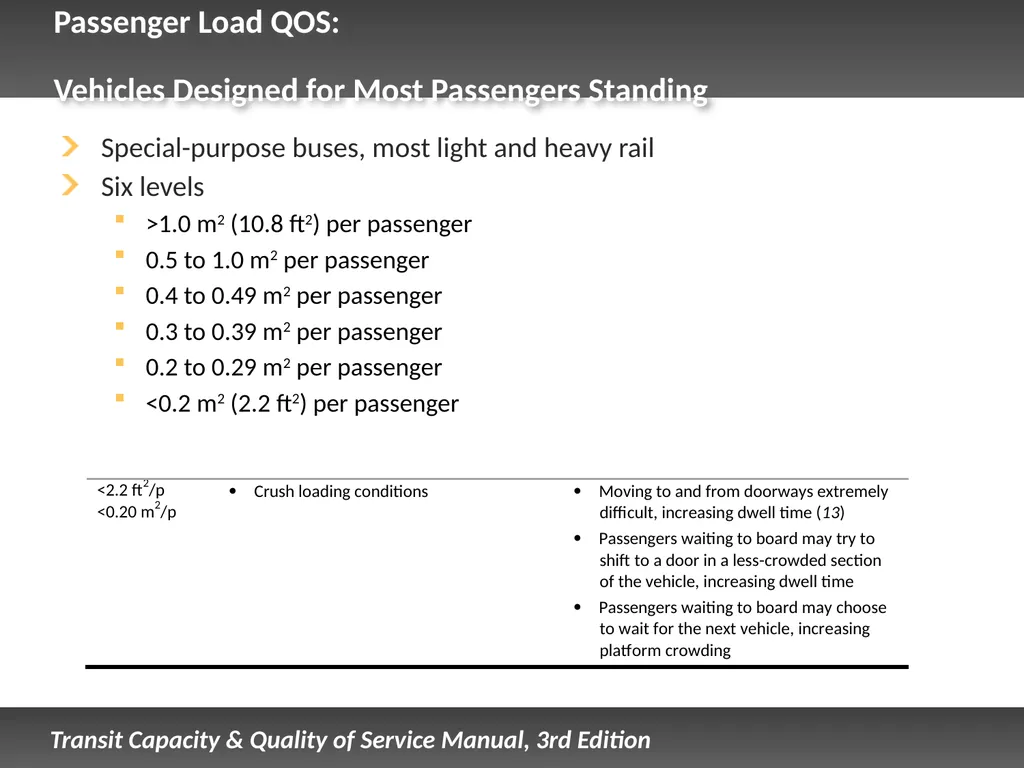
slide37. Passenger Load QOS: Vehicles Designed for Most Passengers Standing Special-purpose buses, most light and heavy rail
Six levels
>1.0 m2 (10.8 ft2) per passenger
0.5 to 1.0 m2 per passenger
0.4 to 0.49 m2 per passenger
0.3 to 0.39 m2 per passenger
0.2 to 0.29 m2 per passenger
<0.2 m2 (2.2 ft2) per passenger<br>
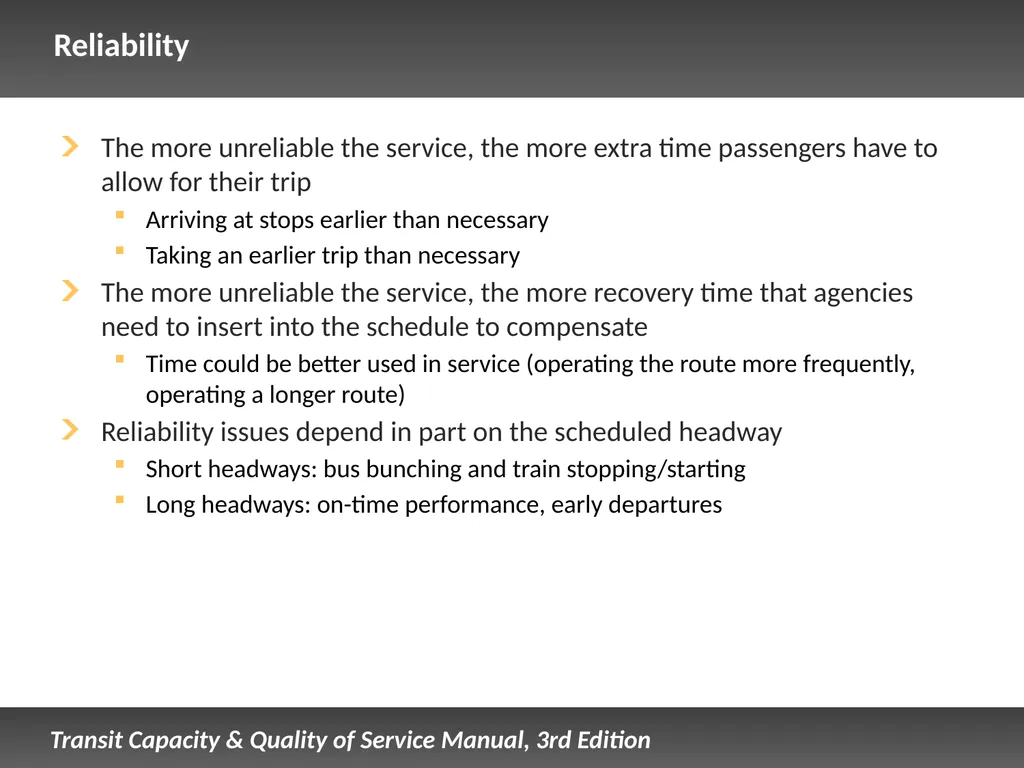
slide38. Reliability The more unreliable the service, the more extra time passengers have to allow for their trip
Arriving at stops earlier than necessary
Taking an earlier trip than necessary
The more unreliable the service, the more recovery time that agencies need to insert into the schedule to compensate
Time could be better used in service (operating the route more frequently, operating a longer route)
Reliability issues depend in part on the scheduled headway
Short headways: bus bunching and train stopping/starting
Long headways: on-time performance, early departures<br>
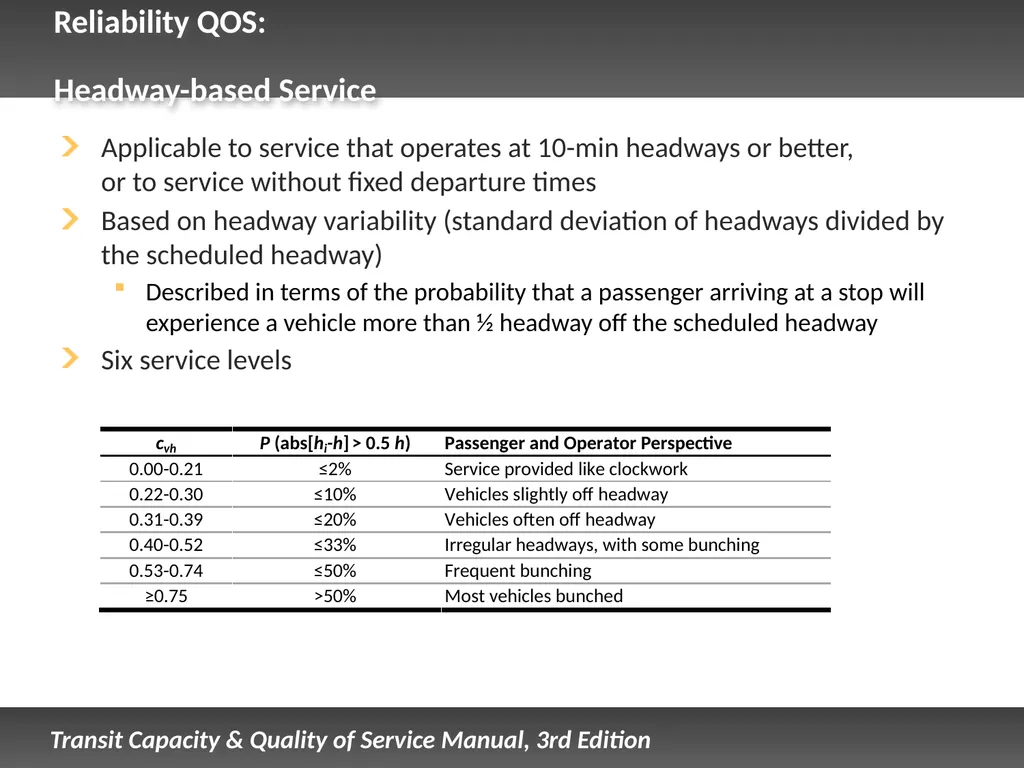
slide39. Reliability QOS: Headway-based Service Applicable to service that operates at 10-min headways or better, or to service without fixed departure times
Based on headway variability (standard deviation of headways divided by the scheduled headway)
Described in terms of the probability that a passenger arriving at a stop will experience a vehicle more than ½ headway off the scheduled headway
Six service levels<br>
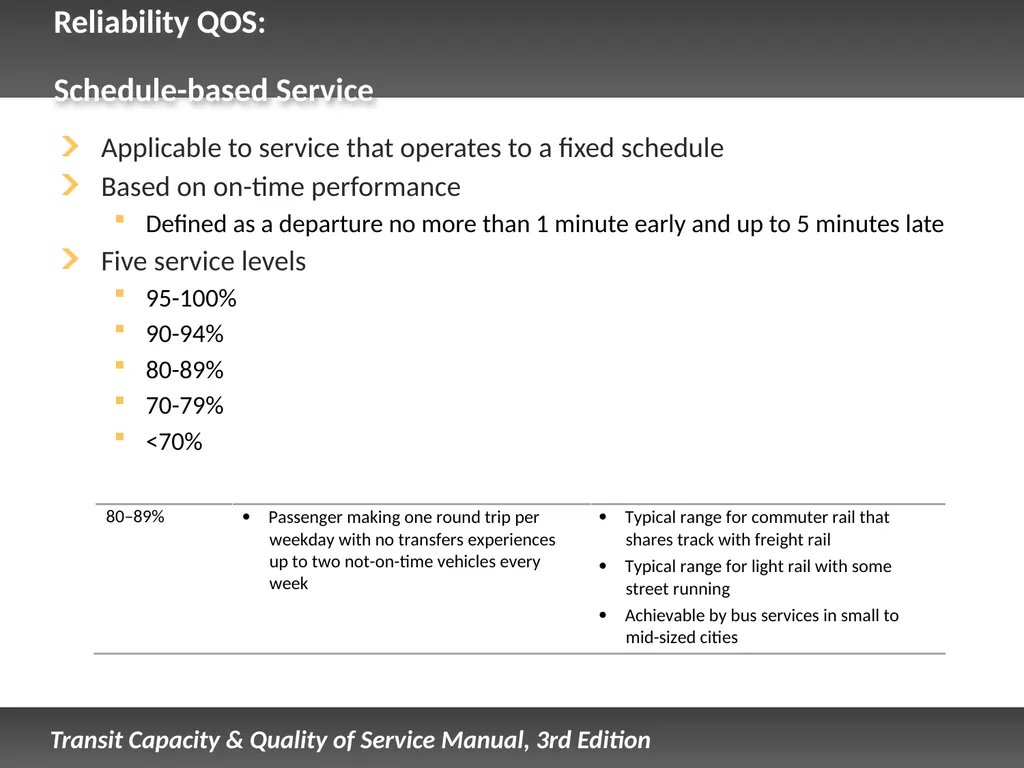
slide40. Reliability QOS: Schedule-based Service Applicable to service that operates to a fixed schedule
Based on on-time performance
Defined as a departure no more than 1 minute early and up to 5 minutes late
Five service levels
95-100%
90-94%
80-89%
70-79%
<70%<br>
slide41. Travel Time Travel time is an important consideration in mode choice
Travel time impacts operating costs: the slower the route, the more vehicles that are required to be in service to provide a given headway<br>
slide42. Based on the ratio of in-vehicle transit time to in-vehicle auto time
Six service levels Travel Time QOS<br>
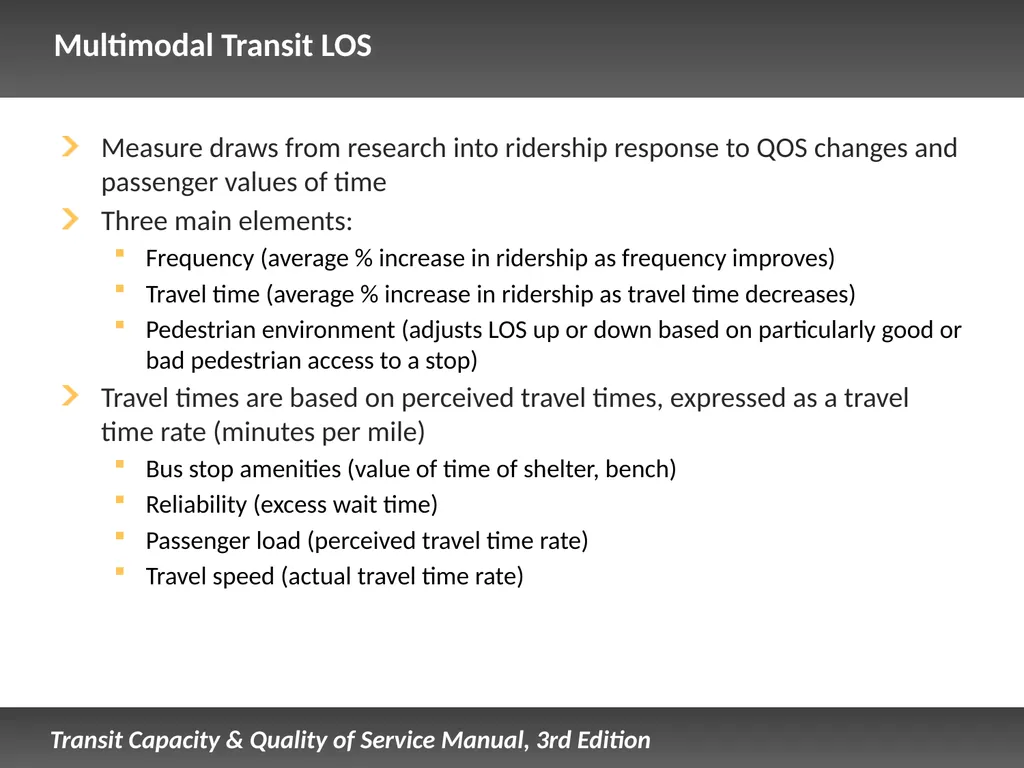
slide43. Multimodal Transit LOS Measure draws from research into ridership response to QOS changes and passenger values of time
Three main elements:
Frequency (average % increase in ridership as frequency improves)
Travel time (average % increase in ridership as travel time decreases)
Pedestrian environment (adjusts LOS up or down based on particularly good or bad pedestrian access to a stop)
Travel times are based on perceived travel times, expressed as a travel time rate (minutes per mile)
Bus stop amenities (value of time of shelter, bench)
Reliability (excess wait time)
Passenger load (perceived travel time rate)
Travel speed (actual travel time rate)<br>
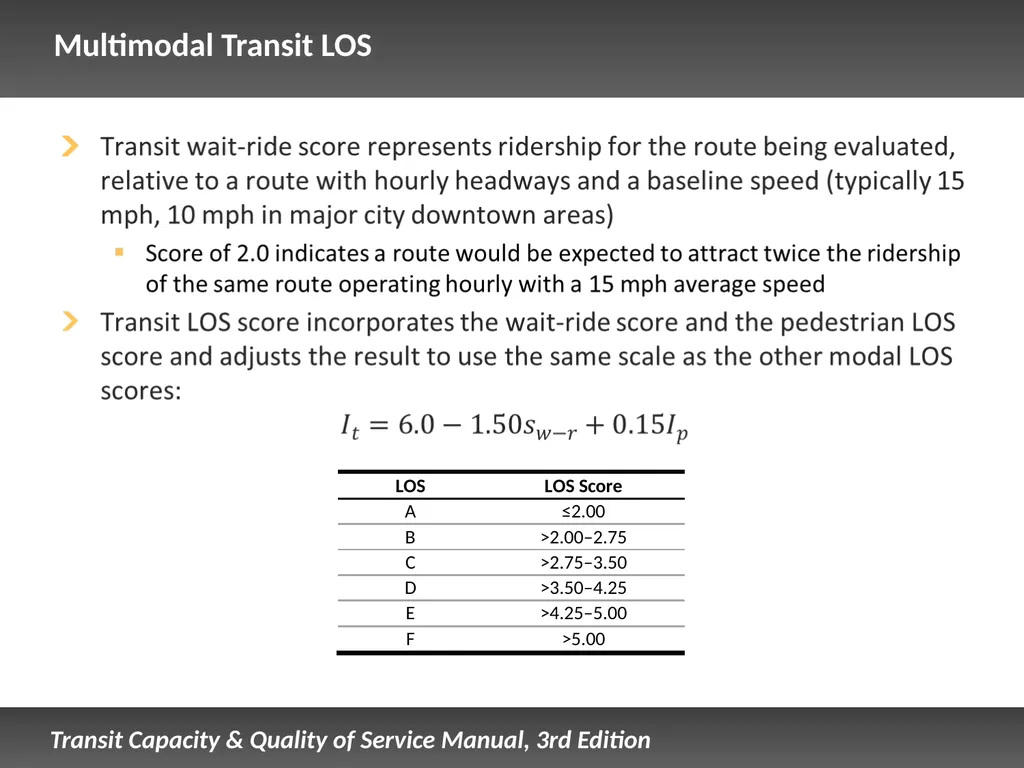
slide44. Multimodal Transit LOS<br>
slide45. Demand Responsive QOS There is a corresponding QOS framework and measures for demand responsive transit
Covered in the DRT presentation<br>
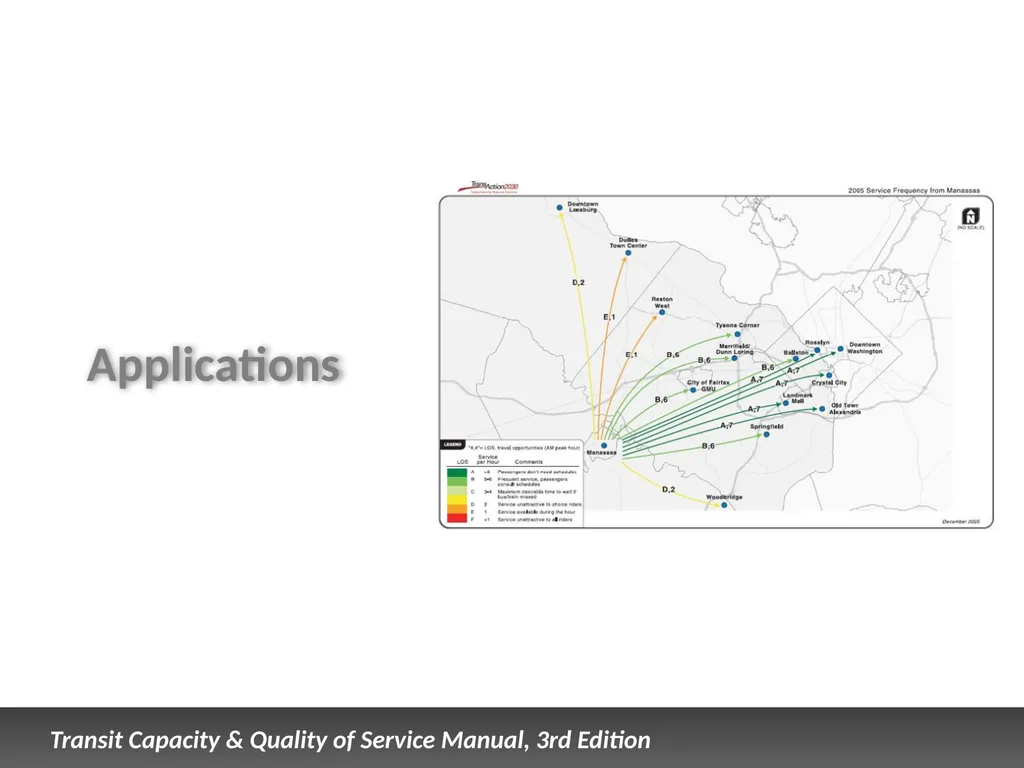
slide46. Applications<br>
slide47. Potential Applications Comprehensive planning
Long-range transportation planning
Statewide transportation planning
Service standards development
Comprehensive operational analysis
Transit development plans
Service planning
Corridor planning<br>
slide48. Comprehensive Planning Multimodal comprehensive plans provide goals, policies, and objectives for the transit service provided, or desired to be provided, within a city or county
Service goals may be aspirational (city/county is not the service provider)
Service goals may become the basis for service standards (city/county is the service provider)
QOS measures relating to availability can be used in setting objectives
For example, minimum span of service for trunk and local routes
Information in QOS chapters can be used to demonstrate the impact of different land use densities, street connectivity, and sidewalk provision policies on transit access
Impact on ridership
Impact on number of households/persons with transit access
Impact on transit operating costs (e.g., number of route miles required to meet a service coverage goal)<br>
slide49. Long-range Transportation Planning LRTPs identify city- or region-wide transportation needs over a longer period of time (e.g., 20 years)
If plan preparer is not the service provider, LRTPs often focus on the actions that can be taken to support transit (e.g., sidewalk improvements)
If plan preparer is the service provider, the transit element may be more specific and contain many of the elements of a transit development plan
A common application of the TCQSM 1st and 2nd Editions was to evaluate existing transit service quality
Much more valuable to also use it to evaluate service quality provided by various future alternatives, to aid decision-making
Possible types of analysis:
Activity center analysis (origin–destination trips)
Corridor analysis (transit streets, priority/frequent bus network)
Service coverage analysis (areawide, corridor)<br>
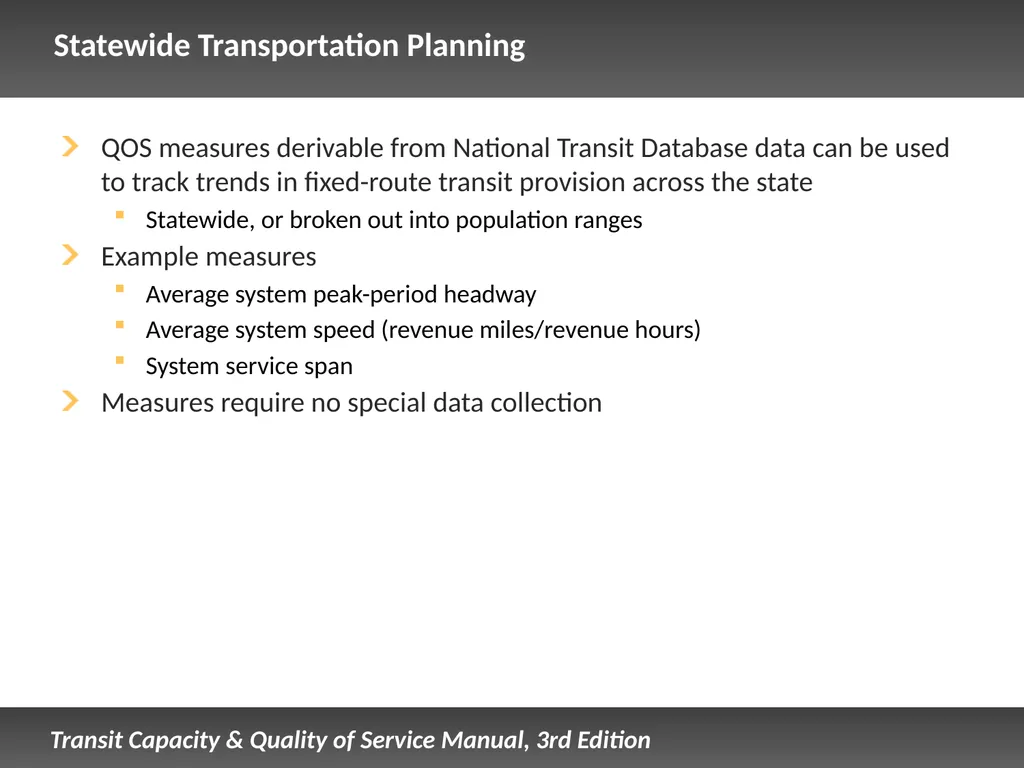
slide50. Statewide Transportation Planning QOS measures derivable from National Transit Database data can be used to track trends in fixed-route transit provision across the state
Statewide, or broken out into population ranges
Example measures
Average system peak-period headway
Average system speed (revenue miles/revenue hours)
System service span
Measures require no special data collection<br>
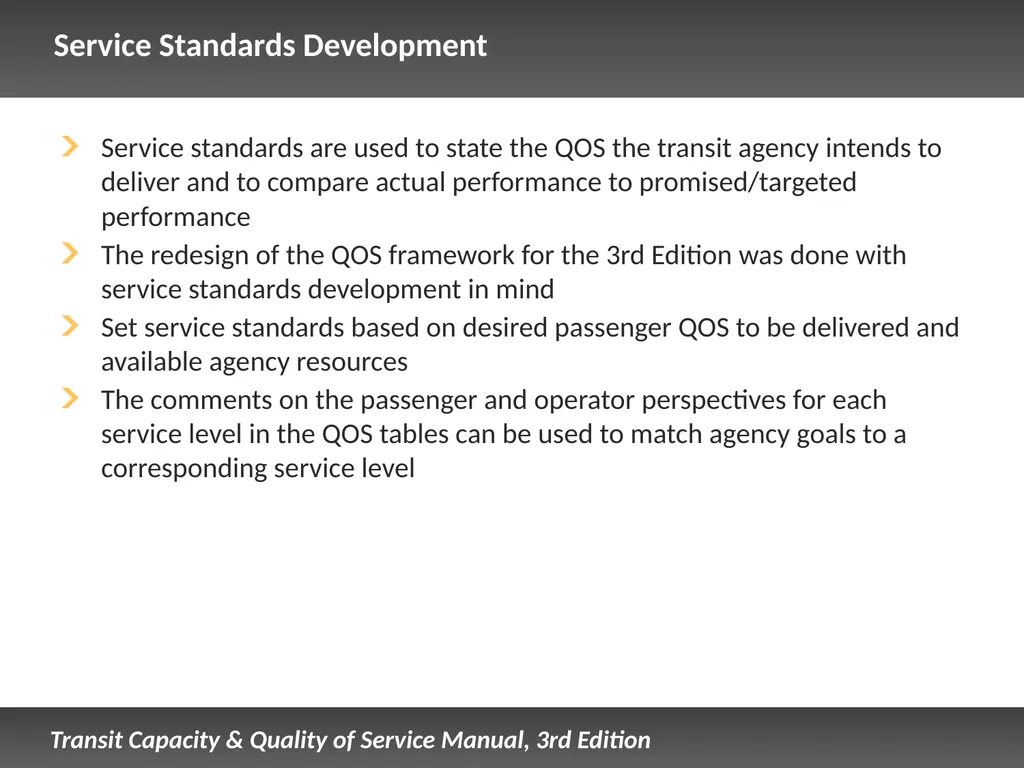
slide51. Service Standards Development Service standards are used to state the QOS the transit agency intends to deliver and to compare actual performance to promised/targeted performance
The redesign of the QOS framework for the 3rd Edition was done with service standards development in mind
Set service standards based on desired passenger QOS to be delivered and available agency resources
The comments on the passenger and operator perspectives for each service level in the QOS tables can be used to match agency goals to a corresponding service level<br>
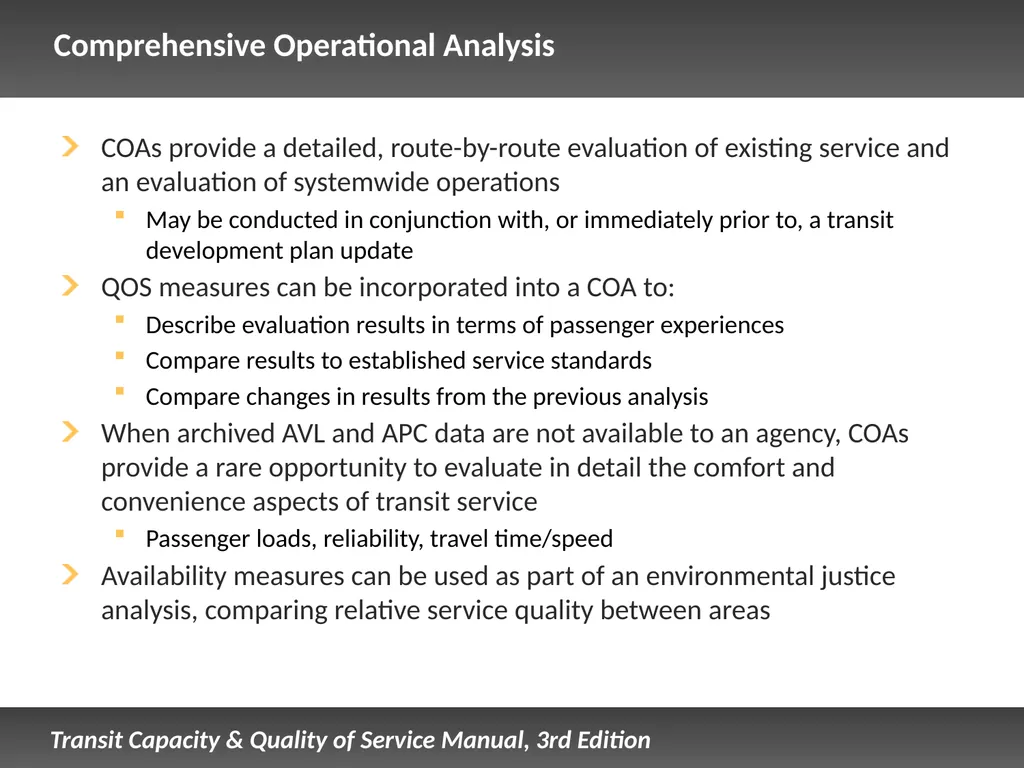
slide52. Comprehensive Operational Analysis COAs provide a detailed, route-by-route evaluation of existing service and an evaluation of systemwide operations
May be conducted in conjunction with, or immediately prior to, a transit development plan update
QOS measures can be incorporated into a COA to:
Describe evaluation results in terms of passenger experiences
Compare results to established service standards
Compare changes in results from the previous analysis
When archived AVL and APC data are not available to an agency, COAs provide a rare opportunity to evaluate in detail the comfort and convenience aspects of transit service
Passenger loads, reliability, travel time/speed
Availability measures can be used as part of an environmental justice analysis, comparing relative service quality between areas<br>
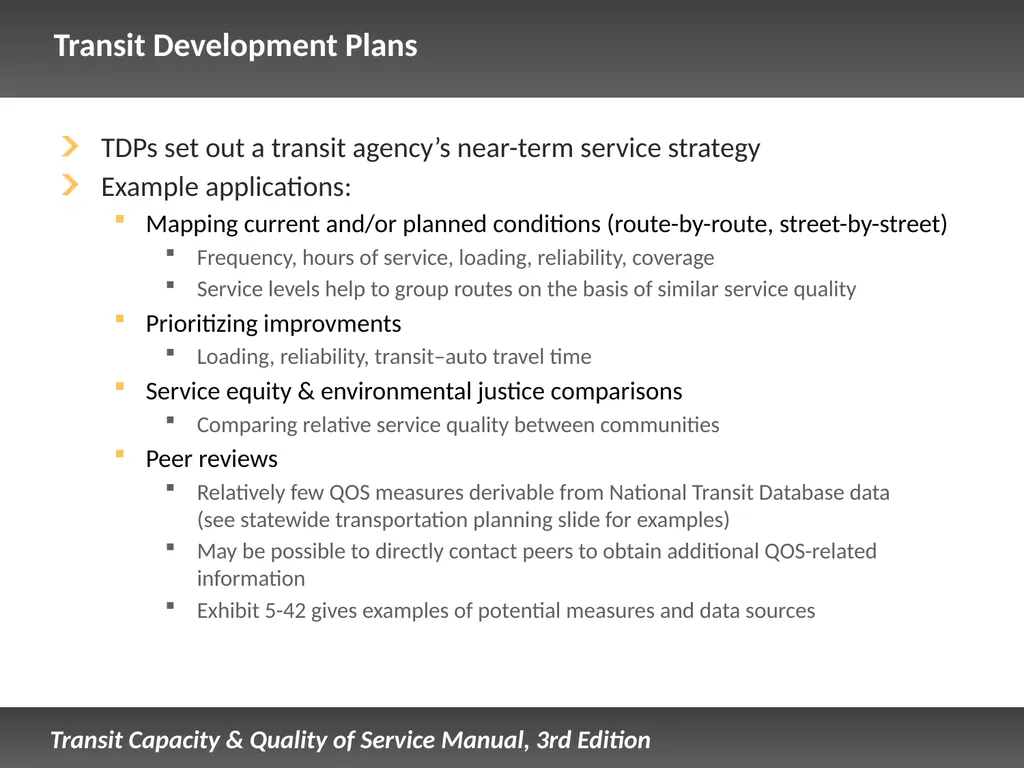
slide53. Transit Development Plans TDPs set out a transit agency’s near-term service strategy
Example applications:
Mapping current and/or planned conditions (route-by-route, street-by-street)
Frequency, hours of service, loading, reliability, coverage
Service levels help to group routes on the basis of similar service quality
Prioritizing improvments
Loading, reliability, transit–auto travel time
Service equity & environmental justice comparisons
Comparing relative service quality between communities
Peer reviews
Relatively few QOS measures derivable from National Transit Database data (see statewide transportation planning slide for examples)
May be possible to directly contact peers to obtain additional QOS-related information
Exhibit 5-42 gives examples of potential measures and data sources<br>
slide54. Service Planning Service monitoring
Regularly compare existing service to adopted service standards, and make adjustments as needed when service falls outside the standards
Loading, reliability are commonly monitored
QOS tables can be used to set realistic expectations
Service development
Identify service requirements for new/future developments when fully built out
Identify and prioritize origin–destination patterns that may require quicker transit connections
Prioritize locations/corridors for transit prefererential treatments and/or operations measures to improve speed and reliability<br>
slide55. Corridor Planning Corridor master plans, preliminary design/project development studies, and premium transit studies address improvements over an extended section of roadway
Transit may the focus of the study, or one of multiple modes addressed
Example applications:
Scoping transit improvements (guideways, spot improvements)
Identifying access improvements to transit stops
Determining required service frequency to meet a given ridership demand at a given passenger load service standard<br>
slide56. More Information TCRP Report 165: TCQSM
Chapter 4, Quality of Service Concepts
Chapter 5, Quality of Service Methods
The TCQSM is available as:
Free individual printed copies and PDF downloads through the TCRP Dissemination Program http://www.tcrponline.org
Free PDF downloads directly from TCRP http://www.trb.org/TCRP/Public/TCRP.aspx (Publications section) or simply do an Internet search for the report number (e.g., TCRP Report 165)
Individual or multiple copy purchases from the TRB Bookstore http://books.trbbookstore.org/<br>
slide57. Acknowledgments and Permissions Presentation author
Paul Ryus (Kittelson & Associates, Inc.)
Photo credits
All photos: Paul Ryus
This presentation was developed through TCRP Project A-15C
Research team: Kittelson & Associates; Parsons Brinkerhoff, Quade & Douglass; KFH Group; Texas A&M Transportation Institute; and Arup
This presentation and its contents may be freely distributed and used, with appropriate credit to the presentation authors and photographers, and the Transit Cooperative Research Program<br>
slide2. Presentation Overview Learning objectives
Performance points of view
Quality of service factors
Quality of service framework
Quality of service measures
Applications<br>
slide3. Learning Objectives Gain an understanding of the different stakeholder perspectives that can be taken with respect to transit performance
Understand the key components of passengers’ perceptions of transit service quality
Be able to define quality of service (QOS)
Become familiar with the TCQSM’s approach to fixed-route QOS:
Framework
Service measures focused toward transit agencies
Multimodal level of service measure focused toward planning and engineering applications
Become familiar with potential applications of the manual’s QOS measures to real-world transportation planning and transit activities<br>
slide4. Changes from the 2nd Edition Reorganized transit quality of service framework
Clearer guidance on performance measures that can be applied to stop, route/street segment, and system levels of analysis
Removed level of service (LOS) letters from QOS tables
Responding to transit agency concerns about being “graded”
Allows more or fewer service levels, as appropriate for a given measure
Added a new “multimodal transit LOS measure”
Responding to planning agency needs for multimodal LOS evalution
Can be used in conjunction with corresponding measures for the auto, pedestrian, and bicycle modes
Spreadsheet tool provided to help calculate the measure
New section on potential applications of QOS to real-world transit and transportation planning activities<br>
slide5. Performance Points of View<br>
slide6. Transit Performance Viewpoints What aspects of transit performance might each of these groups be most interested in?
The transit agency
The community as a whole
The public works department
Transit passengers<br>
slide7. Examples of Measuring Different Stakeholder Viewpoints<br>
slide8. The Ultimate Transit Service As a passenger, what would your ideal transit service be like?<br>
slide9. The Ultimate Transit Service Since we can’t have the ultimate transit service, what trade-offs do we make?<br>
slide10. Transit Performance Viewpoints Quality of service focuses on the passenger point of view
Other points of view are also valid and need to be considered
May have conflicting objectives (e.g., passenger comfort vs. agency resources)
Best-quality passenger service may not be feasible or desirable<br>
slide11. Quality of Service Factors<br>
slide12. What Matters to Customers? Customer satisfaction surveys provide insights
TCRP Project B-11 (customer satisfaction surveying methods)
Florida transit agency on-board surveys
NCHRP Project 3-92 (multimodal urban street level of service)
Typical factors:
Frequency, wait time, service span
Reliability
Service close to home, destination
Crowding
Fares, driver friendliness, safety/security<br>
slide13. What Matters to Customers? Factors can be divided into two main areas:
Service availability
Is transit an option?
Comfort and convenience
If it is an option, would you want to use it?<br>
slide14. Spatial Availability (Origin) Temporal
Availability Information
Availability Spatial Availability (Destination) Service Availability Is transit an option for a particular trip?
All five of these factors must be satisfied Capacity
Availability<br>
slide15. Spatial Availability (Origin) Temporal
Availability Information
Availability Spatial Availability (Destination) Service Availability Is there a transit stop within walking distance?
OR is demand responsive or private shuttle service available?
OR is a car AND a convenient park-and-ride available?
OR is a bicycle AND bicycle storage available?
OR is a bicycle available AND can it be brought onboard? Capacity
Availability<br>
slide16. Spatial Availability (Origin) Temporal
Availability Information
Availability Spatial Availability (Destination) Service Availability Is there a transit stop within walking distance?
OR is demand responsive or private shuttle service available?
OR is a bicycle available AND can it be brought onboard?
OR is a bike-sharing station with bicycles available? Capacity
Availability<br>
slide17. Spatial Availability (Origin) Temporal
Availability Information
Availability Spatial Availability (Destination) Service Availability Is service offered at or near the times required? Capacity
Availability<br>
slide18. Spatial Availability (Origin) Temporal
Availability Information
Availability Spatial Availability (Destination) Service Availability Are the schedule and routing known?
OR is telephone, text, or Internet information offered, the service available when customers use it, and the information accurately provided? Capacity
Availability<br>
slide19. Spatial Availability (Origin) Temporal
Availability Information
Availability Spatial Availability (Destination) Service Availability Is space available to board the transit vehicle when it arrives?
When applicable:
Is space available in the park-and ride lot?
Is there an open spot on the bicycle rack OR is secure bicycle parking available at the stop?
Is there an available wheelchair position inside the vehicle? Capacity
Availability<br>
slide20. Typical Comfort and Convenience Factors In-vehicle crowding
Can I get a seat, will I have to stand & for how long, how crowded is it?
Reliability
Can I expect to get to my destination at the scheduled time, or do I need to allow extra time?
Travel time
How long will my door-to-door trip take? How long would the same trip take using other modes? Will I have to transfer, and how easy is it?
Pedestrian and bicycle environment
Can I get to and from transit stops safely and directly?
Cost
How much will my trip cost? How easy is it to pay my fare? How much do would other travel options cost?
Safety and security
Amenities, appearance, maintenance, driver friendliness<br>
slide21. Quality of Service Framework<br>
slide22. Developing the QOS Framework User outreach efforts during the development of the 3rd Edition found two main user groups for the QOS framework
Transit agencies
Like being able to evaluate many different aspects of QOS
Don’t like level of service (LOS) letters A-F: look too much like grades
Planning agencies
Comfortable with the LOS concept, apply it to other modes
Prefer a single LOS measure that can be compared to other modes
Both groups agreed that the 2nd Edition framework was measuring the right QOS factors
3rd Edition QOS methods designed to meet the needs of both groups<br>
slide23. QOS Framework Changes The 3rd Edition retains the basic QOS framework for transit agencies
Three aspects of availability, three aspects of comfort & convenience
Specific performance measure used for a given aspect may vary depending on scale of analysis (stop/route/system), vehicle type, or service type
Service level tables have been retained
LOS numbers and letters have been removed
Number of service levels allowed to vary from 6 as appropriate
Comments on the operator point-of-view for a given service level have been added to the existing comments on the passenger point-of-view
Designed to support service standards development and aid in interpreting evaluations of existing and future conditions<br>
slide24. LOS Approach: 1st and 2nd Editions TSA = transit supportive area (≥3 households/gross acre or ≥4 jobs/gross acre) Service coverage example<br>
slide25. QOS Approach: 3rd Edition<br>
slide26. Multimodal Transit LOS Measure The 3rd Edition adds a “multimodal transit LOS measure” for planning agencies
Measure developed by the NCHRP 3-92 project and subsequently incorporated into the Highway Capacity Manual 2010
Provides A-F letters indicating the level of service
Incorporates most of the same factors in the QOS framework, but provides a single LOS measure
Access to transit: pedestrian environment
Waiting for transit: frequency, reliability, shelter/bench presence
On-board experience: passenger loads, transit speed
Index values and associated LOS letters can be directly compared to those from companion measures for the auto, bicycle, and pedestrian modes
Can be used to evaluate trade-offs in traveler satisfaction when allocating street right-of-way between modes
Spreadsheet included on the CD-ROM to help perform the calculations<br>
slide27. Quality of Service Measures<br>
slide28. Frequency Transit service can only be used at discrete times
If service is only offered hourly, there is a very small window of time during the hour when a transit trip can be started immediately
More-frequent service provides more opportunities for immediate travel
Transit service more closely resembles competing modes (auto, bicycle, pedestrian) in terms of departure time convenience
Frequency is attractive to passengers
Ridership increases as frequency increases, although a diminishing returns principle applies
Frequency is a key driver of operating costs
Improvements to speed and reliability can allow better frequency at the same cost
When transfers are involved, frequency is only as good as the weakest link in the trip<br>
slide29. Frequency QOS Seven levels
≤5 minutes
>5 to 10 minutes
11 to 15 minutes
16 to 30 minutes
31 to 59 minutes
60 minutes
>60 minutes
QOS table listing the passenger and operator perspectives fills most of 2 pages, so only an example is shown here<br>
slide30. Service Span Service span determines the potential markets that transit serves
Starting and ending times of activities
Work
School
Medical appointments
Shopping
Longer service spans serve a greater number of potential passengers
Non-traditional work hours
Night classes
Friday & Saturday night activities
Longer service spans than needed to serve a particular market give passengers flexibility
Ability to stay late
Insurance against being stranded<br>
slide31. Service Span QOS Based on number of hours when service offered at least hourly
Six levels
>18 hours
15 to 18 hours
12 to 14 hours
7 to 11 hours
4 to 6 hours
<4 hours<br>
slide32. Service Coverage Mode used to access transit depends on distance to travel and facilities provided along the way and at the transit stop
Walking is the most common access mode for urban transit service
50-80% of persons walk ¼ mile or less to a local bus stop
50% of persons walk ½ mile or less to rail and BRT service
Terrain, street connectivity, street-crossing difficulty, demography are factors
Bicycling can extend a stop’s market area
A person can cover 4 times the distance in the same time, compared to walking
Autos used in lower-density areas to access commuter/express bus and rail transit service when park-and-ride facilities are provided
Market area depends on area topography and access road network
Typical: 50% of demand comes from within 2.5 miles of lot, 35% of demand comes from upstream up to 10 miles away from lot<br>
slide33. Transit-supportive Densities Ridership increases with density
More people (potential customers) located within a given area
Greater propensity for a given person to use transit
TCQSM provides guidance on densities capable of supporting particular service and modes
Values dependent on how much one subsidizes transit service
TCQSM values assume 33% farebox recovery (2010 US average was 27%)<br>
slide34. Service Coverage QOS Five levels
>90% of population served
>90% of transit-supportive area served
75 to 90% of transit-supportive area served
50 to 74% of transit-supportive area served
<50% of transit-supportive area served
Transit-supportive area defined as an area capable of supporting hourly weekday transit service
At least 3 households per gross acre or 4 jobs per gross acre
Assumes 33% farebox recovery
QOS planned for depends very much on transit agency’s policy emphasis: coverage vs. cost-efficiency or frequency
QOS table shown on a previous slide<br>
slide35. Passenger Loads Passengers perceive travel in crowded conditions as being more onerous than travel in less-crowded conditions, even when they have a seat
Value of time begins to increase when 80% of seats are occupied
Standing passengers’ perceived value of time considerably higher than seated passengers’
Cost-effectiveness improves as passenger loads increase
Passenger throughput generally improves as passenger loads increase
Passenger boarding & alighting times increase as the number of standing passengers on-board increases<br>
slide36. Passenger Load QOS: Vehicles Designed for Most Passengers Seated Nearly all buses, all commuter rail, all ferry, some other rail vehicles with narrow aisles and transverse seating
Six levels
Up to 50% seated load
Up to 80% seated load
Up to 100% seated load
Up to 125% seated load
Up to 150% seated load
>150% seated load<br>
slide37. Passenger Load QOS: Vehicles Designed for Most Passengers Standing Special-purpose buses, most light and heavy rail
Six levels
>1.0 m2 (10.8 ft2) per passenger
0.5 to 1.0 m2 per passenger
0.4 to 0.49 m2 per passenger
0.3 to 0.39 m2 per passenger
0.2 to 0.29 m2 per passenger
<0.2 m2 (2.2 ft2) per passenger<br>
slide38. Reliability The more unreliable the service, the more extra time passengers have to allow for their trip
Arriving at stops earlier than necessary
Taking an earlier trip than necessary
The more unreliable the service, the more recovery time that agencies need to insert into the schedule to compensate
Time could be better used in service (operating the route more frequently, operating a longer route)
Reliability issues depend in part on the scheduled headway
Short headways: bus bunching and train stopping/starting
Long headways: on-time performance, early departures<br>
slide39. Reliability QOS: Headway-based Service Applicable to service that operates at 10-min headways or better, or to service without fixed departure times
Based on headway variability (standard deviation of headways divided by the scheduled headway)
Described in terms of the probability that a passenger arriving at a stop will experience a vehicle more than ½ headway off the scheduled headway
Six service levels<br>
slide40. Reliability QOS: Schedule-based Service Applicable to service that operates to a fixed schedule
Based on on-time performance
Defined as a departure no more than 1 minute early and up to 5 minutes late
Five service levels
95-100%
90-94%
80-89%
70-79%
<70%<br>
slide41. Travel Time Travel time is an important consideration in mode choice
Travel time impacts operating costs: the slower the route, the more vehicles that are required to be in service to provide a given headway<br>
slide42. Based on the ratio of in-vehicle transit time to in-vehicle auto time
Six service levels Travel Time QOS<br>
slide43. Multimodal Transit LOS Measure draws from research into ridership response to QOS changes and passenger values of time
Three main elements:
Frequency (average % increase in ridership as frequency improves)
Travel time (average % increase in ridership as travel time decreases)
Pedestrian environment (adjusts LOS up or down based on particularly good or bad pedestrian access to a stop)
Travel times are based on perceived travel times, expressed as a travel time rate (minutes per mile)
Bus stop amenities (value of time of shelter, bench)
Reliability (excess wait time)
Passenger load (perceived travel time rate)
Travel speed (actual travel time rate)<br>
slide44. Multimodal Transit LOS<br>
slide45. Demand Responsive QOS There is a corresponding QOS framework and measures for demand responsive transit
Covered in the DRT presentation<br>
slide46. Applications<br>
slide47. Potential Applications Comprehensive planning
Long-range transportation planning
Statewide transportation planning
Service standards development
Comprehensive operational analysis
Transit development plans
Service planning
Corridor planning<br>
slide48. Comprehensive Planning Multimodal comprehensive plans provide goals, policies, and objectives for the transit service provided, or desired to be provided, within a city or county
Service goals may be aspirational (city/county is not the service provider)
Service goals may become the basis for service standards (city/county is the service provider)
QOS measures relating to availability can be used in setting objectives
For example, minimum span of service for trunk and local routes
Information in QOS chapters can be used to demonstrate the impact of different land use densities, street connectivity, and sidewalk provision policies on transit access
Impact on ridership
Impact on number of households/persons with transit access
Impact on transit operating costs (e.g., number of route miles required to meet a service coverage goal)<br>
slide49. Long-range Transportation Planning LRTPs identify city- or region-wide transportation needs over a longer period of time (e.g., 20 years)
If plan preparer is not the service provider, LRTPs often focus on the actions that can be taken to support transit (e.g., sidewalk improvements)
If plan preparer is the service provider, the transit element may be more specific and contain many of the elements of a transit development plan
A common application of the TCQSM 1st and 2nd Editions was to evaluate existing transit service quality
Much more valuable to also use it to evaluate service quality provided by various future alternatives, to aid decision-making
Possible types of analysis:
Activity center analysis (origin–destination trips)
Corridor analysis (transit streets, priority/frequent bus network)
Service coverage analysis (areawide, corridor)<br>
slide50. Statewide Transportation Planning QOS measures derivable from National Transit Database data can be used to track trends in fixed-route transit provision across the state
Statewide, or broken out into population ranges
Example measures
Average system peak-period headway
Average system speed (revenue miles/revenue hours)
System service span
Measures require no special data collection<br>
slide51. Service Standards Development Service standards are used to state the QOS the transit agency intends to deliver and to compare actual performance to promised/targeted performance
The redesign of the QOS framework for the 3rd Edition was done with service standards development in mind
Set service standards based on desired passenger QOS to be delivered and available agency resources
The comments on the passenger and operator perspectives for each service level in the QOS tables can be used to match agency goals to a corresponding service level<br>
slide52. Comprehensive Operational Analysis COAs provide a detailed, route-by-route evaluation of existing service and an evaluation of systemwide operations
May be conducted in conjunction with, or immediately prior to, a transit development plan update
QOS measures can be incorporated into a COA to:
Describe evaluation results in terms of passenger experiences
Compare results to established service standards
Compare changes in results from the previous analysis
When archived AVL and APC data are not available to an agency, COAs provide a rare opportunity to evaluate in detail the comfort and convenience aspects of transit service
Passenger loads, reliability, travel time/speed
Availability measures can be used as part of an environmental justice analysis, comparing relative service quality between areas<br>
slide53. Transit Development Plans TDPs set out a transit agency’s near-term service strategy
Example applications:
Mapping current and/or planned conditions (route-by-route, street-by-street)
Frequency, hours of service, loading, reliability, coverage
Service levels help to group routes on the basis of similar service quality
Prioritizing improvments
Loading, reliability, transit–auto travel time
Service equity & environmental justice comparisons
Comparing relative service quality between communities
Peer reviews
Relatively few QOS measures derivable from National Transit Database data (see statewide transportation planning slide for examples)
May be possible to directly contact peers to obtain additional QOS-related information
Exhibit 5-42 gives examples of potential measures and data sources<br>
slide54. Service Planning Service monitoring
Regularly compare existing service to adopted service standards, and make adjustments as needed when service falls outside the standards
Loading, reliability are commonly monitored
QOS tables can be used to set realistic expectations
Service development
Identify service requirements for new/future developments when fully built out
Identify and prioritize origin–destination patterns that may require quicker transit connections
Prioritize locations/corridors for transit prefererential treatments and/or operations measures to improve speed and reliability<br>
slide55. Corridor Planning Corridor master plans, preliminary design/project development studies, and premium transit studies address improvements over an extended section of roadway
Transit may the focus of the study, or one of multiple modes addressed
Example applications:
Scoping transit improvements (guideways, spot improvements)
Identifying access improvements to transit stops
Determining required service frequency to meet a given ridership demand at a given passenger load service standard<br>
slide56. More Information TCRP Report 165: TCQSM
Chapter 4, Quality of Service Concepts
Chapter 5, Quality of Service Methods
The TCQSM is available as:
Free individual printed copies and PDF downloads through the TCRP Dissemination Program http://www.tcrponline.org
Free PDF downloads directly from TCRP http://www.trb.org/TCRP/Public/TCRP.aspx (Publications section) or simply do an Internet search for the report number (e.g., TCRP Report 165)
Individual or multiple copy purchases from the TRB Bookstore http://books.trbbookstore.org/<br>
slide57. Acknowledgments and Permissions Presentation author
Paul Ryus (Kittelson & Associates, Inc.)
Photo credits
All photos: Paul Ryus
This presentation was developed through TCRP Project A-15C
Research team: Kittelson & Associates; Parsons Brinkerhoff, Quade & Douglass; KFH Group; Texas A&M Transportation Institute; and Arup
This presentation and its contents may be freely distributed and used, with appropriate credit to the presentation authors and photographers, and the Transit Cooperative Research Program<br>