Francesca Grum Chief, Social and Gender Statistics
Description: Francesca Grum Chief, Social and Gender Statistics Section United Nations Statistics Division Time use surveys Modernizing Time use surveys, in line with ICATUS2016 2 We use time-use data How can we produce time-use data more efficiently?
Related Topics
Download Presentation
"Francesca Grum Chief, Social and Gender Statistics" is the property of its rightful owner. Permission is granted to download and print the materials on this website for personal, non-commercial use only, and to display it on your personal computer provided you do not modify the materials and that you retain all copyright notices contained in the materials. By downloading content from our website, you accept the terms of this agreement.
Presentation Transcript
slide1. Francesca Grum
Chief, Social and Gender Statistics Section
United Nations Statistics Division Time use surveysModernizing Time use surveys, in line with ICATUS2016<br>
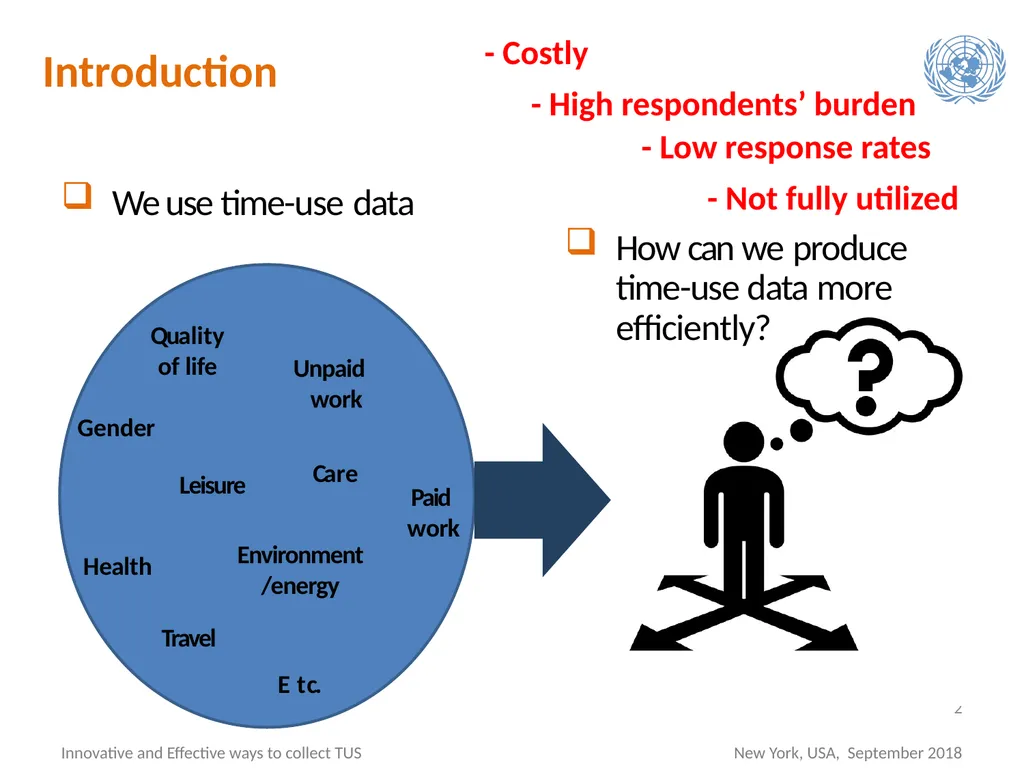
slide2. 2 We use time-use data How can we produce time-use data more efficiently? Unpaid work Care Paid work Quality
of life Gender Leisure Health Environment
/energy Travel
E tc. Introduction - Costly - High respondents’ burden - Low response rates - Not fully utilized<br>
slide3. INSTRUMENTS 3<br>
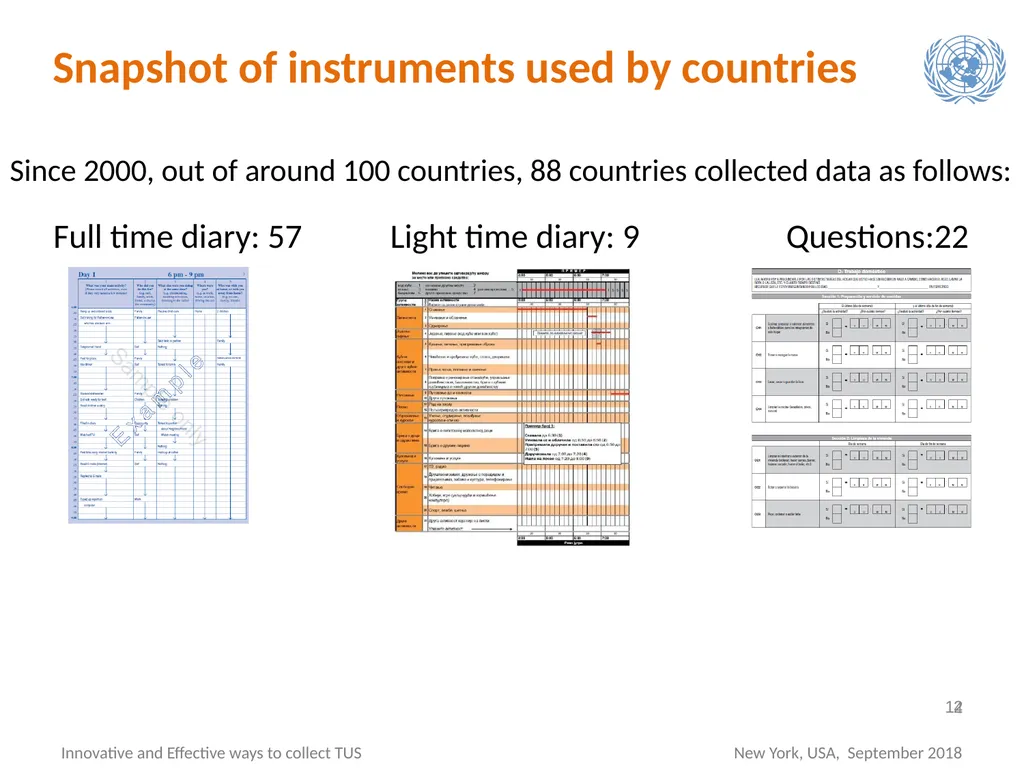
slide4. Snapshot of instruments used by countries 12 Since 2000, out of around 100 countries, 88 countries collected data as follows:
Full time diary: 57 Light time diary: 9 Questions:22 4<br>
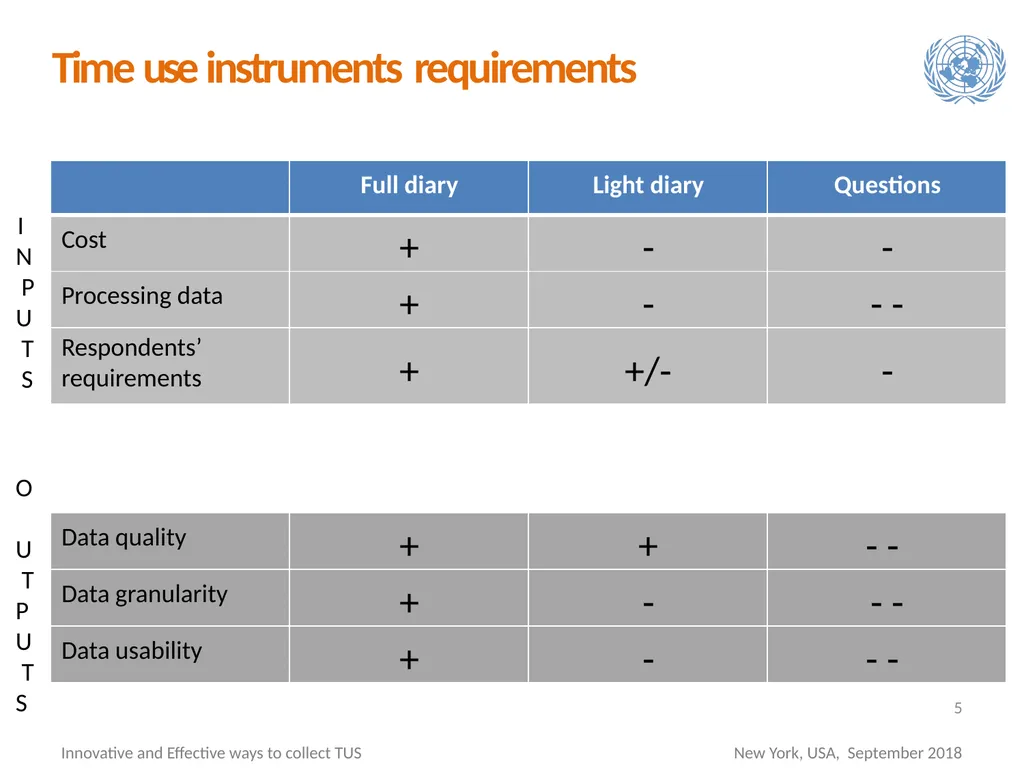
slide5. Time use instruments requirements I N P U T S
O U T P U T S 5<br>
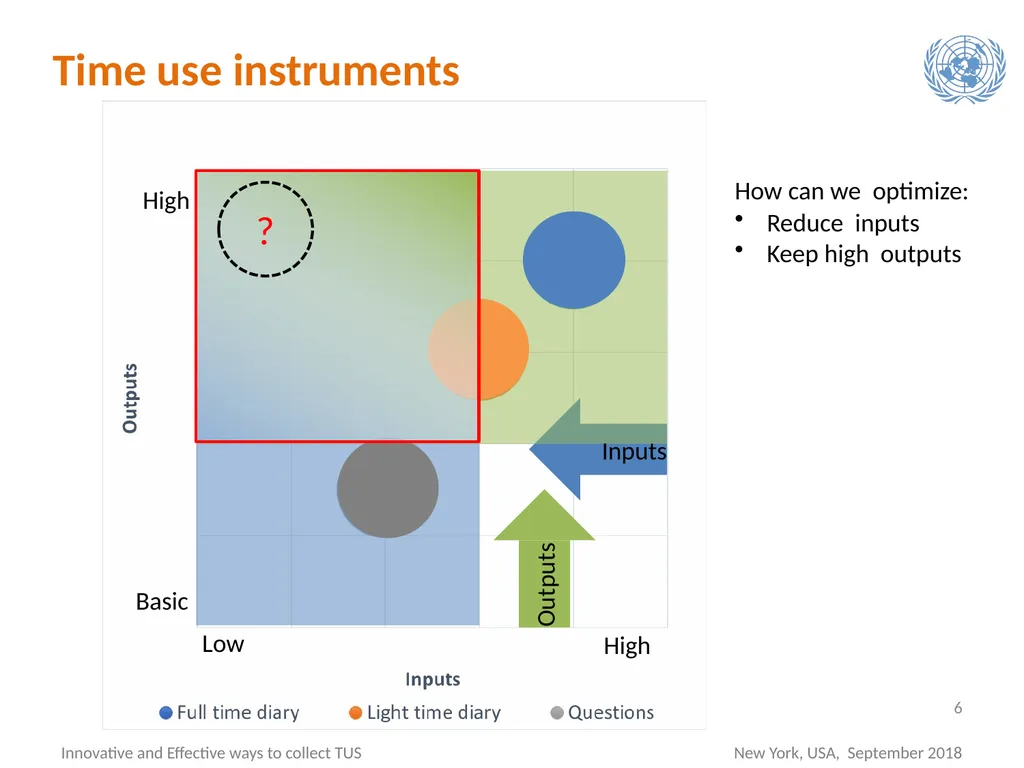
slide6. Time use instruments Low High High Basic How can we optimize:
Reduce inputs
Keep high outputs Inputs Outputs ? 6<br>
slide7. 7 Data collection MODES<br>
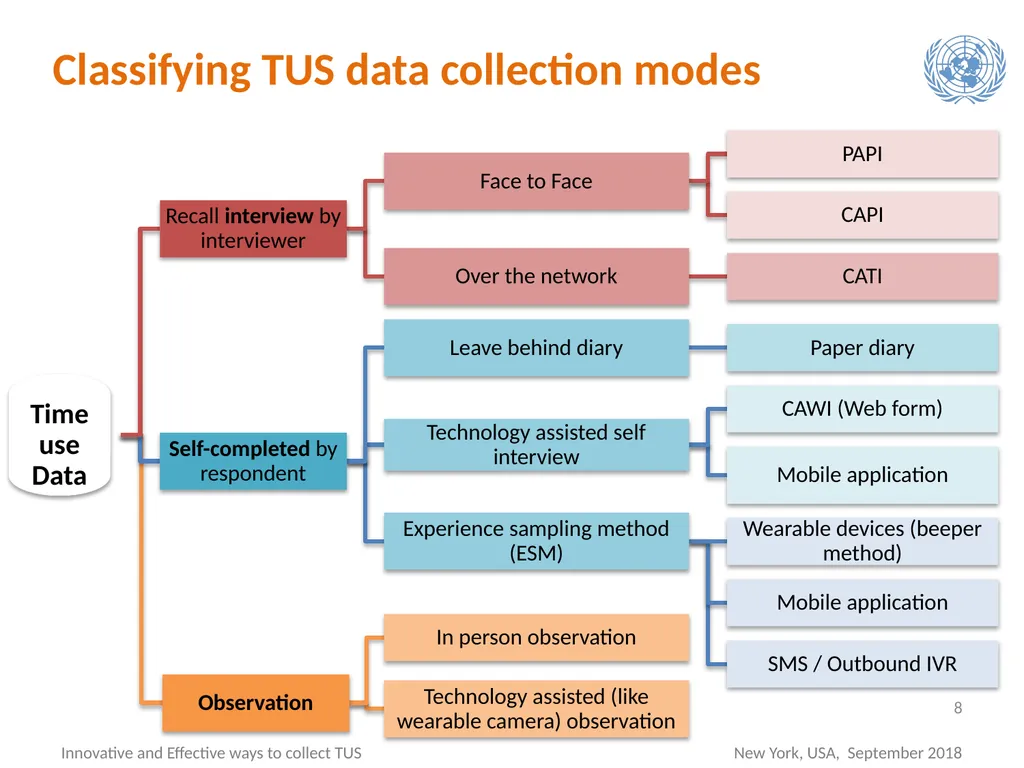
slide8. Classifying TUS data collection modes 8<br>
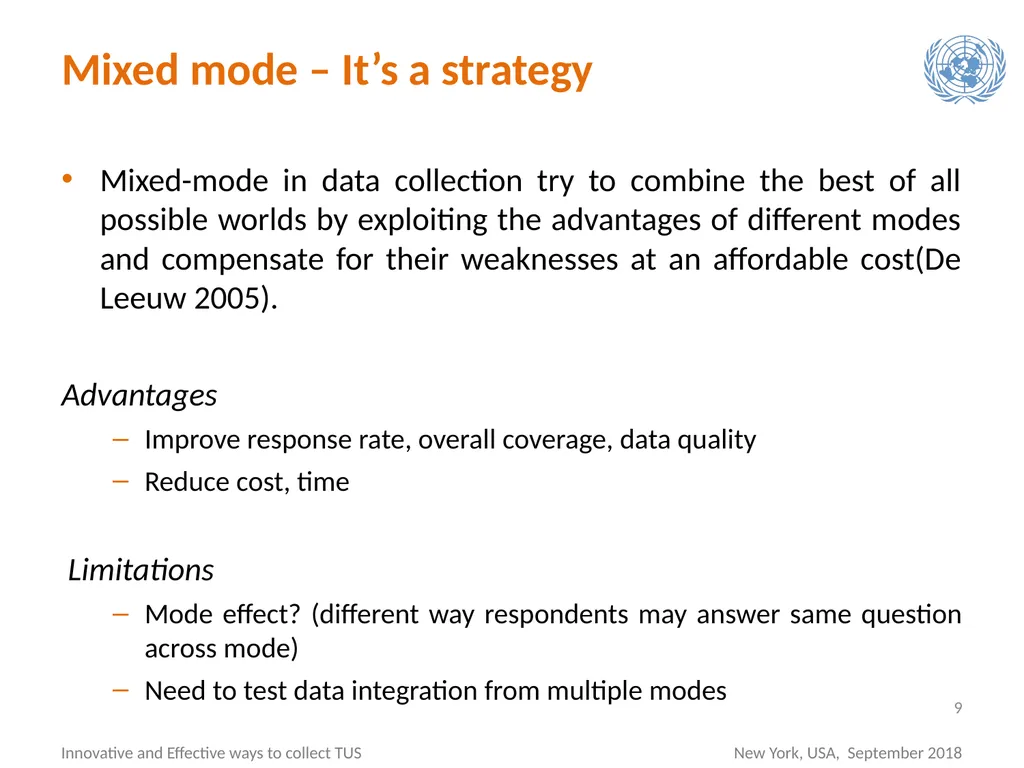
slide9. Mixed mode – It’s a strategy Mixed-mode in data collection try to combine the best of all possible worlds by exploiting the advantages of different modes and compensate for their weaknesses at an affordable cost(De Leeuw 2005).
Advantages
Improve response rate, overall coverage, data quality
Reduce cost, time
Limitations
Mode effect? (different way respondents may answer same question across mode)
Need to test data integration from multiple modes 9<br>
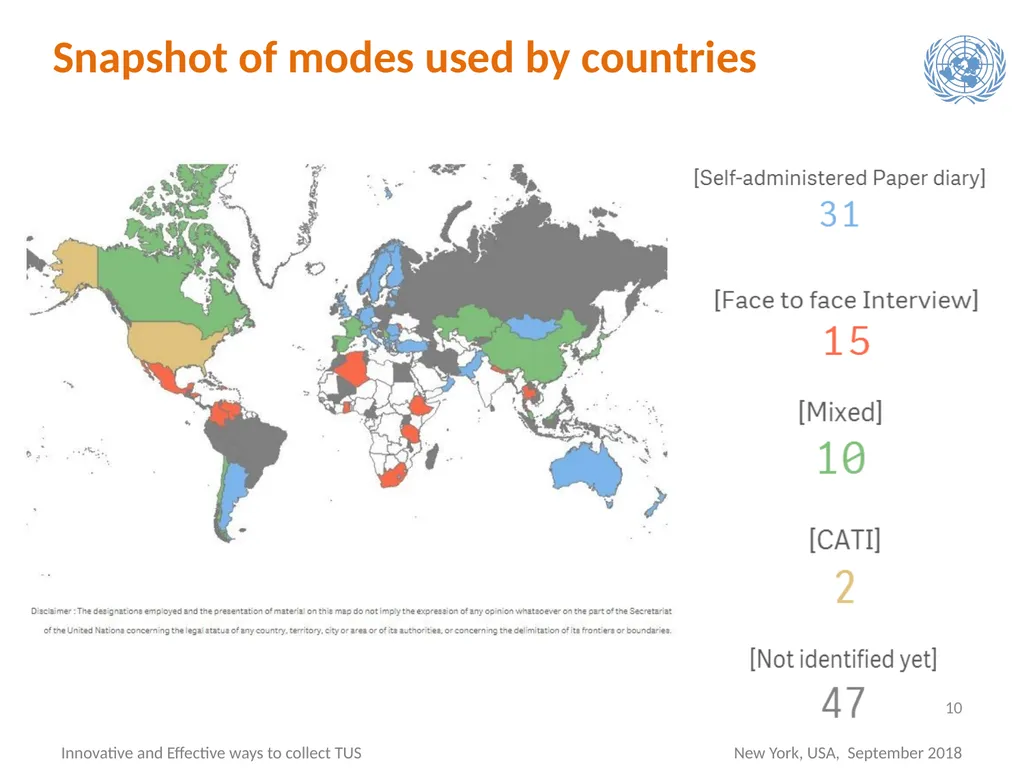
slide10. 10 Snapshot of modes used by countries<br>
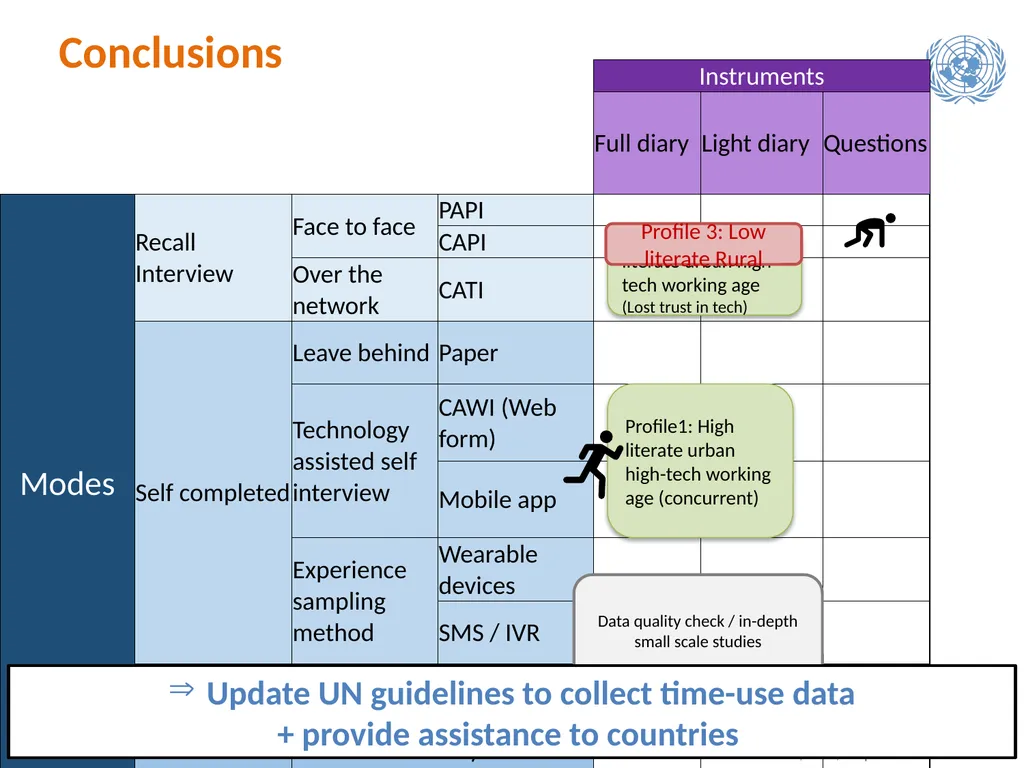
slide11. Conclusions 11 Data quality check / in-depth small scale studies Profile1: High literate urban high-tech working age (concurrent) Profile 2: High literate urban high-tech working age
(Lost trust in tech) Profile 3: Low literate Rural Update UN guidelines to collect time-use data
+ provide assistance to countries<br>
slide12. Thank you!
http://unstats.un.org/unsd/gender/default.html 12<br>
Chief, Social and Gender Statistics Section
United Nations Statistics Division Time use surveysModernizing Time use surveys, in line with ICATUS2016<br>
slide2. 2 We use time-use data How can we produce time-use data more efficiently? Unpaid work Care Paid work Quality
of life Gender Leisure Health Environment
/energy Travel
E tc. Introduction - Costly - High respondents’ burden - Low response rates - Not fully utilized<br>
slide3. INSTRUMENTS 3<br>
slide4. Snapshot of instruments used by countries 12 Since 2000, out of around 100 countries, 88 countries collected data as follows:
Full time diary: 57 Light time diary: 9 Questions:22 4<br>
slide5. Time use instruments requirements I N P U T S
O U T P U T S 5<br>
slide6. Time use instruments Low High High Basic How can we optimize:
Reduce inputs
Keep high outputs Inputs Outputs ? 6<br>
slide7. 7 Data collection MODES<br>
slide8. Classifying TUS data collection modes 8<br>
slide9. Mixed mode – It’s a strategy Mixed-mode in data collection try to combine the best of all possible worlds by exploiting the advantages of different modes and compensate for their weaknesses at an affordable cost(De Leeuw 2005).
Advantages
Improve response rate, overall coverage, data quality
Reduce cost, time
Limitations
Mode effect? (different way respondents may answer same question across mode)
Need to test data integration from multiple modes 9<br>
slide10. 10 Snapshot of modes used by countries<br>
slide11. Conclusions 11 Data quality check / in-depth small scale studies Profile1: High literate urban high-tech working age (concurrent) Profile 2: High literate urban high-tech working age
(Lost trust in tech) Profile 3: Low literate Rural Update UN guidelines to collect time-use data
+ provide assistance to countries<br>
slide12. Thank you!
http://unstats.un.org/unsd/gender/default.html 12<br>