FRE 501 2013 Lab 2 Game Preparation Mission Statement (refined) Understand how commodity futures markets work, Formulate and refine trading and hedging strategies, Learn and practice risk management, In preparation for future professional
Related Topics
Share
Embed code
Download this presentation From Below
"FRE 501 2013 Lab 2 Game Preparation Mission" is the property of its rightful owner. Permission is granted to
download and print the materials on this website for personal, non-commercial use only, and to display it
on your personal computer provided you do not modify the materials and that you retain all copyright
notices contained in the materials. By downloading content from our website, you accept the terms of this
agreement.
Presentation Transcript
01
FRE 501 2013 Lab 2 Game Preparation<br>
02
Mission Statement (refined) Understand how commodity futures markets work,
Formulate and refine trading and hedging strategies, Learn and practice risk management,
In preparation for future professional roles<br>
03
Agenda Background Reading
Contract Specifics
Futures Curves
Basic commodity relationships
What to look out for<br>
04
Background Reading The Origin of Futures Markets: An MFRE Tale
Questions?
Additional Resources:
Lecture by Robert Shiller on Forwards vs Futures http://oyc.yale.edu/economics/econ-252-11/lecture-15<br>
05
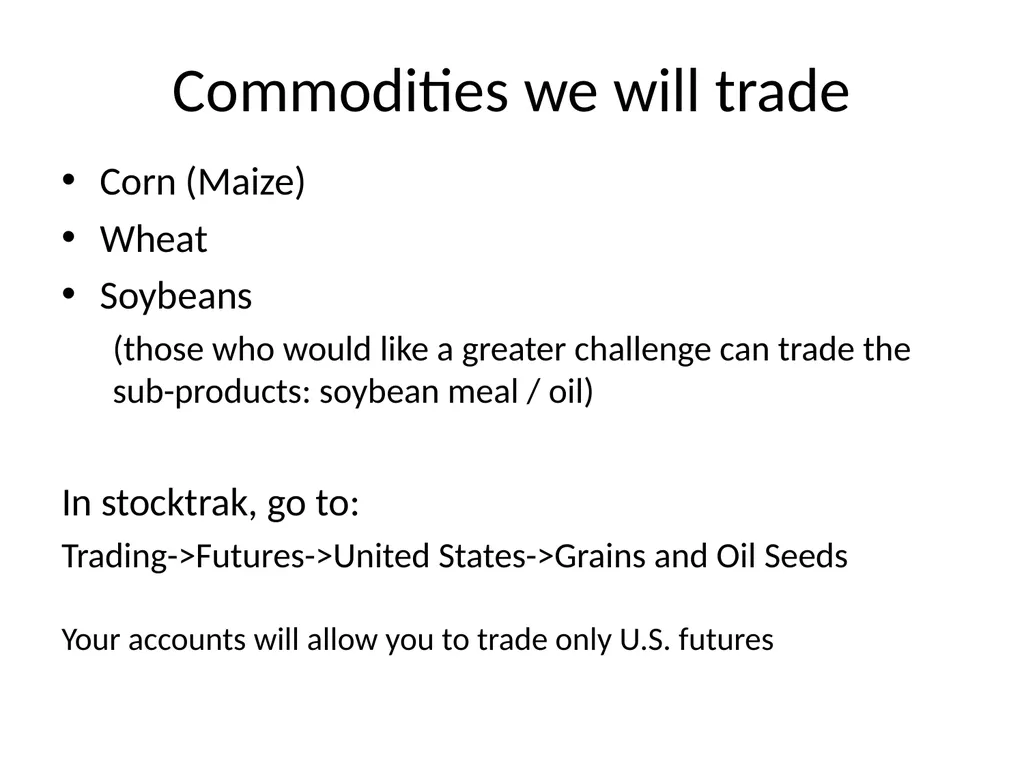
Commodities we will trade Corn (Maize)
Wheat
Soybeans
(those who would like a greater challenge can trade the sub-products: soybean meal / oil)
In stocktrak, go to:
Trading->Futures->United States->Grains and Oil Seeds Your accounts will allow you to trade only U.S. futures<br>
06
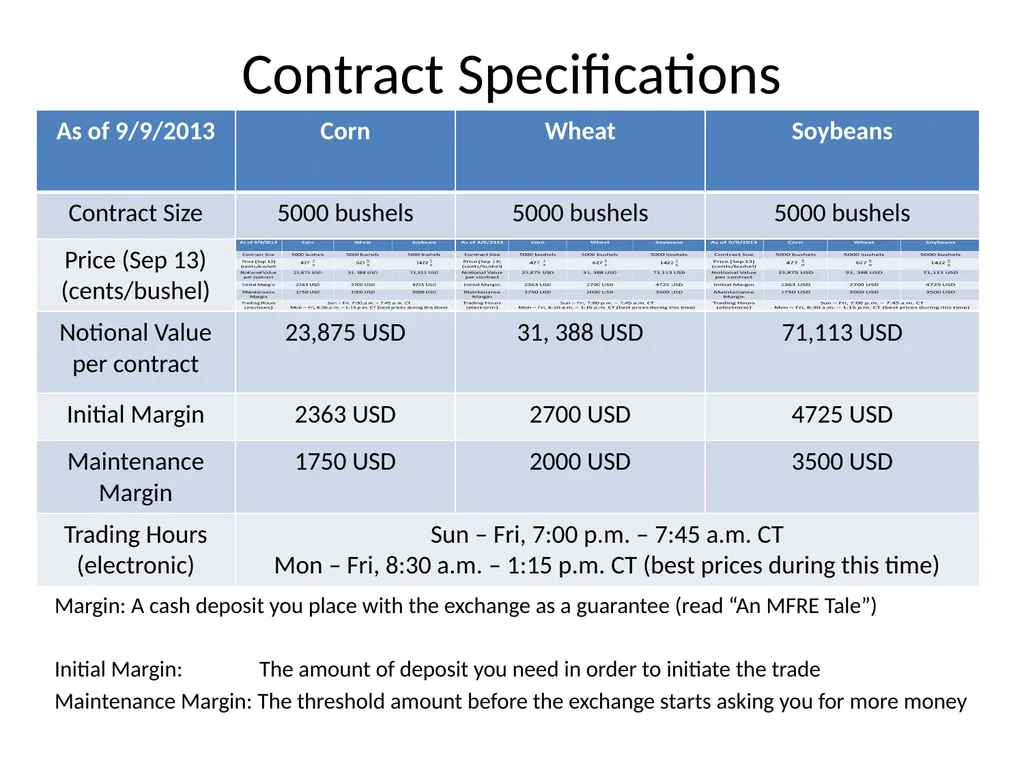
Contract Specifications Margin: A cash deposit you place with the exchange as a guarantee (read “An MFRE Tale”)
Initial Margin: The amount of deposit you need in order to initiate the trade
Maintenance Margin: The threshold amount before the exchange starts asking you for more money<br>
07
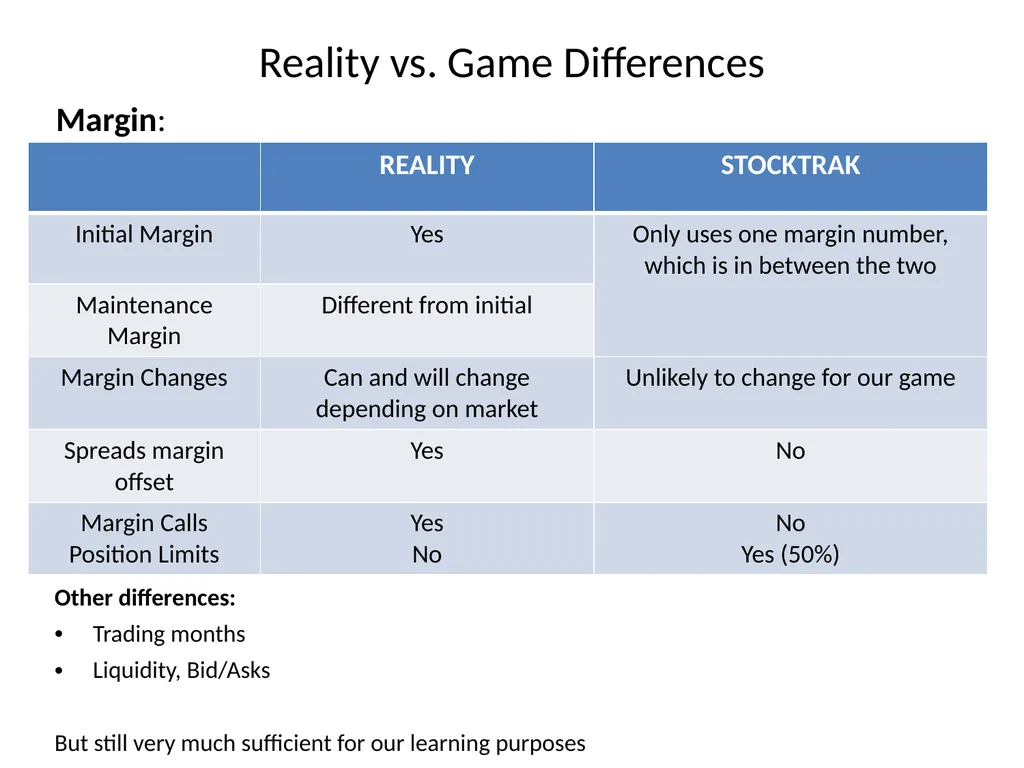
Reality vs. Game Differences Margin: Other differences:
Trading months
Liquidity, Bid/Asks
But still very much sufficient for our learning purposes<br>
08
Futures Curves
Which Contracts to trade<br>
09
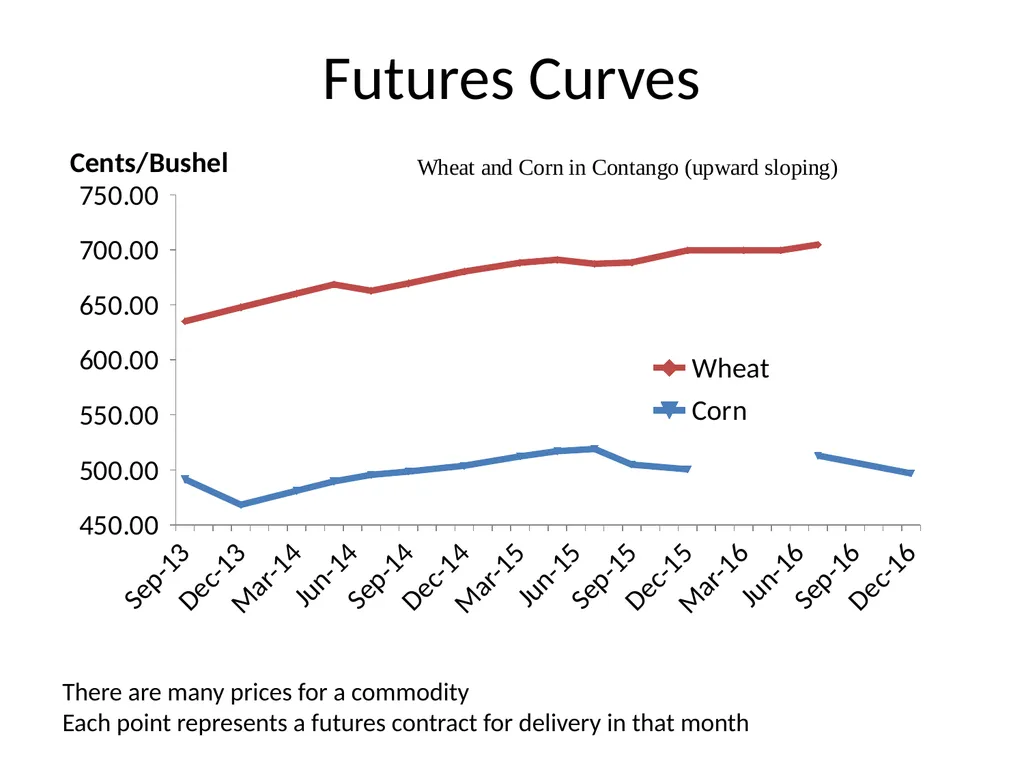
Futures Curves There are many prices for a commodity
Each point represents a futures contract for delivery in that month<br>
10
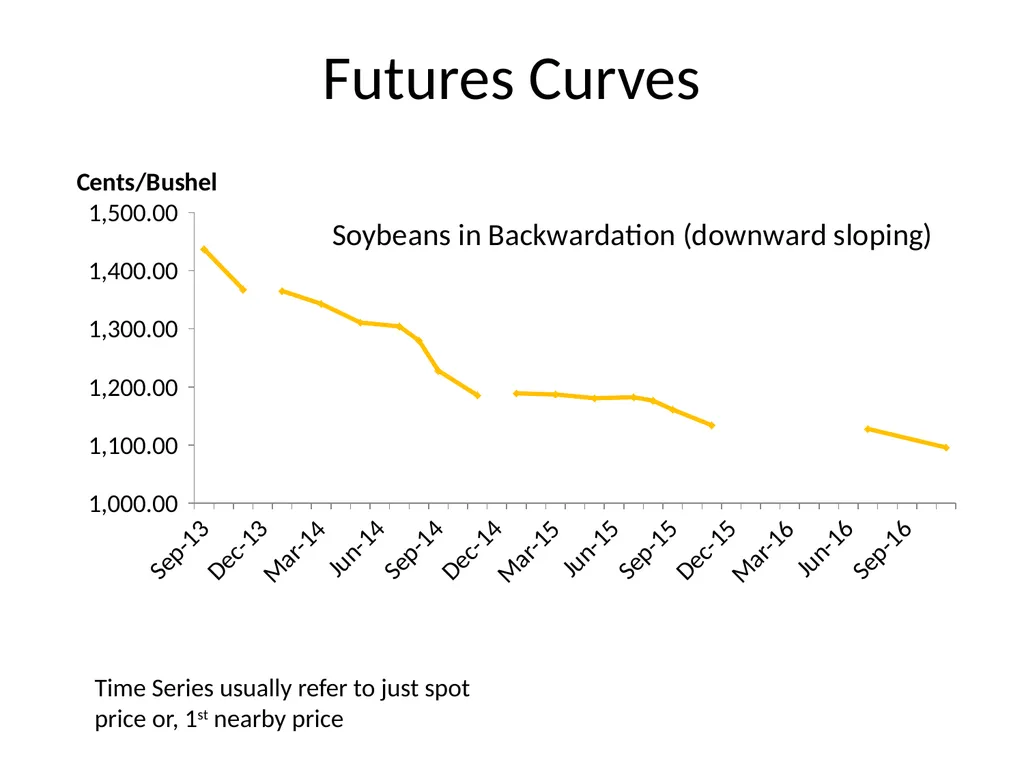
Futures Curves Time Series usually refer to just spot price or, 1st nearby price<br>
11
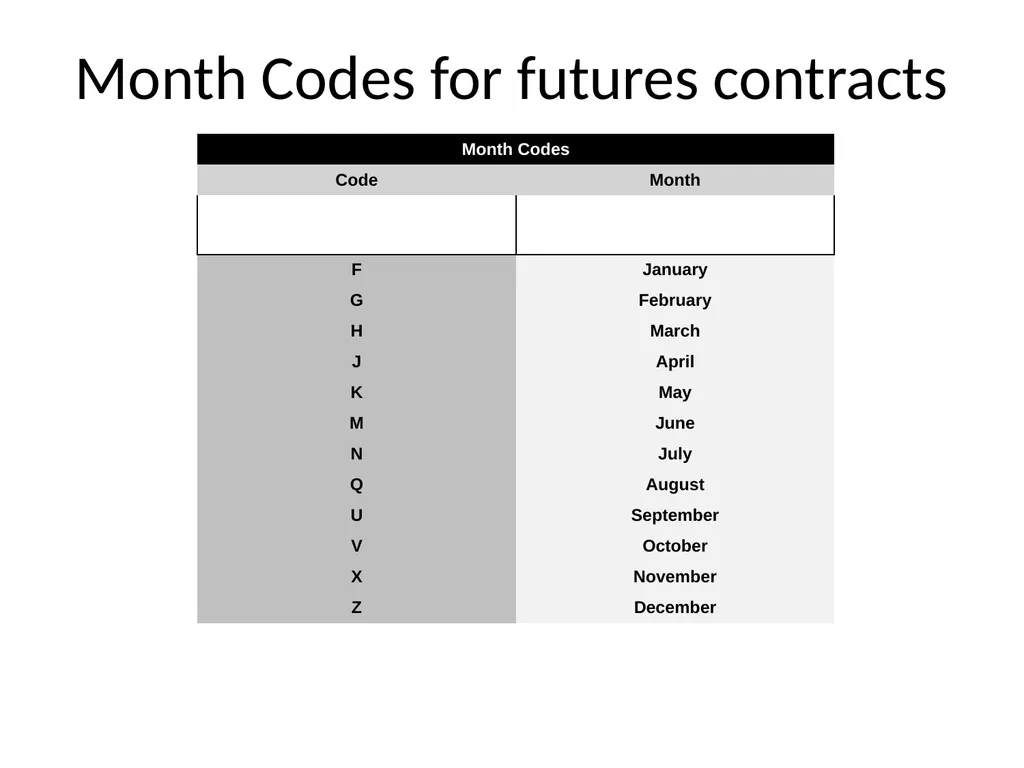
Month Codes for futures contracts<br>
12
Which contract to trade Focus on trading the nearby months:
They are the most volatile and sensitive to supply/demand shocks
In reality, they are also the most liquid (most market participants here, highest volume)
Don’t trade the Sep 2013 contract – won’t have to worry about rolling contracts<br>
13
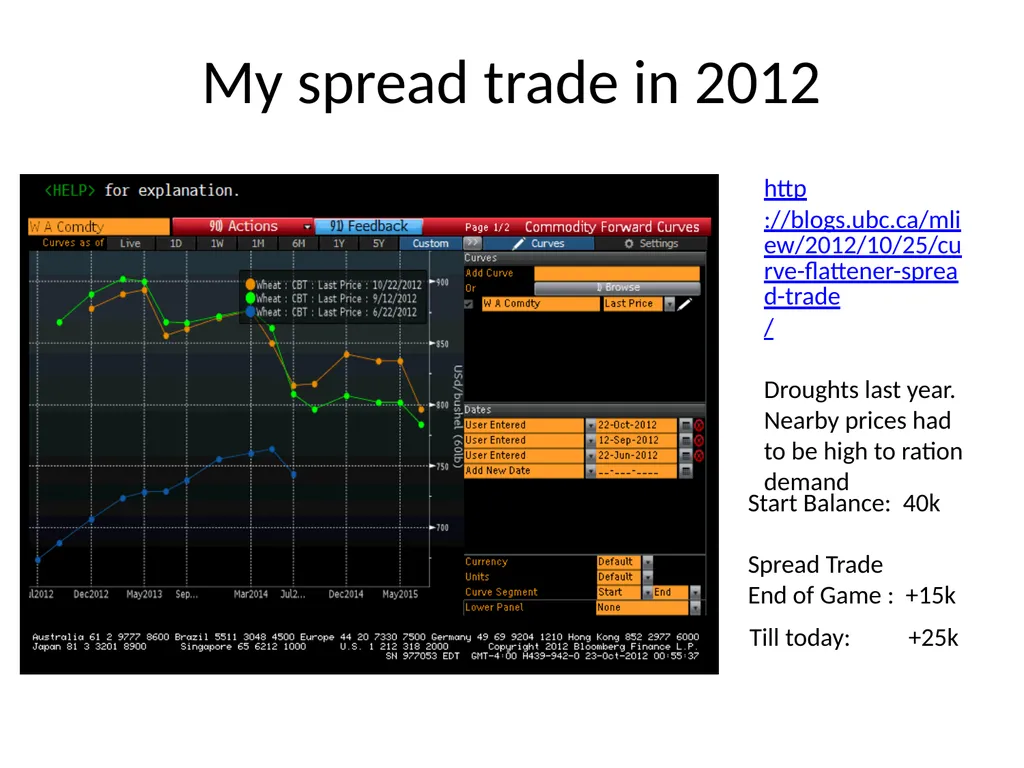
My spread trade in 2012 http://blogs.ubc.ca/mliew/2012/10/25/curve-flattener-spread-trade/
Droughts last year. Nearby prices had to be high to ration demand Start Balance: 40k
Spread Trade
End of Game : +15k Till today: +25k<br>
14
Basic Relationships<br>
15
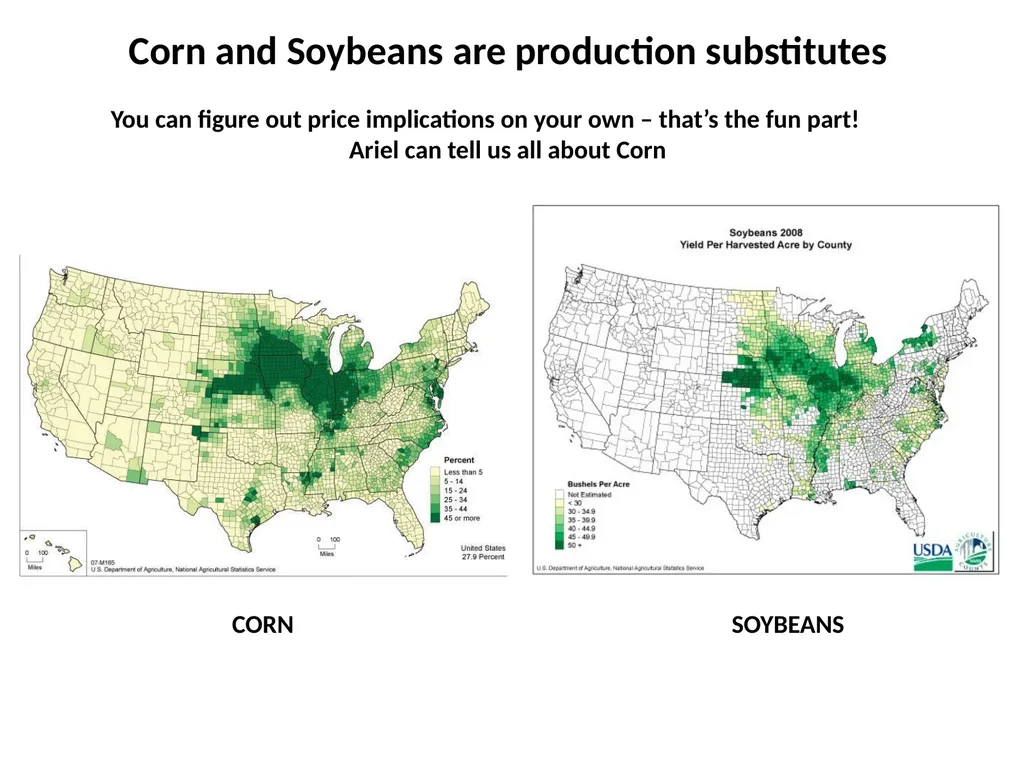
Corn and Soybeans are production substitutes CORN SOYBEANS You can figure out price implications on your own – that’s the fun part!
Ariel can tell us all about Corn<br>
16
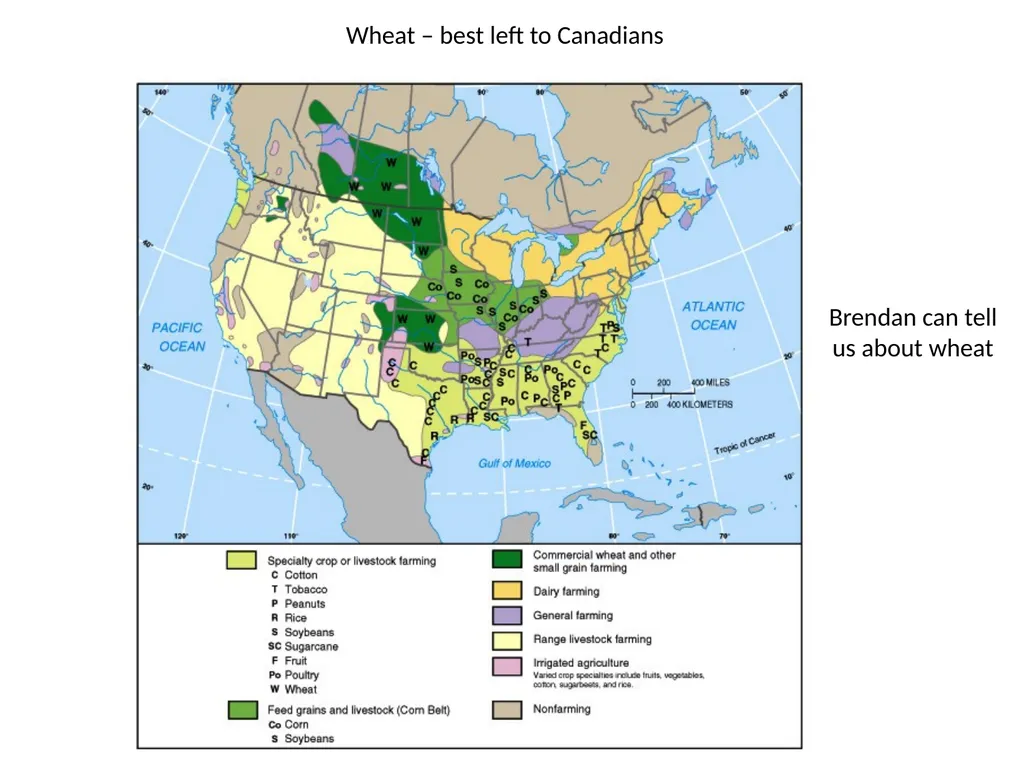
Wheat – best left to Canadians Brendan can tell us about wheat<br>
17
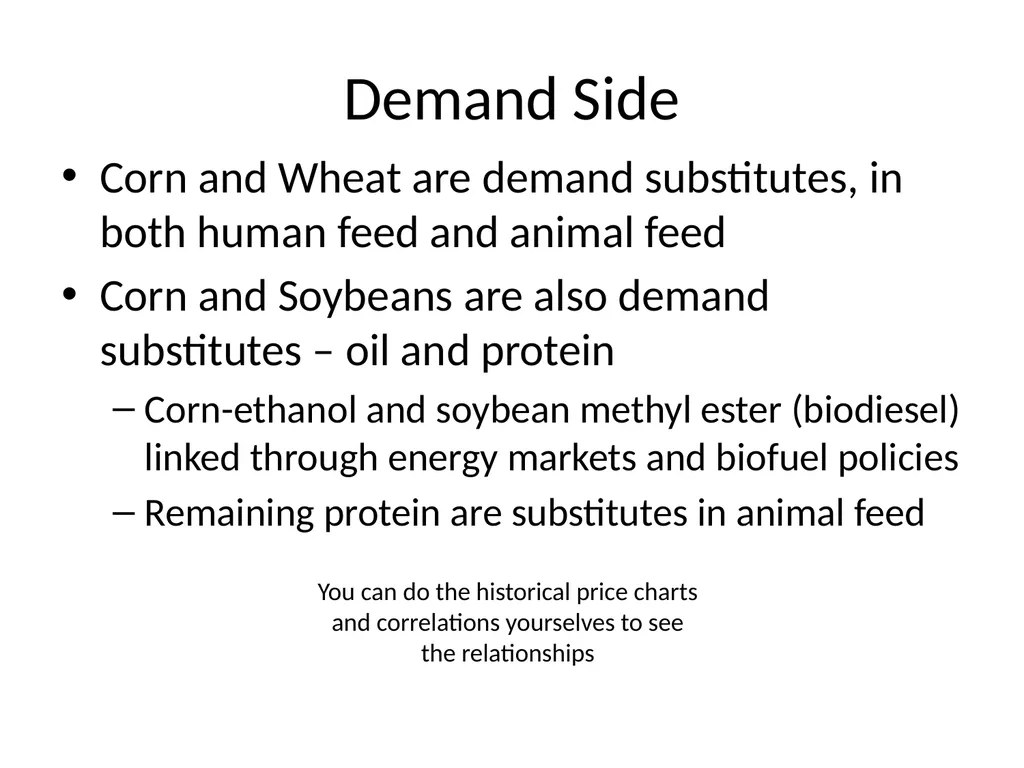
Demand Side Corn and Wheat are demand substitutes, in both human feed and animal feed
Corn and Soybeans are also demand substitutes – oil and protein
Corn-ethanol and soybean methyl ester (biodiesel) linked through energy markets and biofuel policies
Remaining protein are substitutes in animal feed You can do the historical price charts and correlations yourselves to see the relationships<br>
18
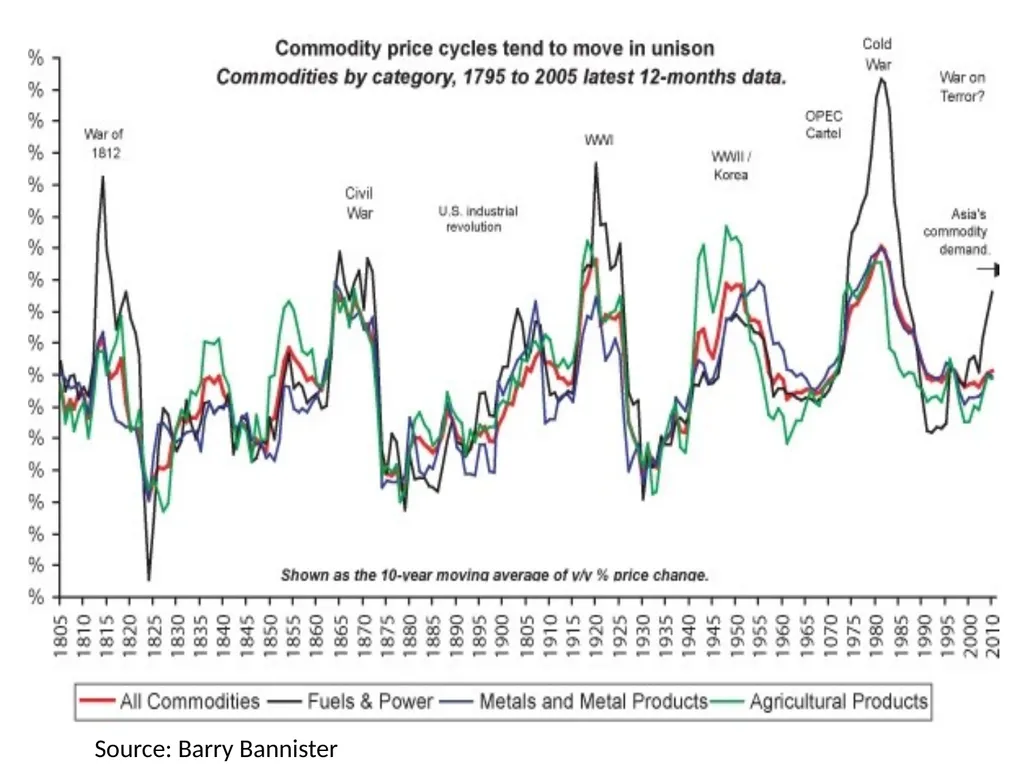
Source: Barry Bannister<br>
19
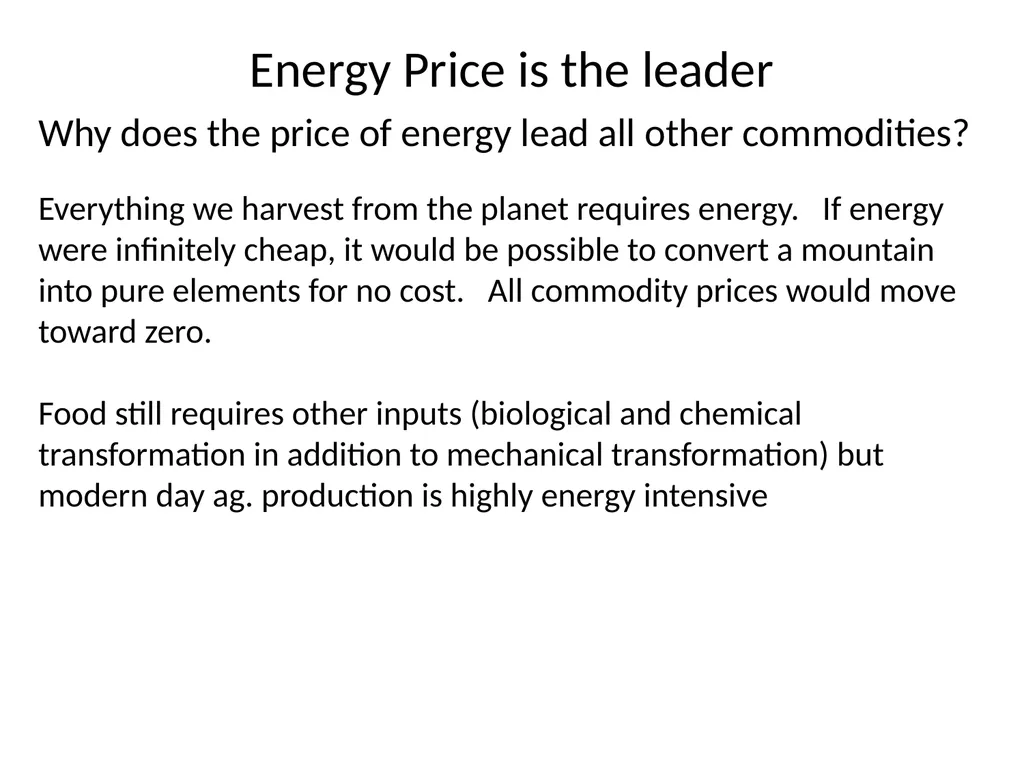
Energy Price is the leader Why does the price of energy lead all other commodities? Everything we harvest from the planet requires energy. If energy were infinitely cheap, it would be possible to convert a mountain into pure elements for no cost. All commodity prices would move toward zero.
Food still requires other inputs (biological and chemical transformation in addition to mechanical transformation) but modern day ag. production is highly energy intensive<br>
20
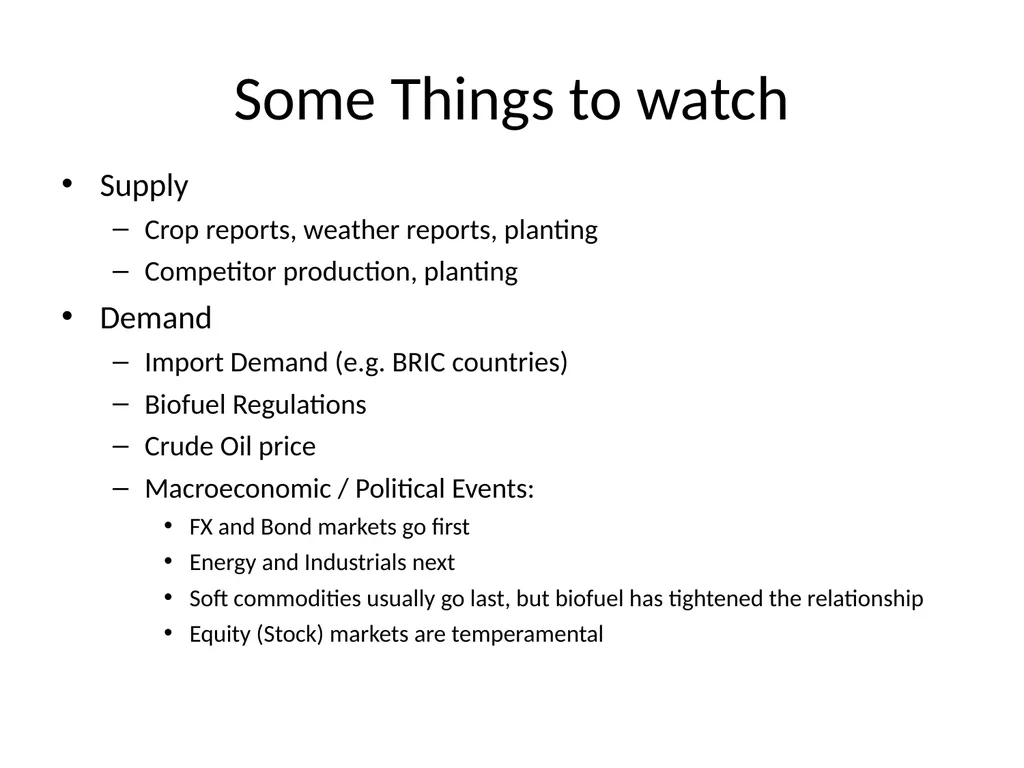
Some Things to watch Supply
Crop reports, weather reports, planting
Competitor production, planting
Demand
Import Demand (e.g. BRIC countries)
Biofuel Regulations
Crude Oil price
Macroeconomic / Political Events:
FX and Bond markets go first
Energy and Industrials next
Soft commodities usually go last, but biofuel has tightened the relationship
Equity (Stock) markets are temperamental<br>
21
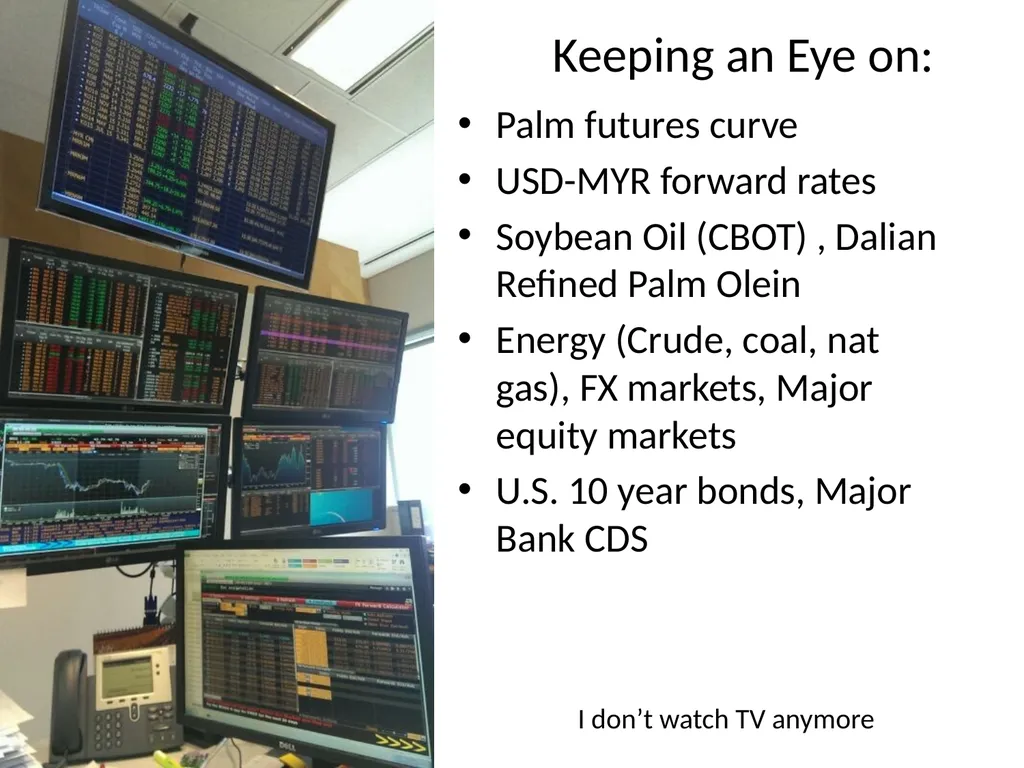
I don’t watch TV anymore Palm futures curve
USD-MYR forward rates
Soybean Oil (CBOT) , Dalian Refined Palm Olein
Energy (Crude, coal, nat gas), FX markets, Major equity markets
U.S. 10 year bonds, Major Bank CDS Keeping an Eye on:<br>
22
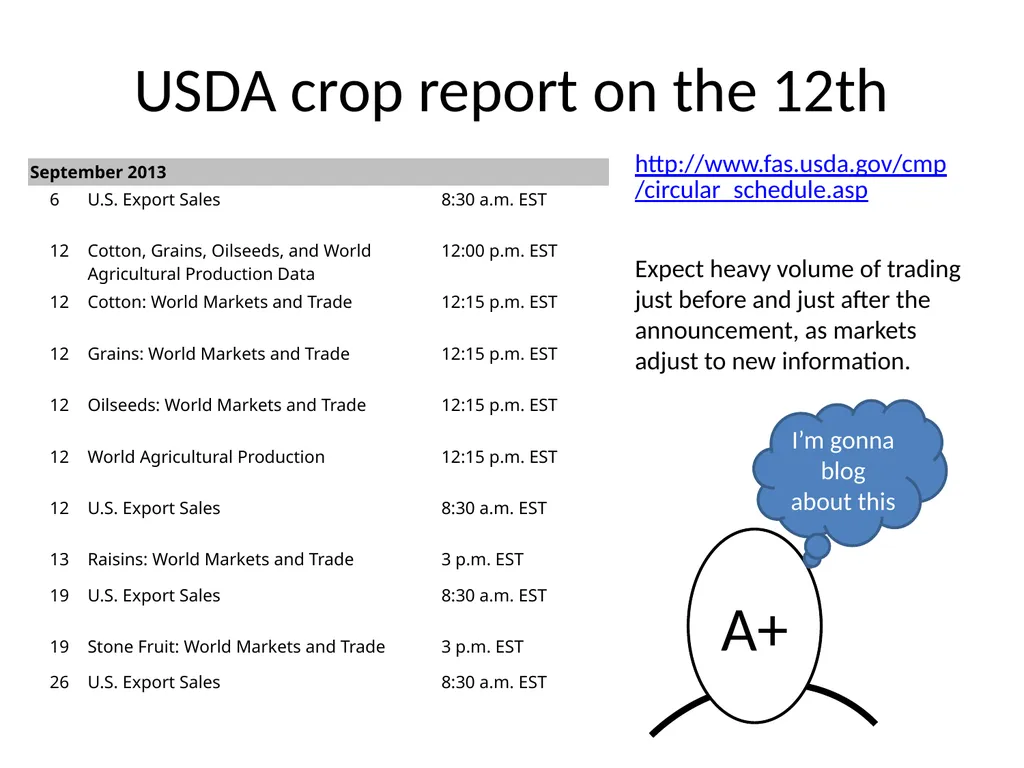
USDA crop report on the 12th Expect heavy volume of trading just before and just after the announcement, as markets adjust to new information. http://www.fas.usda.gov/cmp/circular_schedule.asp<br>
23
Economic Calendars Yahoo Economic Calendar:
http://biz.yahoo.com/c/ec/201338.html
Bloomberg Economic Calendar:
http://www.bloomberg.com/markets/economic-calendar/
CME Economic Calendar:
http://www.cmegroup.com/education/econ_calendar.html So many interesting things happening in the world<br>