04
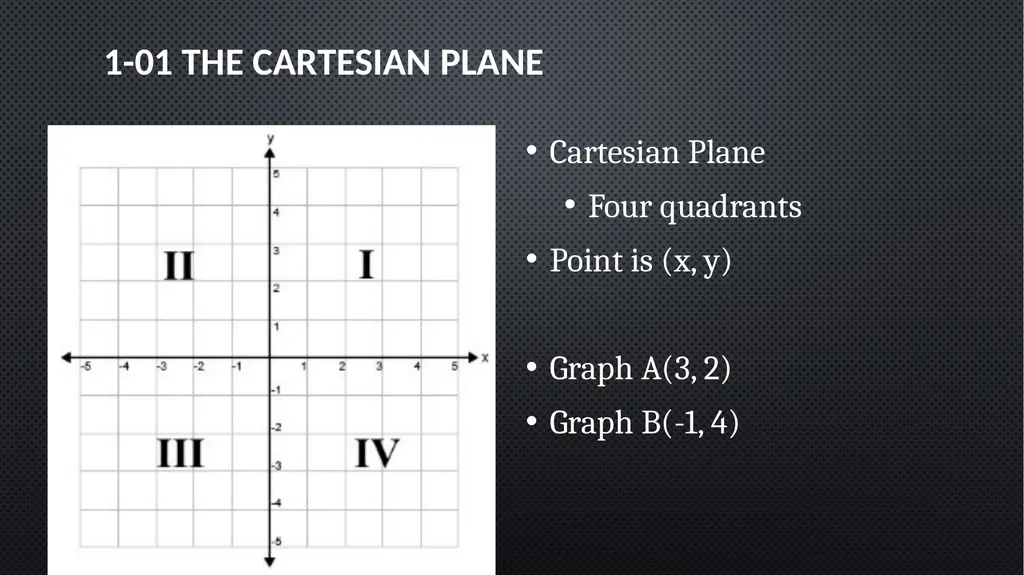
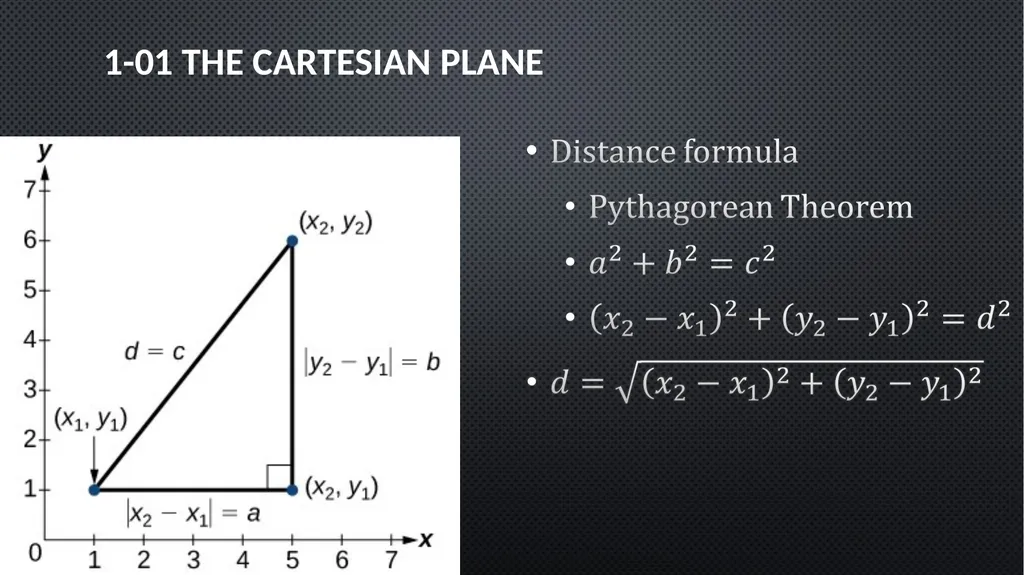
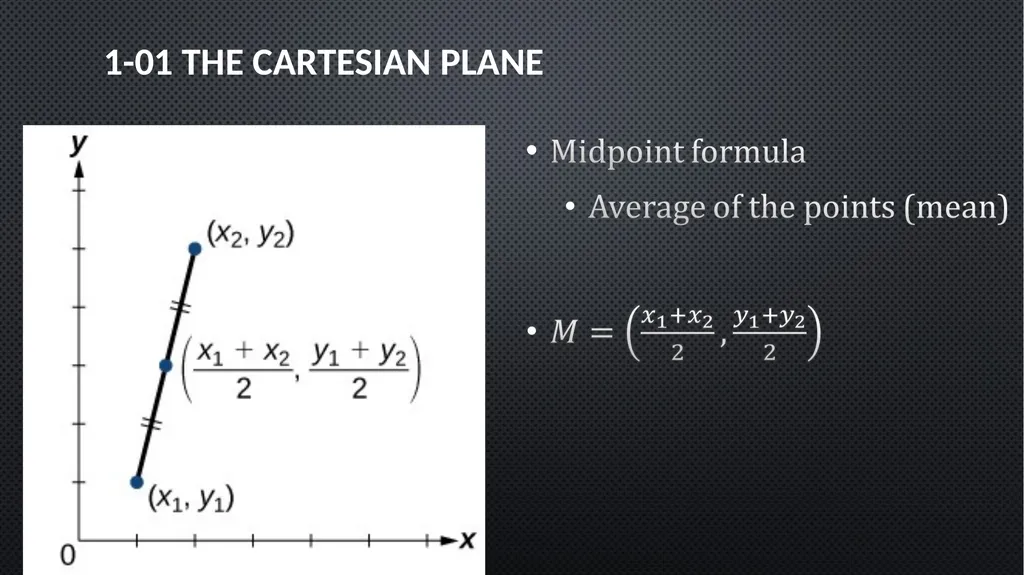
1-01 The Cartesian Plane Cartesian Plane
Four quadrants
Point is (x, y)
Graph A(3, 2)
Graph B(-1, 4)<br>
05
1-01 The Cartesian Plane<br>
06
1-01 The Cartesian Plane<br>
07
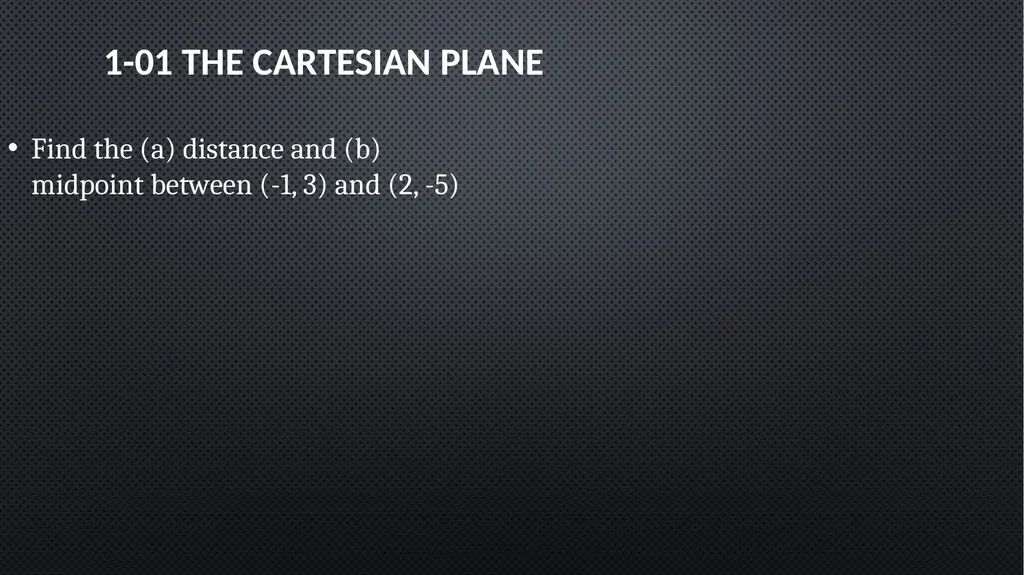
1-01 The Cartesian Plane Find the (a) distance and (b) midpoint between (-1, 3) and (2, -5)<br>
08
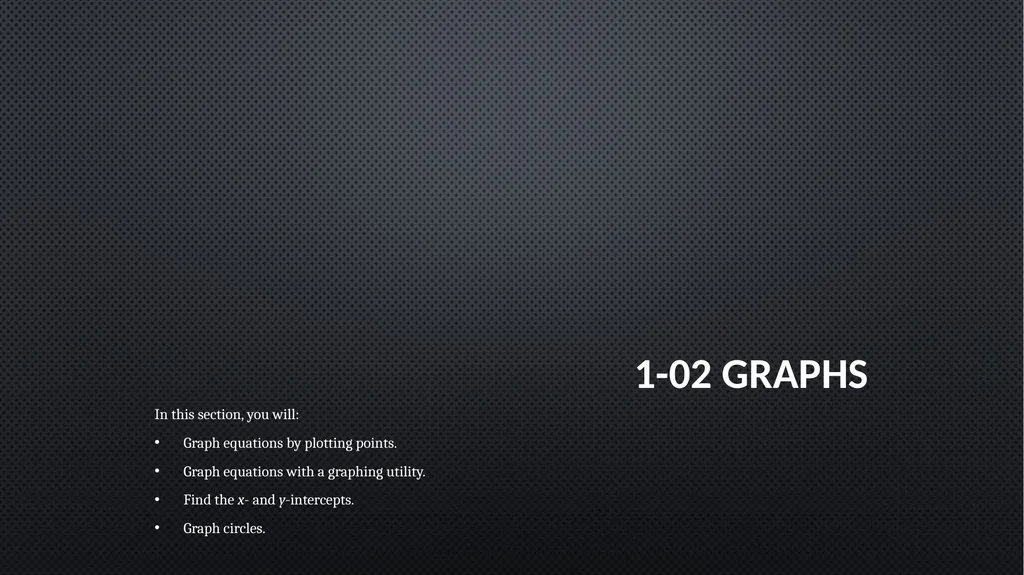
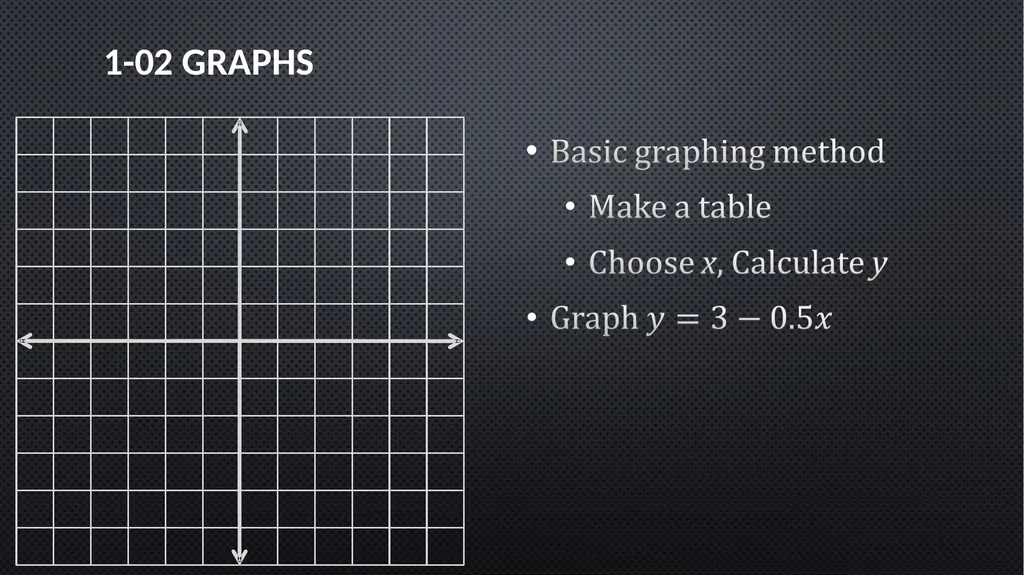
1-02 Graphs In this section, you will:
Graph equations by plotting points.
Graph equations with a graphing utility.
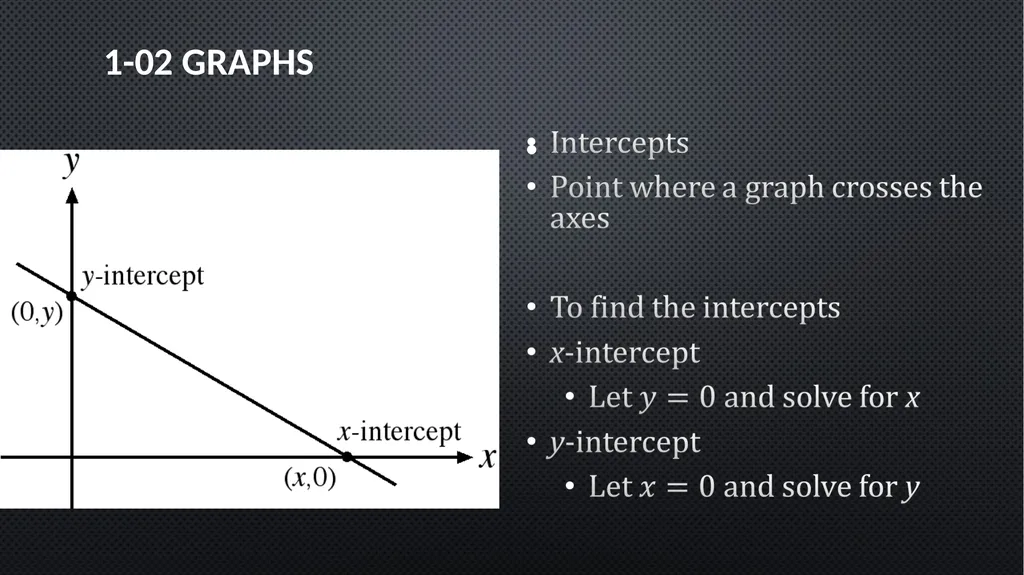
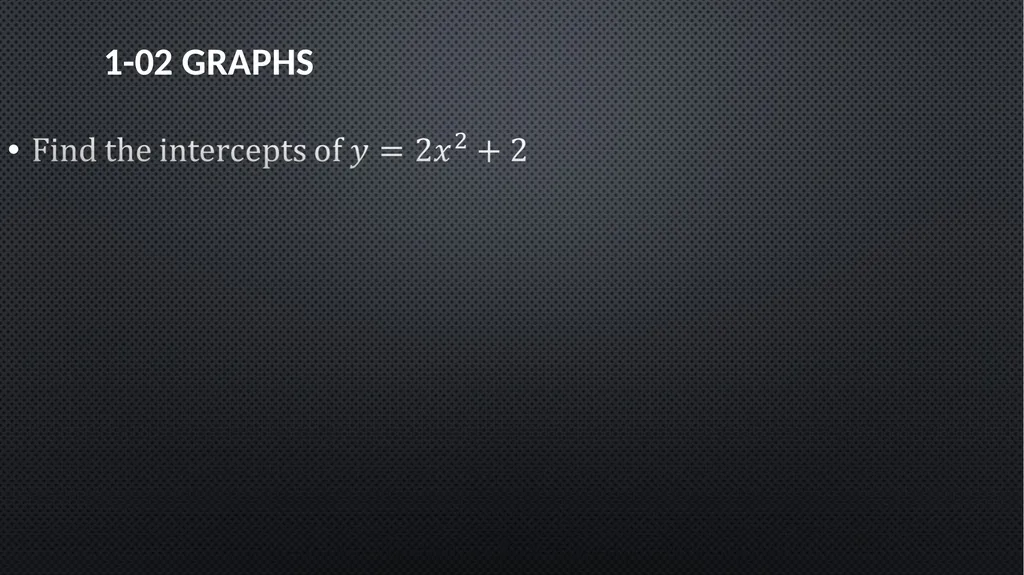
Find the x- and y-intercepts.
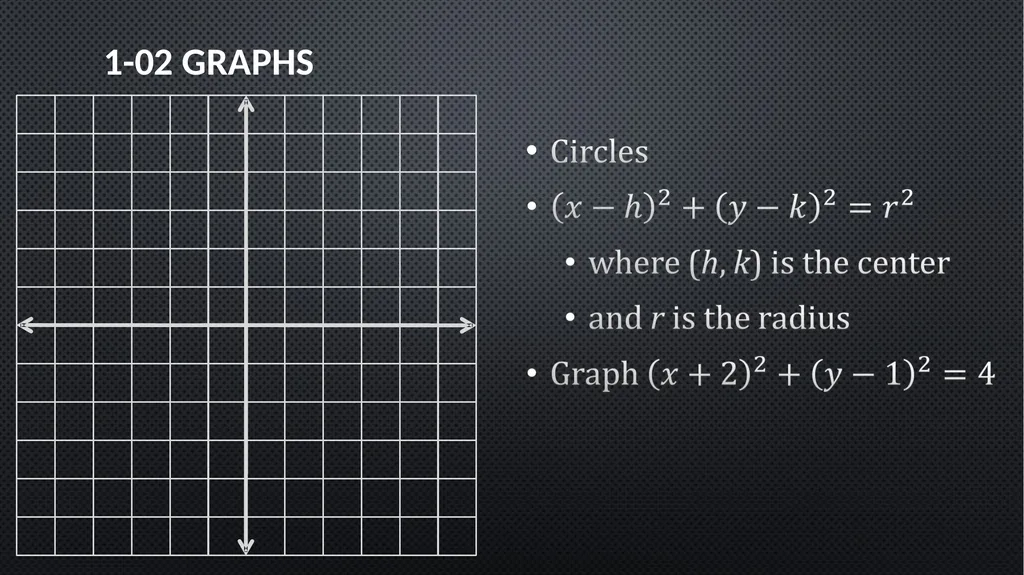
Graph circles.<br>
13
1-03 Linear Equations in Two Variables In this section, you will:
Calculate and interpret slope.
Write linear equations.
Graph linear functions.<br>
14
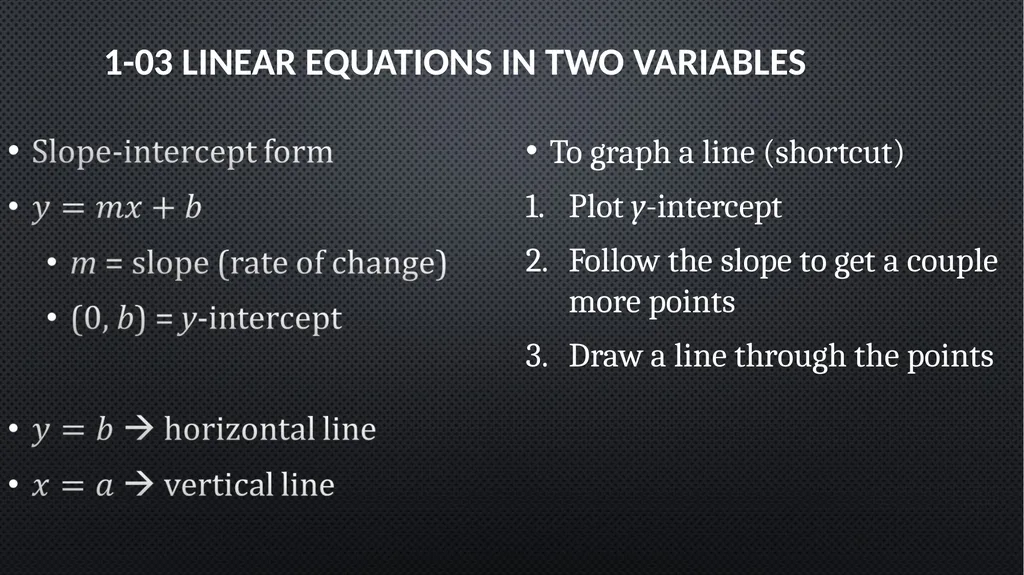
1-03 Linear Equations in Two Variables To graph a line (shortcut)
Plot y-intercept
Follow the slope to get a couple more points
Draw a line through the points<br>
15
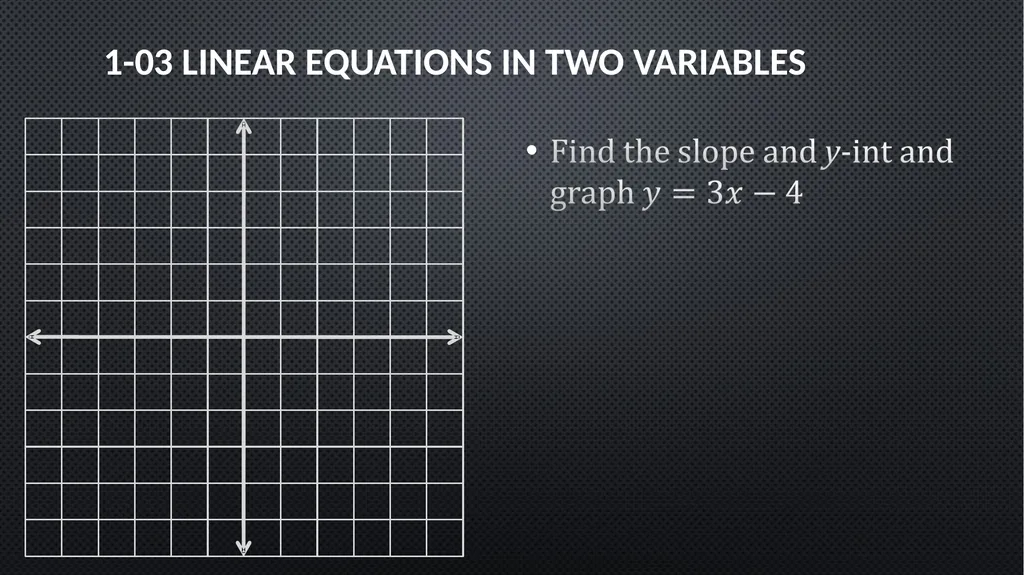
1-03 Linear Equations in Two Variables<br>
16
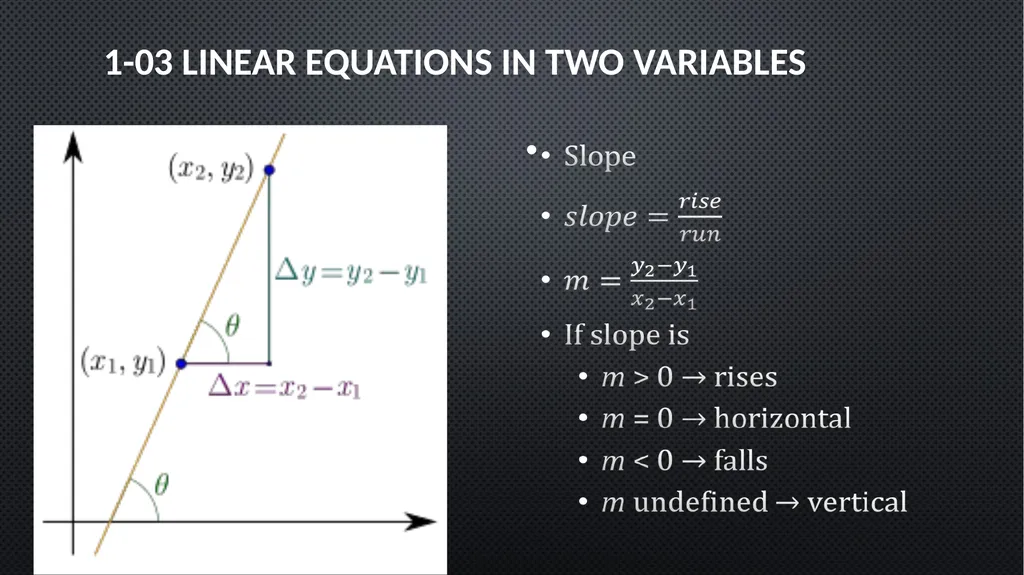
1-03 Linear Equations in Two Variables<br>
17
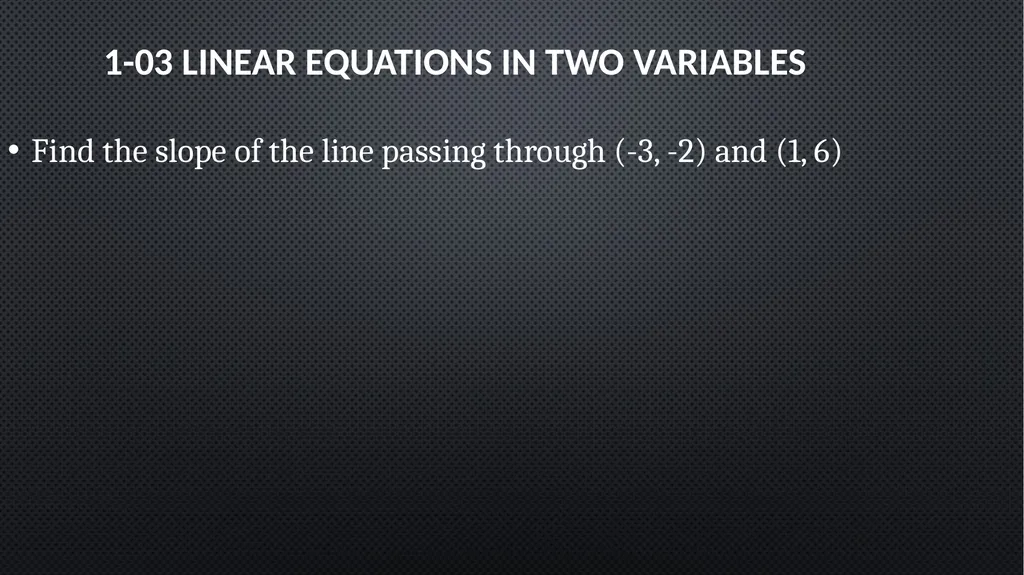
1-03 Linear Equations in Two Variables Find the slope of the line passing through (-3, -2) and (1, 6)<br>
18
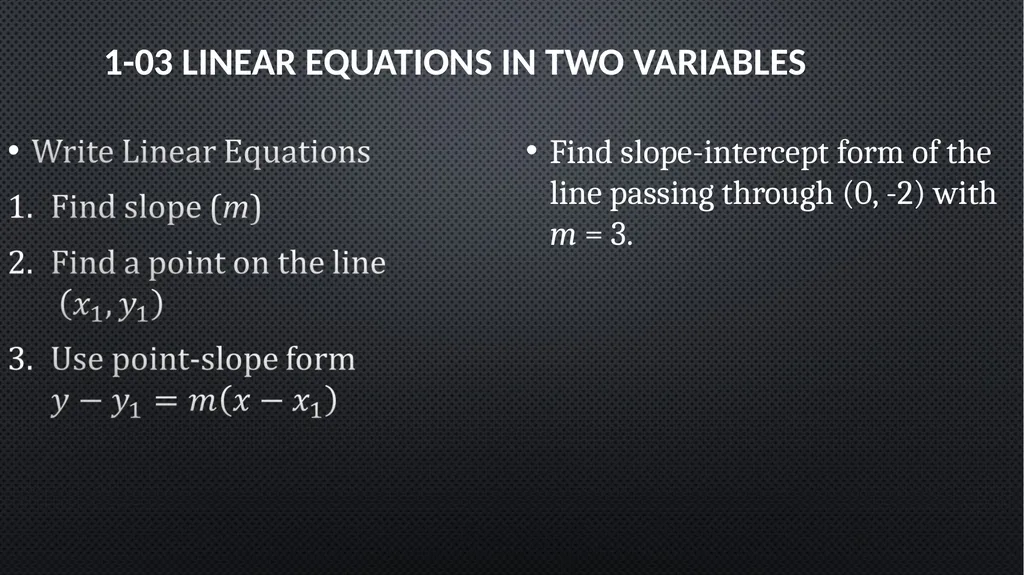
1-03 Linear Equations in Two Variables Find slope-intercept form of the line passing through (0, -2) with m = 3.<br>
19
1-03 Linear Equations in Two Variables<br>
20
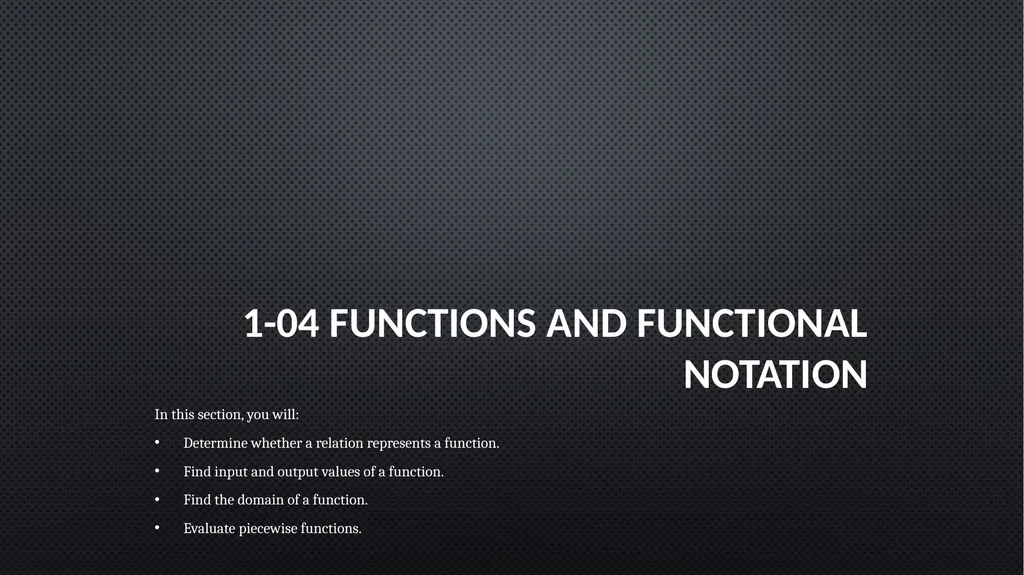
1-04 Functions and Functional Notation In this section, you will:
Determine whether a relation represents a function.
Find input and output values of a function.
Find the domain of a function.
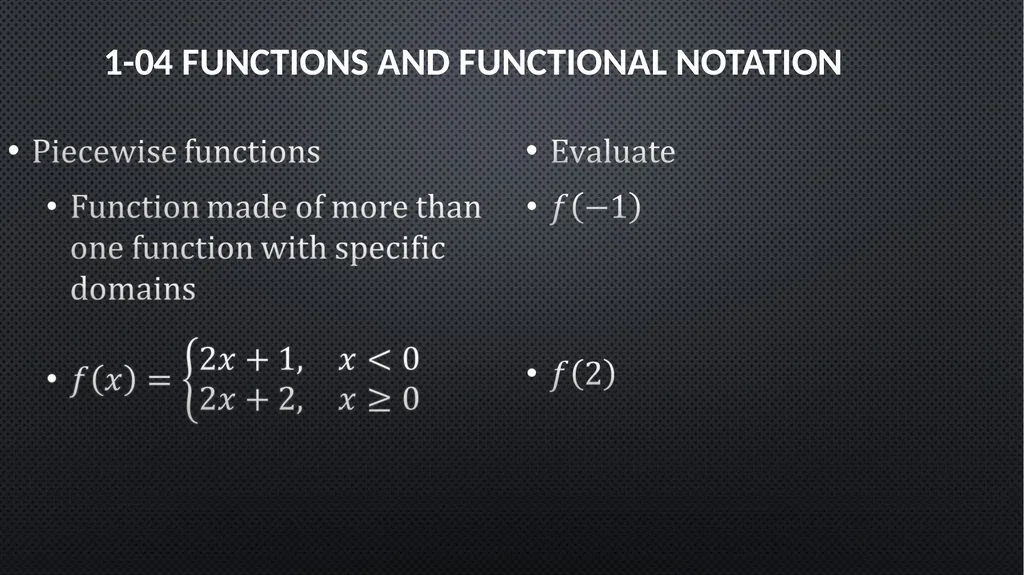
Evaluate piecewise functions.<br>
21
1-04 Functions and Functional Notation Relation
Rule that relates 2 quantities
Function
Special relation
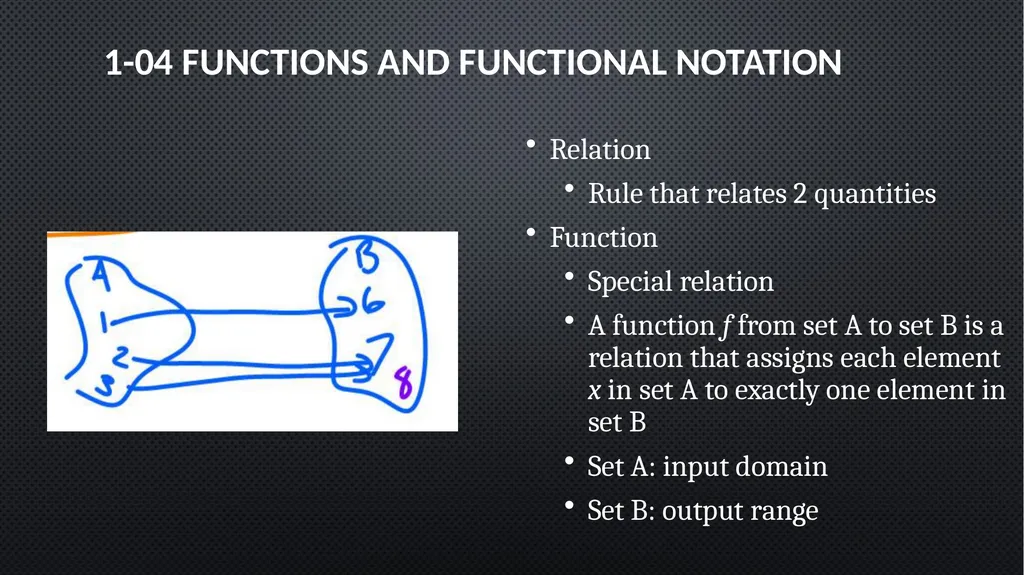
A function f from set A to set B is a relation that assigns each element x in set A to exactly one element in set B
Set A: input domain
Set B: output range<br>
22
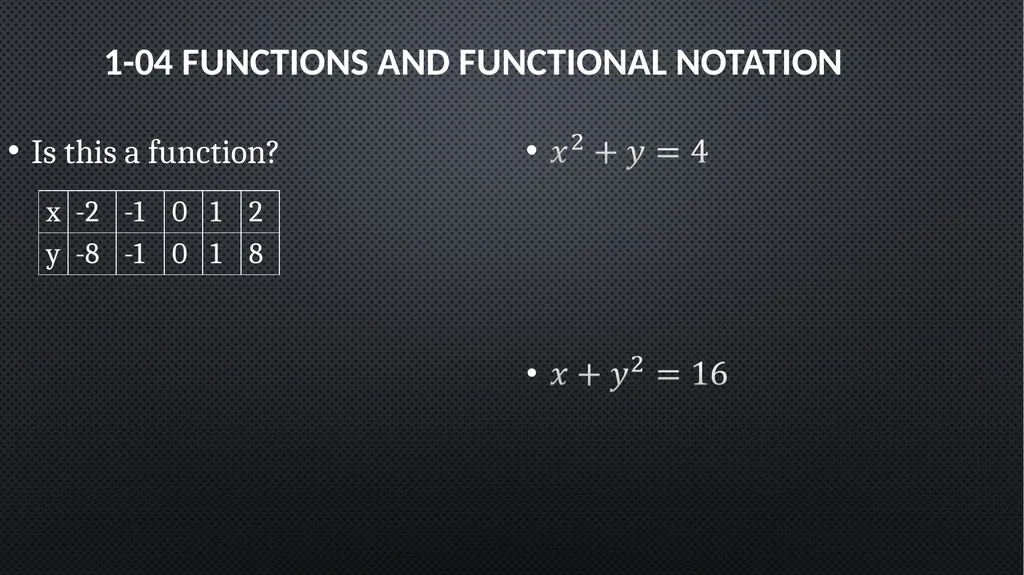
1-04 Functions and Functional Notation Is this a function?<br>
23
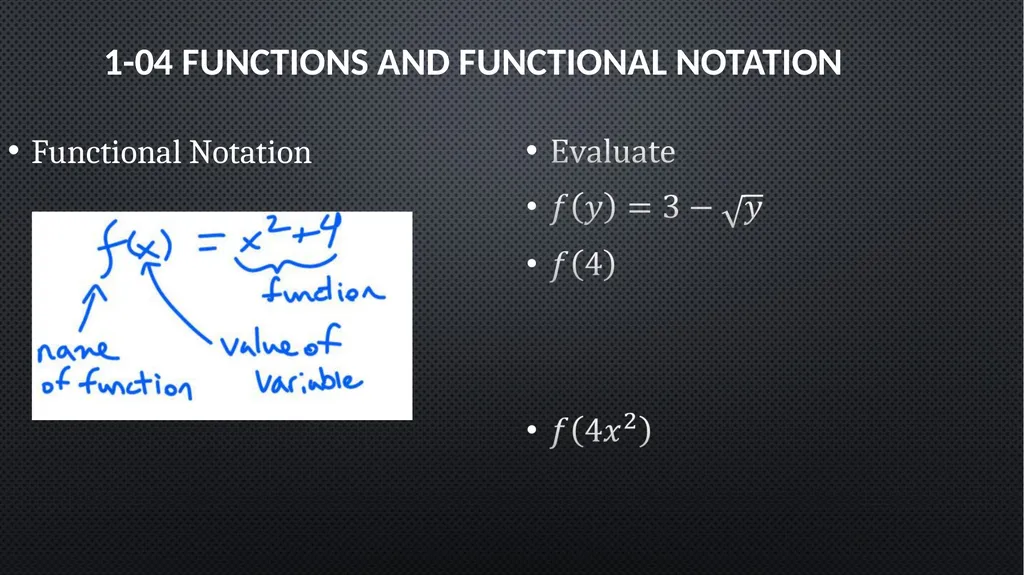
1-04 Functions and Functional Notation Functional Notation<br>
24
1-04 Functions and Functional Notation<br>
25
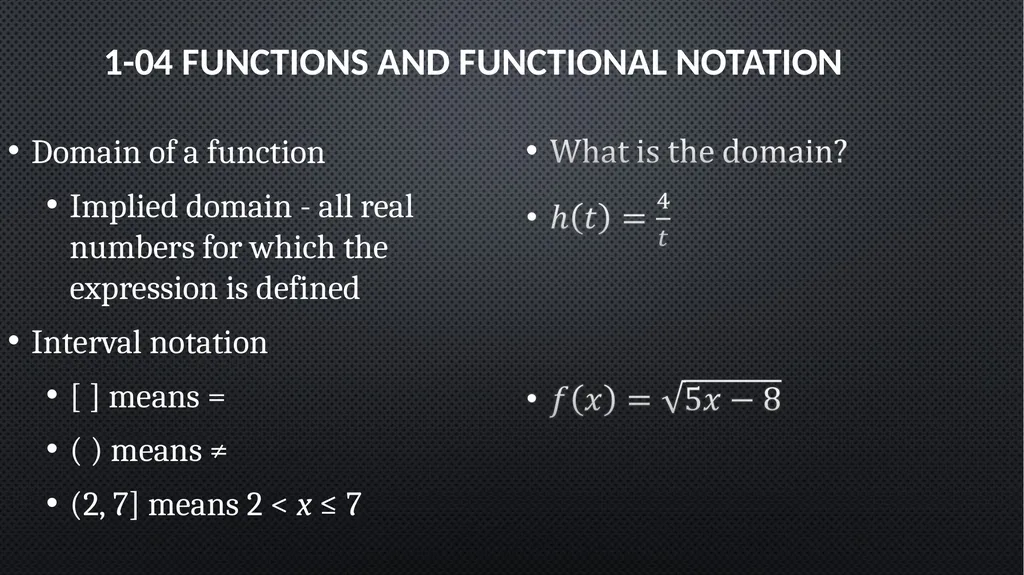
1-04 Functions and Functional Notation Domain of a function
Implied domain - all real numbers for which the expression is defined
Interval notation
[ ] means =
( ) means ≠
(2, 7] means 2 < x ≤ 7<br>
26
1-04 Functions and Functional Notation<br>
27
1-05 Graphs of Functions In this section, you will:
Find domain and range from graphs.
Determine whether graphs represent functions.
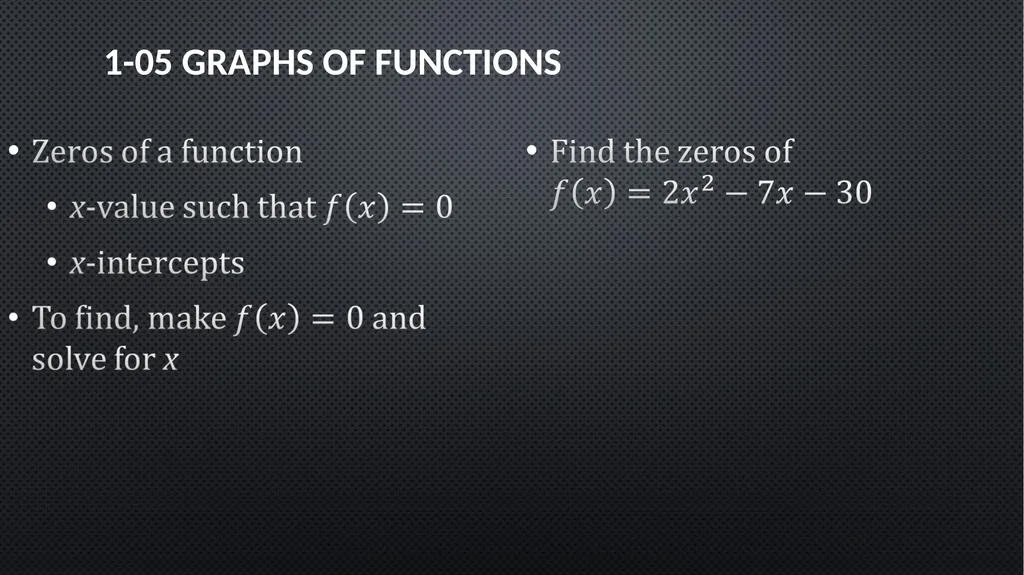
Find zeros of functions.
Find the average rate of change of a function.
Analyze graphs to determine when the graph is increasing, decreasing, or constant.<br>
28
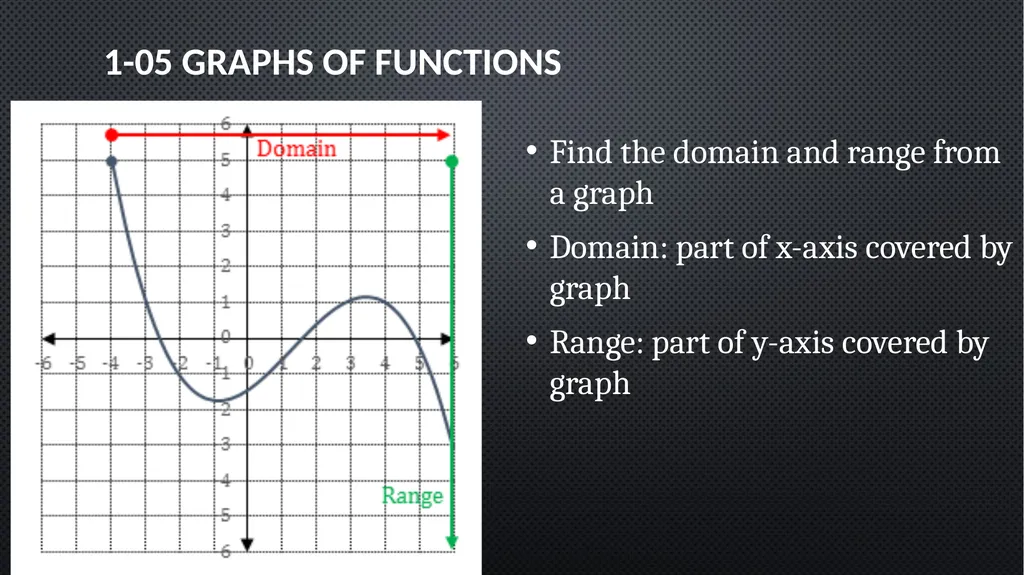
1-05 Graphs of Functions Find the domain and range from a graph
Domain: part of x-axis covered by graph
Range: part of y-axis covered by graph<br>
29
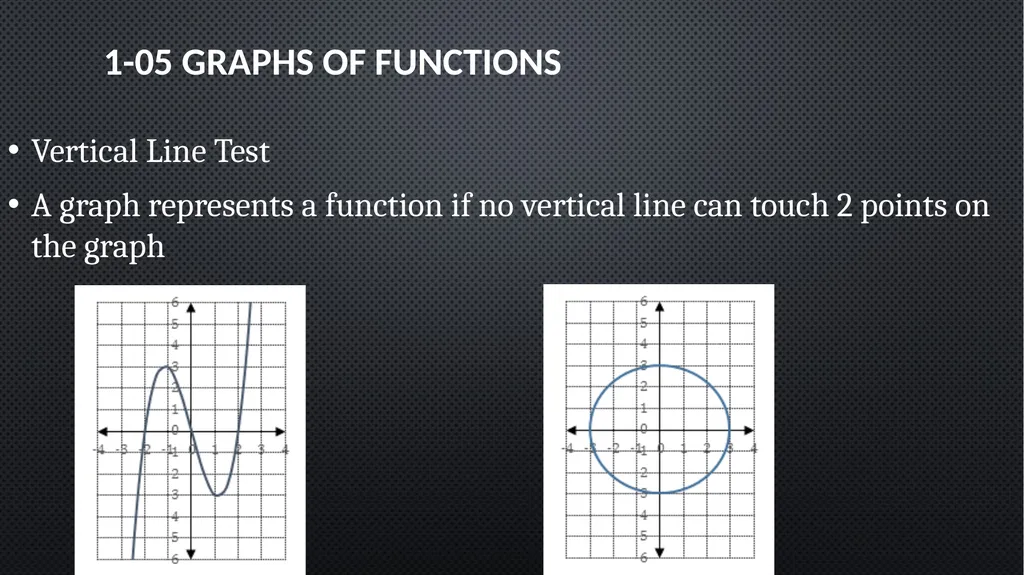
1-05 Graphs of Functions Vertical Line Test
A graph represents a function if no vertical line can touch 2 points on the graph<br>
30
1-05 Graphs of Functions<br>
31
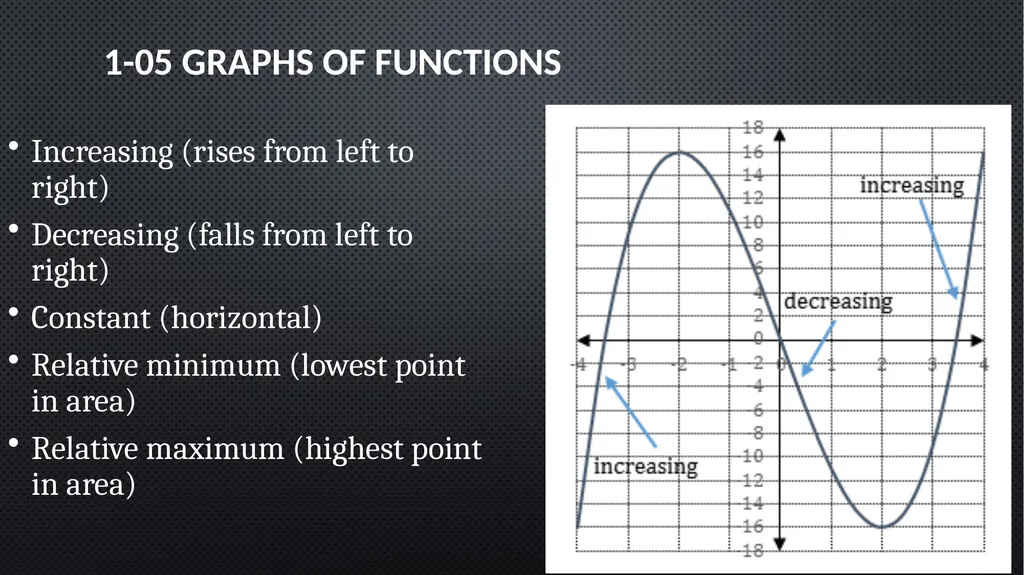
1-05 Graphs of Functions Increasing (rises from left to right)
Decreasing (falls from left to right)
Constant (horizontal)
Relative minimum (lowest point in area)
Relative maximum (highest point in area)<br>
32
1-05 Graphs of Functions Rate of Change
Average rate of change = slope between 2 points<br>
33
1-06 Graphs of Parent Functions In this section, you will:
Identify the graphs of parent functions.
Graph piecewise functions.<br>
34
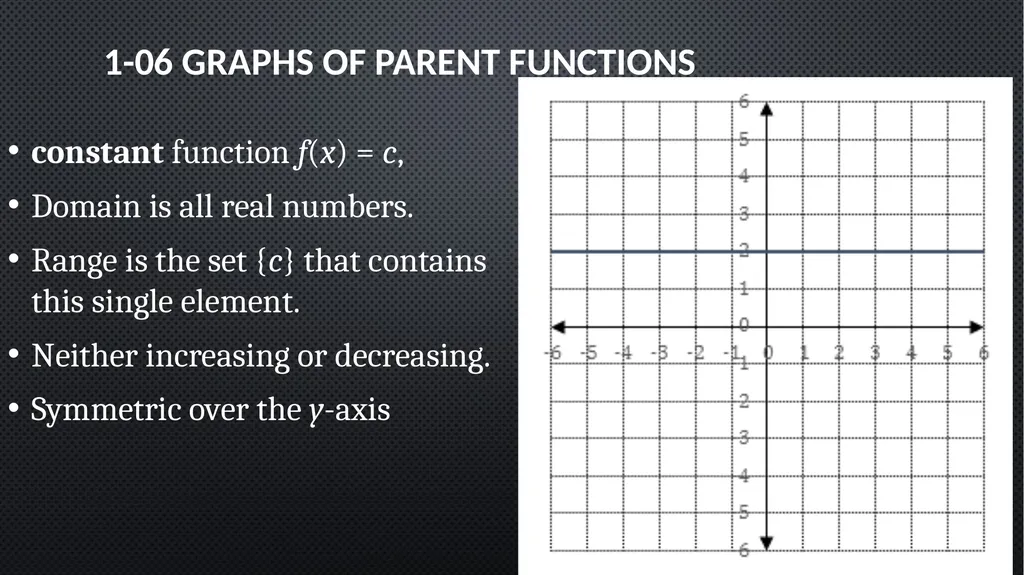
1-06 Graphs of Parent Functions constant function f(x) = c,
Domain is all real numbers.
Range is the set {c} that contains this single element.
Neither increasing or decreasing.
Symmetric over the y-axis<br>
35
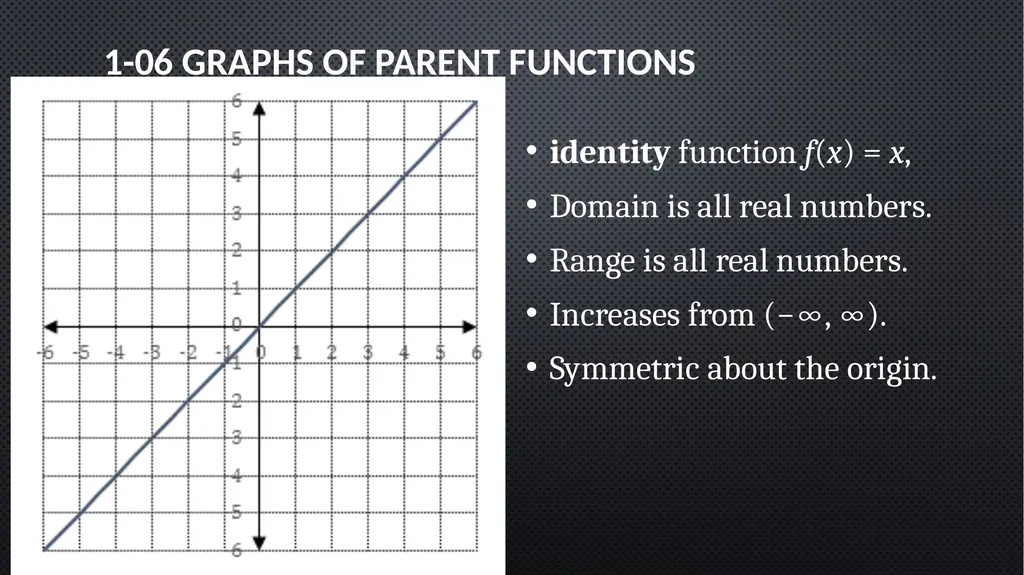
1-06 Graphs of Parent Functions identity function f(x) = x,
Domain is all real numbers.
Range is all real numbers.
Increases from (−∞, ∞).
Symmetric about the origin.<br>
36
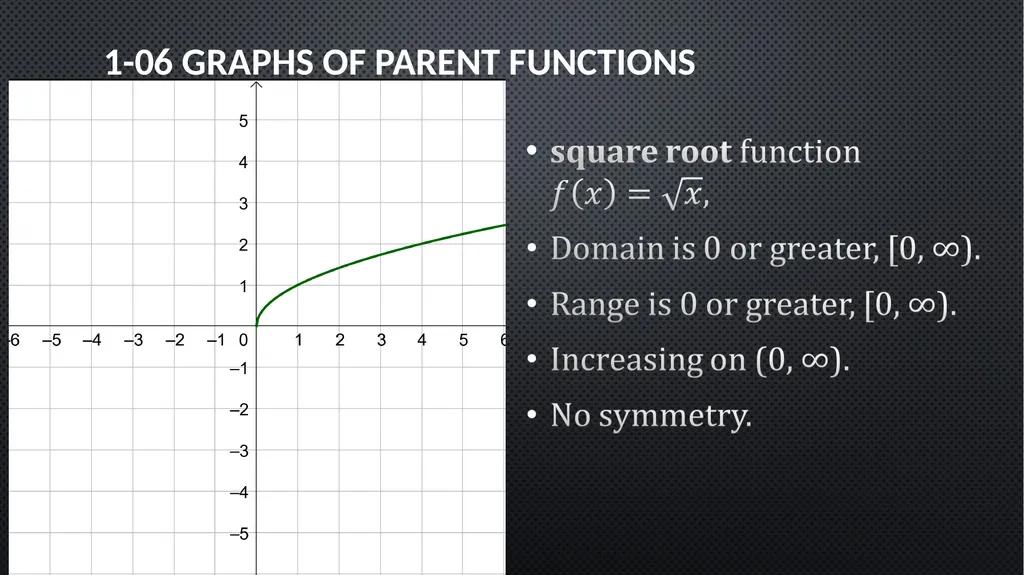
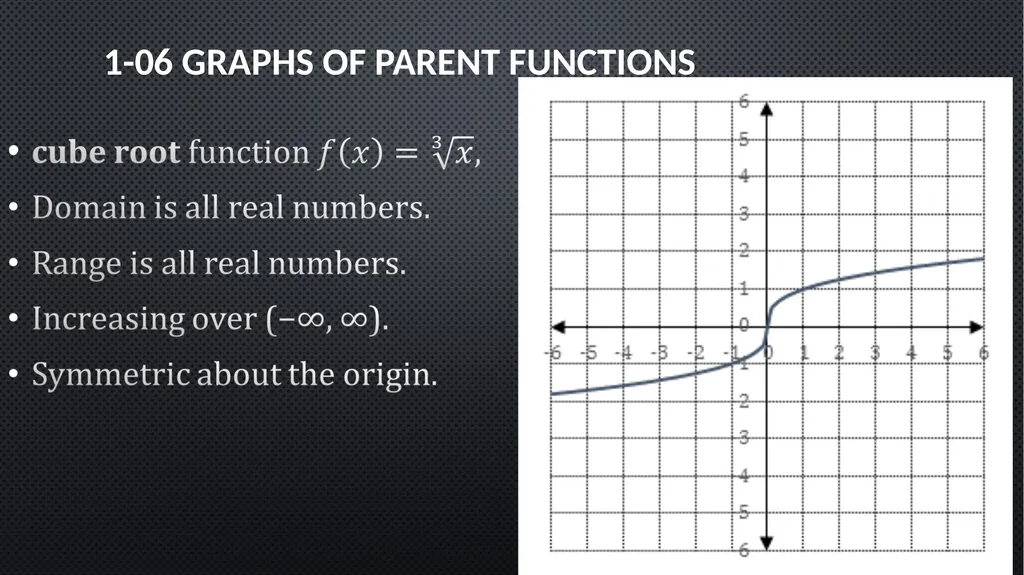
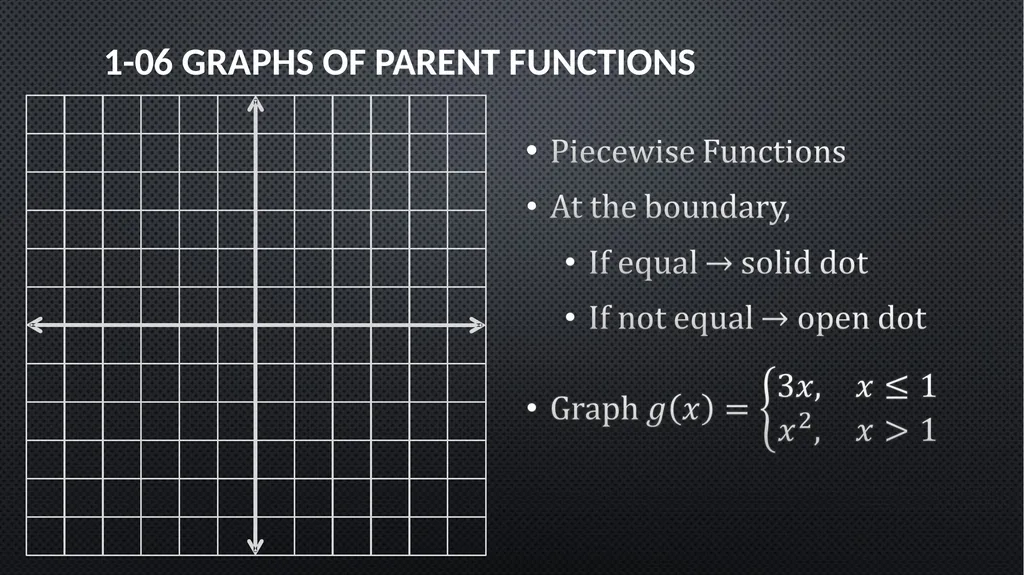
1-06 Graphs of Parent Functions<br>
37
1-06 Graphs of Parent Functions<br>
38
1-06 Graphs of Parent Functions<br>
39
1-06 Graphs of Parent Functions<br>
40
1-06 Graphs of Parent Functions<br>
41
1-06 Graphs of Parent Functions<br>
42
1-06 Graphs of Parent Functions<br>
43
1-06 Graphs of Parent Functions<br>
44
1-07 Transformations of Functions In this section, you will:
Graph functions with translations.
Graph functions with reflections.
Graph functions with stretches and shrinks.
Perform a sequences of transformations.<br>
45
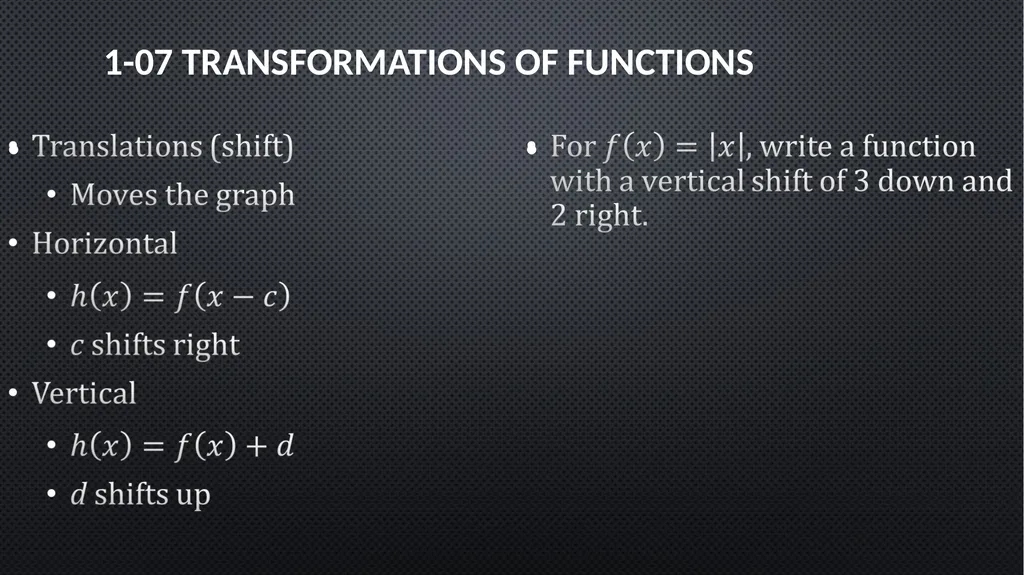
1-07 Transformations of Functions<br>
46
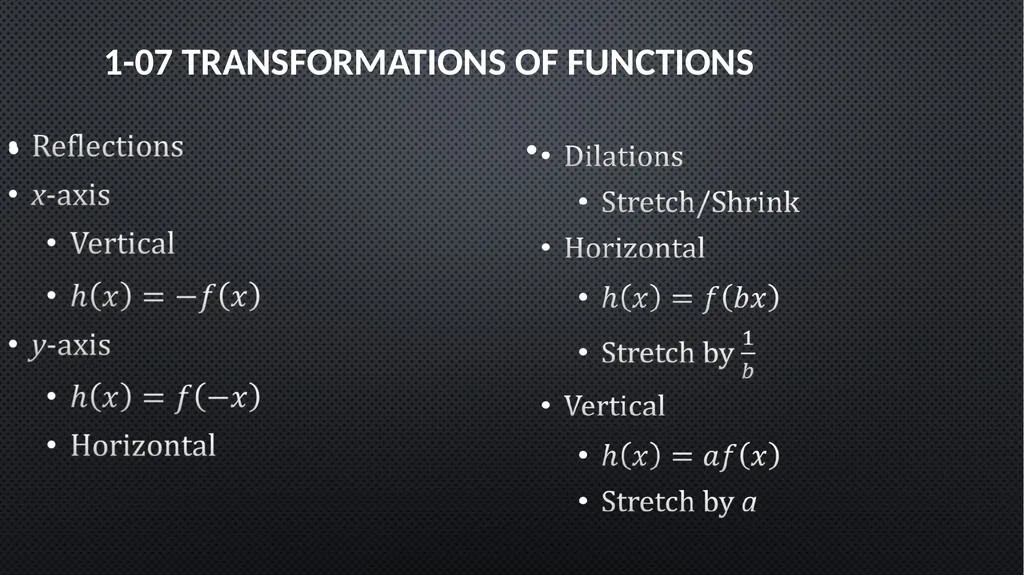
1-07 Transformations of Functions<br>
47
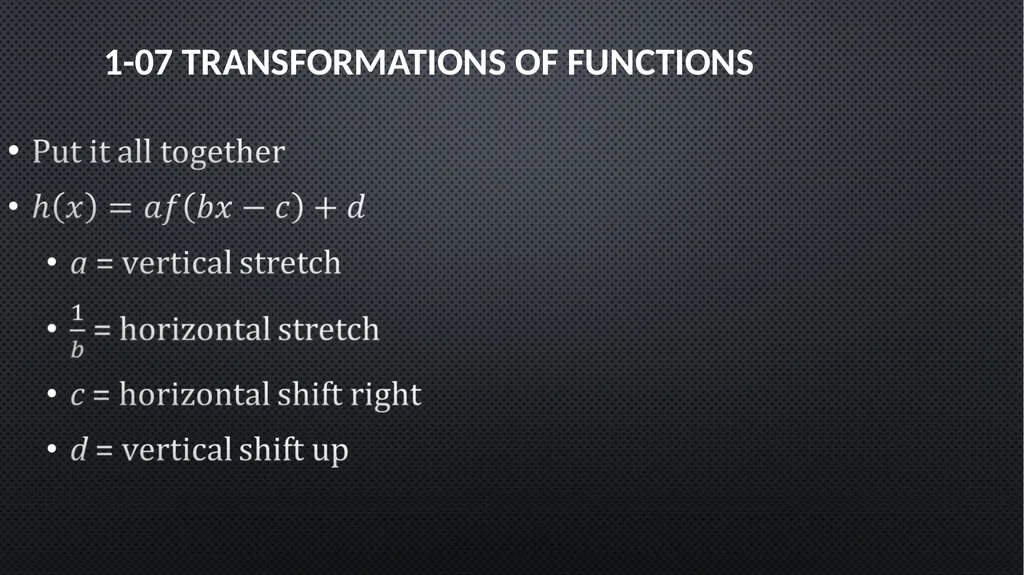
1-07 Transformations of Functions<br>
48
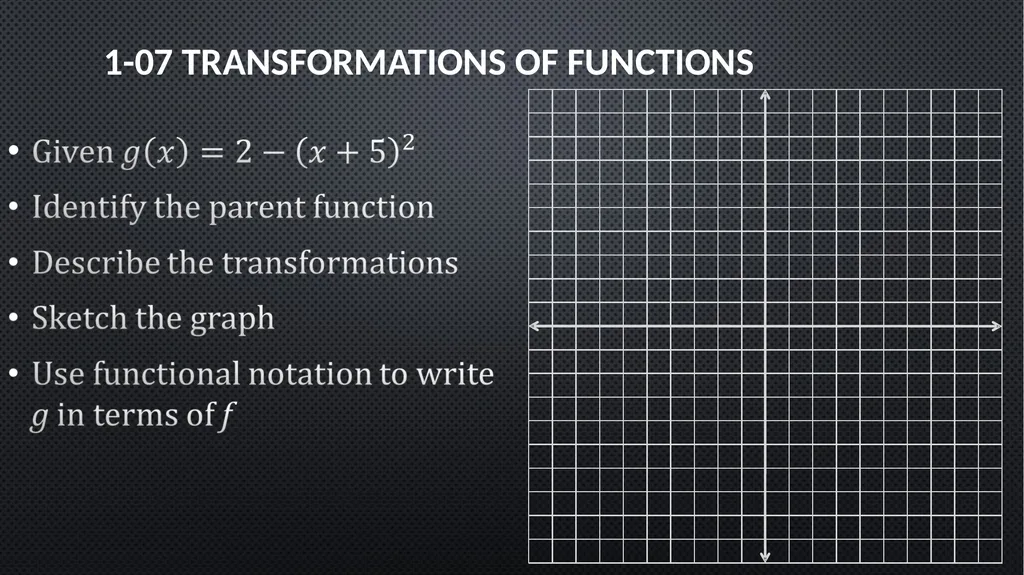
1-07 Transformations of Functions<br>
49
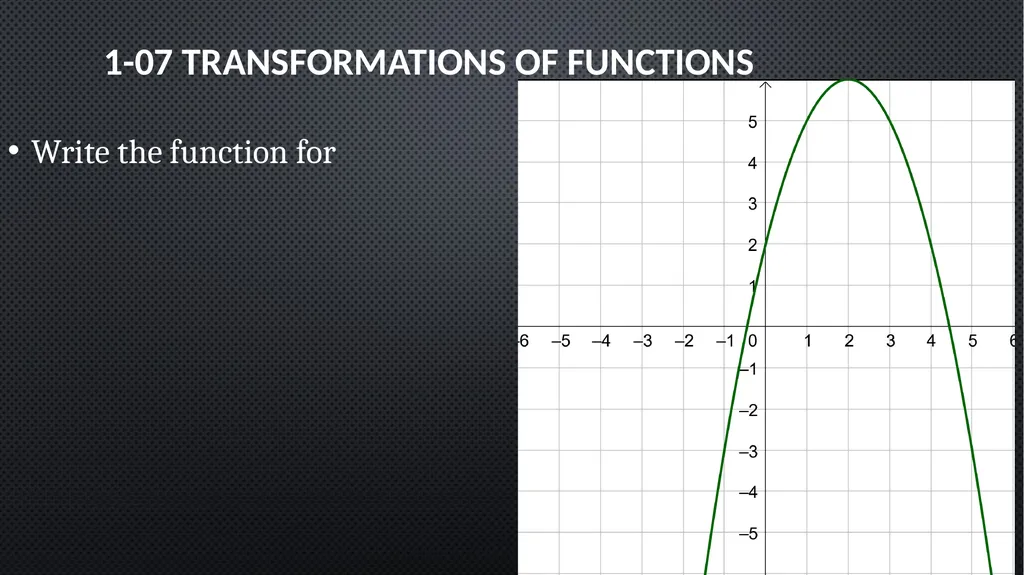
1-07 Transformations of Functions Write the function for<br>
50
1-08 Combinations of Functions In this section, you will:
Combine functions using algebraic operations.
Create a composition of functions.<br>
51
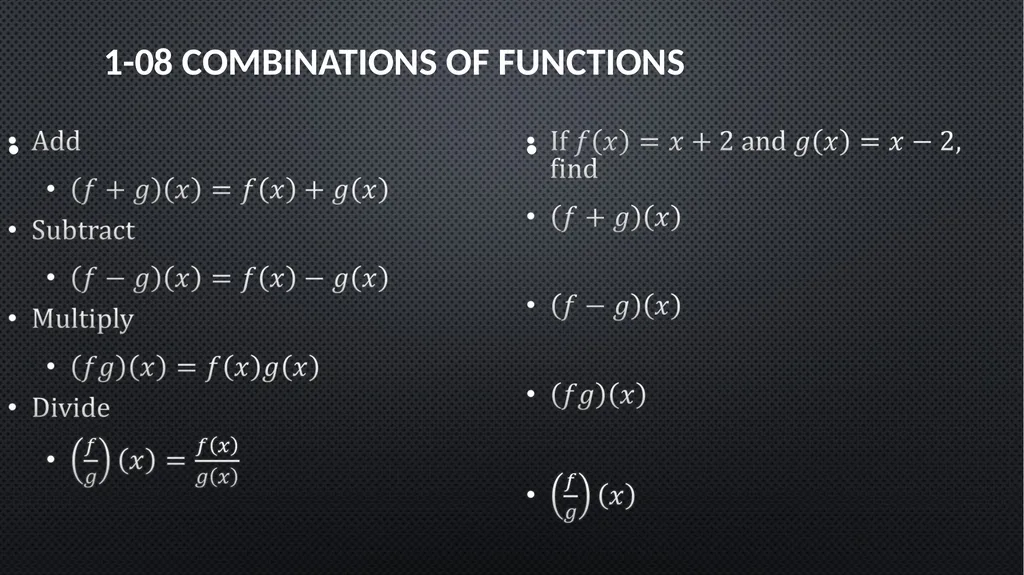
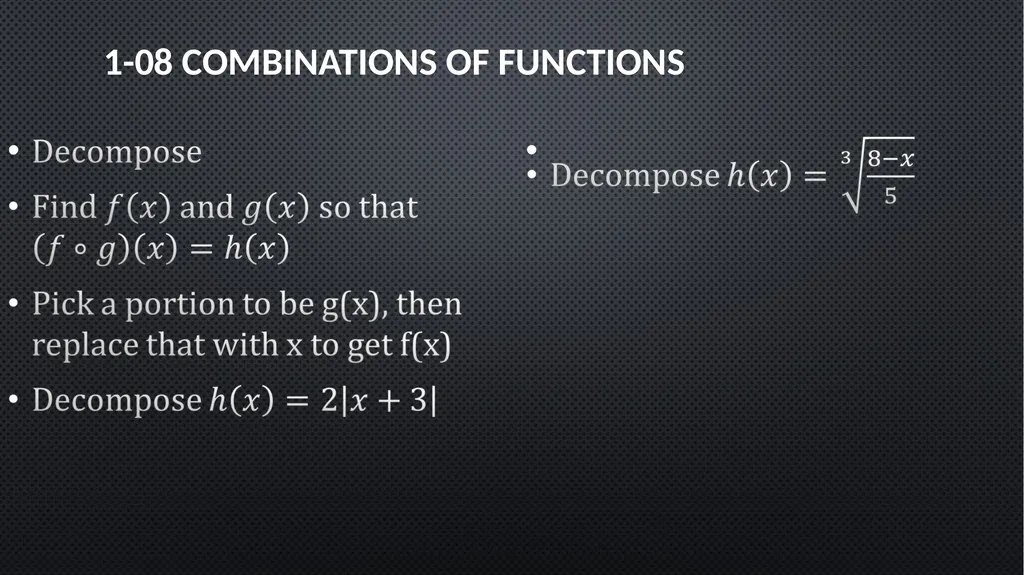
1-08 Combinations of Functions<br>
52
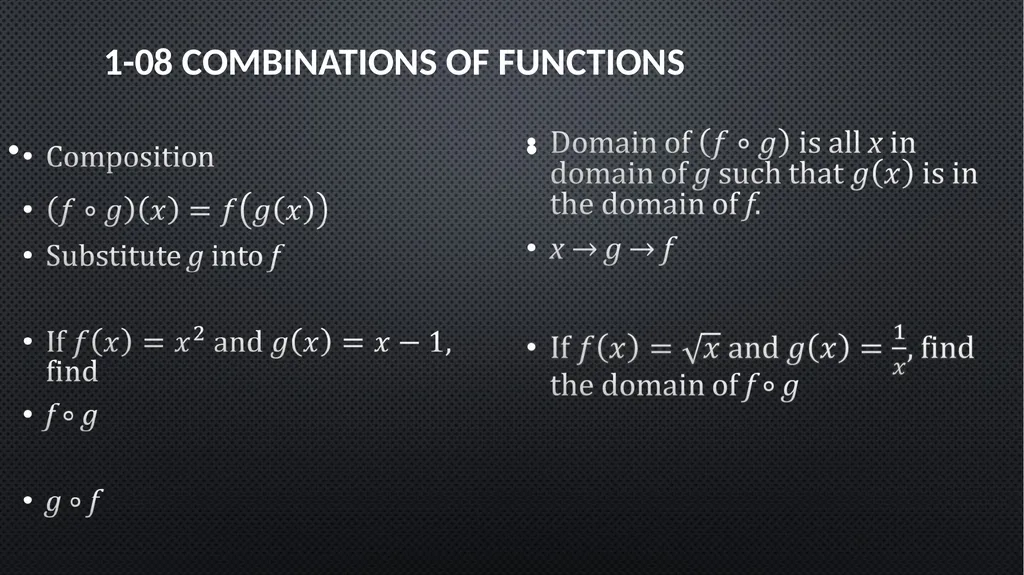
1-08 Combinations of Functions<br>
53
1-08 Combinations of Functions<br>
54
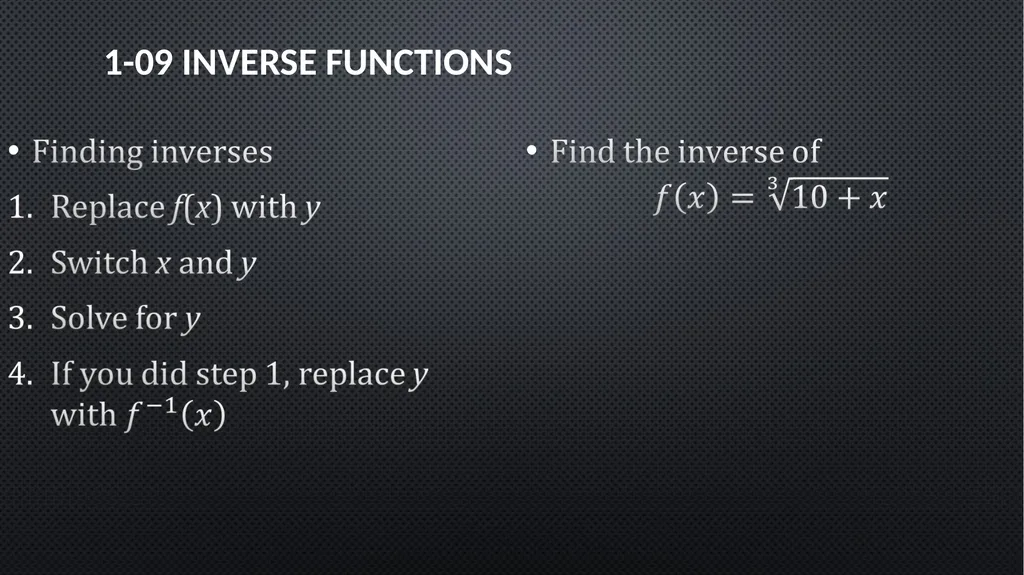
1-09 Inverse Functions In this section, you will:
Verify that two functions are inverse functions.
Find the domain and range on inverse functions.
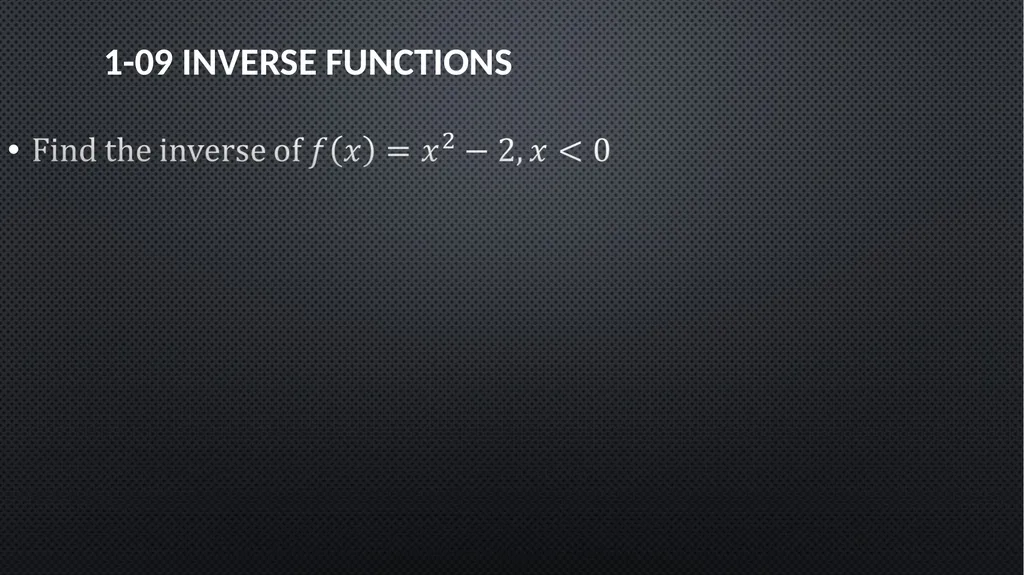
Find the inverse of a function.<br>
55
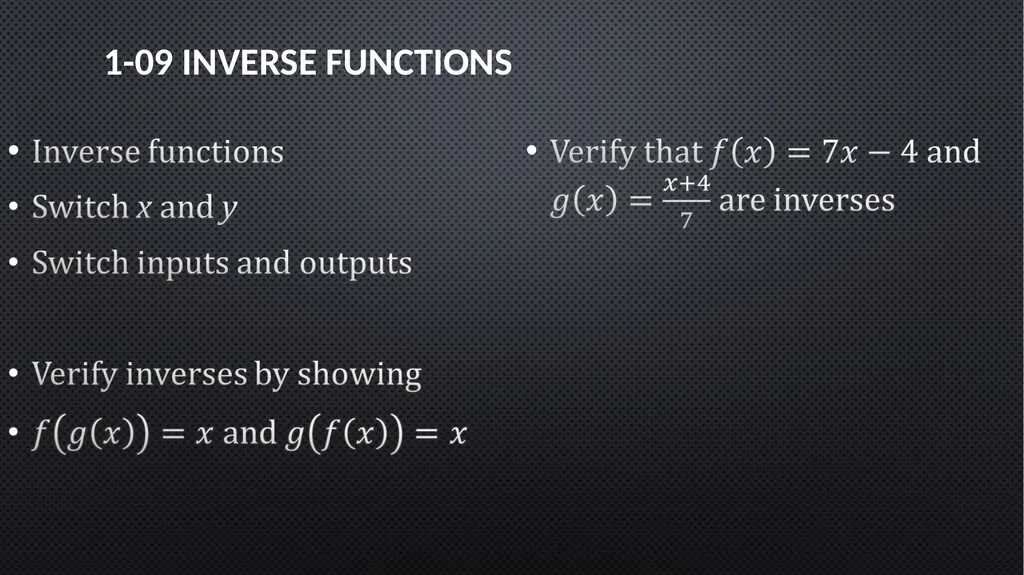
1-09 Inverse Functions<br>
56
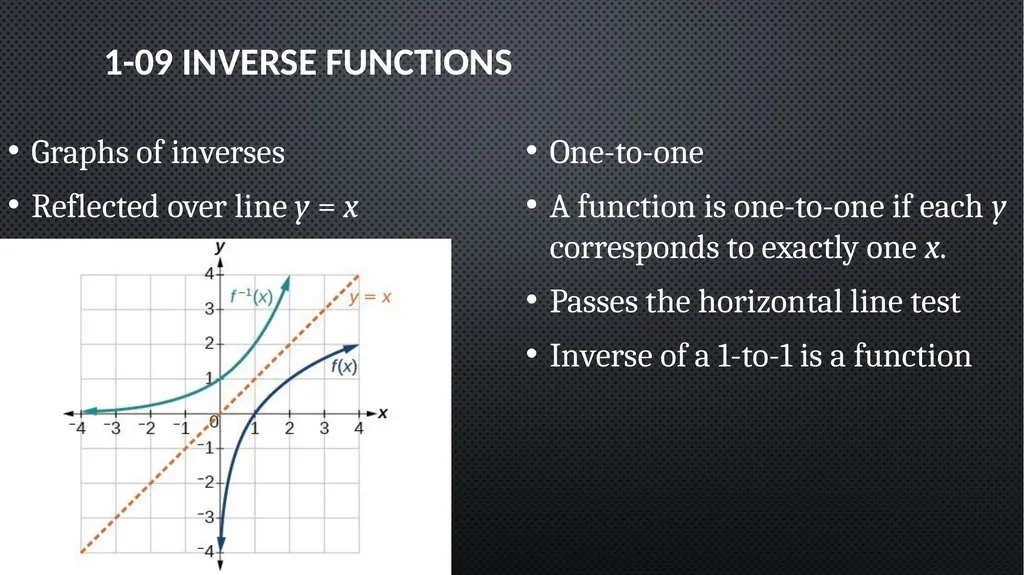
1-09 Inverse Functions Graphs of inverses
Reflected over line y = x One-to-one
A function is one-to-one if each y corresponds to exactly one x.
Passes the horizontal line test
Inverse of a 1-to-1 is a function<br>
57
1-09 Inverse Functions<br>
58
1-09 Inverse Functions<br>
59
1-10 Mathematical Modeling In this section, you will:
Draw and interpret scatter plots.
Find the best-fitting line using a graphing utility.
Calculate variations.<br>
60
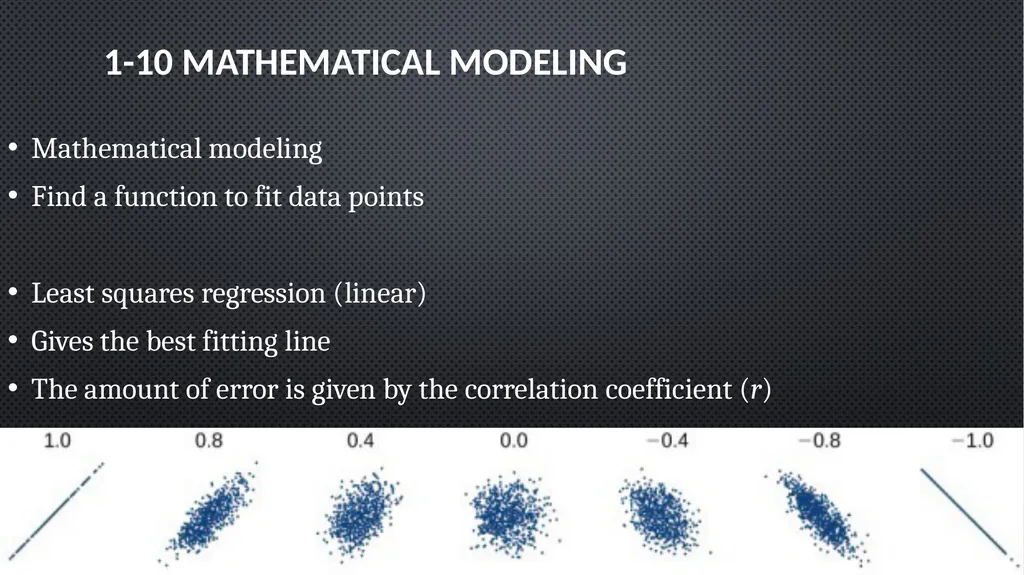
1-10 Mathematical Modeling Mathematical modeling
Find a function to fit data points
Least squares regression (linear)
Gives the best fitting line
The amount of error is given by the correlation coefficient (r)<br>
61
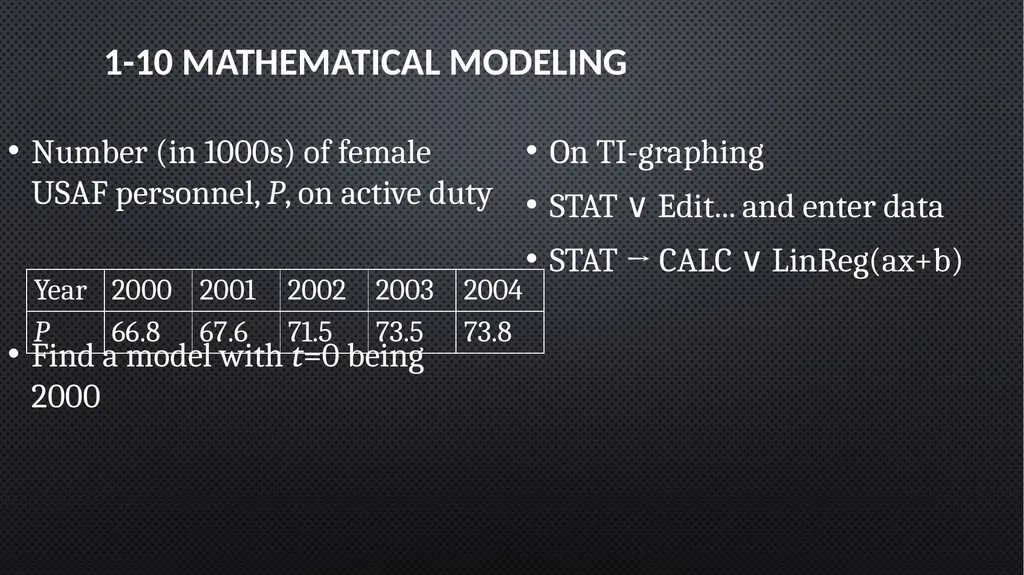
1-10 Mathematical Modeling Number (in 1000s) of female USAF personnel, P, on active duty
Find a model with t=0 being 2000 On TI-graphing
STAT ∨ Edit... and enter data
STAT → CALC ∨ LinReg(ax+b)<br>
62
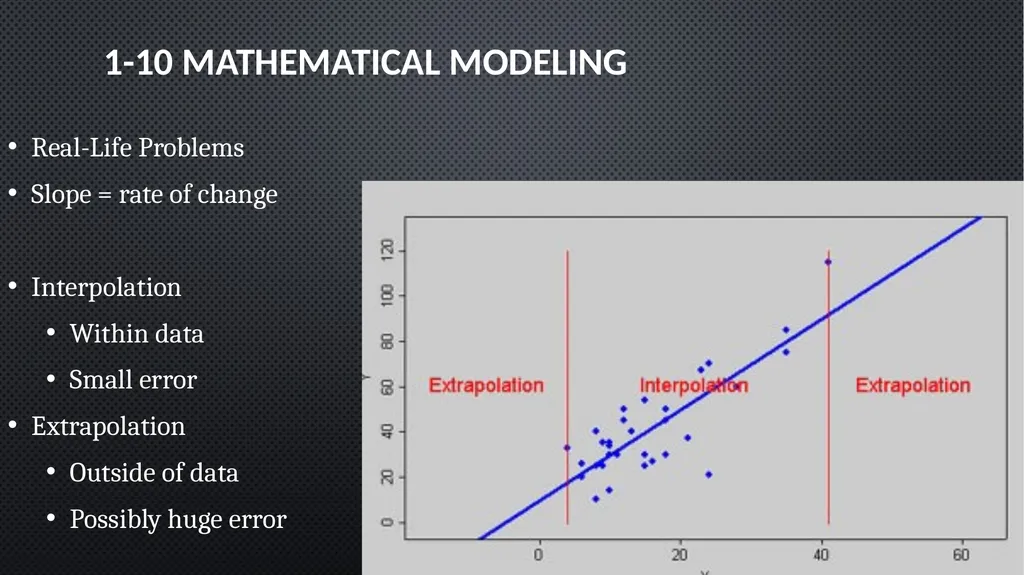
1-10 Mathematical Modeling Real-Life Problems
Slope = rate of change
Interpolation
Within data
Small error
Extrapolation
Outside of data
Possibly huge error<br>
63
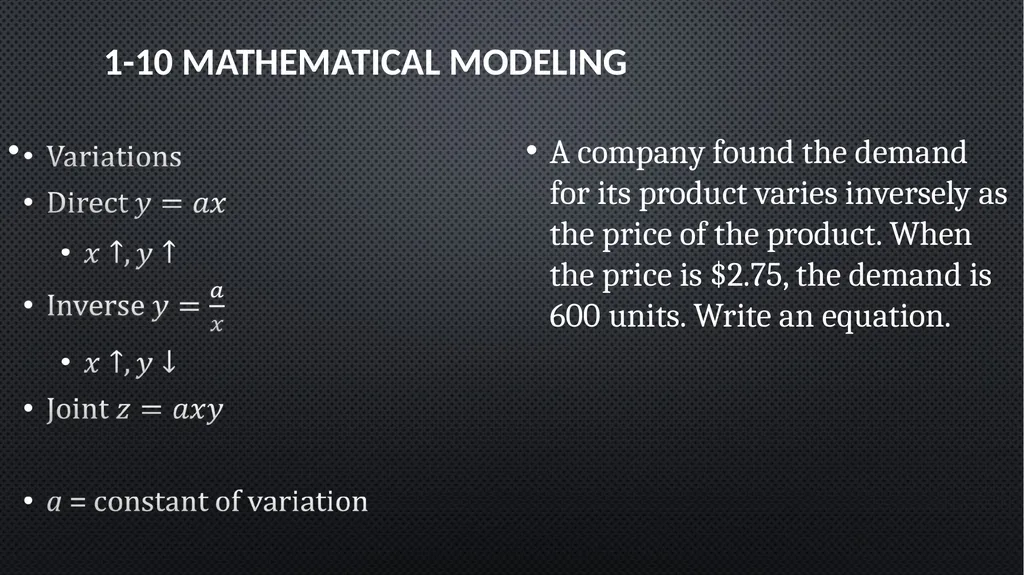
1-10 Mathematical Modeling A company found the demand for its product varies inversely as the price of the product. When the price is $2.75, the demand is 600 units. Write an equation.<br>