FUNCTIONS LESSON Mathematics Lesson or Middle School LESSON OUTLINE What are relations? What are functions? Presenting functions as tables and graphs The Vertical Line Test Do you still remember how to fill in the table of values based on a
"FUNCTIONS LESSON Mathematics Lesson or Middle" is the property of its rightful owner. Permission is granted to
download and print the materials on this website for personal, non-commercial use only, and to display it
on your personal computer provided you do not modify the materials and that you retain all copyright
notices contained in the materials. By downloading content from our website, you accept the terms of this
agreement.
Presentation Transcript
01
FUNCTIONS LESSON Mathematics Lesson or Middle School<br>
02
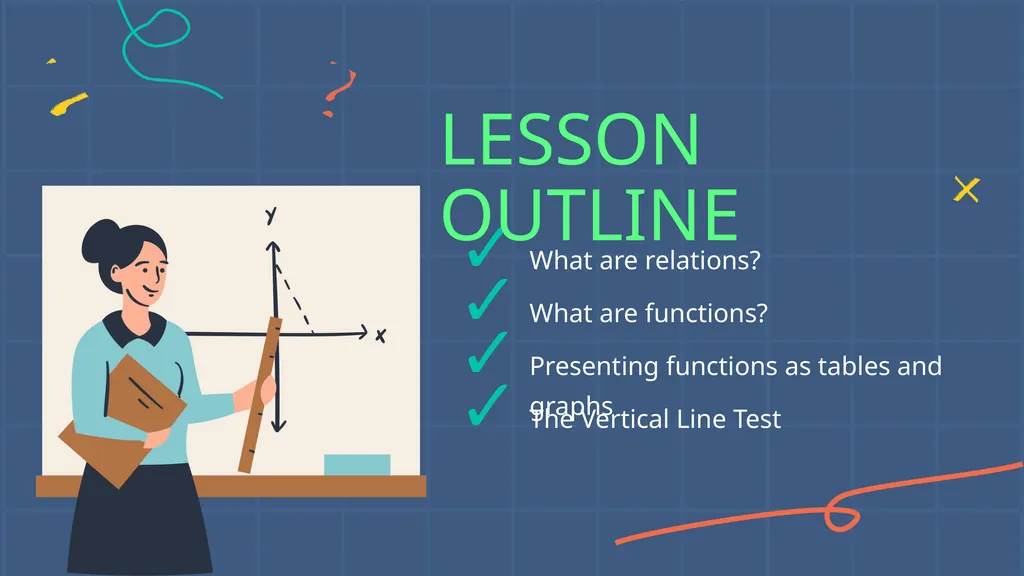
LESSON OUTLINE What are relations? What are functions? Presenting functions as tables and graphs The Vertical Line Test<br>
03
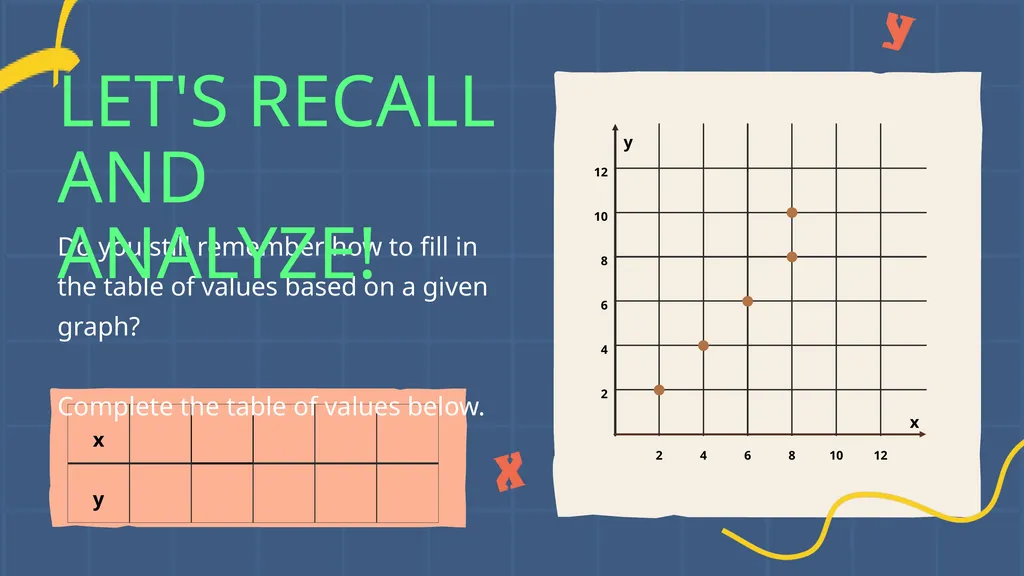
Do you still remember how to fill in the table of values based on a given graph?
Complete the table of values below. LET'S RECALL AND ANALYZE! 12 y x 10 8 6 4 2 2 4 6 8 10 12<br>
04
LEARNING OUTCOMES By the end of the lesson, you'll be able to:
Express relations and functions in tables and graphs.
Differentiate between a relation and a function.
Use a vertical test.<br>
05
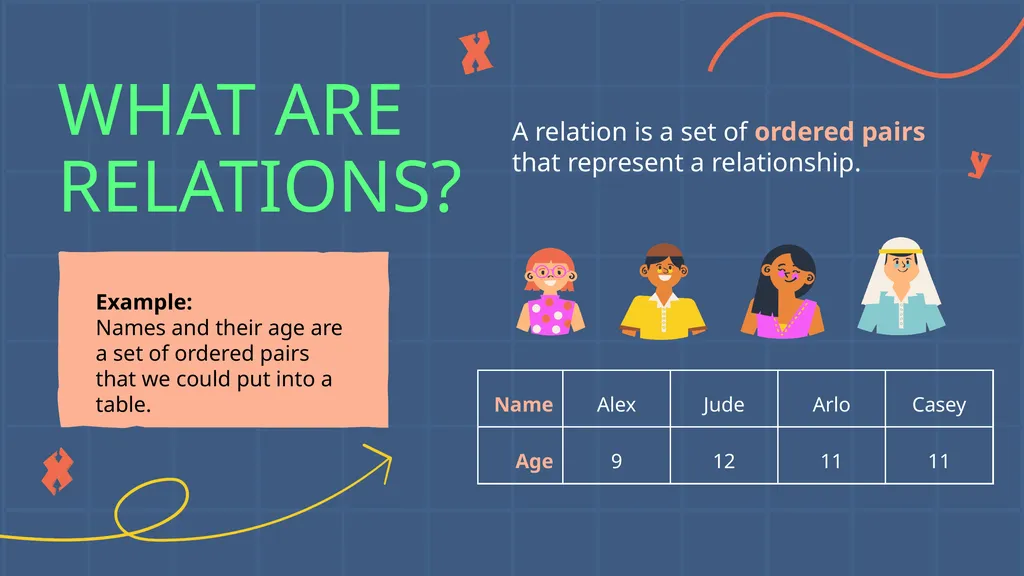
WHAT ARE RELATIONS? Example:
Names and their age are a set of ordered pairs that we could put into a table. A relation is a set of ordered pairs that represent a relationship.<br>
06
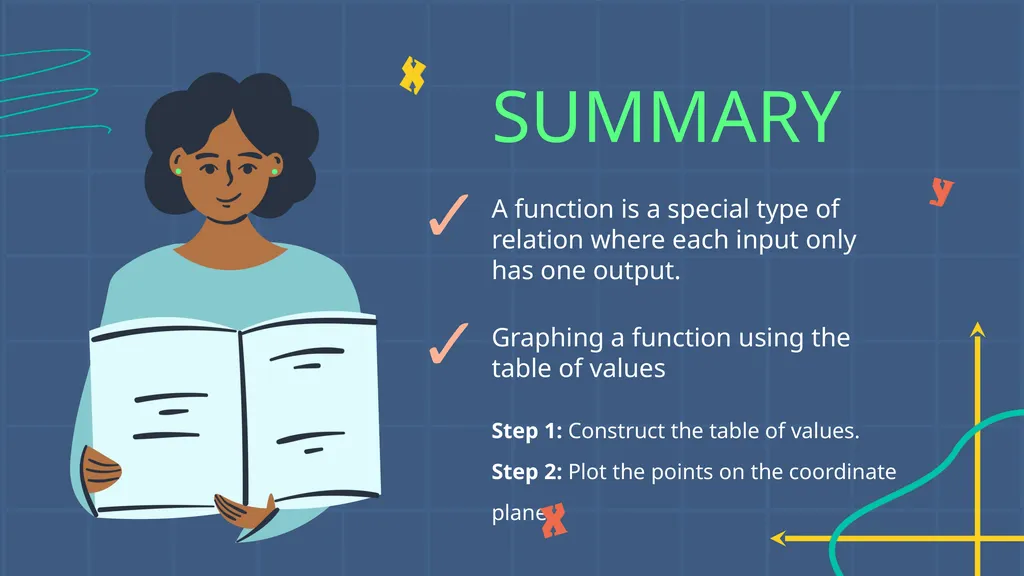
A function is a special type of relation where each input only has one output.
Functions are a way of connecting input values to their corresponding output values.
The relation is a function if, for every x-value, there is exactly one y-value. WHAT IS A FUNCTION?<br>
07
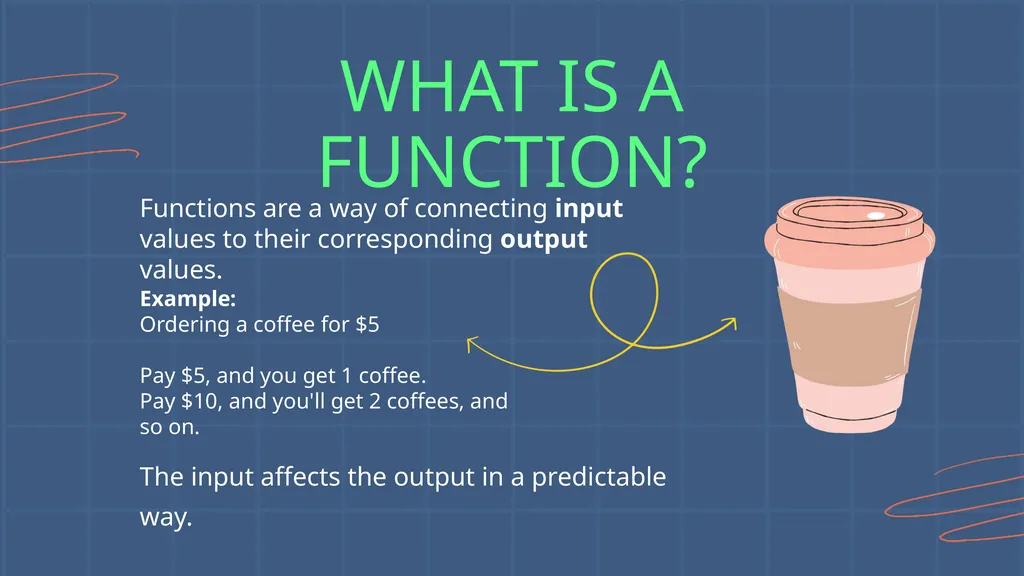
Functions are a way of connecting input values to their corresponding output values. Example:
Ordering a coffee for $5
Pay $5, and you get 1 coffee.
Pay $10, and you'll get 2 coffees, and so on. The input affects the output in a predictable way. WHAT IS A FUNCTION?<br>
08
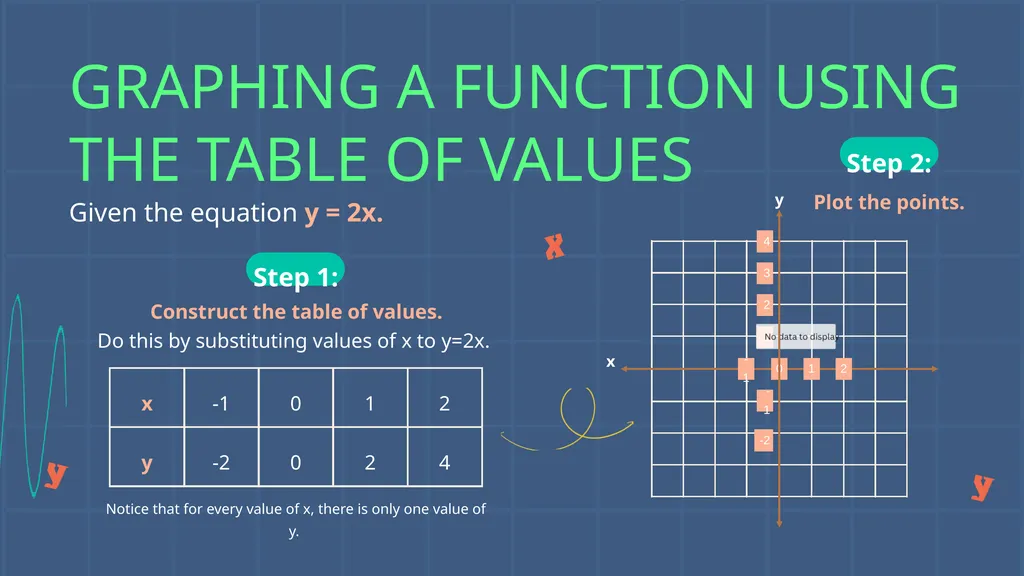
Step 1: Step 2: y x Plot the points. Notice that for every value of x, there is only one value of y. GRAPHING A FUNCTION USING THE TABLE OF VALUES Given the equation y = 2x.<br>
09
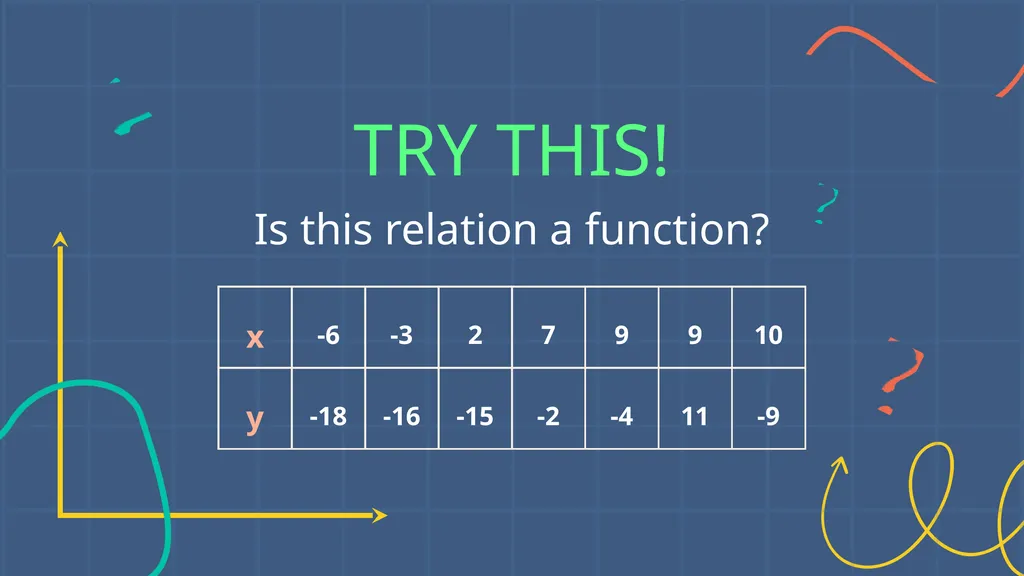
Is this relation a function? TRY THIS!<br>
10
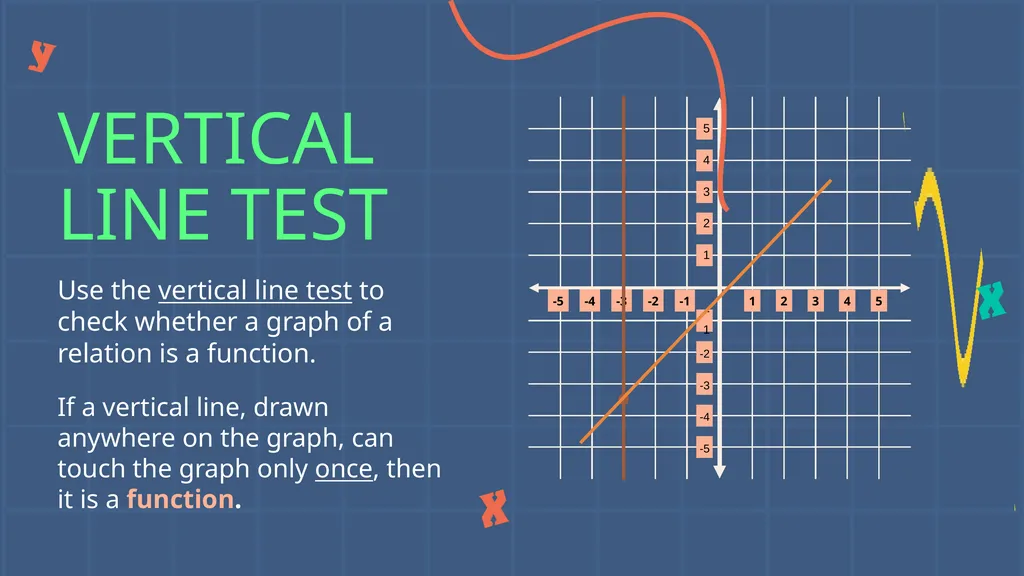
Use the vertical line test to check whether a graph of a relation is a function. VERTICAL LINE TEST If a vertical line, drawn anywhere on the graph, can touch the graph only once, then it is a function.<br>
11
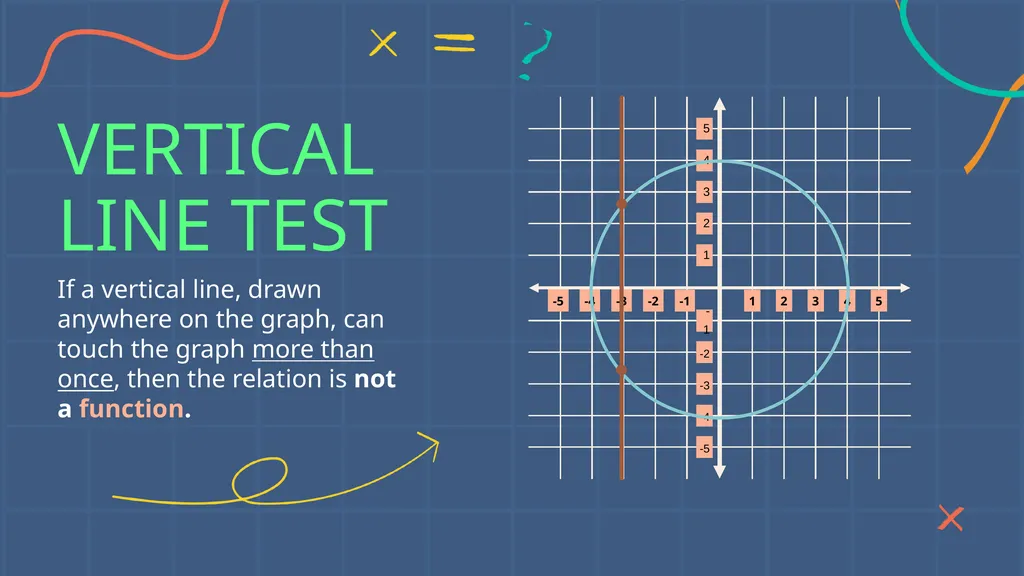
If a vertical line, drawn anywhere on the graph, can touch the graph more than once, then the relation is not a function. VERTICAL LINE TEST<br>
12
A function is a special type of relation where each input only has one output. Graphing a function using the table of values Step 1: Construct the table of values.
Step 2: Plot the points on the coordinate plane. SUMMARY<br>
13
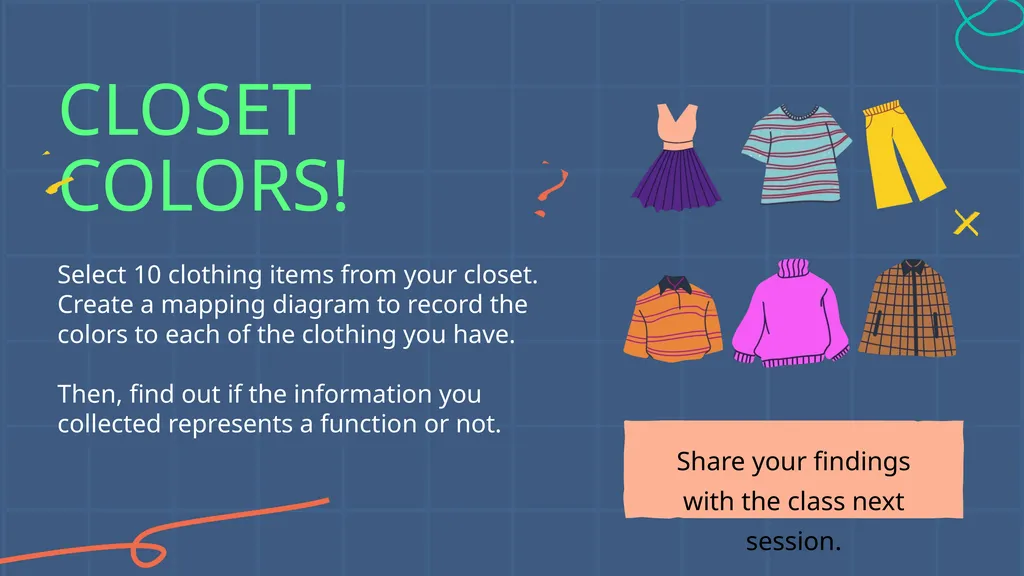
Select 10 clothing items from your closet. Create a mapping diagram to record the colors to each of the clothing you have.
Then, find out if the information you collected represents a function or not. Share your findings with the class next session. CLOSET COLORS!<br>
14
REFERENCE Mathspace. “6.0 Functions and relations | Grade 8 Math | Common Core 8 - 2023 Edition.” Accessed 12 June 2023,
https://mathspace.co/textbooks/syllabuses/Syllabus-1157/topics/Topic-21908/subtopics/Subtopic-279918/?searchString=<br>
15
Use these design resources in your Canva Presentation.
You can find these fonts online too. Happy designing! Resource Page This presentation template uses the following free fonts: Titles: Changa
Headers: Changa
Body Copy: Yantramanav<br>
16
Credits Happy designing! This presentation template is free for everyone to use thanks to the following: SlidesCarnival for the presentation template
Pexels for the photos<br>