Genotypic variability in colour, pungency and antioxidant activity among chilli genotypes Dr. V. K. Rao Indian Institute of Horticultural Research, Bangalore, India Introduction It is a major spice crop in India and some other countries It
Related Topics
Share
Embed code
Download this presentation From Below
"Genotypic variability in colour, pungency and" is the property of its rightful owner. Permission is granted to
download and print the materials on this website for personal, non-commercial use only, and to display it
on your personal computer provided you do not modify the materials and that you retain all copyright
notices contained in the materials. By downloading content from our website, you accept the terms of this
agreement.
Presentation Transcript
01
Genotypic variability in colour, pungency and antioxidant activity among chilli genotypes Dr. V. K. Rao
Indian Institute of Horticultural Research,
Bangalore, India<br>
02
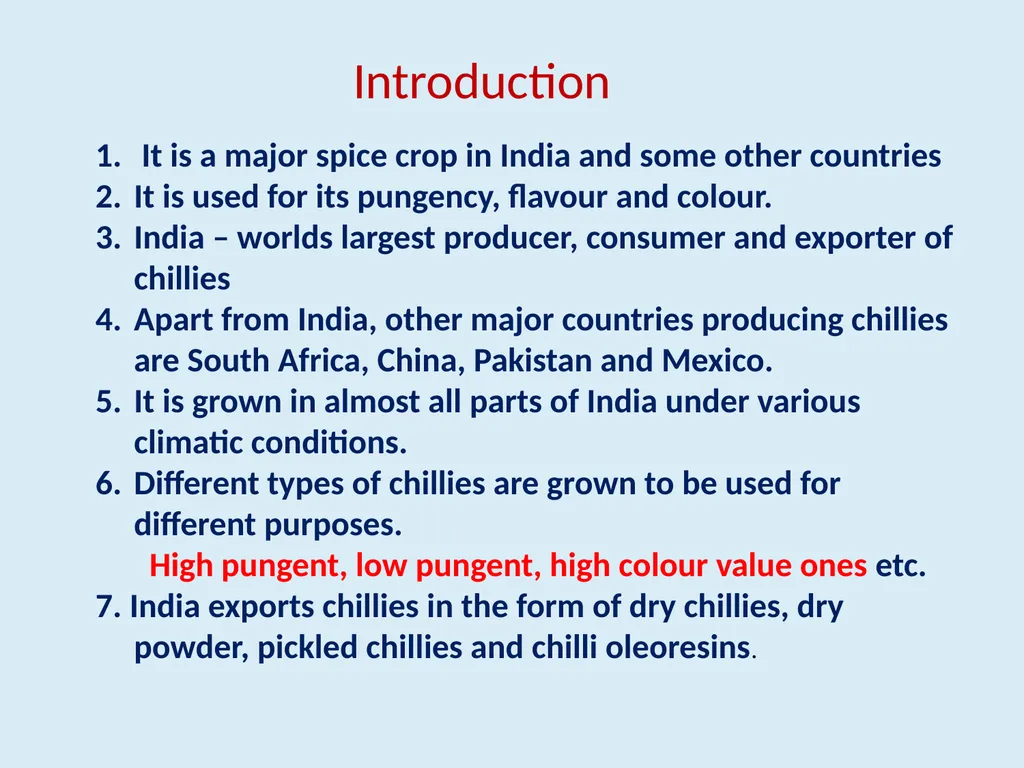
Introduction It is a major spice crop in India and some other countries
It is used for its pungency, flavour and colour.
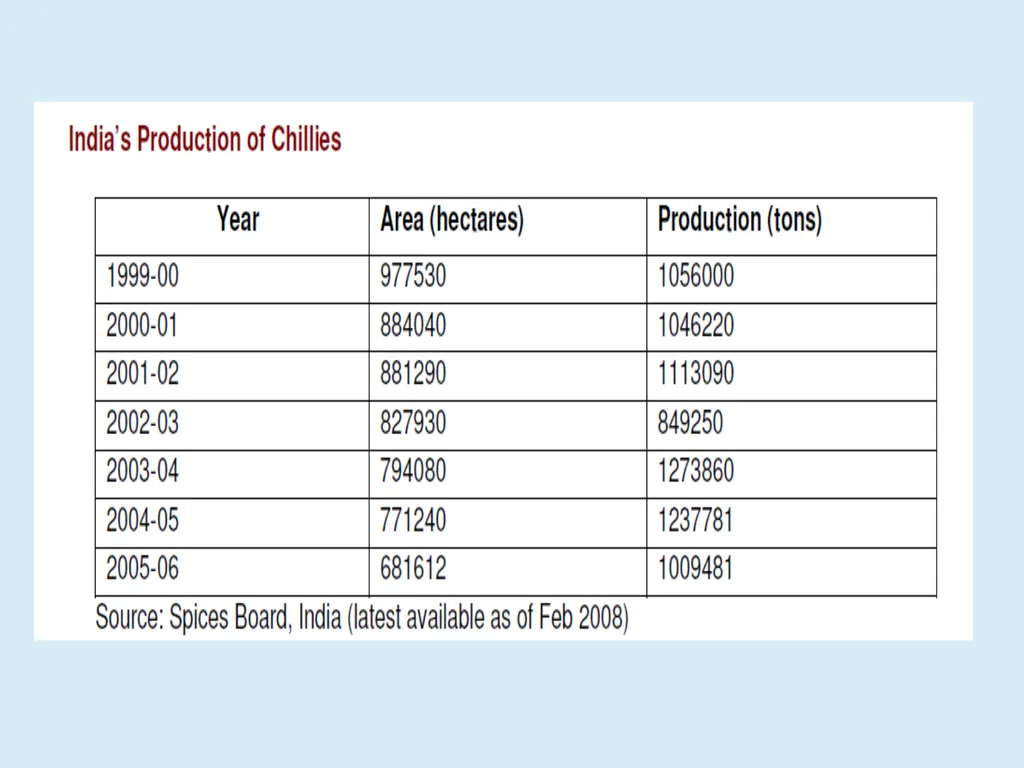
India – worlds largest producer, consumer and exporter of chillies
Apart from India, other major countries producing chillies are South Africa, China, Pakistan and Mexico.
It is grown in almost all parts of India under various climatic conditions.
Different types of chillies are grown to be used for different purposes.
High pungent, low pungent, high colour value ones etc.
7. India exports chillies in the form of dry chillies, dry powder, pickled chillies and chilli oleoresins.<br>
03
Usage
1. It is used in fresh green state, fermented state, dry red powder.
2. Other products include pickles, sauce and paste
3. Paprika color – natural red colour - colouring substance in food
industry
4. Oleoresin – For flavour and colour in food industry<br>
04
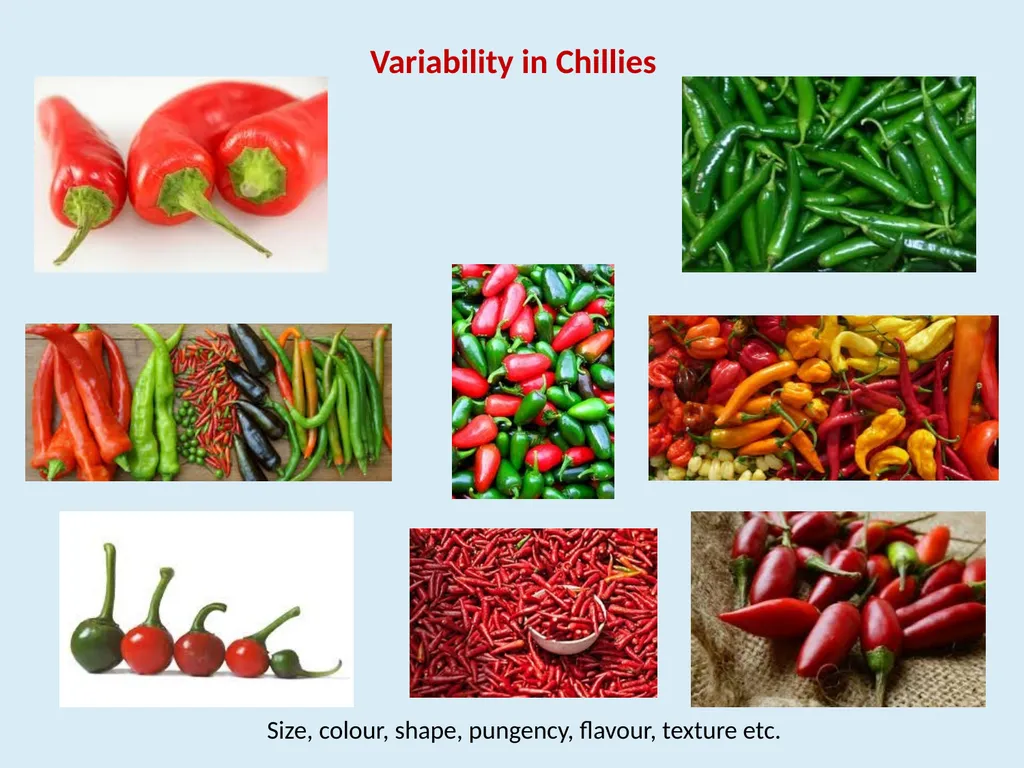
Variability in Chillies Size, colour, shape, pungency, flavour, texture etc.<br>
05
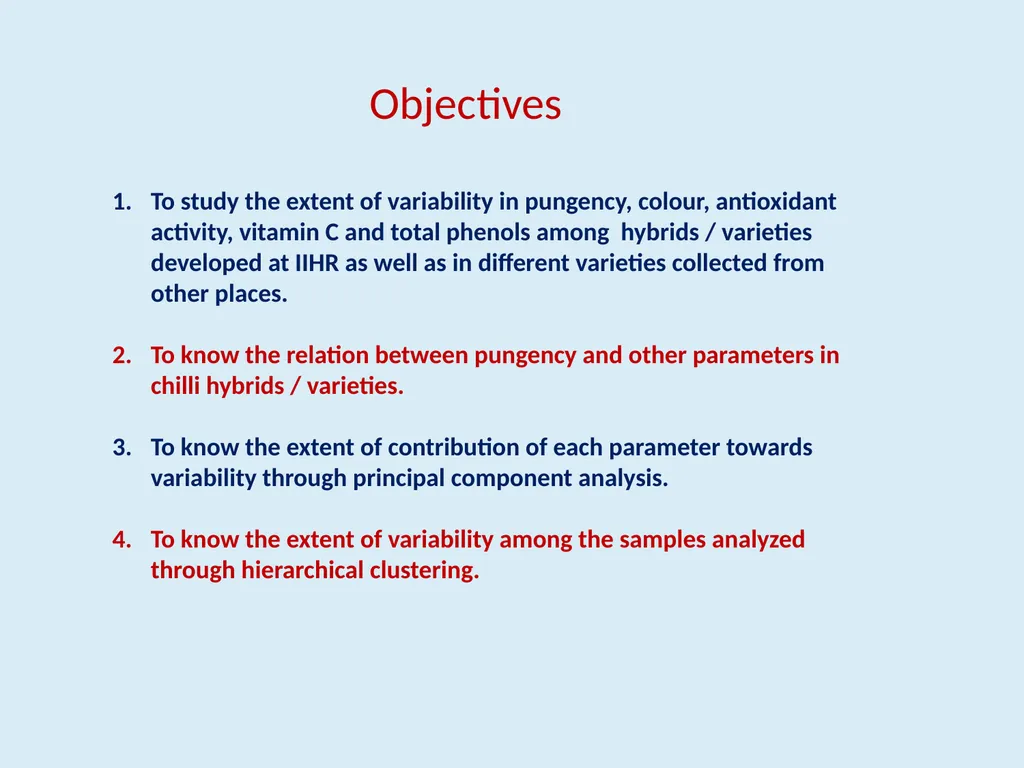
To study the extent of variability in pungency, colour, antioxidant activity, vitamin C and total phenols among hybrids / varieties developed at IIHR as well as in different varieties collected from other places.
To know the relation between pungency and other parameters in chilli hybrids / varieties.
To know the extent of contribution of each parameter towards variability through principal component analysis.
To know the extent of variability among the samples analyzed through hierarchical clustering. Objectives<br>
06
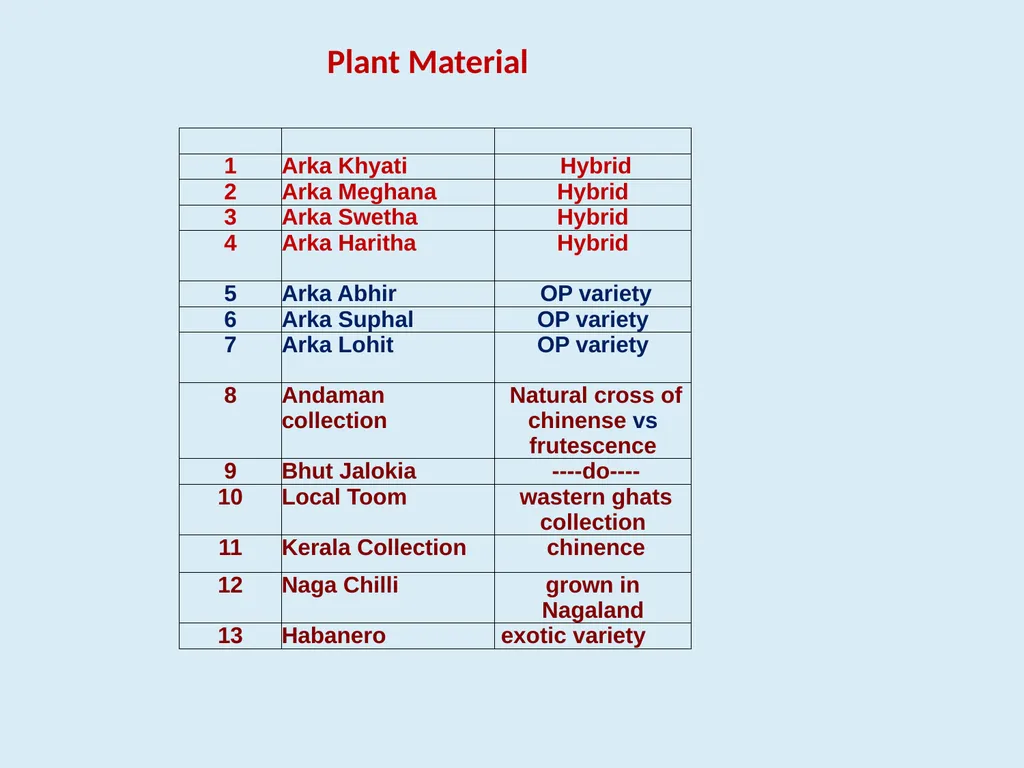
Plant Material<br>
07
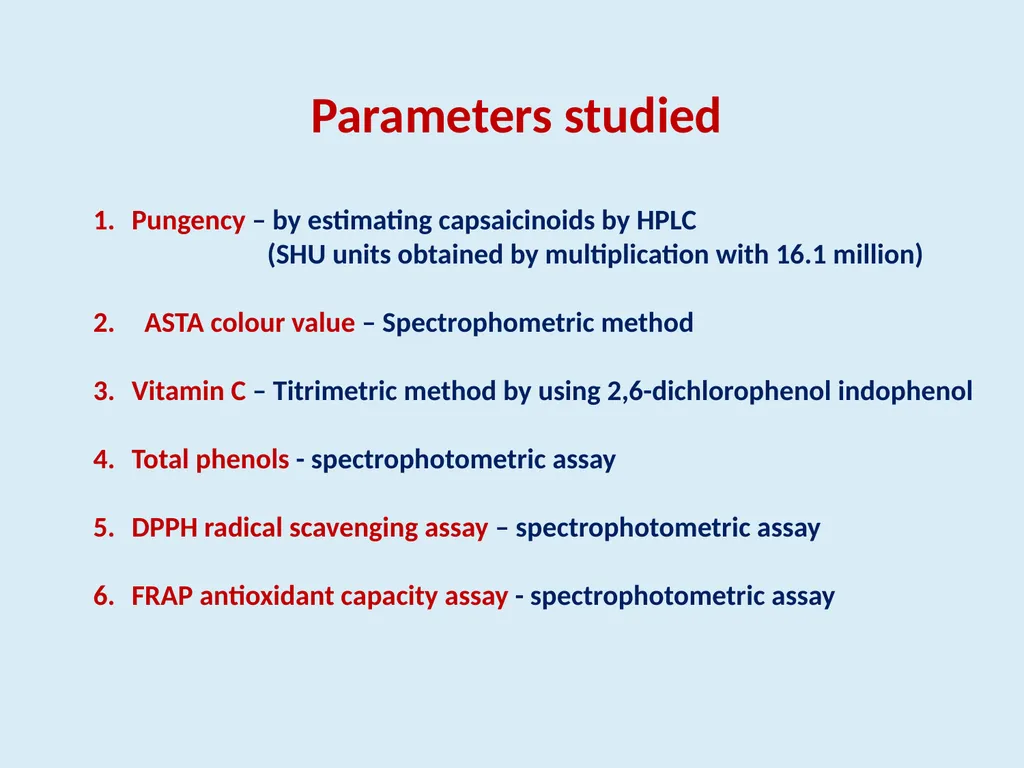
Parameters studied Pungency – by estimating capsaicinoids by HPLC
(SHU units obtained by multiplication with 16.1 million)
ASTA colour value – Spectrophometric method
Vitamin C – Titrimetric method by using 2,6-dichlorophenol indophenol
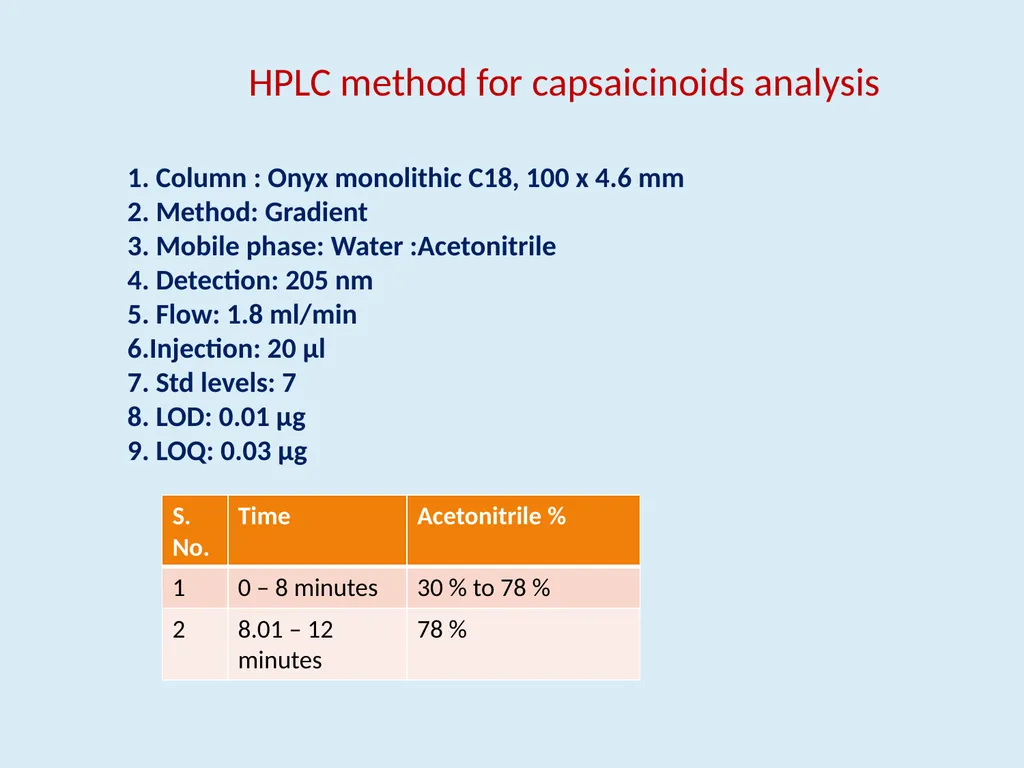
HPLC method for capsaicinoids analysis 1. Column : Onyx monolithic C18, 100 x 4.6 mm
2. Method: Gradient
3. Mobile phase: Water :Acetonitrile
4. Detection: 205 nm
5. Flow: 1.8 ml/min
6.Injection: 20 µl
7. Std levels: 7
8. LOD: 0.01 µg
9. LOQ: 0.03 µg<br>
09
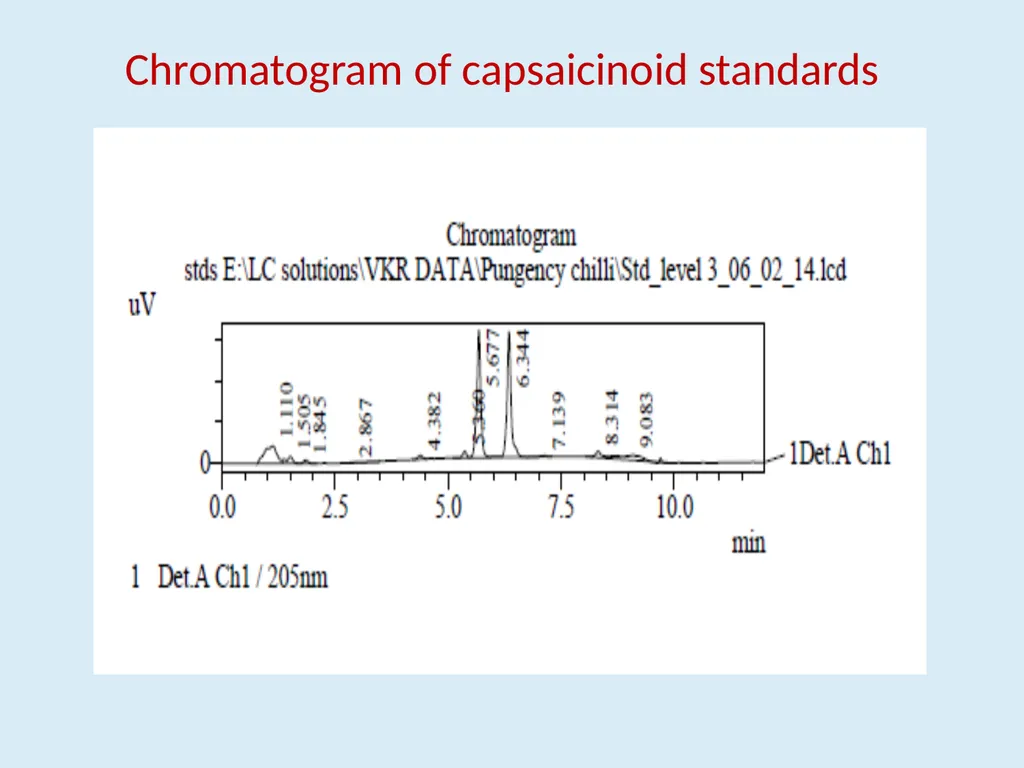
Chromatogram of capsaicinoid standards<br>
10
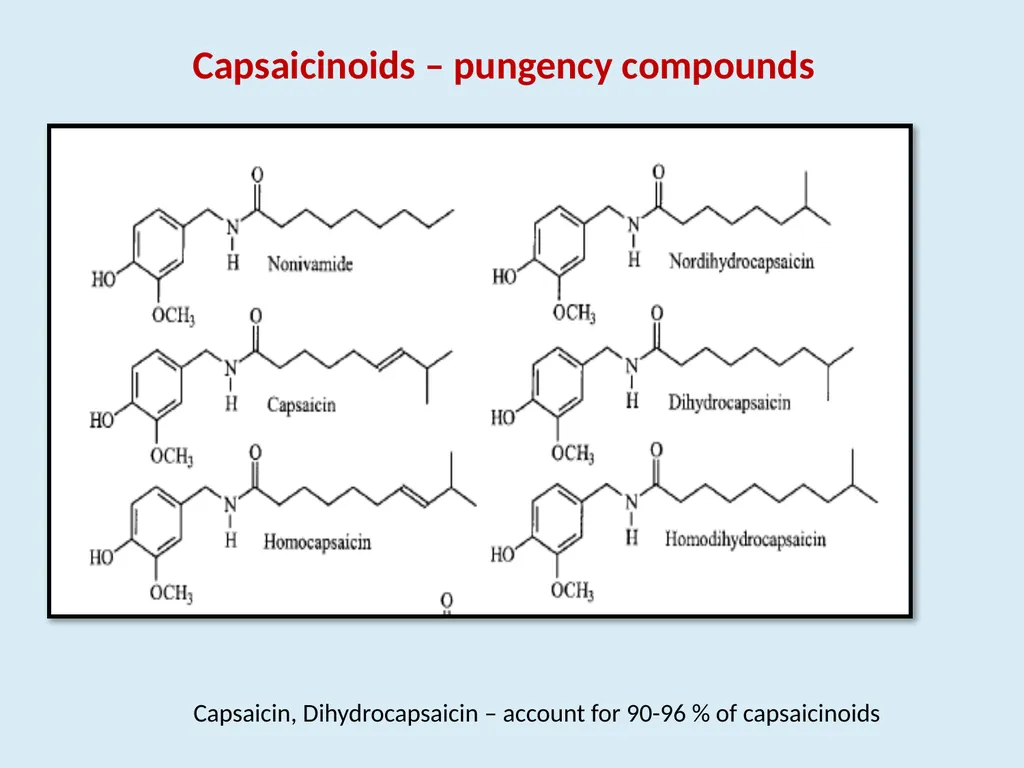
Capsaicinoids – pungency compounds Capsaicin, Dihydrocapsaicin – account for 90-96 % of capsaicinoids<br>
11
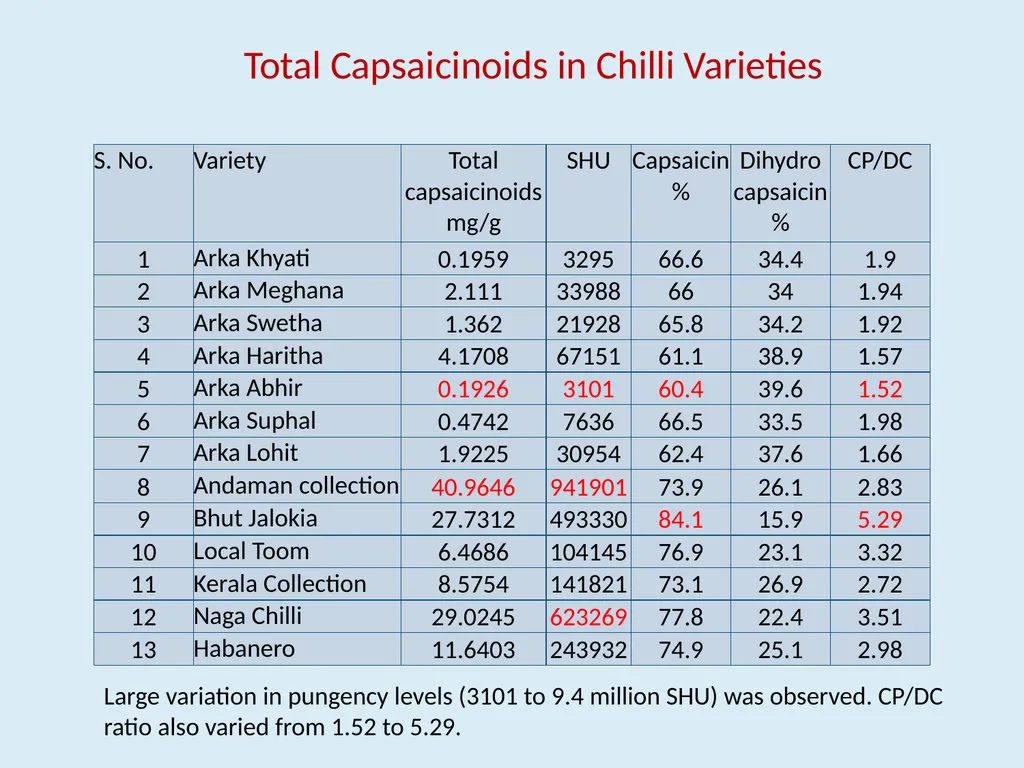
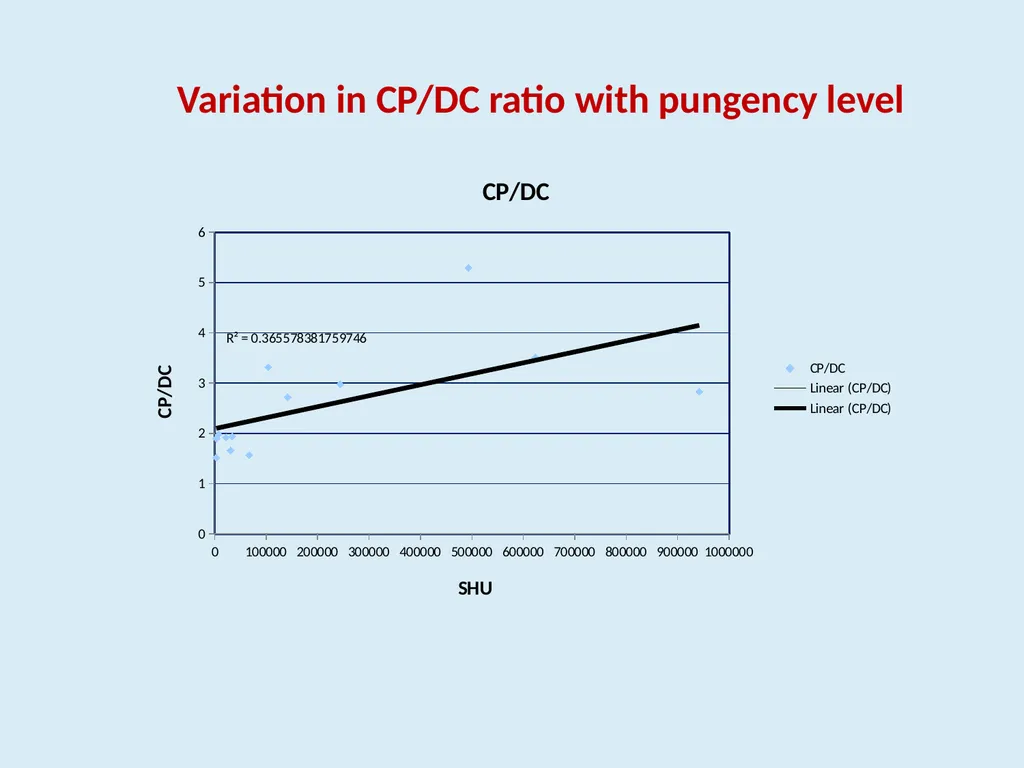
Total Capsaicinoids in Chilli Varieties Large variation in pungency levels (3101 to 9.4 million SHU) was observed. CP/DC ratio also varied from 1.52 to 5.29.<br>
12
Variation in CP/DC ratio with pungency level<br>
13
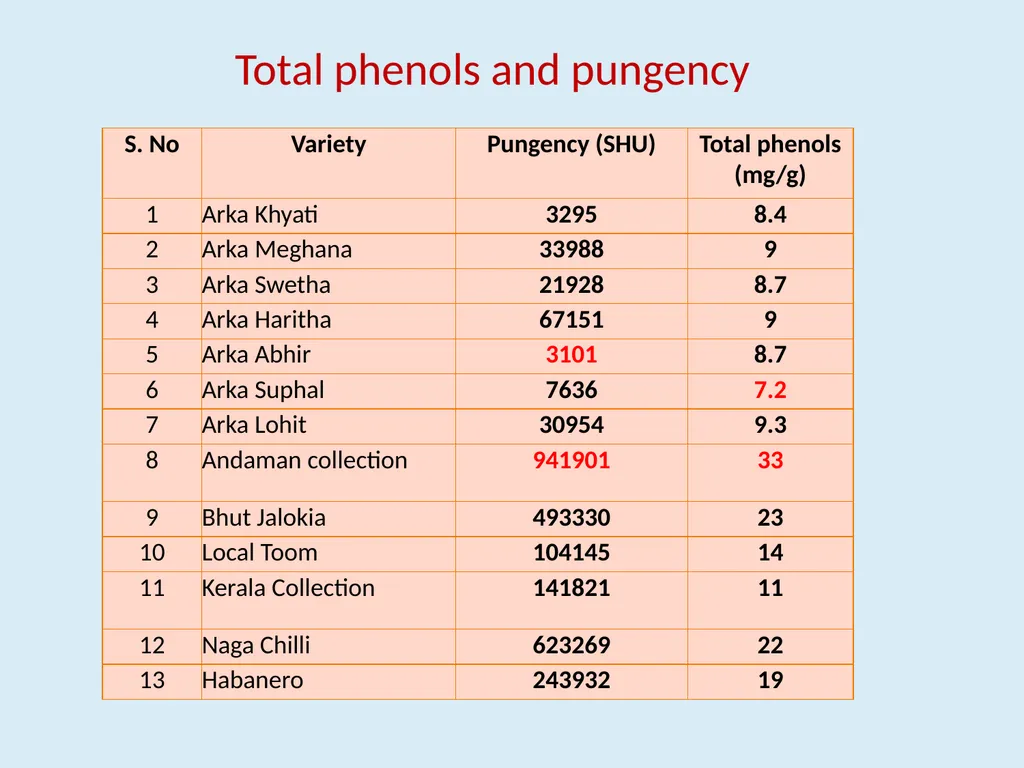
Total phenols and pungency<br>
14
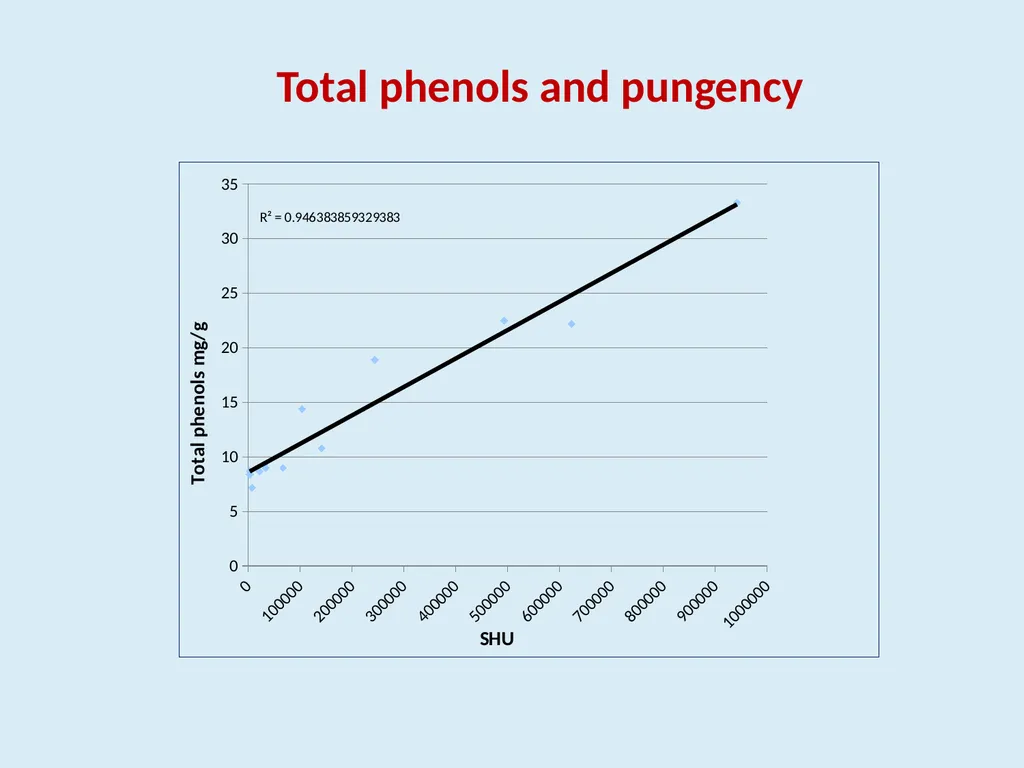
Total phenols and pungency<br>
15
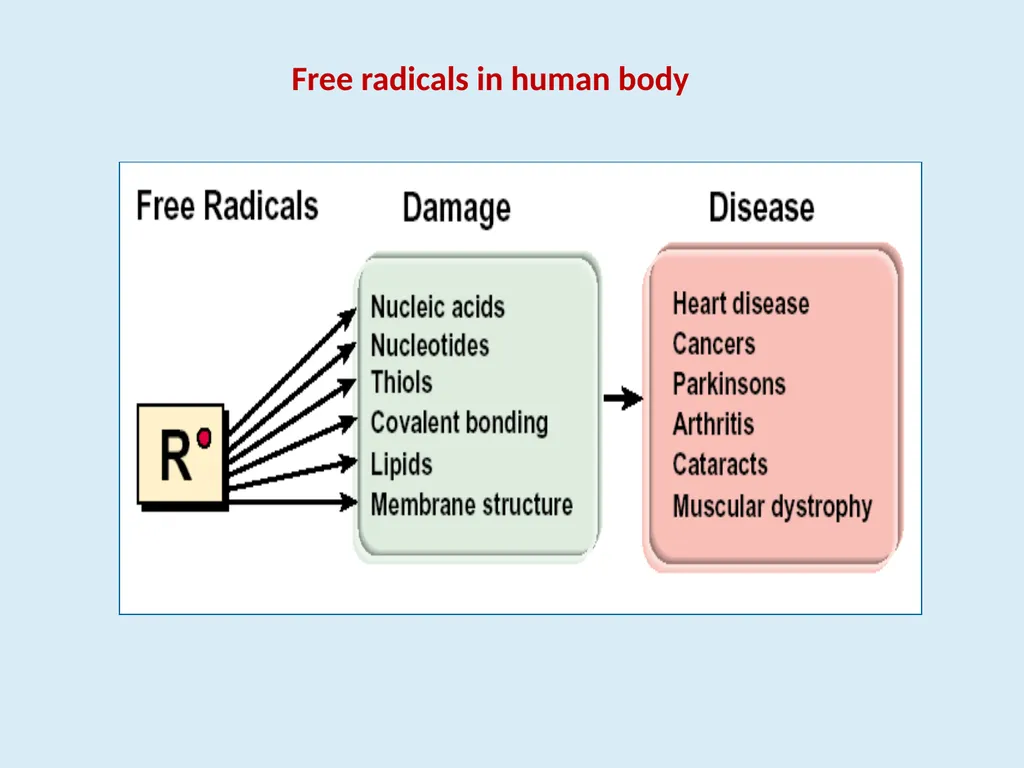
Free radicals in human body<br>
16
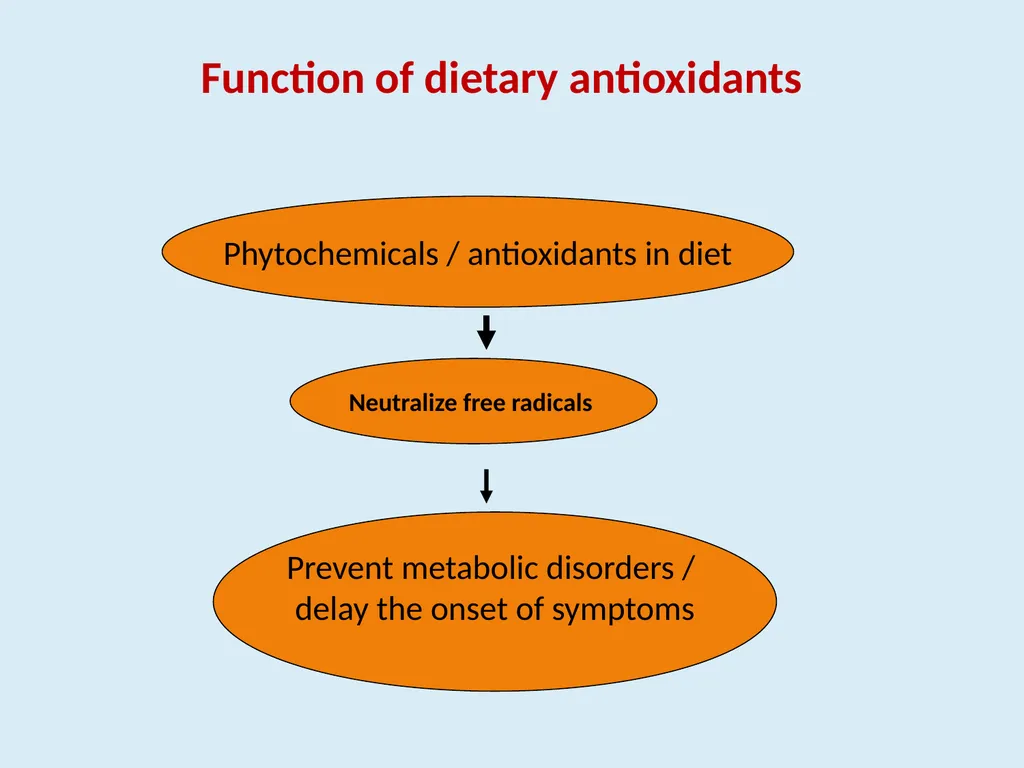
Neutralize free radicals Phytochemicals / antioxidants in diet Prevent metabolic disorders /
delay the onset of symptoms Function of dietary antioxidants<br>
17
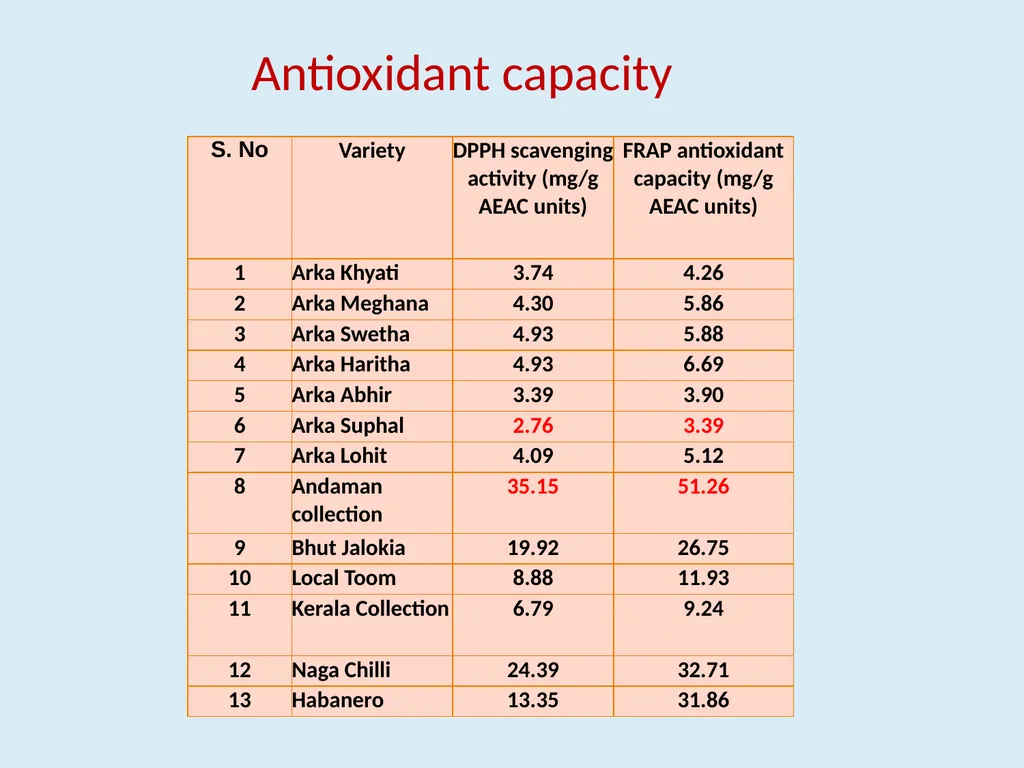
Antioxidant capacity<br>
18
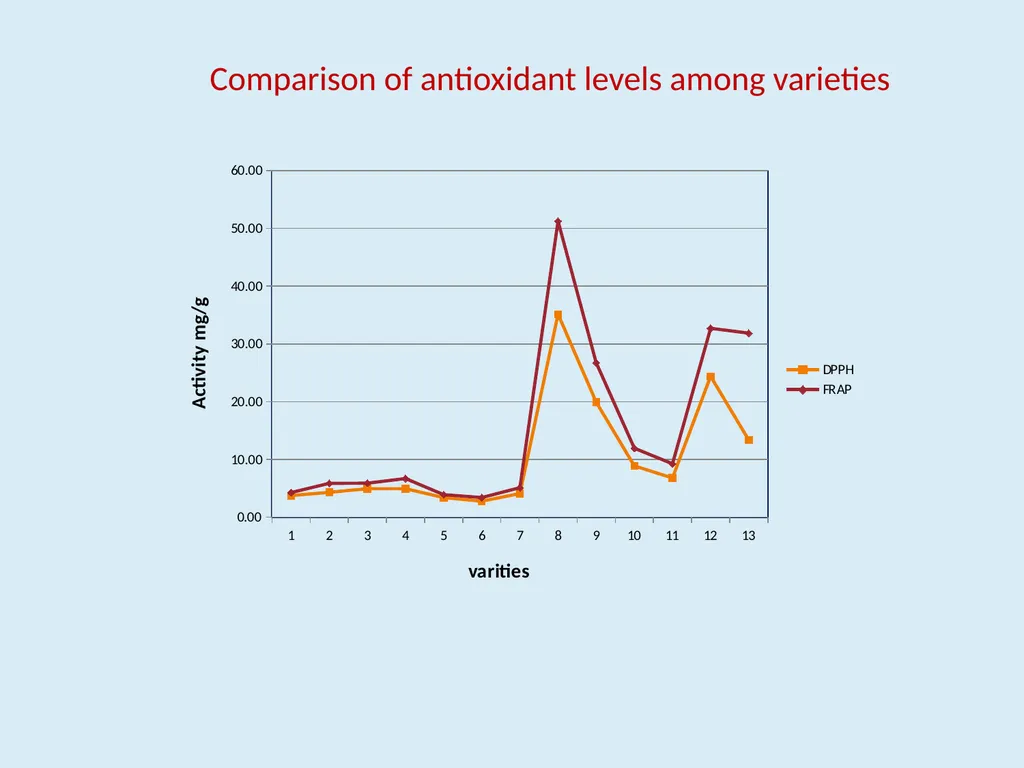
Comparison of antioxidant levels among varieties<br>
19
Carotenoid pigments in chillies capsanthin capsorubin A. Red carotenoids<br>
20
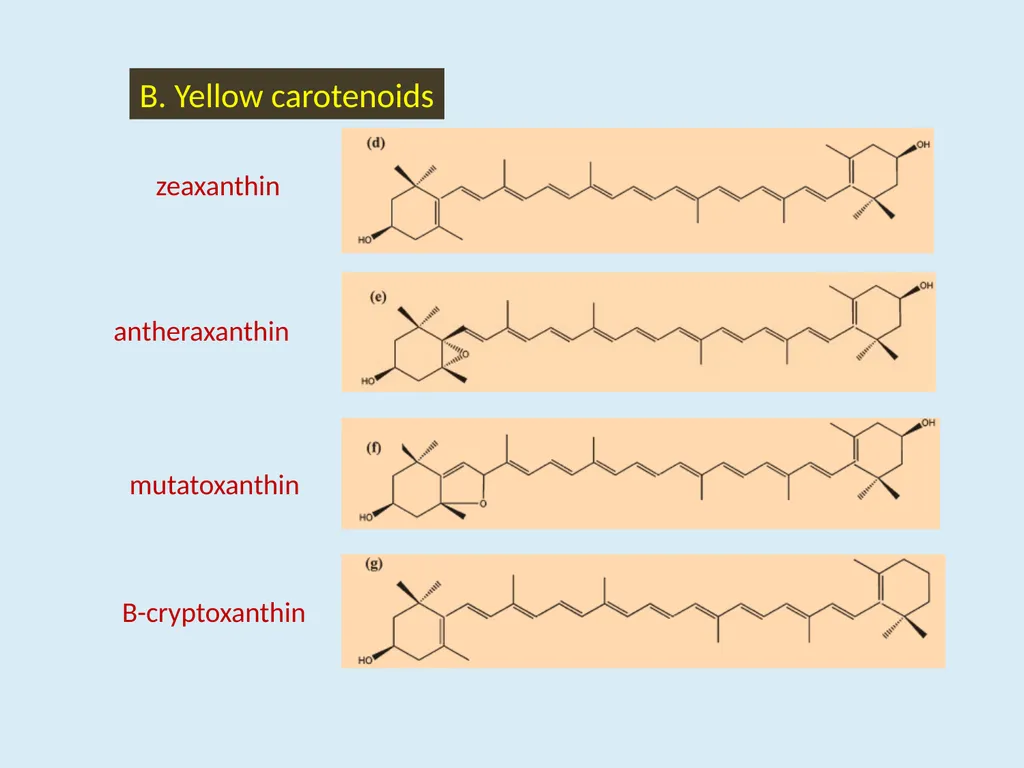
B. Yellow carotenoids zeaxanthin antheraxanthin mutatoxanthin Β-cryptoxanthin<br>
21
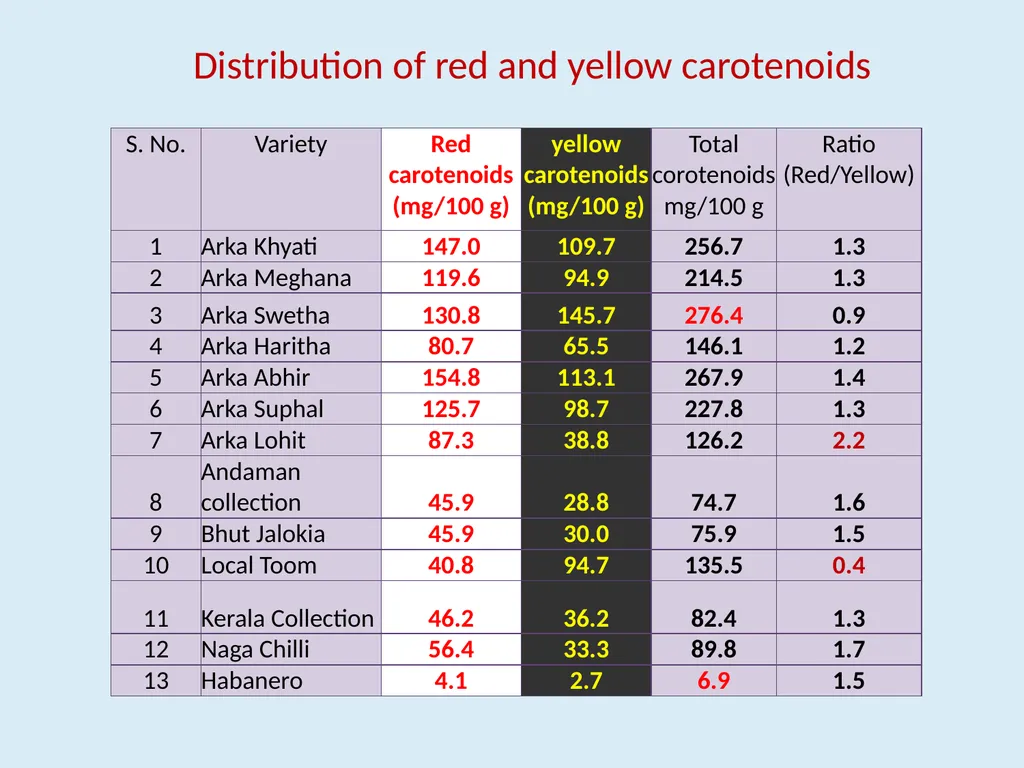
Distribution of red and yellow carotenoids<br>
22
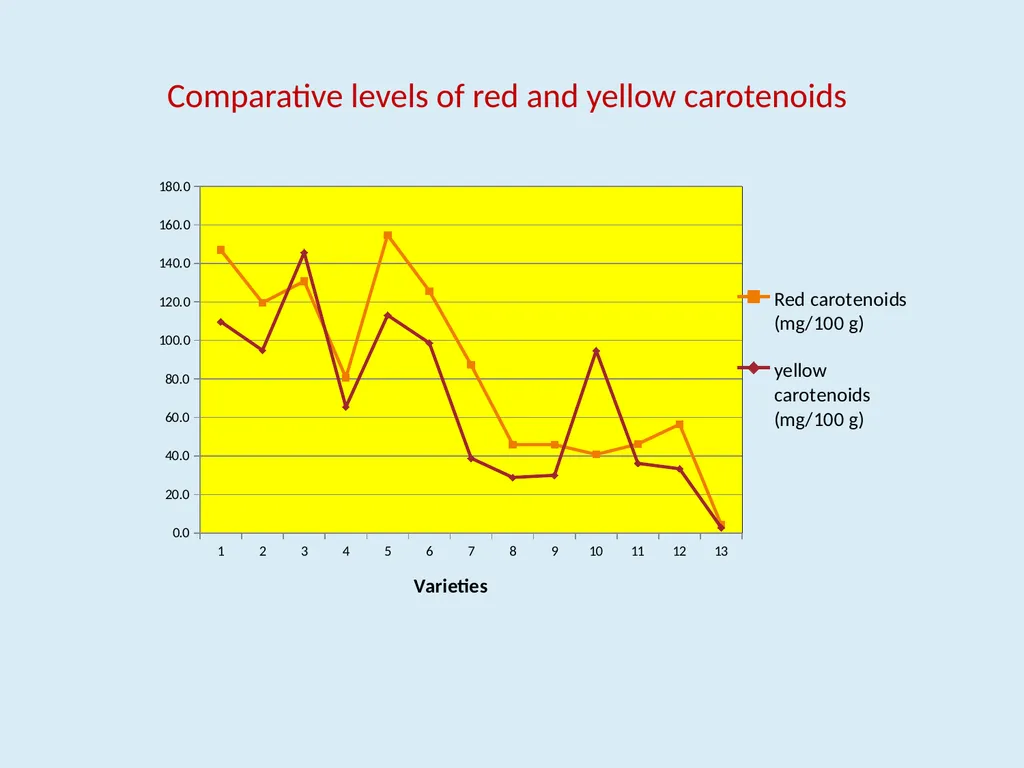
Comparative levels of red and yellow carotenoids<br>
23
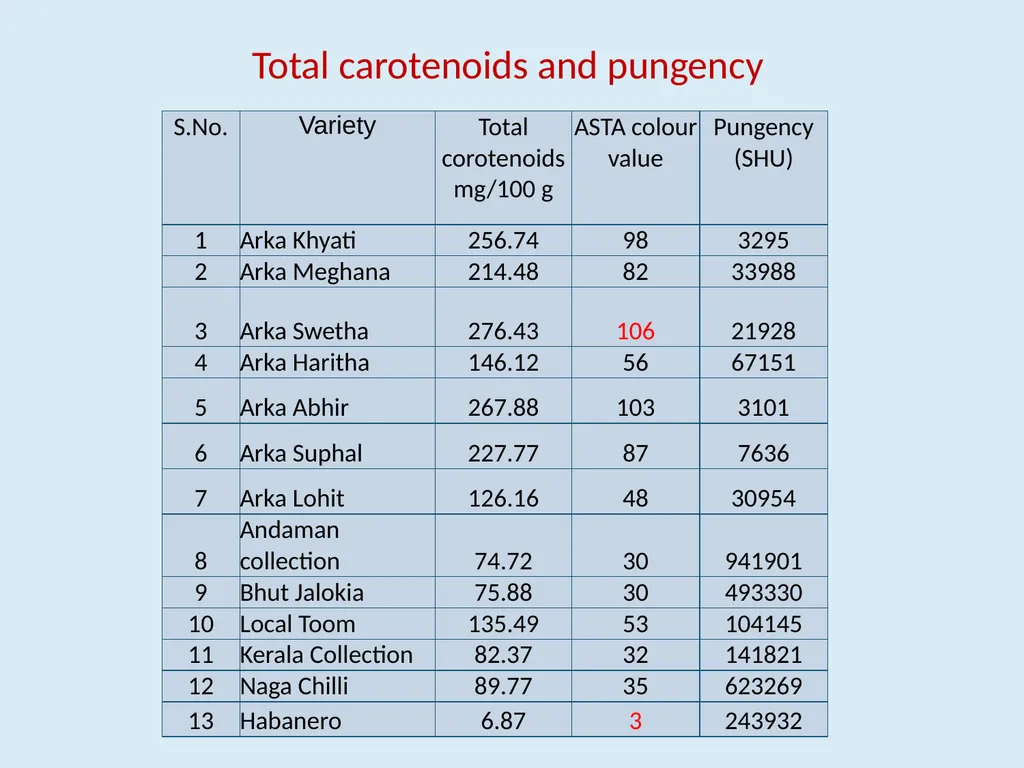
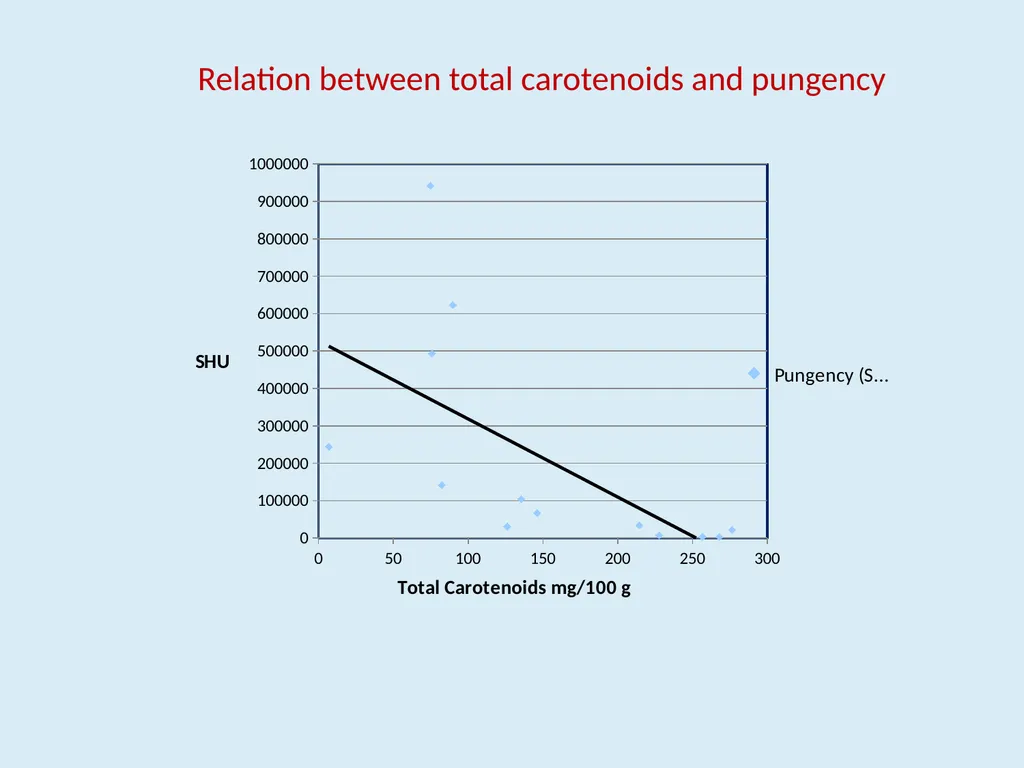
Total carotenoids and pungency<br>
24
Relation between total carotenoids and pungency<br>
25
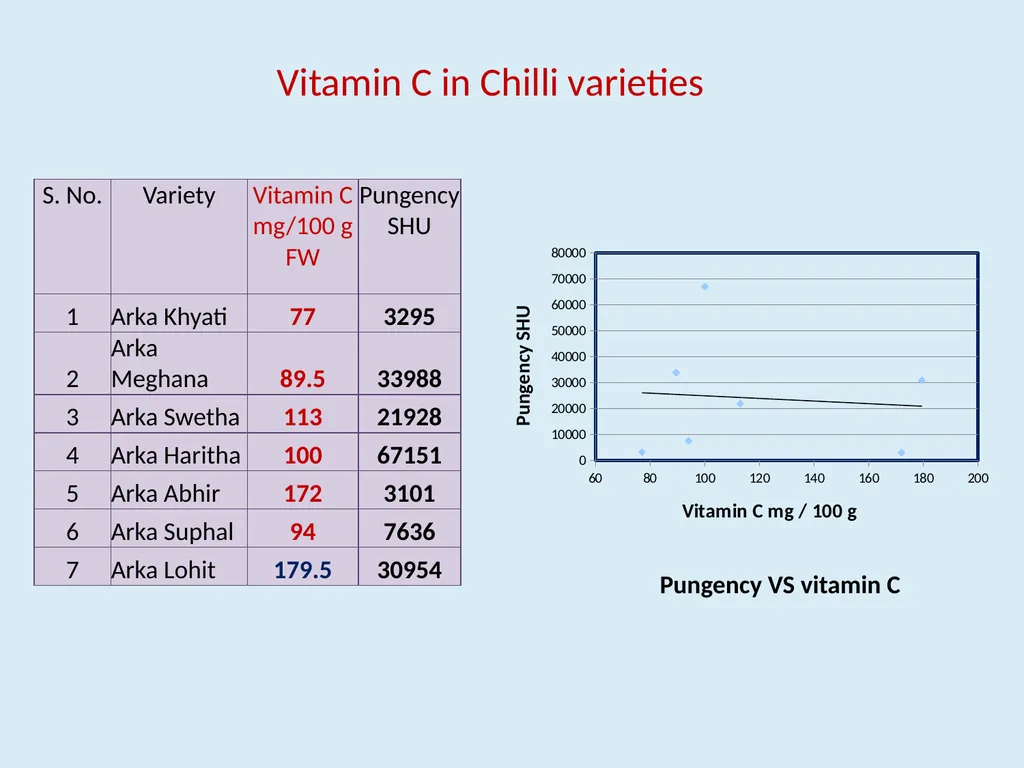
Pungency VS vitamin C Vitamin C in Chilli varieties<br>
26
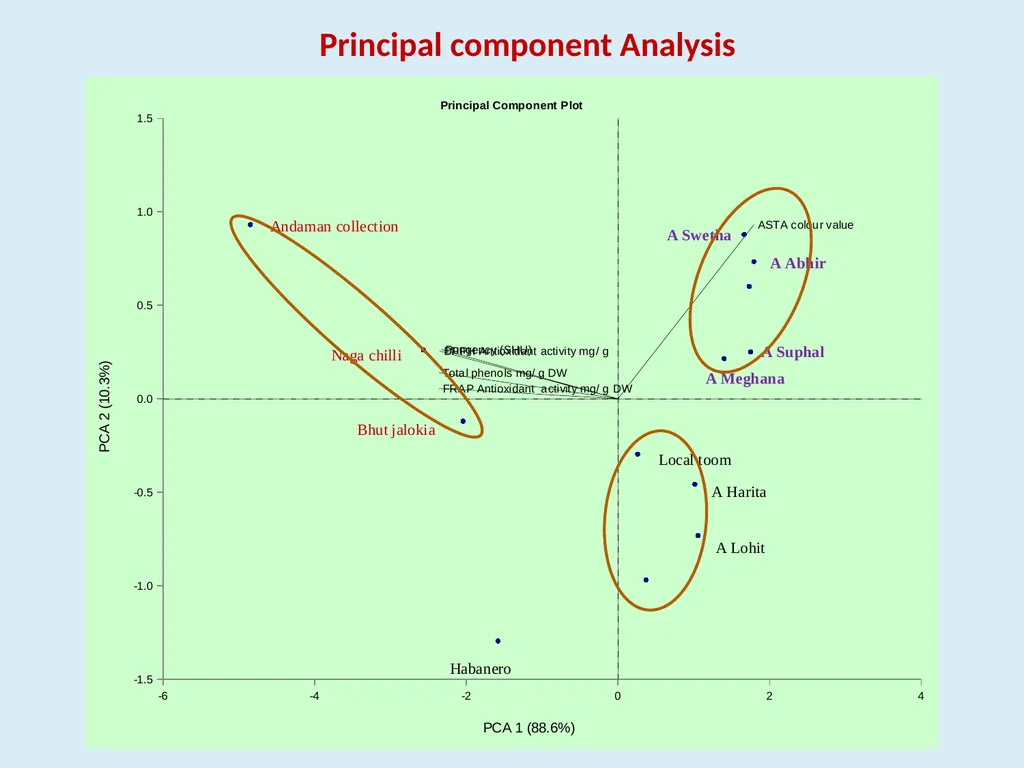
Principal component Analysis<br>
27
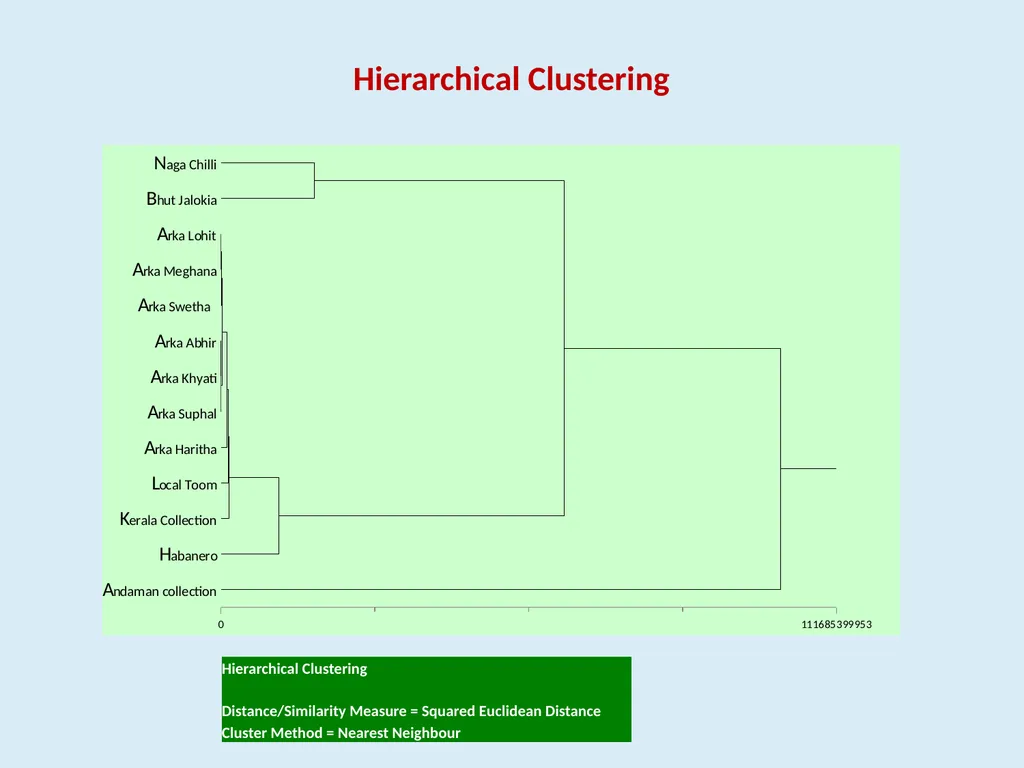
Hierarchical Clustering<br>
28
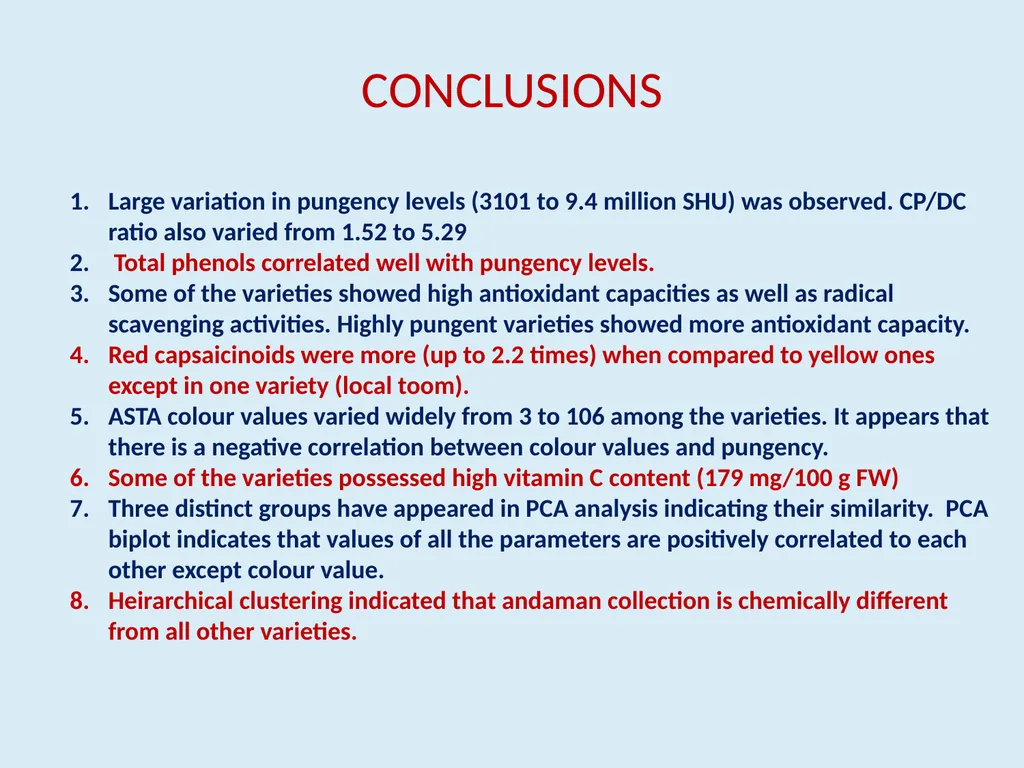
CONCLUSIONS Large variation in pungency levels (3101 to 9.4 million SHU) was observed. CP/DC ratio also varied from 1.52 to 5.29
Total phenols correlated well with pungency levels.
Some of the varieties showed high antioxidant capacities as well as radical scavenging activities. Highly pungent varieties showed more antioxidant capacity.
Red capsaicinoids were more (up to 2.2 times) when compared to yellow ones except in one variety (local toom).
ASTA colour values varied widely from 3 to 106 among the varieties. It appears that there is a negative correlation between colour values and pungency.
Some of the varieties possessed high vitamin C content (179 mg/100 g FW)
Three distinct groups have appeared in PCA analysis indicating their similarity. PCA biplot indicates that values of all the parameters are positively correlated to each other except colour value.
Heirarchical clustering indicated that andaman collection is chemically different from all other varieties.<br>