/
Interannual variability of aerosols in the UTLS and its Connection to the climate variability, Interannual variability of aerosols in the UTLS and its Connection to the climate variability,

Interannual variability of aerosols in the UTLS and its Connection to the climate variability, - PowerPoint Presentation

jones
jones . @jones
Follow
64 views
Uploaded On 2024-01-29

Interannual variability of aerosols in the UTLS and its Connection to the climate variability, - PPT Presentation

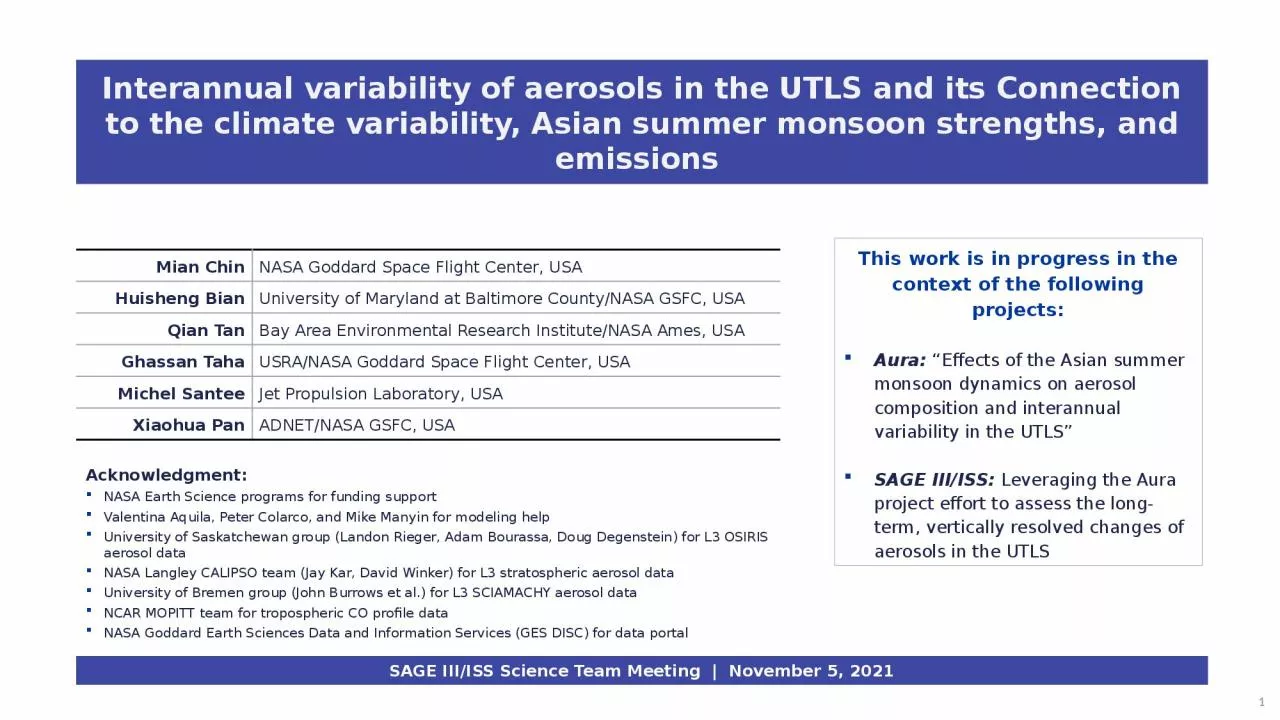
1 Mian Chin NASA Goddard Space Flight Center USA Huisheng Bian University of Maryland at Baltimore CountyNASA GSFC USA Qian Tan Bay Area Environmental Research InstituteNASA Ames USA Ghassan Taha ID: 1043085

summer aerosol transport monsoon aerosol summer monsoon transport utls data satellite asian model geos tropopause co50 convective variability iii

Share:

Link:

Embed:

Download Presentation from below link

Download Presentation The PPT/PDF document "Interannual variability of aerosols in t..." is the property of its rightful owner. Permission is granted to download and print the materials on this web site for personal, non-commercial use only, and to display it on your personal computer provided you do not modify the materials and that you retain all copyright notices contained in the materials. By downloading content from our website, you accept the terms of this agreement.


Presentation Transcript

1. Interannual variability of aerosols in the UTLS and its Connection to the climate variability, Asian summer monsoon strengths, and emissions 1Mian ChinNASA Goddard Space Flight Center, USAHuisheng BianUniversity of Maryland at Baltimore County/NASA GSFC, USAQian TanBay Area Environmental Research Institute/NASA Ames, USAGhassan TahaUSRA/NASA Goddard Space Flight Center, USAMichel SanteeJet Propulsion Laboratory, USAXiaohua PanADNET/NASA GSFC, USAAcknowledgment: NASA Earth Science programs for funding supportValentina Aquila, Peter Colarco, and Mike Manyin for modeling helpUniversity of Saskatchewan group (Landon Rieger, Adam Bourassa, Doug Degenstein) for L3 OSIRIS aerosol dataNASA Langley CALIPSO team (Jay Kar, David Winker) for L3 stratospheric aerosol dataUniversity of Bremen group (John Burrows et al.) for L3 SCIAMACHY aerosol dataNCAR MOPITT team for tropospheric CO profile dataNASA Goddard Earth Sciences Data and Information Services (GES DISC) for data portalSAGE III/ISS Science Team Meeting | November 5, 2021This work is in progress in the context of the following projects:Aura: “Effects of the Asian summer monsoon dynamics on aerosol composition and interannual variability in the UTLS”SAGE III/ISS: Leveraging the Aura project effort to assess the long-term, vertically resolved changes of aerosols in the UTLS

2. UTLS is a crucial region for Earth’s climate, and the human activities have greatly modified the composition in the UTLS2Major sources of UTLS aerosols:Summer monsoon convective transport of anthropogenic aerosols from the PBL to UTLSDirect injection of volcanic and pyroCb biomass burning aerosols into the UTLSPhotochemical production from precursor gases (e.g., SO2, VOC, OCS) in the UTLSVolcanic eruptionMonsoon convective transport of pollutionPhotochemical production

3. The Asian summer monsoon dynamic system coupled with other atmospheric circulation patterns to transport pollutants from the most polluted regions to UTLS over Asian summer monsoon area and beyond3The Asian summer monsoon convective system featuresA low-level cyclonic flow over South and East AsiaA persistent deep convective motionA strong upper-level anticyclonic circulationSub-seasonal eddy shedding to the east and westIt connects to large-scale walker cell and Hadley cell circulations[ Figure adapted from CLIVAR, https://www.clivar.org/asian-australian-monsoon] Population density 2000Fossil fuel + biofuel BC+OC emission 2010Fossil fuel + biofuel CO emission 2010(Anthro emission source: Community Emissions Data System (CEDS), Hoesly et al., 2018)

4. Satellite data showing evidence of pollutants hot spots near the tropopause over the ASM areaGEOS simulation showing the dynamic features of convective uplifting, westward and eastward spreading in the UT by jets and eddy shedding, and penetrating the tropopause (20180701-20180831)

5. 5SCIAMACHY v1.4OMPS LP v2CALIOP strat v1.0OSIRIS-usask v7GEOS totalGEOS volcanicGEOS troposphericGEOS OCS oxidationZonal mean aerosol extinction ~550nm (Mm-1), 10-30N, from satellite observations and GEOS simulations, 2002-2018Near tropopause: max every boreal summerNear tropopause: max every boreal summerLack of near tropopause feature of seasonal cycle

6. This work uses the NASA GEOS model and satellite observations to investigate:Interannual variability of aerosol in the UTLS over the Asian Summer Monsoon regionThe connections between pollutants in the UTLS and Asian summer monsoon strengths6

7. GEOS model simulationsModel simulation: 2002-2018GOCART aerosol component, driven by the MERRA2 reanalyzed meteorologySpatial resolution: 1°longitude x 1°latitude, 72 vertical levels from surface to 0.01 hPaSpecies: BC, OA, NH4+, NO3-, SO42-, dust, sea salt, COTransport tracer: Prescribed CO source and 50-day lifetime (CO50) to diagnose interannual variability of transportEmission:Anthropogenic emissions: Community Emission Data System (CEDS)Biomass burning emissions: Global Fire Emission Dataset (GFED) version 4.1sVolcanic emission: Satellite-based estimate (Carn et al., 2015, 2016)Dust, sea salt, biogenic: model-calculated from meteorological variables (winds, surface conditions)Stratospheric background aerosols: from carbonyl sulfide (OCS) oxidation7

8. Aerosol extinction composition in UTLS over the ASMA region (15-45°N, 10-130°E)819.5 km (obs)70hPa (GEOS)16.5 km (obs)100hPa (GEOS)12.5 km (obs)200hPa (GEOS)In boreal summer over the Asian Summer Monsoon Anticyclone (ASMA), aerosol extinction in the UT and at the tropopause is dominated by aerosol with tropospheric origin, mostly OA, followed by nitrateRelatively large volcanic eruptions causing significant disturbance of stratospheric composition, but the effects are not long-lastingIn the lower stratosphere (~20km), seasonal cycle diminished with sulfate aerosol from OCS oxidation as the dominate aerosol sourceThere are clear differences between satellite data and model and among different satellite datasets (will discuss later)OSIRISOANO3-SO4= (Trop)DUSO4= (bkgd)OMPS-LPSO4= (Volc)CALIOPOSIRISOANO3-SO4= (Trop)DUSO4= (bkgd)OMPS-LPSO4= (Volc)CALIOPOSIRISOANO3-SO4= (Trop)DUSO4= (bkgd)OMPS-LPSO4= (Volc)CALIOPUTTrop pause(TP)LSQ: How to explain the interannual variability/trend of the non-volcanic aerosol in ASMA region in terms of transport, removal, emissions, and chemistry?Altitudes

9. CO50 as a transport tracerCO50 is a transport tracer with a prescribed CO sources (with monthly resolution, same for every year) and a 50-day lifetimeIt is a very helpful transport tracer to diagnose differences in transport characteristics because of fixed sources and lifetimeInter-model version differences Inter-time differences (e.g., August 2012 vs. August 2015)Inter-model differences (e.g., AeroCom or CCMI multi-model intercomparison)The advantage of using CO50 as a transport tracer is that the transport characteristics / patterns can be compared with observations, even though not necessarily the absolute values9

10. Similarities and contrasts between vertical profiles of CO50 tracer and MOPITT CO and between Aug 2012 and Aug 201510GEOS CO50 tracerMOPITT COGEOS CO50August 2012, lon-prs 15-40NAugust 2015, lon-prs 15-40NAugust 2015 minus August 2012GEOS and MOPITT showing strong convective transport patterns over the Asian summer monsoon and North American summer monsoon systemsGEOS shows that the convective transport over Asia is weaker in summer 2015 than in summer 2012, but the horizontal outflow from Asia to the Pacific seems stronger. MOPITT reveal some similar features

11. Transport-induced interannual variability in ASMA region, 2005-2018: CO50 anomaly in UT & tropopause vs. Asian Summer Monsoon Indices11UTTPIn UT (200 hPa): CO50 well correlated with both EASMI and SASMI: stronger summer monsoon pushes more pollutants to UTNear TP (100 hPa): Correlation between CO50 and ASMI weakensCO from satellite data showing similar patternsSASMI (J. Li)EASMI (J. Li)CO anom.

12. Assessing long-term, vertically resolved changes of aerosol composition in the upper troposphere and lower stratosphere using SAGE III/ISS and other satellite data and a global model 12SAGE III/ISS project: PI:Co-I:Collaborator:Mian Chin1 Huisheng Bian1,2, Qian Tan3,4, Ghassan Taha1,5Xiaohua Pan1,6, Peter Colarco11NASA GSFC 2UMBC 3NASA ARC 4BAER 5USRALeveraging our effort of the current Aura project on UTLS aerosol process and composition, our goal here is to analyze the long-term aerosol trends in the UTLS using SAGE and other satellite data with the GEOS model

13. SAGE III/ISS UTLS aerosol extinction (1020 nm) in Jul-Aug13Gridded SAGE III/ISS data and plots by Ghassan TahaLarge perturbations of UTLS aerosol by volcanic eruptions and pyroCb in the SAGE III/ISS record, masking the anthropogenic signatures in the UTLSAmbaeRaikokeAustralian pyroCb

14. A few remarksNext steps:Work with SAGE data to place them into the context of multi-decadal trendsEvaluate GEOS simulated aerosol composition in the ASM region with aircraft data (StratoClim-2017, ACCLIP-2022)Challenges of using satellite aerosol data in the UTLS:The anthropogenic fingerprints could be difficult to quantify because of the ice cloud interference in the UT and near the tropopause. Cloud-screening approach is one of the major causes for large disagreement among satellite products. How to mitigate?More frequent pyroCb events in recent years that have long-lasting effects in the stratosphere, making the extraction of tropospheric influence more difficultSpatial/temporal sampling differences / biases in satellite data14