Global Precipitation Means and Variations with the New Version of GPCP Robert Adler1, Guojun Gu1, George Huffman2, Ali Behrangi3, David Bolvin2, Jian-Jian Wang1, Eric Nelkin2 1U. of Maryland, 2NASAGoddard, 3U. of Arizona Global
"Global Precipitation Means and Variations with the" is the property of its rightful owner. Permission is granted to
download and print the materials on this website for personal, non-commercial use only, and to display it
on your personal computer provided you do not modify the materials and that you retain all copyright
notices contained in the materials. By downloading content from our website, you accept the terms of this
agreement.
Presentation Transcript
01
Global Precipitation Means and Variations with the New Version of GPCP
Robert Adler1, Guojun Gu1, George Huffman2, Ali Behrangi3, David Bolvin2, Jian-Jian Wang1, Eric Nelkin2
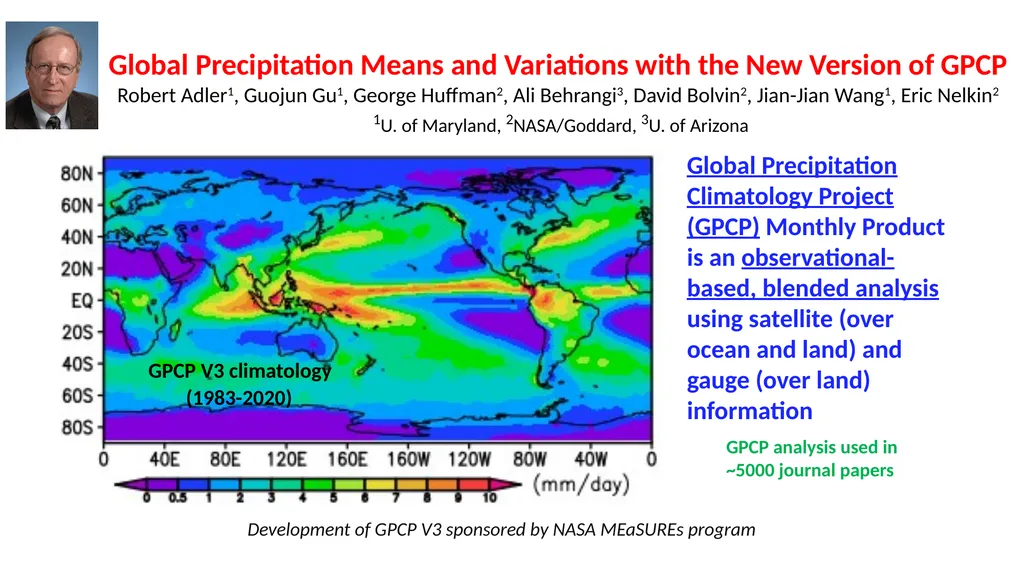
1U. of Maryland, 2NASA/Goddard, 3U. of Arizona Global Precipitation Climatology Project (GPCP) Monthly Product is an observational-based, blended analysis using satellite (over ocean and land) and gauge (over land) information GPCP analysis used in ~5000 journal papers GPCP V3 climatology
(1983-2020) Development of GPCP V3 sponsored by NASA MEaSUREs program<br>
02
Version 3.2 of the Global Precipitation Climatology Project (GPCP) Monthly Analysis (1983-2019) Key Features • Finer spatial resolution (0.5º latitude/longitude)
• Updated satellite algorithms, including GPROF applied to SSMI and SSMIS, but adjusted by V2 PMW algorithm (METH) for consistency
• Latest gauge analysis over land from the Global Precipitation Climatology Center (GPCC) in Germany
• Improved high-latitude analysis with improved satellite analysis and modified wind-loss gauge adjustments
• Fraction of frozen precipitation estimated from reanalysis surface temperature/moisture information (post-1992)
• Ocean estimates adjusted using climatologies from the Tropical Rainfall Measuring Mission (TRMM), the Global Precipitation Measurement (GPM) mission and CloudSat. “Old” GPCP V2.3 will continue (for a while) and is compared to V3.2 in this talk
V2 is part of NOAA’s Climate Data Record (CDR) program [Available from Goddard Disc]<br>
03
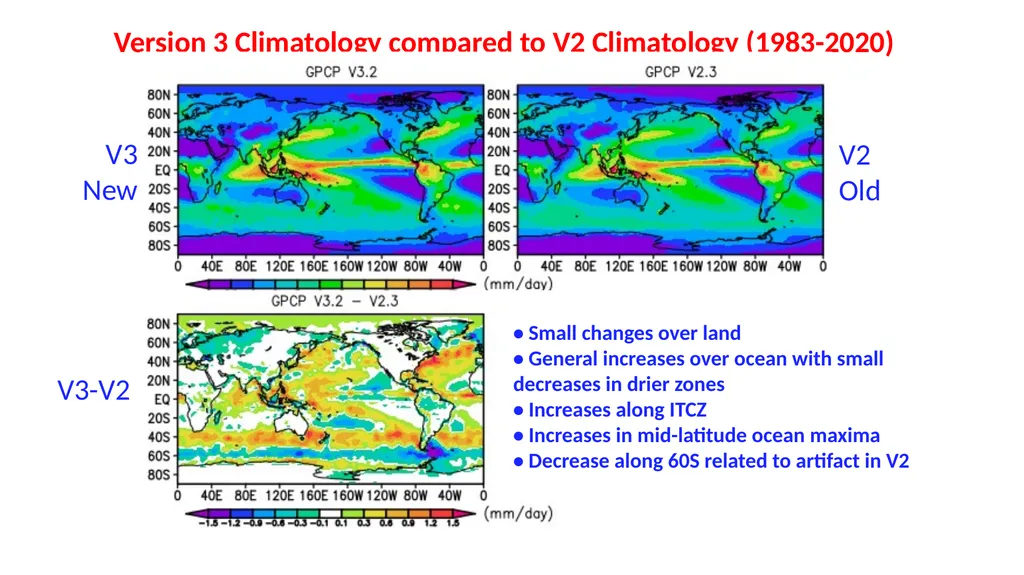
Version 3 Climatology compared to V2 Climatology (1983-2020) V3
New V2
Old V3-V2 • Small changes over land
• General increases over ocean with small decreases in drier zones
• Increases along ITCZ
• Increases in mid-latitude ocean maxima
• Decrease along 60S related to artifact in V2<br>
04
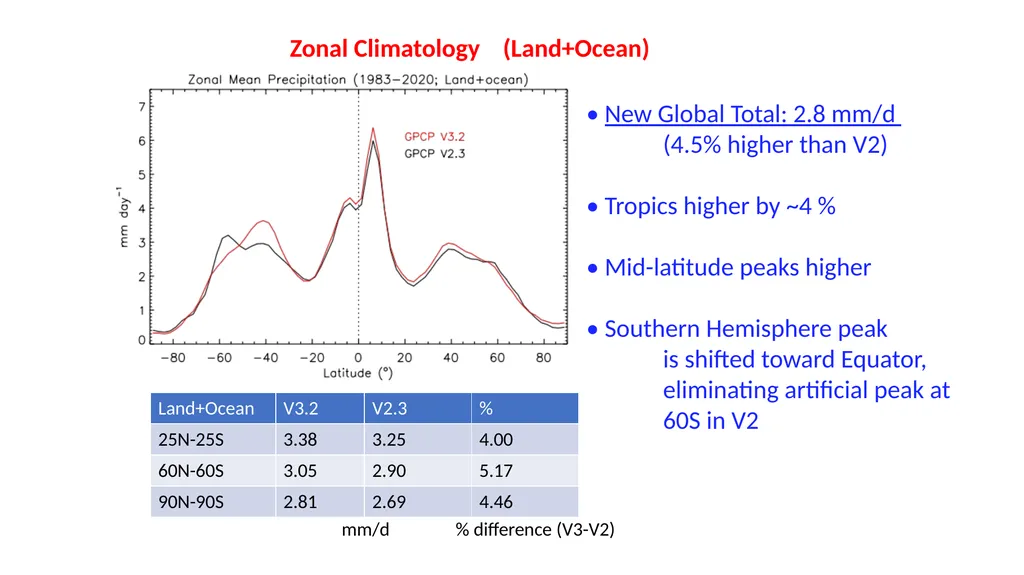
Zonal Climatology (Land+Ocean) mm/d % difference (V3-V2) • New Global Total: 2.8 mm/d (4.5% higher than V2)
• Tropics higher by ~4 %
• Mid-latitude peaks higher
• Southern Hemisphere peak is shifted toward Equator, eliminating artificial peak at 60S in V2<br>
05
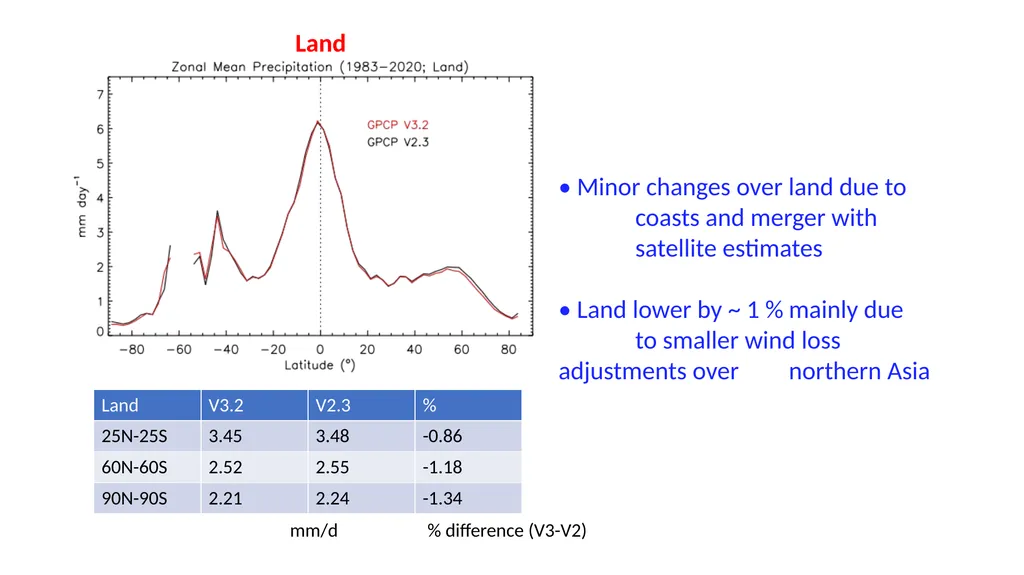
Land mm/d % difference (V3-V2) • Minor changes over land due to coasts and merger with satellite estimates
• Land lower by ~ 1 % mainly due to smaller wind loss adjustments over northern Asia<br>
06
Ocean mm/d % difference
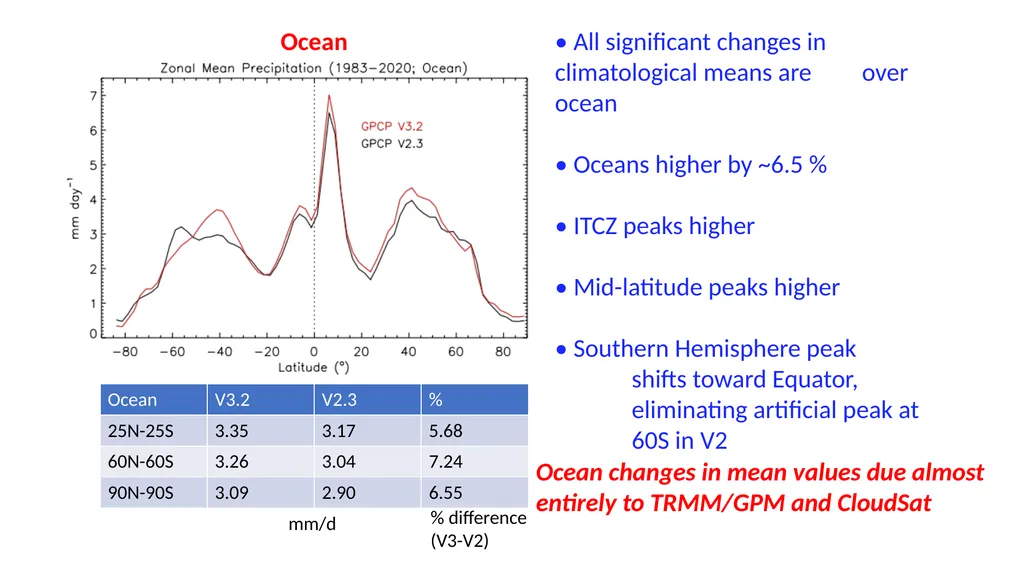
(V3-V2) • All significant changes in climatological means are over ocean
• Oceans higher by ~6.5 %
• ITCZ peaks higher
• Mid-latitude peaks higher
• Southern Hemisphere peak shifts toward Equator, eliminating artificial peak at 60S in V2 Ocean changes in mean values due almost entirely to TRMM/GPM and CloudSat<br>
07
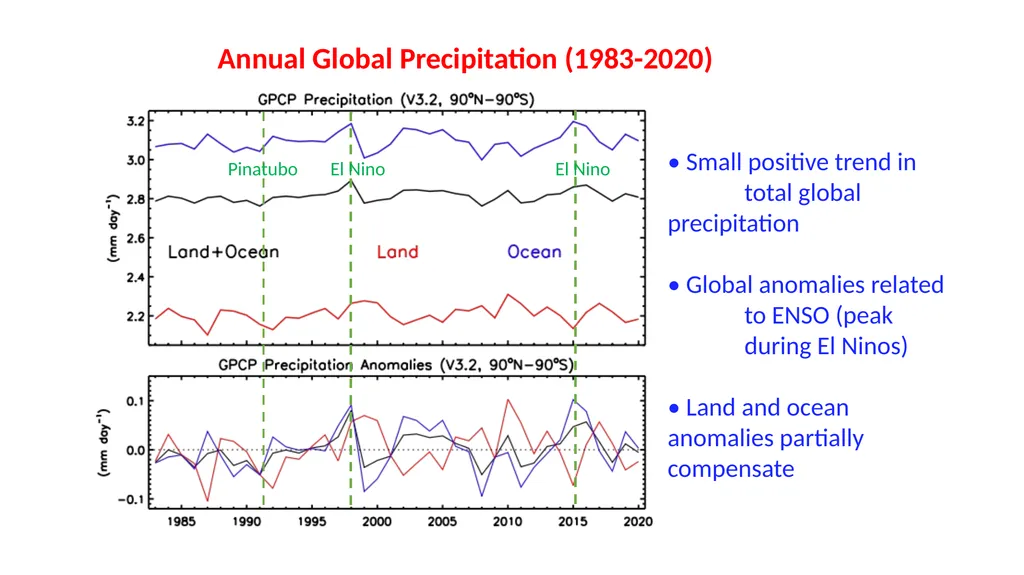
Annual Global Precipitation (1983-2020) • Small positive trend in total global precipitation
• Global anomalies related to ENSO (peak during El Ninos)
• Land and ocean anomalies partially compensate Pinatubo El Nino El Nino<br>
08
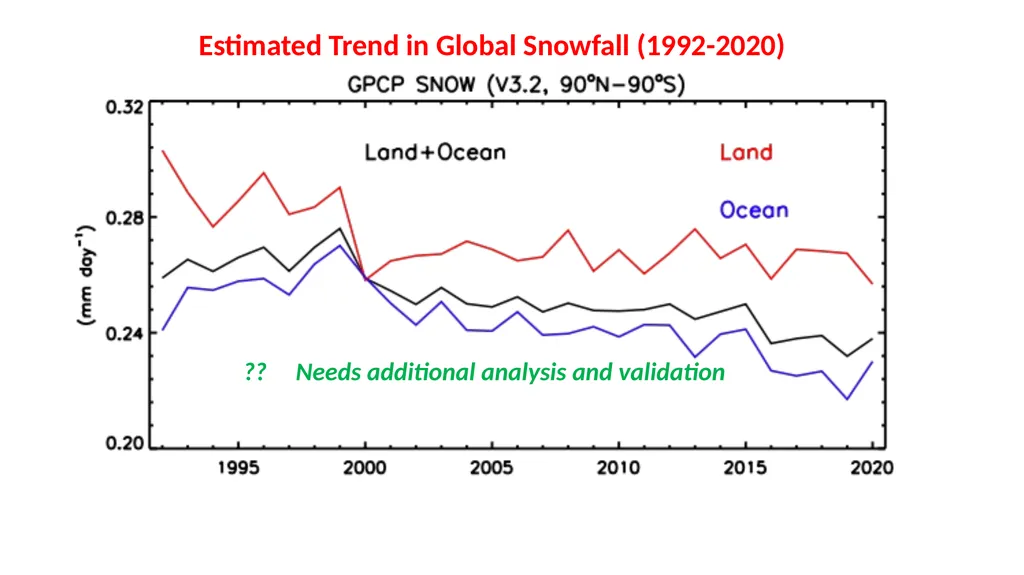
Estimated Trend in Global Snowfall (1992-2020) ?? Needs additional analysis and validation<br>
09
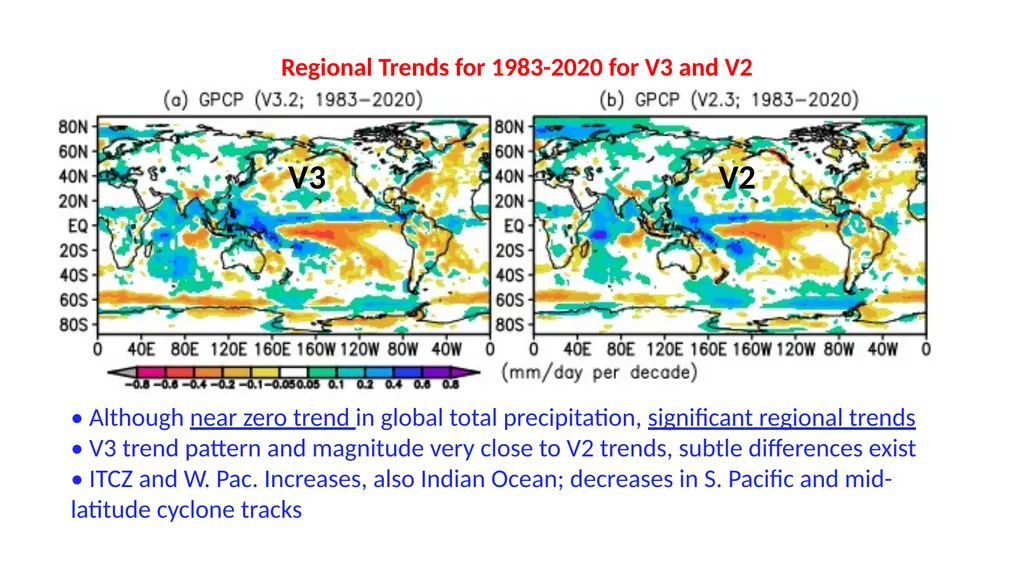
Regional Trends for 1983-2020 for V3 and V2 • Although near zero trend in global total precipitation, significant regional trends
• V3 trend pattern and magnitude very close to V2 trends, subtle differences exist
• ITCZ and W. Pac. Increases, also Indian Ocean; decreases in S. Pacific and mid- latitude cyclone tracks V3 V2<br>
10
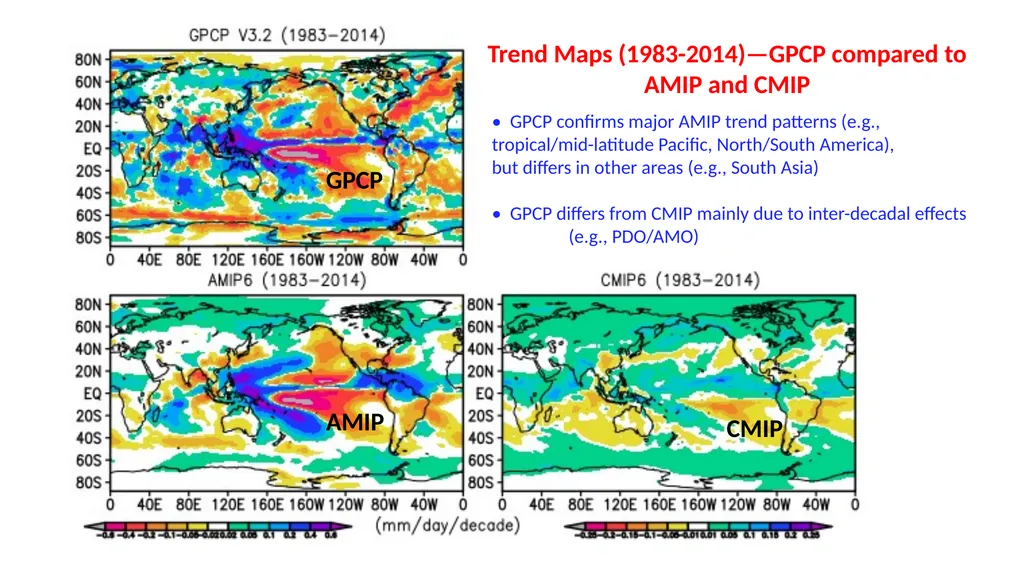
Trend Maps (1983-2014)—GPCP compared to AMIP and CMIP • GPCP confirms major AMIP trend patterns (e.g., tropical/mid-latitude Pacific, North/South America), but differs in other areas (e.g., South Asia)
• GPCP differs from CMIP mainly due to inter-decadal effects (e.g., PDO/AMO) GPCP AMIP CMIP<br>
11
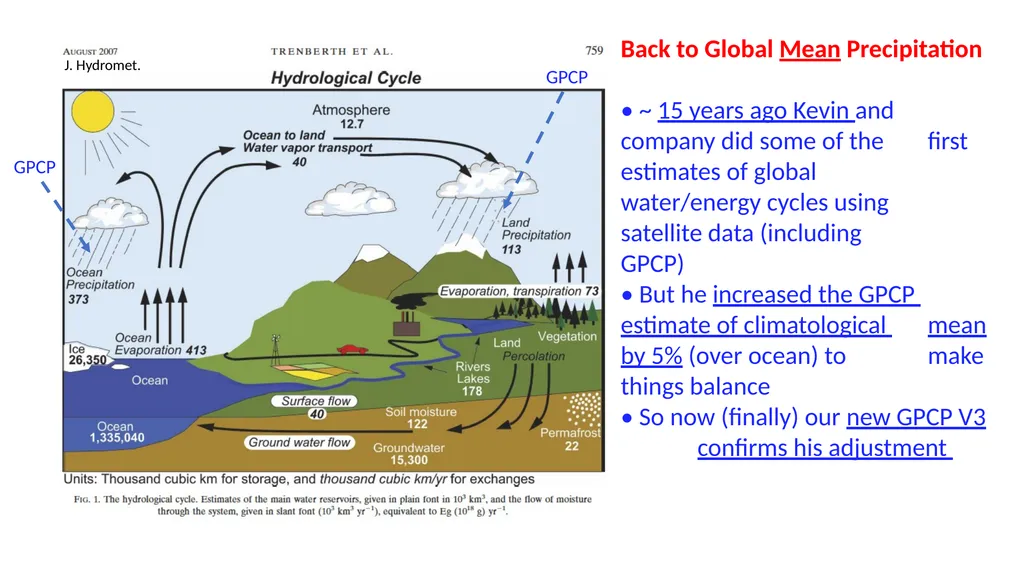
Back to Global Mean Precipitation
• ~ 15 years ago Kevin and company did some of the first estimates of global water/energy cycles using satellite data (including GPCP)
• But he increased the GPCP estimate of climatological mean by 5% (over ocean) to make things balance
• So now (finally) our new GPCP V3 confirms his adjustment GPCP GPCP J. Hydromet.<br>
12
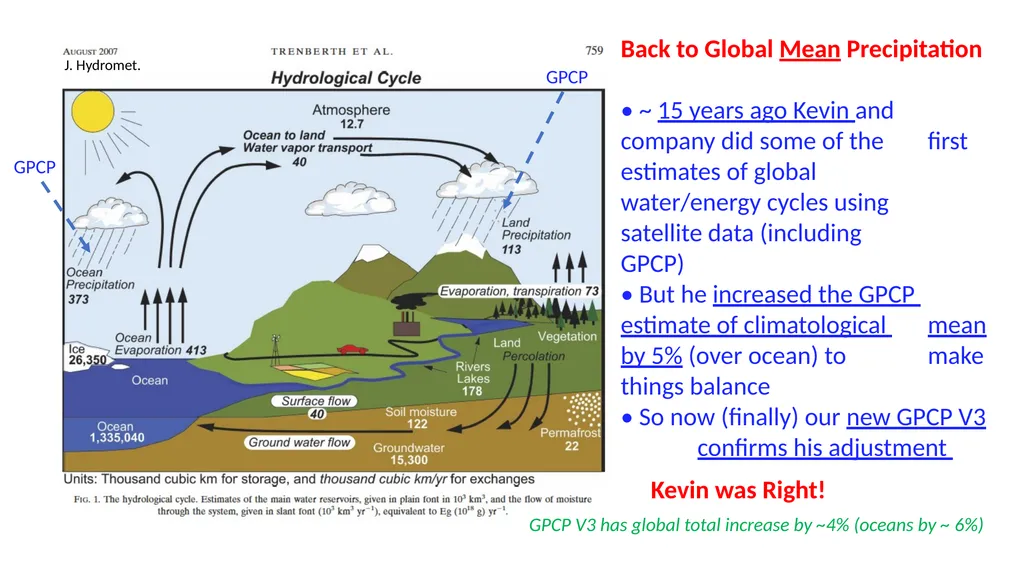
Back to Global Mean Precipitation
• ~ 15 years ago Kevin and company did some of the first estimates of global water/energy cycles using satellite data (including GPCP)
• But he increased the GPCP estimate of climatological mean by 5% (over ocean) to make things balance
• So now (finally) our new GPCP V3 confirms his adjustment GPCP GPCP J. Hydromet. Kevin was Right! GPCP V3 has global total increase by ~4% (oceans by ~ 6%)<br>