
Globalization Chapter 1 © 2021 McGraw Hill. All

Description: Globalization Chapter 1 2021 McGraw Hill. All rights reserved. Authorized only for instructor use in the classroom. No reproduction or further distribution permitted without the prior written consent of McGraw Hill. Learning Objectives
Related Topics
Download Presentation
"Globalization Chapter 1 © 2021 McGraw Hill. All" is the property of its rightful owner. Permission is granted to download and print the materials on this website for personal, non-commercial use only, and to display it on your personal computer provided you do not modify the materials and that you retain all copyright notices contained in the materials. By downloading content from our website, you accept the terms of this agreement.
Presentation Transcript
slide1. Globalization Chapter 1 © 2021 McGraw Hill. All rights reserved. Authorized only for instructor use in the classroom.
No reproduction or further distribution permitted without the prior written consent of McGraw Hill.<br>
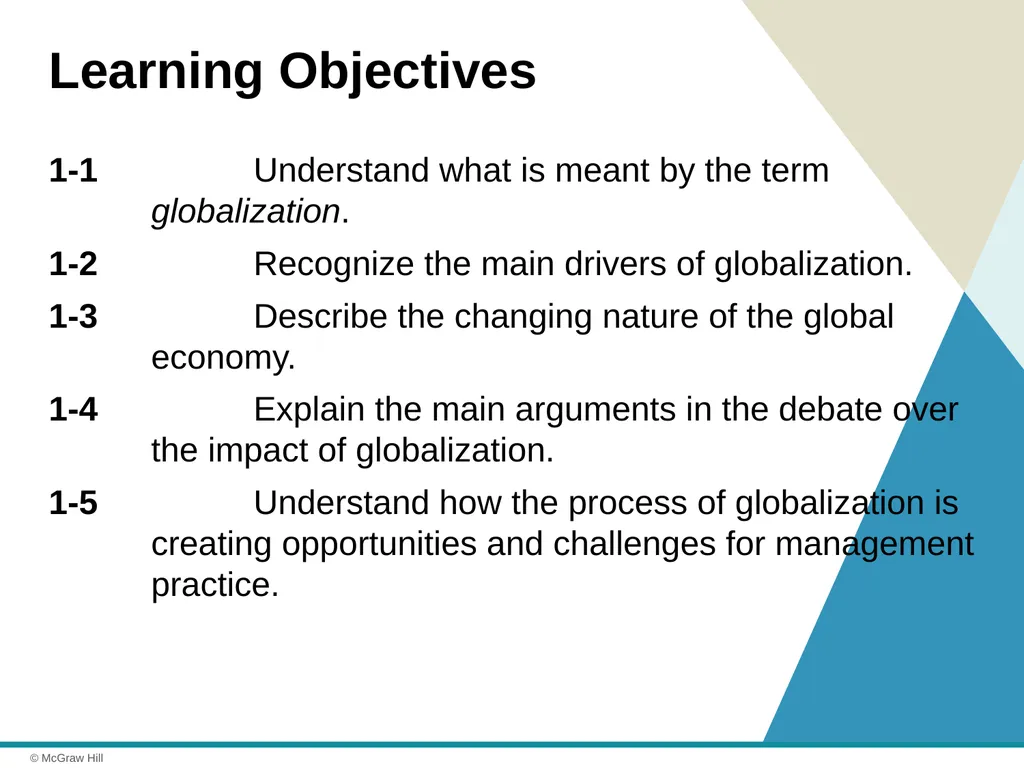
slide2. Learning Objectives 1-1 Understand what is meant by the term globalization.
1-2 Recognize the main drivers of globalization.
1-3 Describe the changing nature of the global economy.
1-4 Explain the main arguments in the debate over the impact of globalization.
1-5 Understand how the process of globalization is creating opportunities and challenges for management practice.<br>
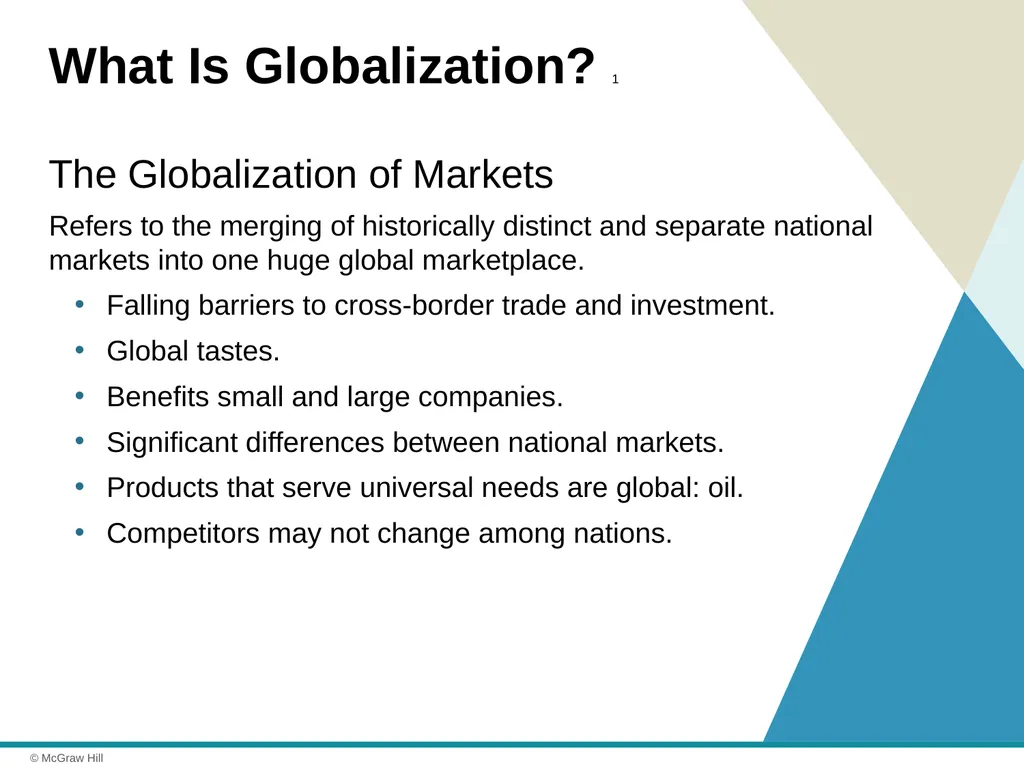
slide3. What Is Globalization? 1 The Globalization of Markets
Refers to the merging of historically distinct and separate national markets into one huge global marketplace.
Falling barriers to cross-border trade and investment.
Global tastes.
Benefits small and large companies.
Significant differences between national markets.
Products that serve universal needs are global: oil.
Competitors may not change among nations.<br>
slide4. What Is Globalization? 2 The Globalization of Production
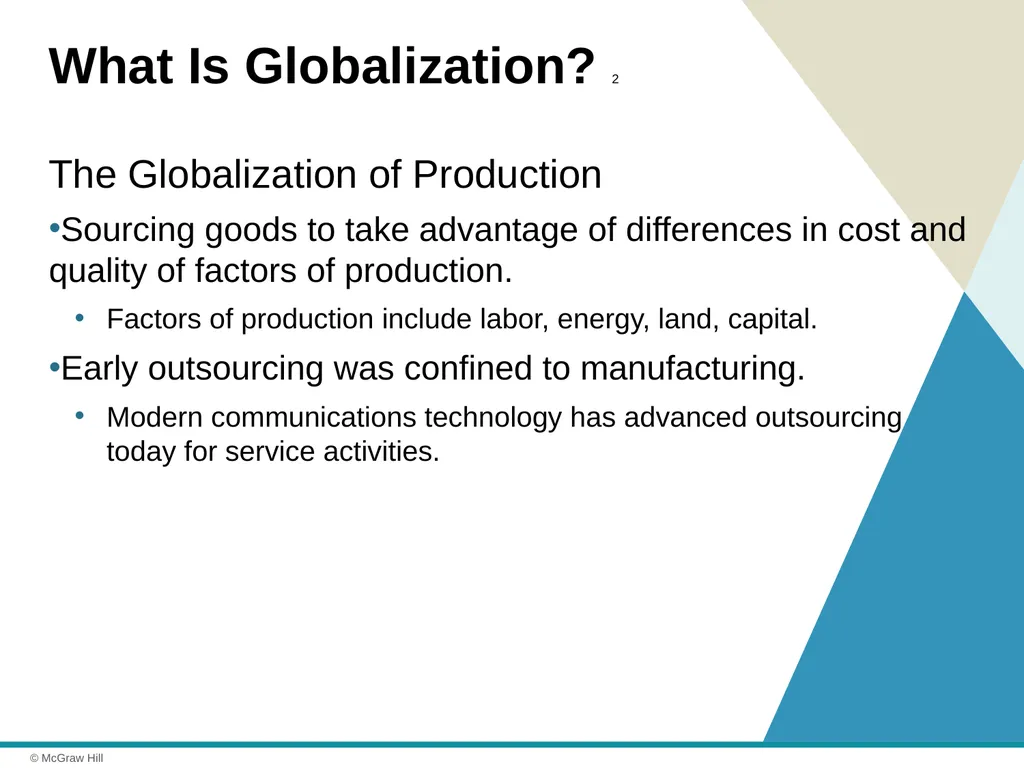
Sourcing goods to take advantage of differences in cost and quality of factors of production.
Factors of production include labor, energy, land, capital.
Early outsourcing was confined to manufacturing.
Modern communications technology has advanced outsourcing today for service activities.<br>
slide5. What Is Globalization? 3 The Globalization of Production continued
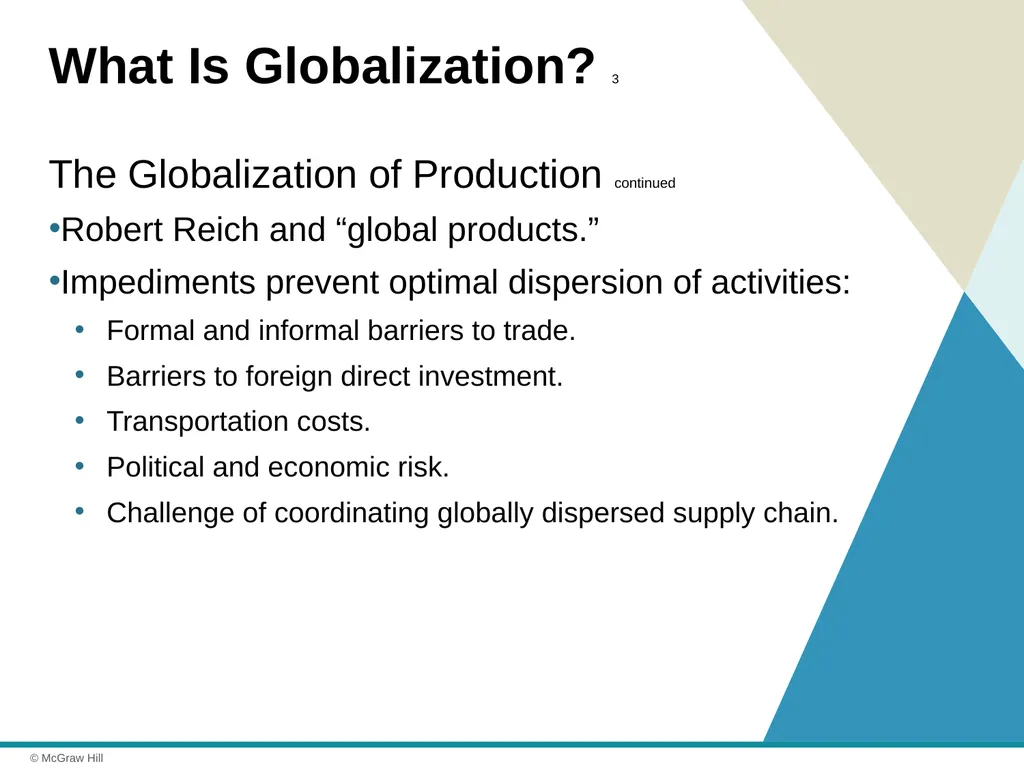
Robert Reich and “global products.”
Impediments prevent optimal dispersion of activities:
Formal and informal barriers to trade.
Barriers to foreign direct investment.
Transportation costs.
Political and economic risk.
Challenge of coordinating globally dispersed supply chain.<br>
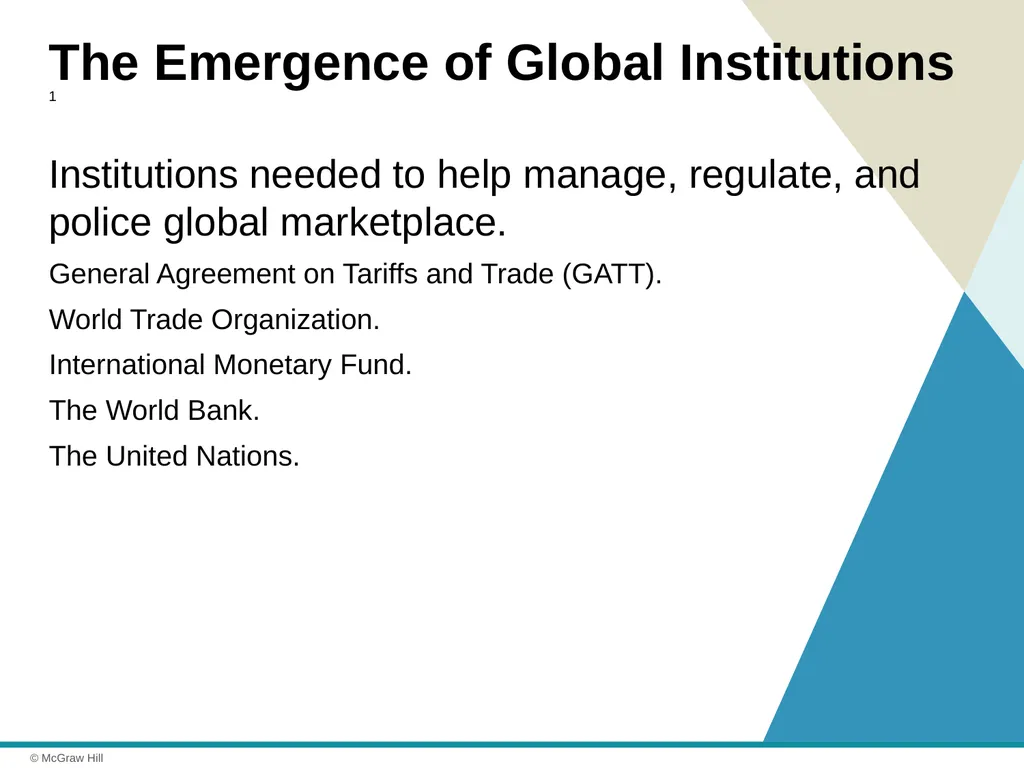
slide6. The Emergence of Global Institutions 1 Institutions needed to help manage, regulate, and police global marketplace.
General Agreement on Tariffs and Trade (GATT).
World Trade Organization.
International Monetary Fund.
The World Bank.
The United Nations.<br>
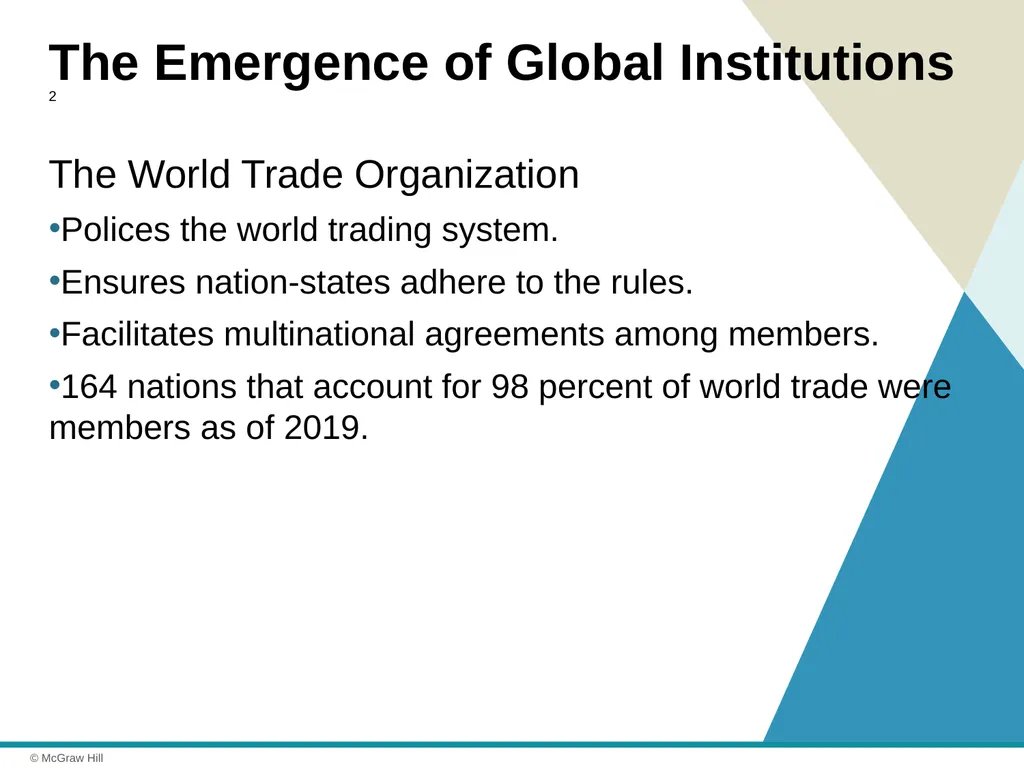
slide7. The Emergence of Global Institutions 2 The World Trade Organization
Polices the world trading system.
Ensures nation-states adhere to the rules.
Facilitates multinational agreements among members.
164 nations that account for 98 percent of world trade were members as of 2019.<br>
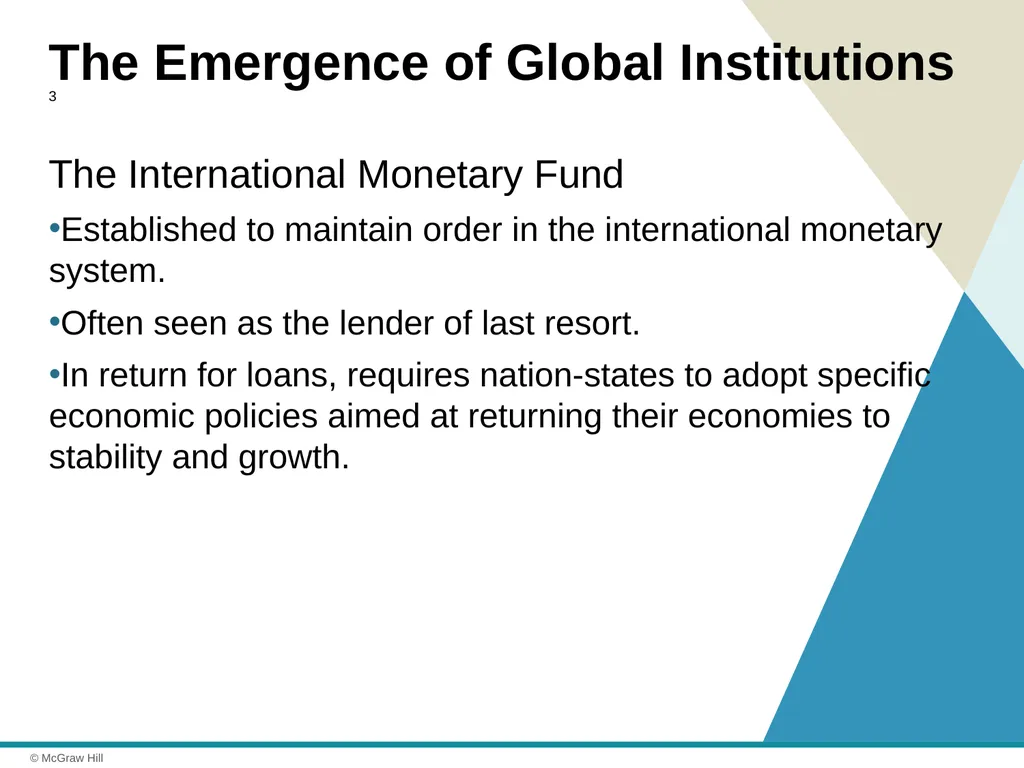
slide8. The Emergence of Global Institutions 3 The International Monetary Fund
Established to maintain order in the international monetary system.
Often seen as the lender of last resort.
In return for loans, requires nation-states to adopt specific economic policies aimed at returning their economies to stability and growth.<br>
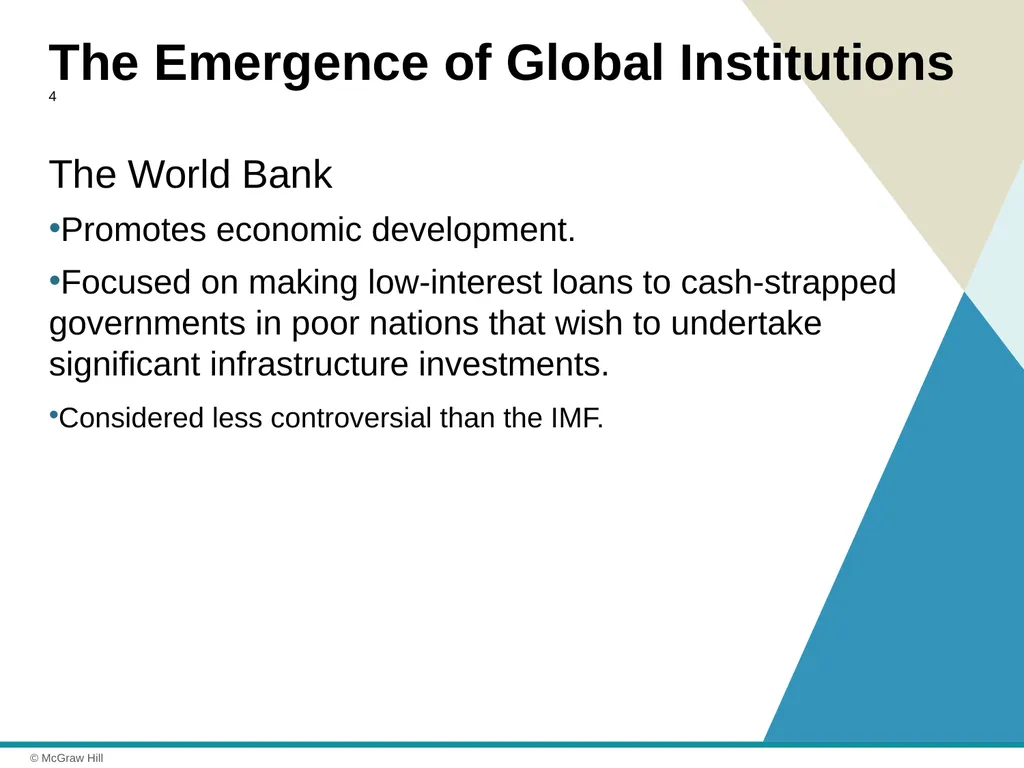
slide9. The Emergence of Global Institutions 4 The World Bank
Promotes economic development.
Focused on making low-interest loans to cash-strapped governments in poor nations that wish to undertake significant infrastructure investments.
Considered less controversial than the IMF.<br>
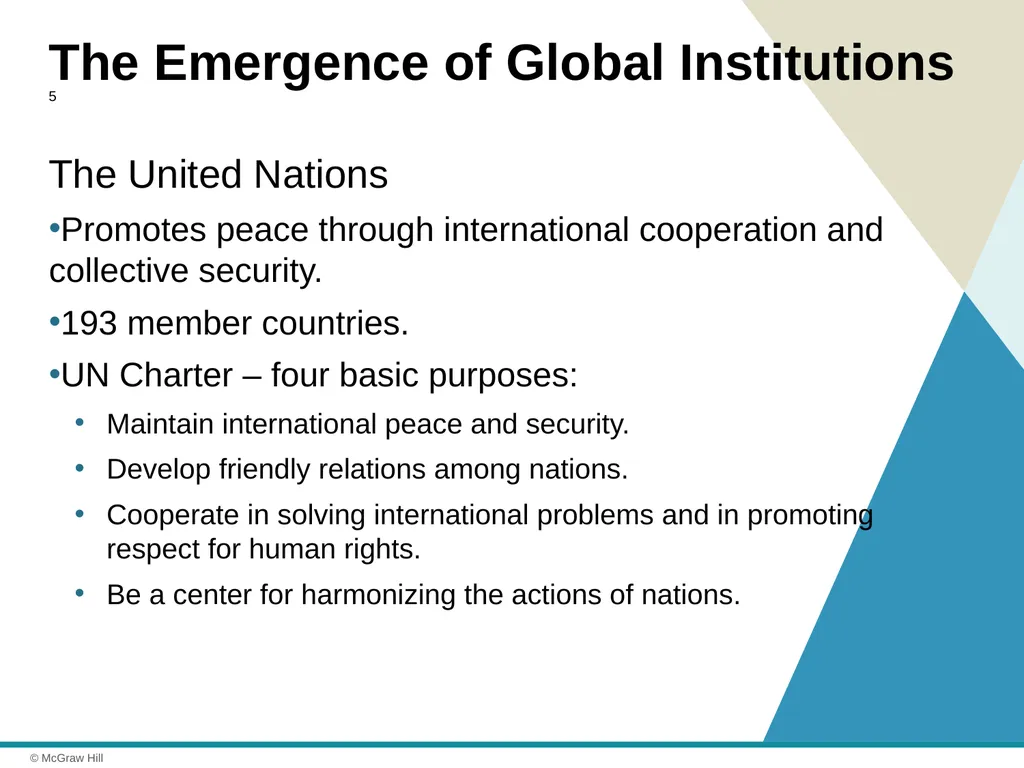
slide10. The Emergence of Global Institutions 5 The United Nations
Promotes peace through international cooperation and collective security.
193 member countries.
UN Charter – four basic purposes:
Maintain international peace and security.
Develop friendly relations among nations.
Cooperate in solving international problems and in promoting respect for human rights.
Be a center for harmonizing the actions of nations.<br>
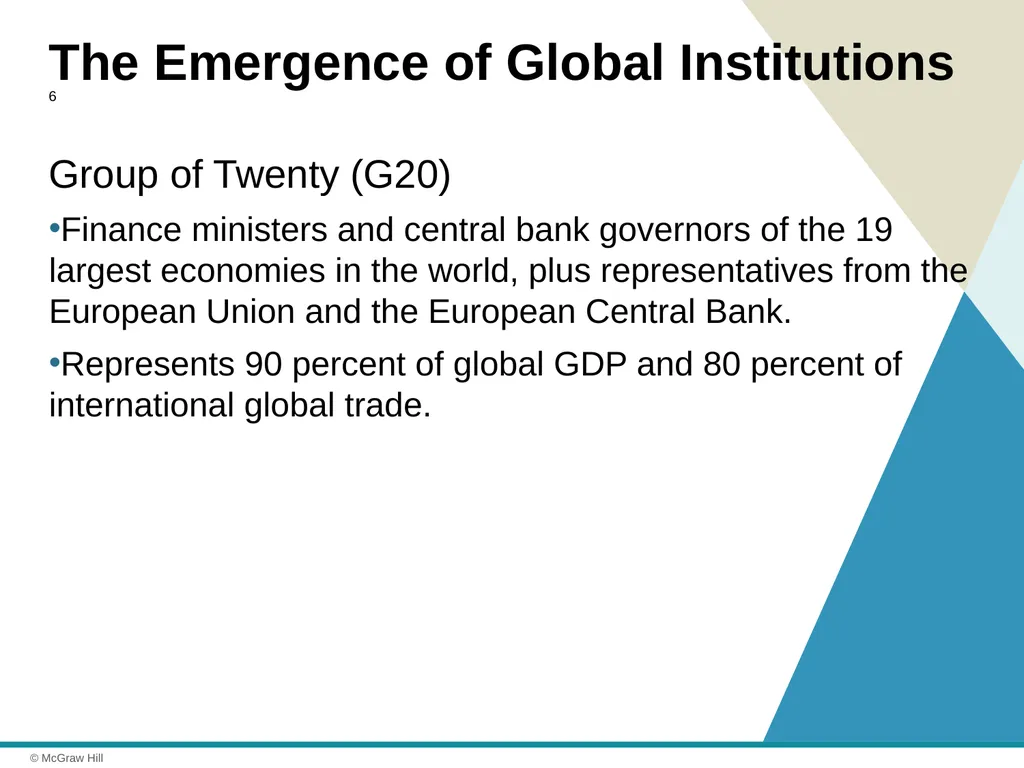
slide11. The Emergence of Global Institutions 6 Group of Twenty (G20)
Finance ministers and central bank governors of the 19 largest economies in the world, plus representatives from the European Union and the European Central Bank.
Represents 90 percent of global GDP and 80 percent of international global trade.<br>
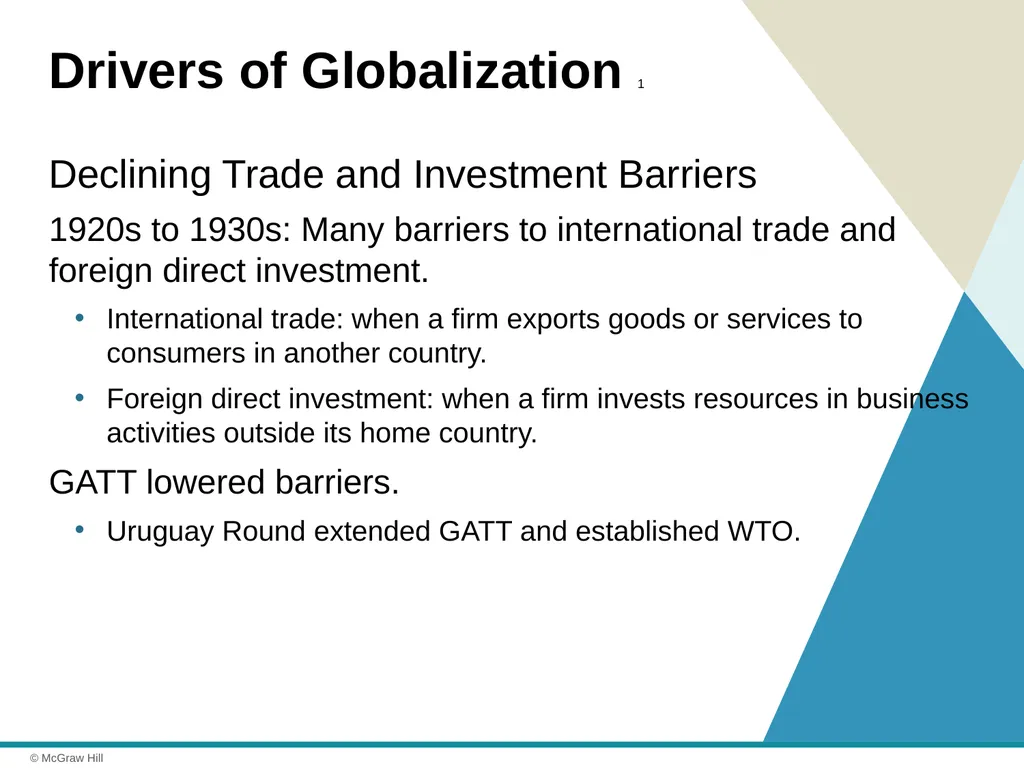
slide12. Drivers of Globalization 1 Declining Trade and Investment Barriers
1920s to 1930s: Many barriers to international trade and foreign direct investment.
International trade: when a firm exports goods or services to consumers in another country.
Foreign direct investment: when a firm invests resources in business activities outside its home country.
GATT lowered barriers.
Uruguay Round extended GATT and established WTO.<br>
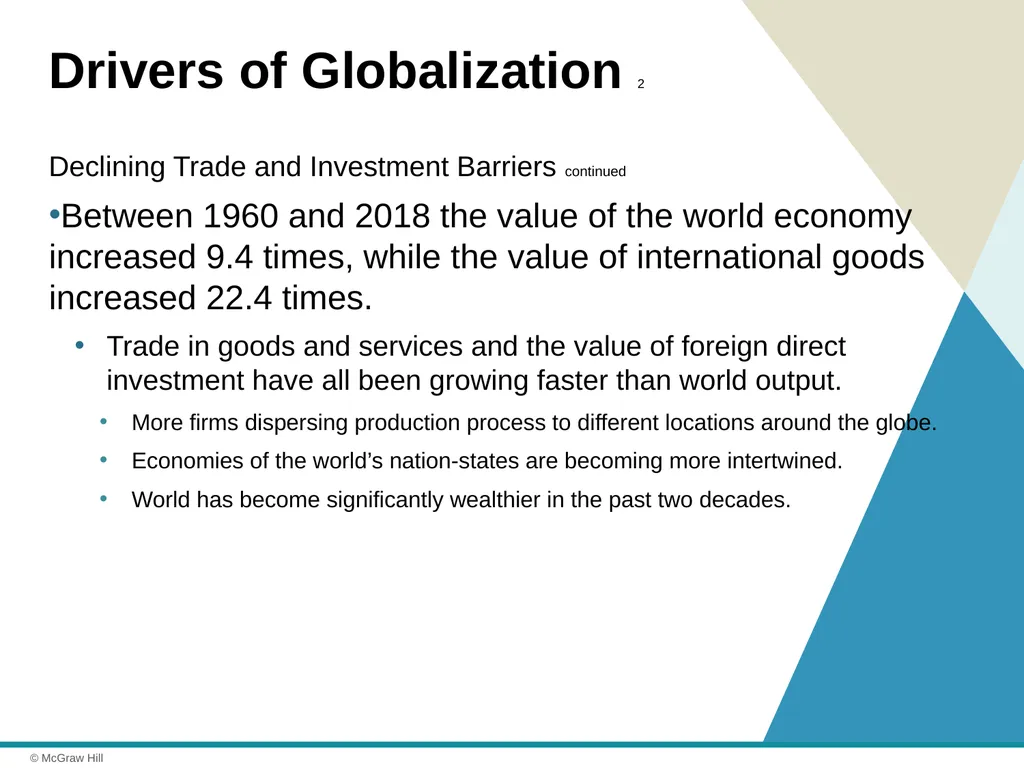
slide13. Drivers of Globalization 2 Declining Trade and Investment Barriers continued
Between 1960 and 2018 the value of the world economy increased 9.4 times, while the value of international goods increased 22.4 times.
Trade in goods and services and the value of foreign direct investment have all been growing faster than world output.
More firms dispersing production process to different locations around the globe.
Economies of the world’s nation-states are becoming more intertwined.
World has become significantly wealthier in the past two decades.<br>
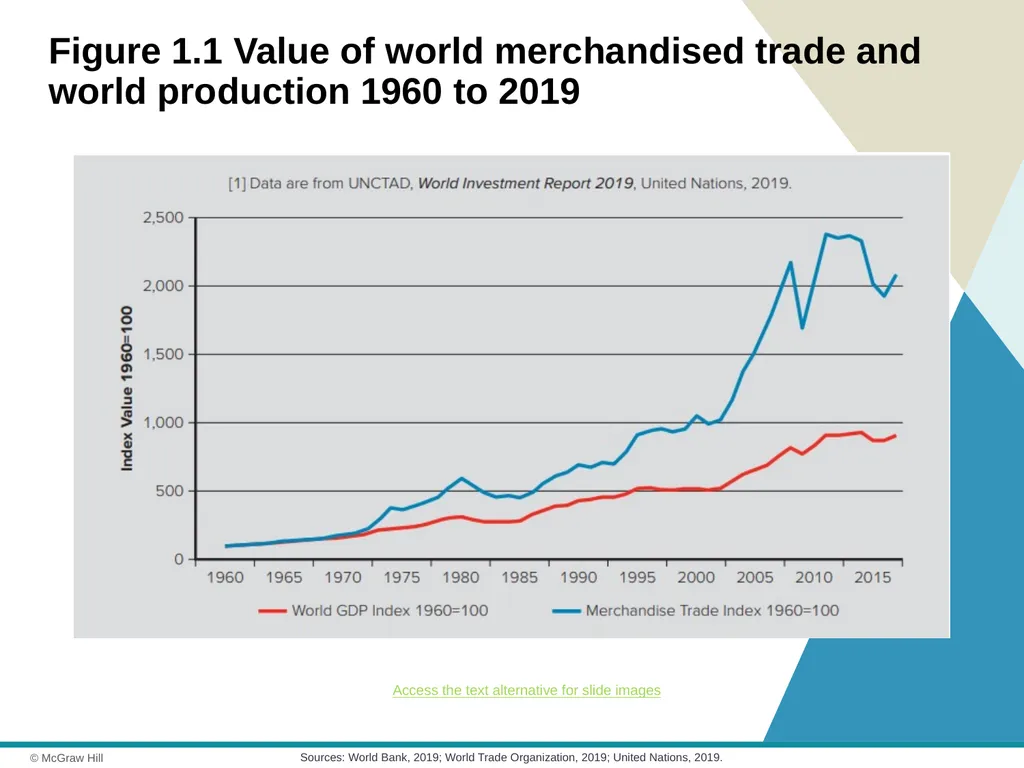
slide14. Figure 1.1 Value of world merchandised trade and world production 1960 to 2019 Sources: World Bank, 2019; World Trade Organization, 2019; United Nations, 2019. Access the text alternative for slide images<br>
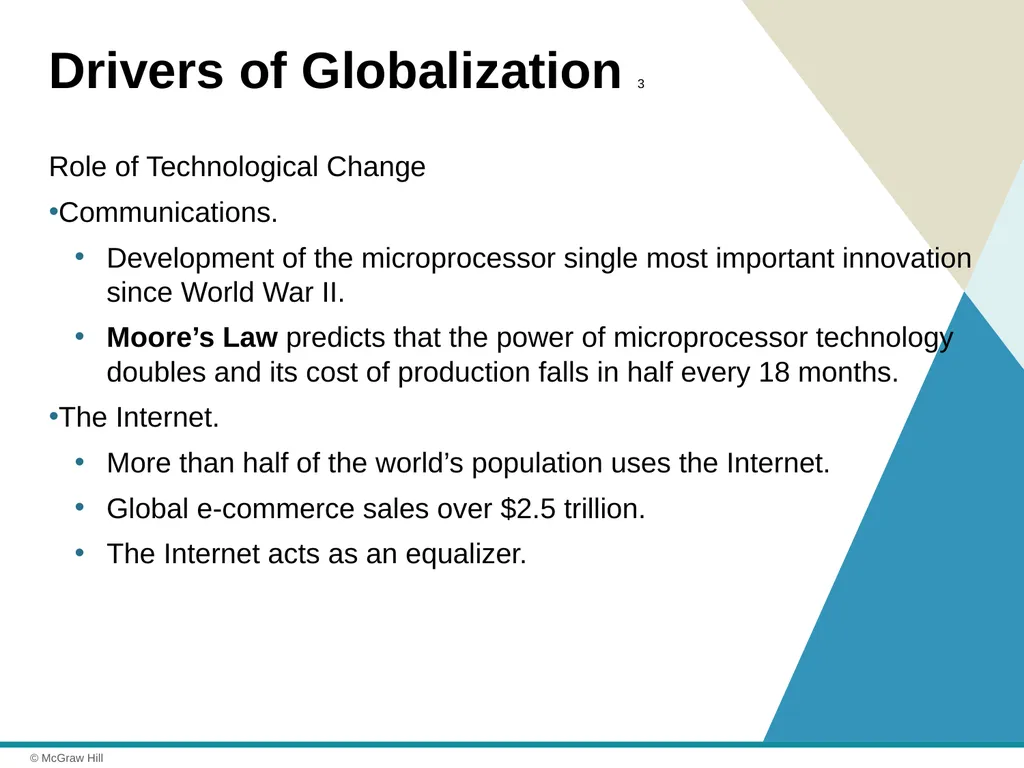
slide15. Drivers of Globalization 3 Role of Technological Change
Communications.
Development of the microprocessor single most important innovation since World War II.
Moore’s Law predicts that the power of microprocessor technology doubles and its cost of production falls in half every 18 months.
The Internet.
More than half of the world’s population uses the Internet.
Global e-commerce sales over $2.5 trillion.
The Internet acts as an equalizer.<br>
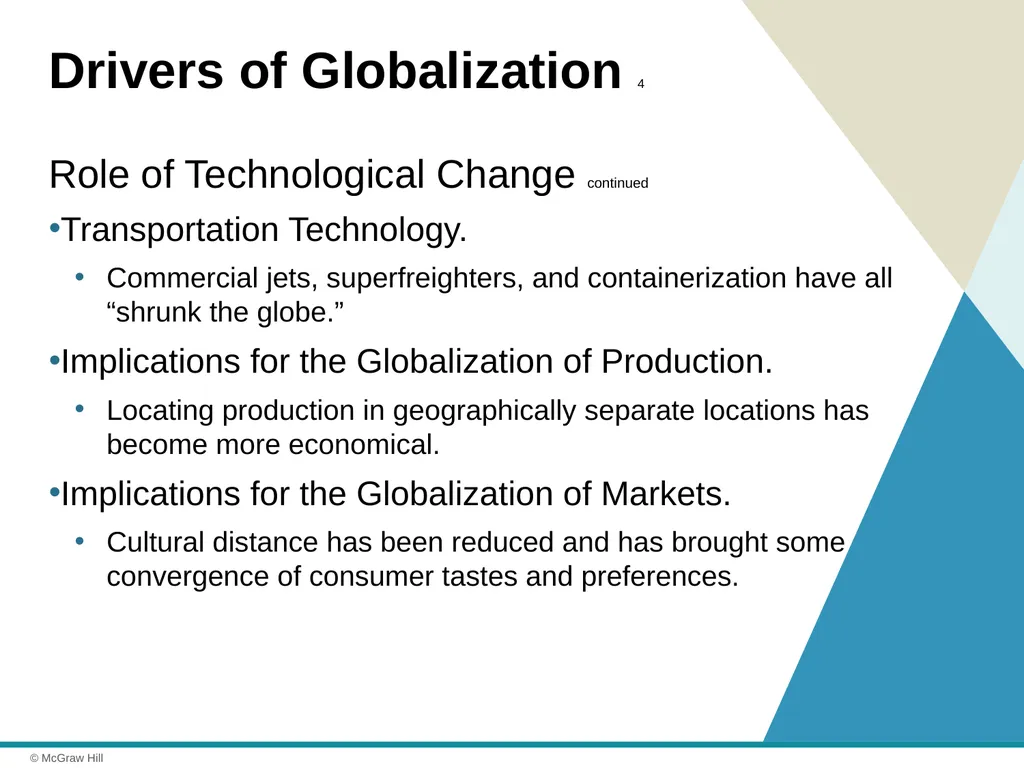
slide16. Drivers of Globalization 4 Role of Technological Change continued
Transportation Technology.
Commercial jets, superfreighters, and containerization have all “shrunk the globe.”
Implications for the Globalization of Production.
Locating production in geographically separate locations has become more economical.
Implications for the Globalization of Markets.
Cultural distance has been reduced and has brought some convergence of consumer tastes and preferences.<br>
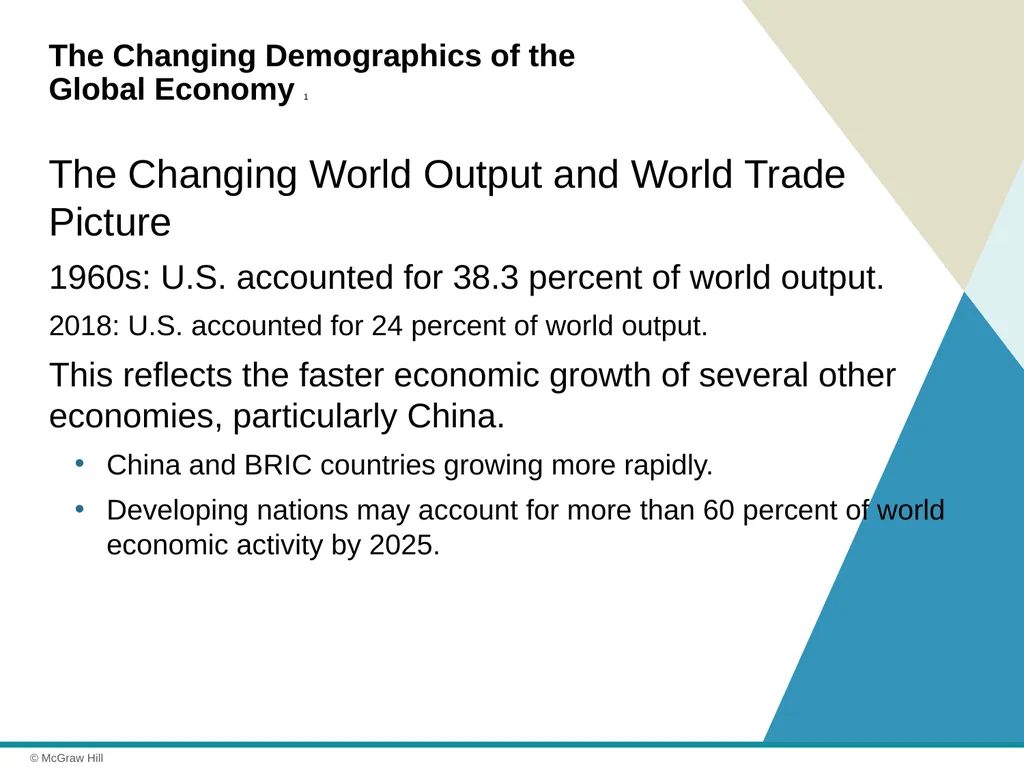
slide17. The Changing Demographics of the Global Economy 1 The Changing World Output and World Trade Picture
1960s: U.S. accounted for 38.3 percent of world output.
2018: U.S. accounted for 24 percent of world output.
This reflects the faster economic growth of several other economies, particularly China.
China and BRIC countries growing more rapidly.
Developing nations may account for more than 60 percent of world economic activity by 2025.<br>
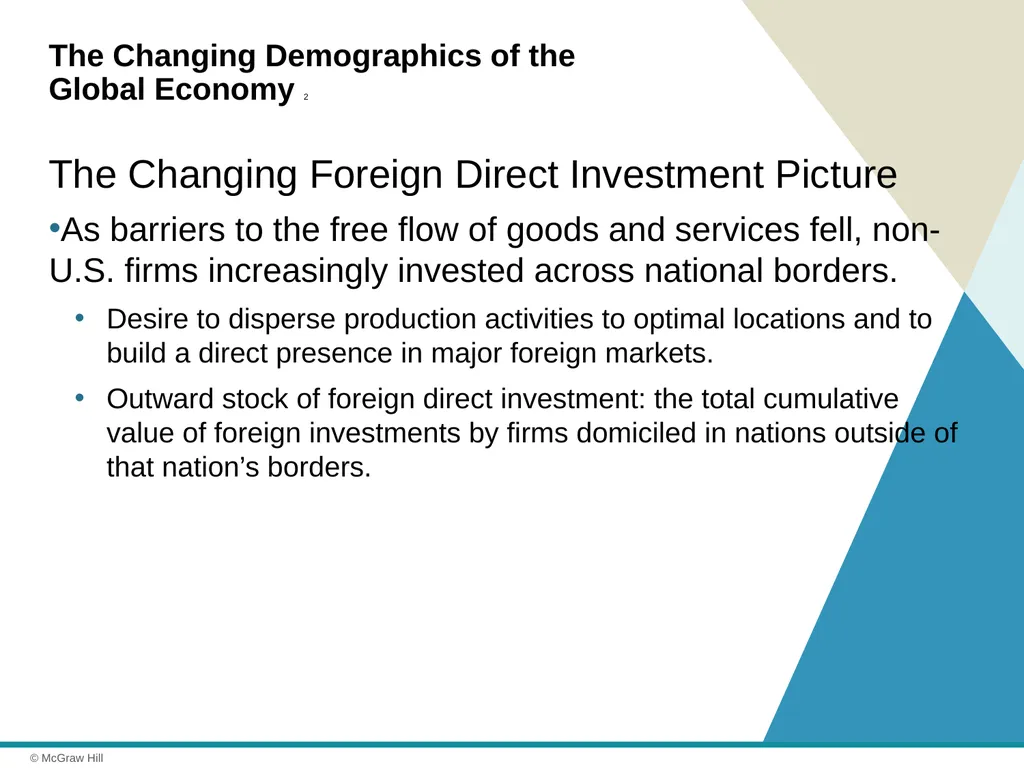
slide18. The Changing Demographics of the Global Economy 2 The Changing Foreign Direct Investment Picture
As barriers to the free flow of goods and services fell, non-U.S. firms increasingly invested across national borders.
Desire to disperse production activities to optimal locations and to build a direct presence in major foreign markets.
Outward stock of foreign direct investment: the total cumulative value of foreign investments by firms domiciled in nations outside of that nation’s borders.<br>
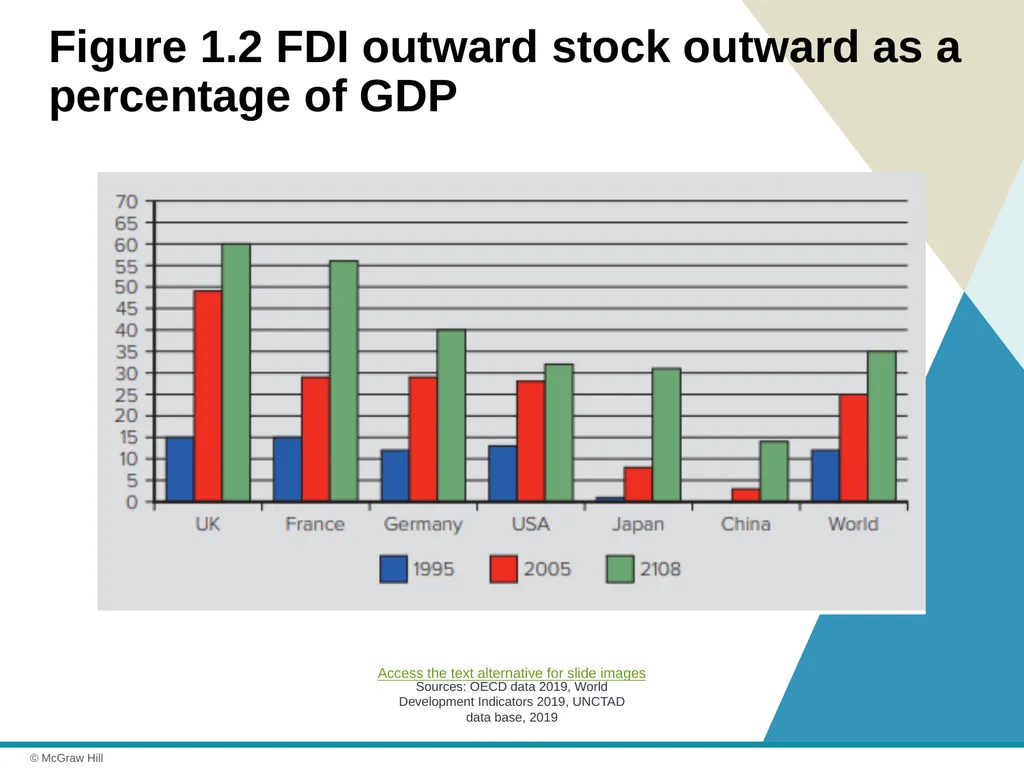
slide19. Figure 1.2 FDI outward stock outward as a percentage of GDP Sources: OECD data 2019, World Development Indicators 2019, UNCTAD data base, 2019 Access the text alternative for slide images<br>
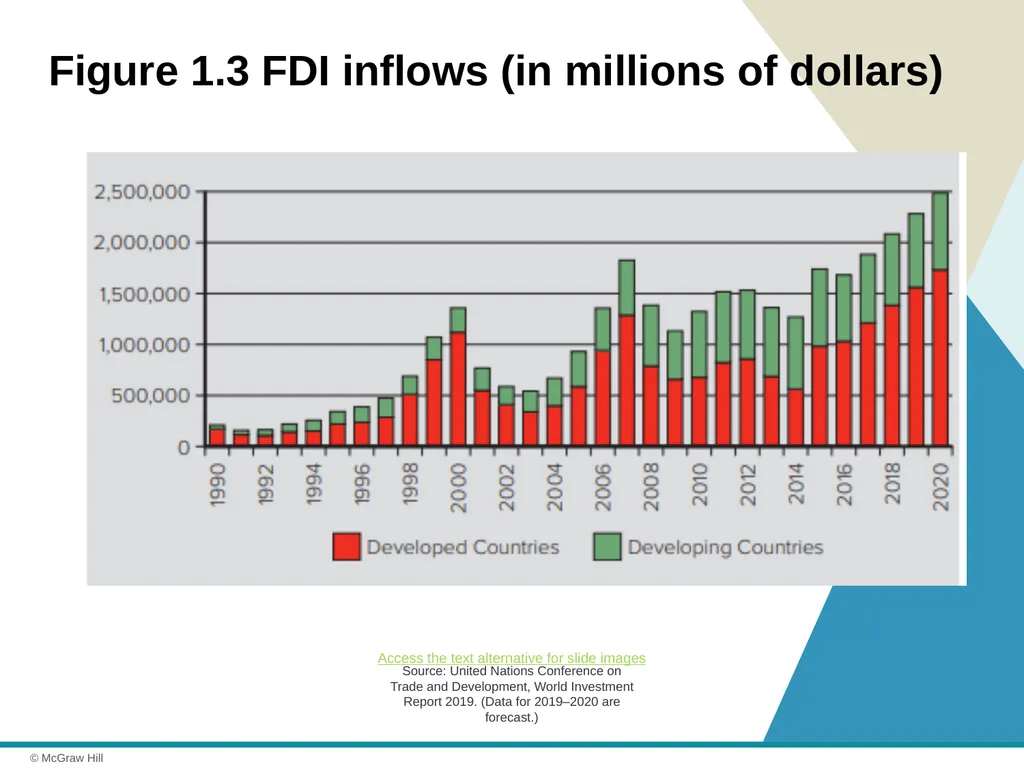
slide20. Figure 1.3 FDI inflows (in millions of dollars) Source: United Nations Conference on Trade and Development, World Investment Report 2019. (Data for 2019–2020 are forecast.) Access the text alternative for slide images<br>
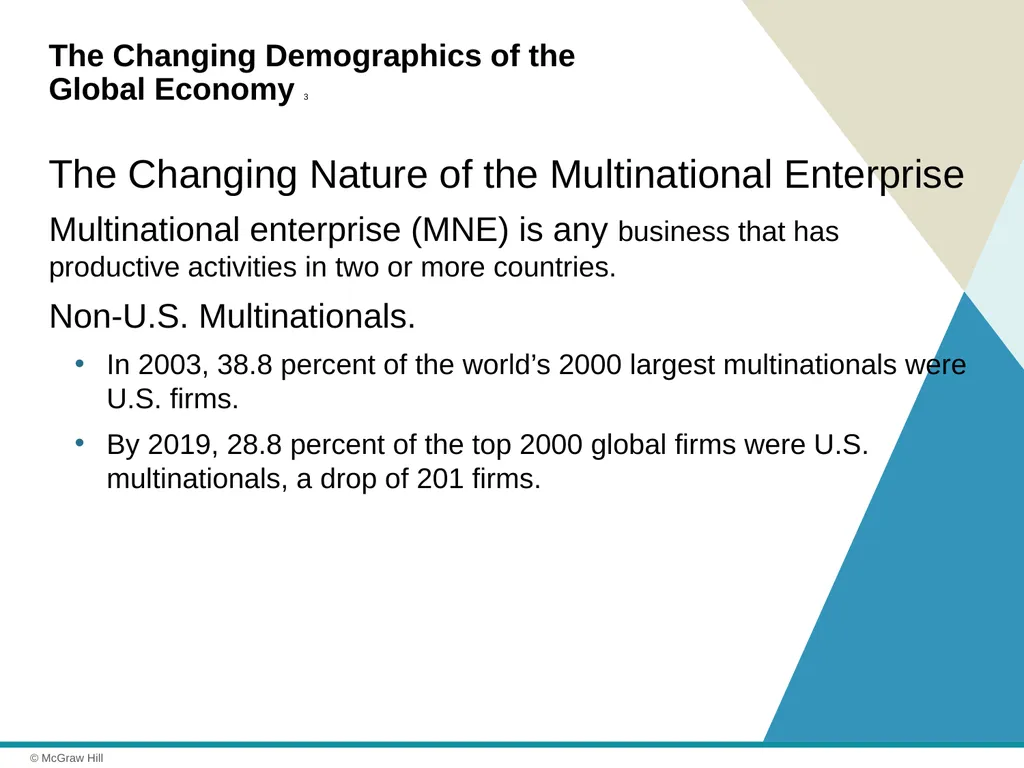
slide21. The Changing Demographics of the Global Economy 3 The Changing Nature of the Multinational Enterprise
Multinational enterprise (MNE) is any business that has productive activities in two or more countries.
Non-U.S. Multinationals.
In 2003, 38.8 percent of the world’s 2000 largest multinationals were U.S. firms.
By 2019, 28.8 percent of the top 2000 global firms were U.S. multinationals, a drop of 201 firms.<br>
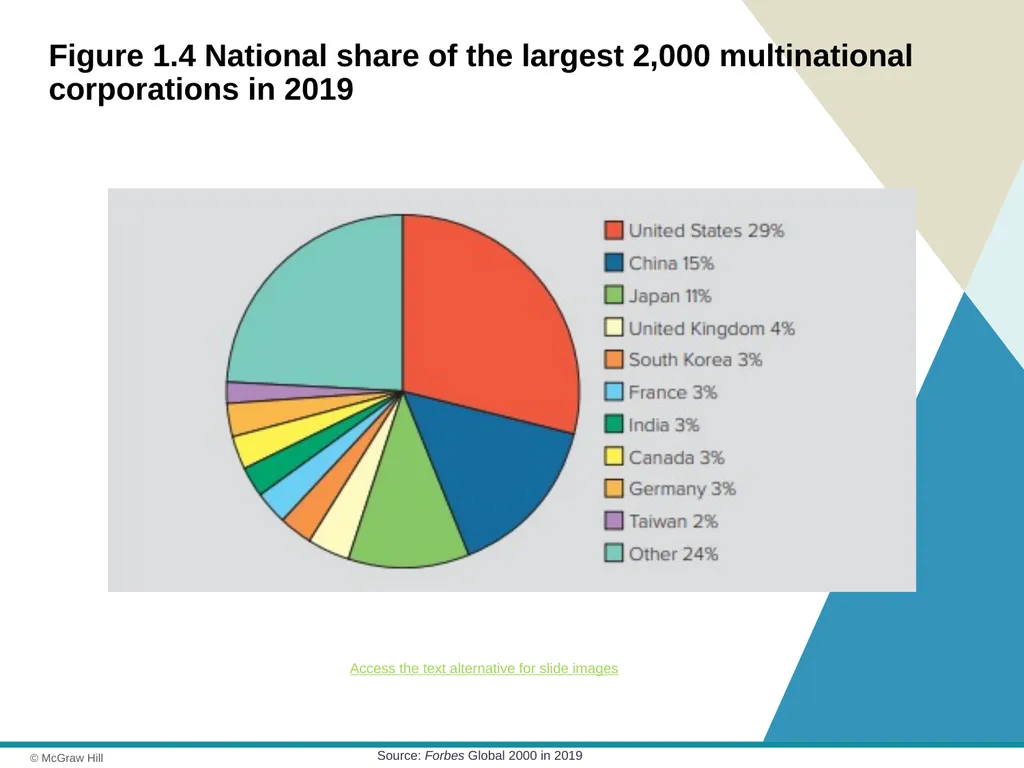
slide22. Figure 1.4 National share of the largest 2,000 multinational corporations in 2019 Source: Forbes Global 2000 in 2019 Access the text alternative for slide images<br>
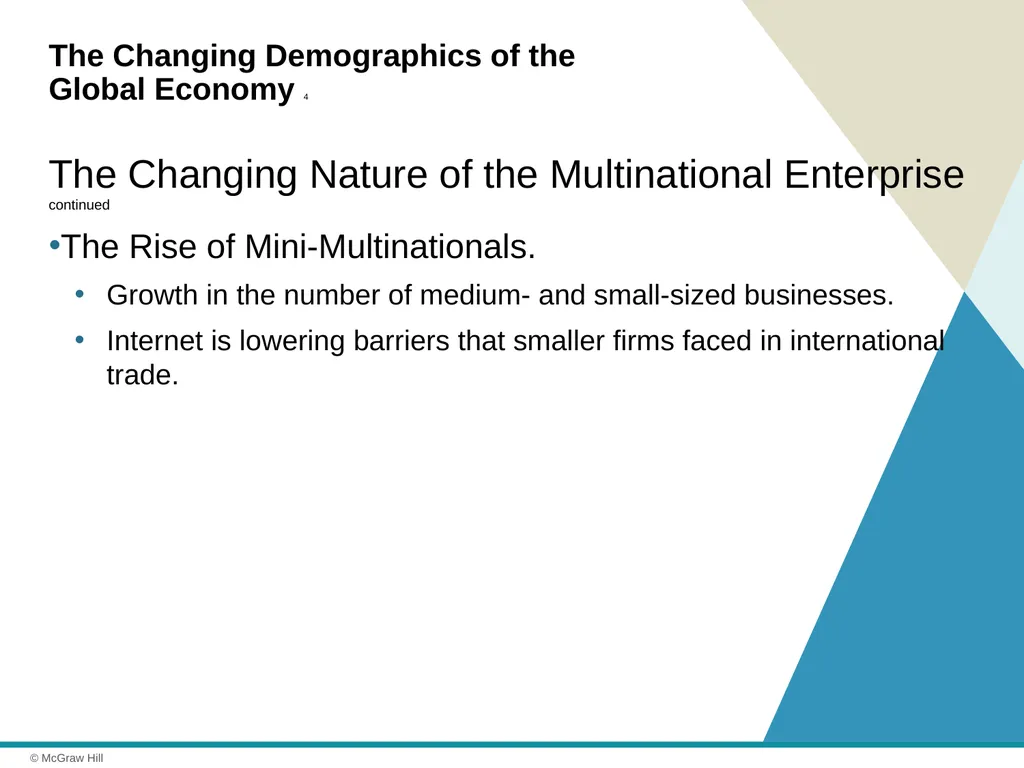
slide23. The Changing Demographics of the Global Economy 4 The Changing Nature of the Multinational Enterprise continued
The Rise of Mini-Multinationals.
Growth in the number of medium- and small-sized businesses.
Internet is lowering barriers that smaller firms faced in international trade.<br>
slide24. The Changing Demographics of the Global Economy 5 The Changing World Order
Former communist countries present export and investment opportunities.
Signs of growing unrest and commitment to market-based economic systems cannot be assumed.
Risks of doing business in these countries are high.
China moving to industrial superpower.
In Latin America debt and inflation are down, more private investors, expanding economies.<br>
slide25. The Changing Demographics of the Global Economy 6 Global Economy of the Twenty-First Century
Barriers to the free flow of goods, services, and capital have been coming down.
Strengthened by the widespread adoption of liberal economic policies by countries that had opposed them.
Globalization is not inevitable:
Countries may pull back.
Risks are high.<br>
slide26. The Globalization Debate 1 Antiglobalization Protests
Began with 1999 protests at WTO meeting in Seattle.
Protestors now typically show up at major meetings of global institutions.
Protestors believe globalization causes detrimental effects on living standards, wage rates, and the environment.
Theory and evidence suggest these fears may be exaggerated.<br>
slide27. The Globalization Debate 2 Globalization, Jobs, and Income
Critics of globalization argue:
Falling trade barriers allow firms to move manufacturing activities to countries where wage rates are much lower.
Destroy manufacturing jobs in wealthy advanced economies.
Services also being outsourced:
Contributing to higher unemployment and lower living standards in their home nations.<br>
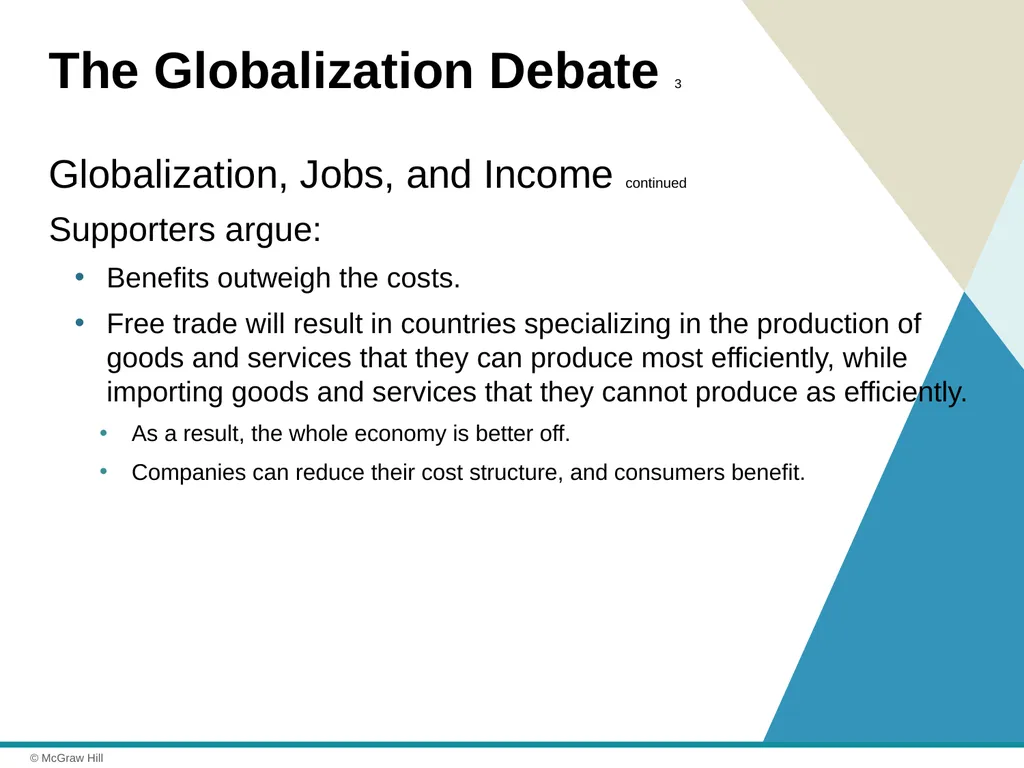
slide28. The Globalization Debate 3 Globalization, Jobs, and Income continued
Supporters argue:
Benefits outweigh the costs.
Free trade will result in countries specializing in the production of goods and services that they can produce most efficiently, while importing goods and services that they cannot produce as efficiently.
As a result, the whole economy is better off.
Companies can reduce their cost structure, and consumers benefit.<br>
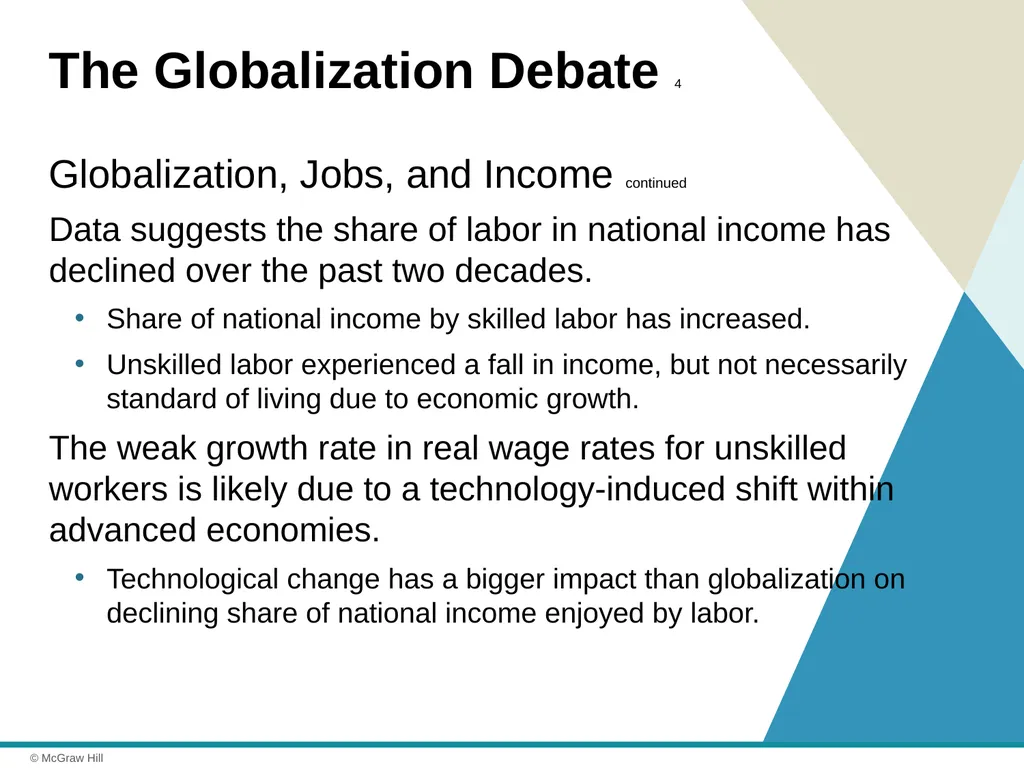
slide29. The Globalization Debate 4 Globalization, Jobs, and Income continued
Data suggests the share of labor in national income has declined over the past two decades.
Share of national income by skilled labor has increased.
Unskilled labor experienced a fall in income, but not necessarily standard of living due to economic growth.
The weak growth rate in real wage rates for unskilled workers is likely due to a technology-induced shift within advanced economies.
Technological change has a bigger impact than globalization on declining share of national income enjoyed by labor.<br>
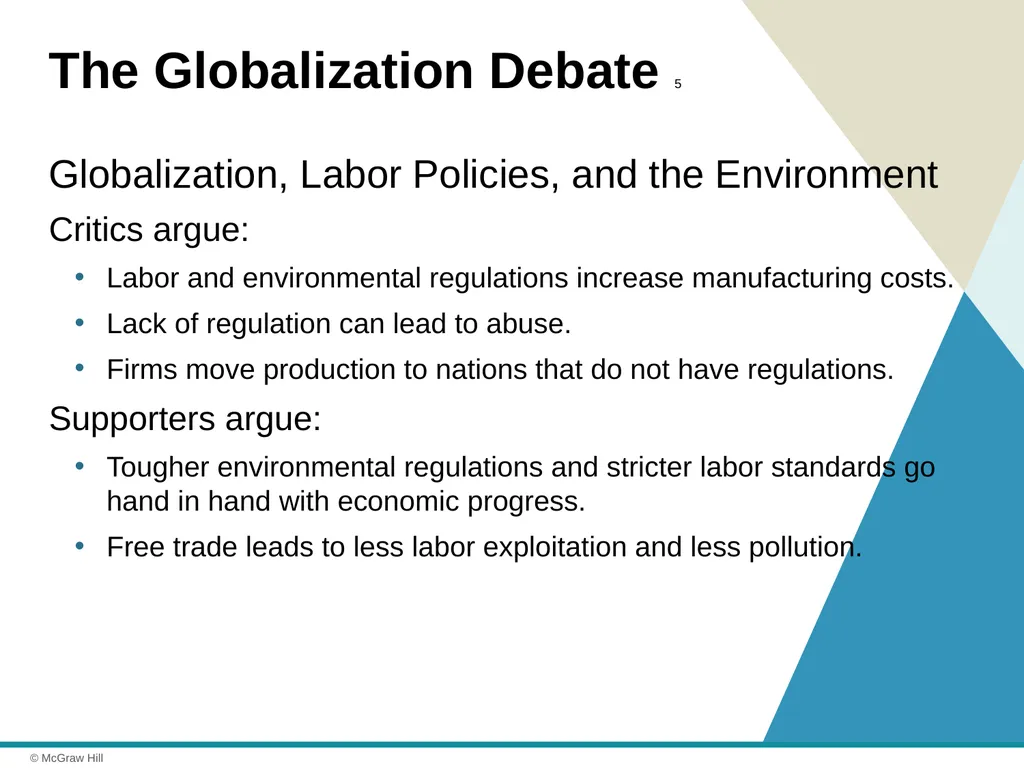
slide30. The Globalization Debate 5 Globalization, Labor Policies, and the Environment
Critics argue:
Labor and environmental regulations increase manufacturing costs.
Lack of regulation can lead to abuse.
Firms move production to nations that do not have regulations.
Supporters argue:
Tougher environmental regulations and stricter labor standards go hand in hand with economic progress.
Free trade leads to less labor exploitation and less pollution.<br>
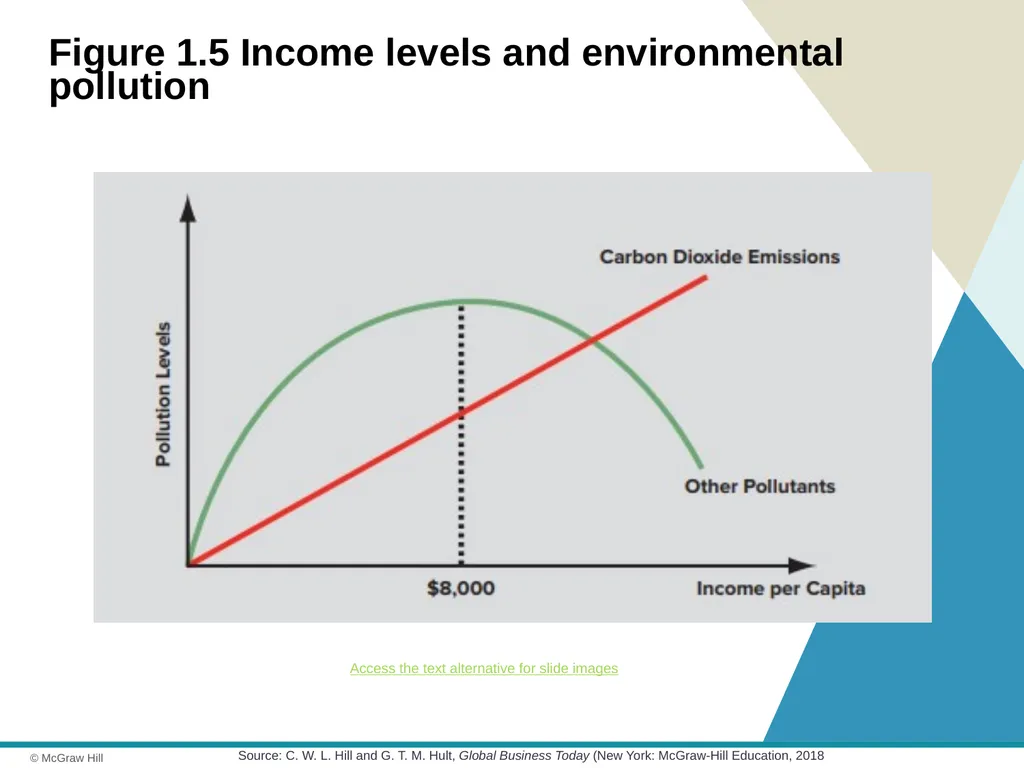
slide31. Figure 1.5 Income levels and environmental pollution Source: C. W. L. Hill and G. T. M. Hult, Global Business Today (New York: McGraw-Hill Education, 2018 Access the text alternative for slide images<br>
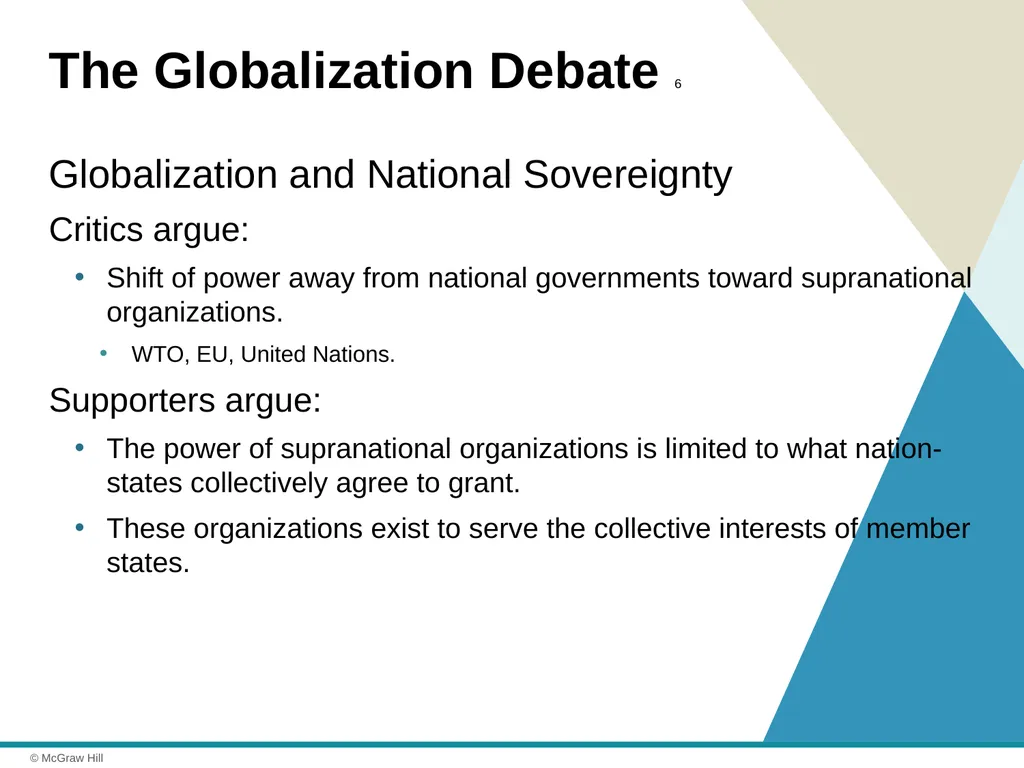
slide32. The Globalization Debate 6 Globalization and National Sovereignty
Critics argue:
Shift of power away from national governments toward supranational organizations.
WTO, EU, United Nations.
Supporters argue:
The power of supranational organizations is limited to what nation-states collectively agree to grant.
These organizations exist to serve the collective interests of member states.<br>
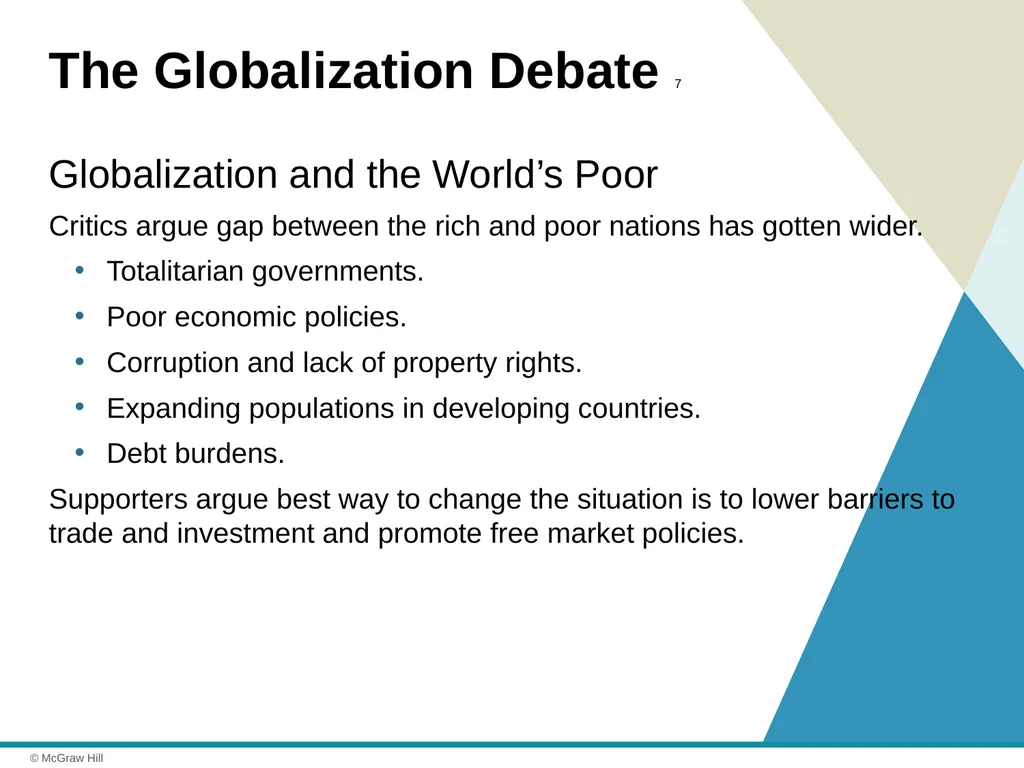
slide33. The Globalization Debate 7 Globalization and the World’s Poor
Critics argue gap between the rich and poor nations has gotten wider.
Totalitarian governments.
Poor economic policies.
Corruption and lack of property rights.
Expanding populations in developing countries.
Debt burdens.
Supporters argue best way to change the situation is to lower barriers to trade and investment and promote free market policies.<br>
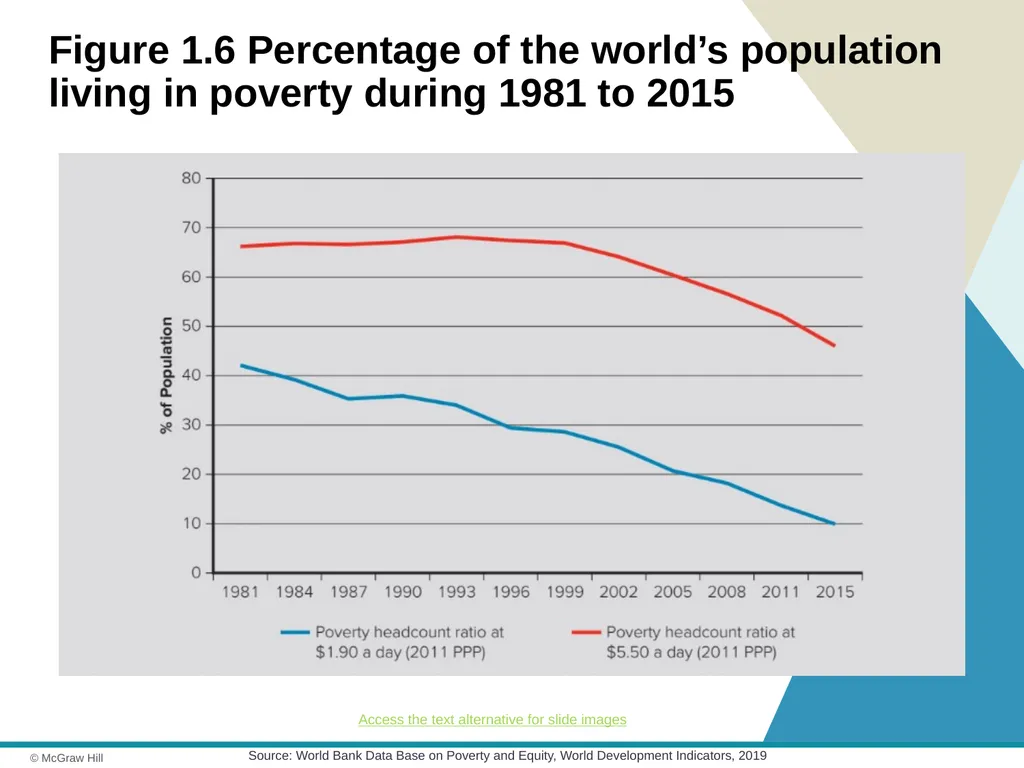
slide34. Figure 1.6 Percentage of the world’s population living in poverty during 1981 to 2015 Source: World Bank Data Base on Poverty and Equity, World Development Indicators, 2019 Access the text alternative for slide images<br>
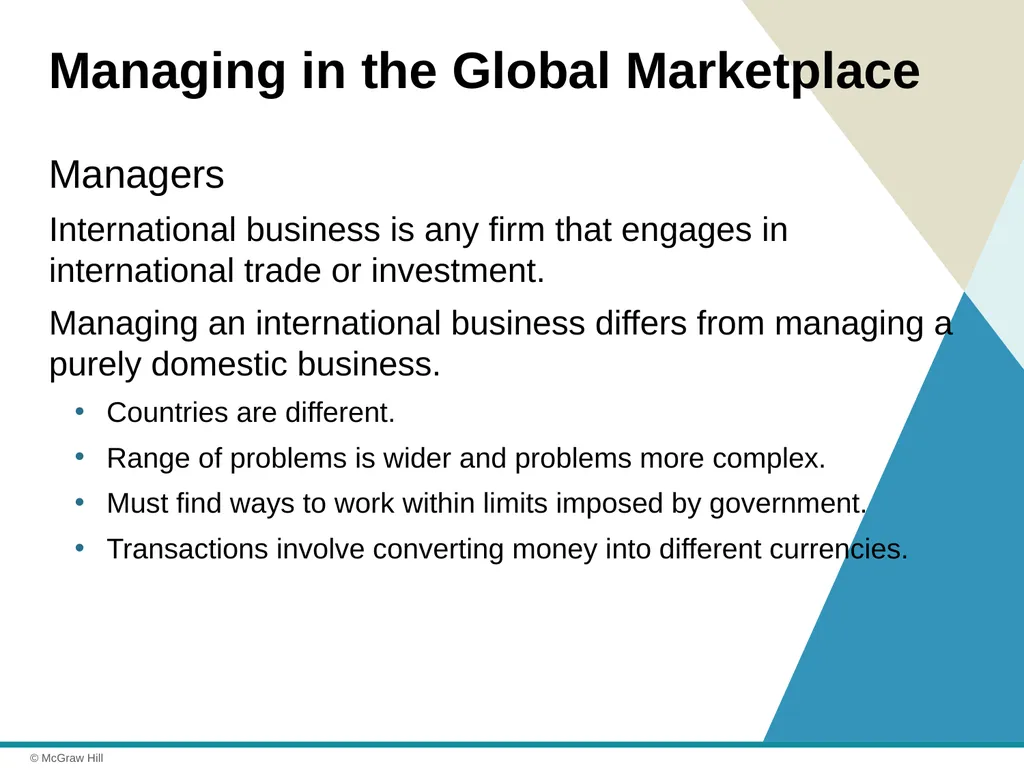
slide35. Managing in the Global Marketplace Managers
International business is any firm that engages in international trade or investment.
Managing an international business differs from managing a purely domestic business.
Countries are different.
Range of problems is wider and problems more complex.
Must find ways to work within limits imposed by government.
Transactions involve converting money into different currencies.<br>
slide36. End of Main Content © 2021 McGraw Hill. All rights reserved. Authorized only for instructor use in the classroom.
No reproduction or further distribution permitted without the prior written consent of McGraw Hill.<br>
slide37. Accessibility Content: Text Alternatives for Images<br>
slide38. Figure 1.1 Value of world merchandised trade and world production 1960 to 2019 – Text Alternative Return to parent-slide containing images. This graph uses an Index Value in 1960 which equals 100. Data appears in two lines representing the World G D P Index and the Merchandise Trade Index. They begin at the same level, but the Merchandise Trade Index rises more rapidly and to higher overall levels during every year shown. World G D P Index: Data shows this index in 1960 at 100. It rises slowly to about 250 in 1985 and continues rising gradually until reaching 500 in 1995. The index remains steady until early 2005, when it begins generally rises more rapidly. It reaches about 900 in 2015. Merchandise Trade Index: Data shows this index at 100 in 1960. It rises slowly until 1970, when it begins rising more rapidly, reaching about 600 in the year 1980. It dips during the 1980s below the 500 mark, but begins rising in 1990, reaching 1000 by the year 2000. It continues rising rapidly to about 2100 in the year 2006, then drops sharply for a few years, then again rises rapidly, reaching nearly 2500. During 2015, the index drops sharply, ending around the 2000 mark. Return to parent-slide containing images.<br>
slide39. Figure 1.2 FDI outward stock outward as a percentage of GDP – Text Alternative Return to parent-slide containing images. Graph shows outward stock of F D I as a percentage of G D P for 1995, 2005 and 2018. Six countries and world averages are compared as follows: U K: 15 in 1995; 49 in 2005; 60 in 2018. France: 15 in 1995; 29 in 2005; 56 in 2018. Germany: 17 in 1995; 29 in 2005; 40 in 2018. U S A: 13 in 1995; 28 in 2005; 33 in 2018. Japan: 1 in 1995; 8 in 2005; 31 in 2018. China: 3 in 2005; 14 in 2018. (No data provided for 1995). World: 3 in 1995; 25 in 2005; 35 in 2018. Return to parent-slide containing images.<br>
slide40. Figure 1.3 FDI inflows (in millions of dollars) – Text Alternative Return to parent-slide containing images. F D I inflows for developed and developing countries are shown, but specific data points are not provided. But from 1990 to 2020, the overall rate has increased dramatically for both developed and developing countries. Beginning in 1990, both developed and developing countries show growing F D I inflows, with developed countries showing more. The overall rate is about 250,000 millions. Both developed and developing countries show a surge of investment inflows from 1998 to 2000 (peaking at a combined rate of about 1,400,000 millions), and a slump from 2001 to 2004, falling back to 1998 levels. Beginning in 2005, F D I inflows begin to grow again, peaking in 2007 at about 2,800,000 millions, slowing in 2008 and 2009 in developed countries, but increasing in developing countries. From 2014 through 2020 (projected), F D I grows dramatically in developed countries, and remains robust in developing countries. Combined, F D I inflows are projected to reach 2,500,000 millions in 2020. Return to parent-slide containing images.<br>
slide41. Figure 1.4 National share of the largest 2,000 multinational corporations in 2019 – Text Alternative Return to parent-slide containing images. United States 29 percent, China 15 percent, Japan 11 percent, United Kingdom 4 percent, South Korea 3 percent, France 3 percent, India 3 percent, Canada 3 percent, Germany 3 percent, Taiwan 2 percent, Other 24 percent. Return to parent-slide containing images.<br>
slide42. Figure 1.5 Income levels and environmental pollution – Text Alternative Return to parent-slide containing images. On the graph, the x axis represents income per capita, while the y axis represents pollution levels. One data line shows that carbon dioxide emissions rise sharply as income per capita increases. Carbon dioxide emissions continue rising as income rises. Another hump-shaped data line shows that other pollutants (unspecified) rise as income per capita increases, but peaks at the $8,000 level mark. From this point, the level of other pollutants decreases as income continues increasing. Return to parent-slide containing images.<br>
slide43. Figure 1.6 Percentage of the world’s population living in poverty during 1981 to 2015 – Text Alternative Return to parent-slide containing images. Note that all figures are approximate: Poverty headcount ratio at one dollar and ninety cents per day: 42 percent in 1981; 30 percent in 1995; 20 percent in 2005; 10 percent in 2015. Poverty headcount ratio at five dollars and fifty cents per day: 66 percent in 1981; 68 percent in 1995; 60 percent in 2005; 46 percent in 2015. Return to parent-slide containing images.<br>
No reproduction or further distribution permitted without the prior written consent of McGraw Hill.<br>
slide2. Learning Objectives 1-1 Understand what is meant by the term globalization.
1-2 Recognize the main drivers of globalization.
1-3 Describe the changing nature of the global economy.
1-4 Explain the main arguments in the debate over the impact of globalization.
1-5 Understand how the process of globalization is creating opportunities and challenges for management practice.<br>
slide3. What Is Globalization? 1 The Globalization of Markets
Refers to the merging of historically distinct and separate national markets into one huge global marketplace.
Falling barriers to cross-border trade and investment.
Global tastes.
Benefits small and large companies.
Significant differences between national markets.
Products that serve universal needs are global: oil.
Competitors may not change among nations.<br>
slide4. What Is Globalization? 2 The Globalization of Production
Sourcing goods to take advantage of differences in cost and quality of factors of production.
Factors of production include labor, energy, land, capital.
Early outsourcing was confined to manufacturing.
Modern communications technology has advanced outsourcing today for service activities.<br>
slide5. What Is Globalization? 3 The Globalization of Production continued
Robert Reich and “global products.”
Impediments prevent optimal dispersion of activities:
Formal and informal barriers to trade.
Barriers to foreign direct investment.
Transportation costs.
Political and economic risk.
Challenge of coordinating globally dispersed supply chain.<br>
slide6. The Emergence of Global Institutions 1 Institutions needed to help manage, regulate, and police global marketplace.
General Agreement on Tariffs and Trade (GATT).
World Trade Organization.
International Monetary Fund.
The World Bank.
The United Nations.<br>
slide7. The Emergence of Global Institutions 2 The World Trade Organization
Polices the world trading system.
Ensures nation-states adhere to the rules.
Facilitates multinational agreements among members.
164 nations that account for 98 percent of world trade were members as of 2019.<br>
slide8. The Emergence of Global Institutions 3 The International Monetary Fund
Established to maintain order in the international monetary system.
Often seen as the lender of last resort.
In return for loans, requires nation-states to adopt specific economic policies aimed at returning their economies to stability and growth.<br>
slide9. The Emergence of Global Institutions 4 The World Bank
Promotes economic development.
Focused on making low-interest loans to cash-strapped governments in poor nations that wish to undertake significant infrastructure investments.
Considered less controversial than the IMF.<br>
slide10. The Emergence of Global Institutions 5 The United Nations
Promotes peace through international cooperation and collective security.
193 member countries.
UN Charter – four basic purposes:
Maintain international peace and security.
Develop friendly relations among nations.
Cooperate in solving international problems and in promoting respect for human rights.
Be a center for harmonizing the actions of nations.<br>
slide11. The Emergence of Global Institutions 6 Group of Twenty (G20)
Finance ministers and central bank governors of the 19 largest economies in the world, plus representatives from the European Union and the European Central Bank.
Represents 90 percent of global GDP and 80 percent of international global trade.<br>
slide12. Drivers of Globalization 1 Declining Trade and Investment Barriers
1920s to 1930s: Many barriers to international trade and foreign direct investment.
International trade: when a firm exports goods or services to consumers in another country.
Foreign direct investment: when a firm invests resources in business activities outside its home country.
GATT lowered barriers.
Uruguay Round extended GATT and established WTO.<br>
slide13. Drivers of Globalization 2 Declining Trade and Investment Barriers continued
Between 1960 and 2018 the value of the world economy increased 9.4 times, while the value of international goods increased 22.4 times.
Trade in goods and services and the value of foreign direct investment have all been growing faster than world output.
More firms dispersing production process to different locations around the globe.
Economies of the world’s nation-states are becoming more intertwined.
World has become significantly wealthier in the past two decades.<br>
slide14. Figure 1.1 Value of world merchandised trade and world production 1960 to 2019 Sources: World Bank, 2019; World Trade Organization, 2019; United Nations, 2019. Access the text alternative for slide images<br>
slide15. Drivers of Globalization 3 Role of Technological Change
Communications.
Development of the microprocessor single most important innovation since World War II.
Moore’s Law predicts that the power of microprocessor technology doubles and its cost of production falls in half every 18 months.
The Internet.
More than half of the world’s population uses the Internet.
Global e-commerce sales over $2.5 trillion.
The Internet acts as an equalizer.<br>
slide16. Drivers of Globalization 4 Role of Technological Change continued
Transportation Technology.
Commercial jets, superfreighters, and containerization have all “shrunk the globe.”
Implications for the Globalization of Production.
Locating production in geographically separate locations has become more economical.
Implications for the Globalization of Markets.
Cultural distance has been reduced and has brought some convergence of consumer tastes and preferences.<br>
slide17. The Changing Demographics of the Global Economy 1 The Changing World Output and World Trade Picture
1960s: U.S. accounted for 38.3 percent of world output.
2018: U.S. accounted for 24 percent of world output.
This reflects the faster economic growth of several other economies, particularly China.
China and BRIC countries growing more rapidly.
Developing nations may account for more than 60 percent of world economic activity by 2025.<br>
slide18. The Changing Demographics of the Global Economy 2 The Changing Foreign Direct Investment Picture
As barriers to the free flow of goods and services fell, non-U.S. firms increasingly invested across national borders.
Desire to disperse production activities to optimal locations and to build a direct presence in major foreign markets.
Outward stock of foreign direct investment: the total cumulative value of foreign investments by firms domiciled in nations outside of that nation’s borders.<br>
slide19. Figure 1.2 FDI outward stock outward as a percentage of GDP Sources: OECD data 2019, World Development Indicators 2019, UNCTAD data base, 2019 Access the text alternative for slide images<br>
slide20. Figure 1.3 FDI inflows (in millions of dollars) Source: United Nations Conference on Trade and Development, World Investment Report 2019. (Data for 2019–2020 are forecast.) Access the text alternative for slide images<br>
slide21. The Changing Demographics of the Global Economy 3 The Changing Nature of the Multinational Enterprise
Multinational enterprise (MNE) is any business that has productive activities in two or more countries.
Non-U.S. Multinationals.
In 2003, 38.8 percent of the world’s 2000 largest multinationals were U.S. firms.
By 2019, 28.8 percent of the top 2000 global firms were U.S. multinationals, a drop of 201 firms.<br>
slide22. Figure 1.4 National share of the largest 2,000 multinational corporations in 2019 Source: Forbes Global 2000 in 2019 Access the text alternative for slide images<br>
slide23. The Changing Demographics of the Global Economy 4 The Changing Nature of the Multinational Enterprise continued
The Rise of Mini-Multinationals.
Growth in the number of medium- and small-sized businesses.
Internet is lowering barriers that smaller firms faced in international trade.<br>
slide24. The Changing Demographics of the Global Economy 5 The Changing World Order
Former communist countries present export and investment opportunities.
Signs of growing unrest and commitment to market-based economic systems cannot be assumed.
Risks of doing business in these countries are high.
China moving to industrial superpower.
In Latin America debt and inflation are down, more private investors, expanding economies.<br>
slide25. The Changing Demographics of the Global Economy 6 Global Economy of the Twenty-First Century
Barriers to the free flow of goods, services, and capital have been coming down.
Strengthened by the widespread adoption of liberal economic policies by countries that had opposed them.
Globalization is not inevitable:
Countries may pull back.
Risks are high.<br>
slide26. The Globalization Debate 1 Antiglobalization Protests
Began with 1999 protests at WTO meeting in Seattle.
Protestors now typically show up at major meetings of global institutions.
Protestors believe globalization causes detrimental effects on living standards, wage rates, and the environment.
Theory and evidence suggest these fears may be exaggerated.<br>
slide27. The Globalization Debate 2 Globalization, Jobs, and Income
Critics of globalization argue:
Falling trade barriers allow firms to move manufacturing activities to countries where wage rates are much lower.
Destroy manufacturing jobs in wealthy advanced economies.
Services also being outsourced:
Contributing to higher unemployment and lower living standards in their home nations.<br>
slide28. The Globalization Debate 3 Globalization, Jobs, and Income continued
Supporters argue:
Benefits outweigh the costs.
Free trade will result in countries specializing in the production of goods and services that they can produce most efficiently, while importing goods and services that they cannot produce as efficiently.
As a result, the whole economy is better off.
Companies can reduce their cost structure, and consumers benefit.<br>
slide29. The Globalization Debate 4 Globalization, Jobs, and Income continued
Data suggests the share of labor in national income has declined over the past two decades.
Share of national income by skilled labor has increased.
Unskilled labor experienced a fall in income, but not necessarily standard of living due to economic growth.
The weak growth rate in real wage rates for unskilled workers is likely due to a technology-induced shift within advanced economies.
Technological change has a bigger impact than globalization on declining share of national income enjoyed by labor.<br>
slide30. The Globalization Debate 5 Globalization, Labor Policies, and the Environment
Critics argue:
Labor and environmental regulations increase manufacturing costs.
Lack of regulation can lead to abuse.
Firms move production to nations that do not have regulations.
Supporters argue:
Tougher environmental regulations and stricter labor standards go hand in hand with economic progress.
Free trade leads to less labor exploitation and less pollution.<br>
slide31. Figure 1.5 Income levels and environmental pollution Source: C. W. L. Hill and G. T. M. Hult, Global Business Today (New York: McGraw-Hill Education, 2018 Access the text alternative for slide images<br>
slide32. The Globalization Debate 6 Globalization and National Sovereignty
Critics argue:
Shift of power away from national governments toward supranational organizations.
WTO, EU, United Nations.
Supporters argue:
The power of supranational organizations is limited to what nation-states collectively agree to grant.
These organizations exist to serve the collective interests of member states.<br>
slide33. The Globalization Debate 7 Globalization and the World’s Poor
Critics argue gap between the rich and poor nations has gotten wider.
Totalitarian governments.
Poor economic policies.
Corruption and lack of property rights.
Expanding populations in developing countries.
Debt burdens.
Supporters argue best way to change the situation is to lower barriers to trade and investment and promote free market policies.<br>
slide34. Figure 1.6 Percentage of the world’s population living in poverty during 1981 to 2015 Source: World Bank Data Base on Poverty and Equity, World Development Indicators, 2019 Access the text alternative for slide images<br>
slide35. Managing in the Global Marketplace Managers
International business is any firm that engages in international trade or investment.
Managing an international business differs from managing a purely domestic business.
Countries are different.
Range of problems is wider and problems more complex.
Must find ways to work within limits imposed by government.
Transactions involve converting money into different currencies.<br>
slide36. End of Main Content © 2021 McGraw Hill. All rights reserved. Authorized only for instructor use in the classroom.
No reproduction or further distribution permitted without the prior written consent of McGraw Hill.<br>
slide37. Accessibility Content: Text Alternatives for Images<br>
slide38. Figure 1.1 Value of world merchandised trade and world production 1960 to 2019 – Text Alternative Return to parent-slide containing images. This graph uses an Index Value in 1960 which equals 100. Data appears in two lines representing the World G D P Index and the Merchandise Trade Index. They begin at the same level, but the Merchandise Trade Index rises more rapidly and to higher overall levels during every year shown. World G D P Index: Data shows this index in 1960 at 100. It rises slowly to about 250 in 1985 and continues rising gradually until reaching 500 in 1995. The index remains steady until early 2005, when it begins generally rises more rapidly. It reaches about 900 in 2015. Merchandise Trade Index: Data shows this index at 100 in 1960. It rises slowly until 1970, when it begins rising more rapidly, reaching about 600 in the year 1980. It dips during the 1980s below the 500 mark, but begins rising in 1990, reaching 1000 by the year 2000. It continues rising rapidly to about 2100 in the year 2006, then drops sharply for a few years, then again rises rapidly, reaching nearly 2500. During 2015, the index drops sharply, ending around the 2000 mark. Return to parent-slide containing images.<br>
slide39. Figure 1.2 FDI outward stock outward as a percentage of GDP – Text Alternative Return to parent-slide containing images. Graph shows outward stock of F D I as a percentage of G D P for 1995, 2005 and 2018. Six countries and world averages are compared as follows: U K: 15 in 1995; 49 in 2005; 60 in 2018. France: 15 in 1995; 29 in 2005; 56 in 2018. Germany: 17 in 1995; 29 in 2005; 40 in 2018. U S A: 13 in 1995; 28 in 2005; 33 in 2018. Japan: 1 in 1995; 8 in 2005; 31 in 2018. China: 3 in 2005; 14 in 2018. (No data provided for 1995). World: 3 in 1995; 25 in 2005; 35 in 2018. Return to parent-slide containing images.<br>
slide40. Figure 1.3 FDI inflows (in millions of dollars) – Text Alternative Return to parent-slide containing images. F D I inflows for developed and developing countries are shown, but specific data points are not provided. But from 1990 to 2020, the overall rate has increased dramatically for both developed and developing countries. Beginning in 1990, both developed and developing countries show growing F D I inflows, with developed countries showing more. The overall rate is about 250,000 millions. Both developed and developing countries show a surge of investment inflows from 1998 to 2000 (peaking at a combined rate of about 1,400,000 millions), and a slump from 2001 to 2004, falling back to 1998 levels. Beginning in 2005, F D I inflows begin to grow again, peaking in 2007 at about 2,800,000 millions, slowing in 2008 and 2009 in developed countries, but increasing in developing countries. From 2014 through 2020 (projected), F D I grows dramatically in developed countries, and remains robust in developing countries. Combined, F D I inflows are projected to reach 2,500,000 millions in 2020. Return to parent-slide containing images.<br>
slide41. Figure 1.4 National share of the largest 2,000 multinational corporations in 2019 – Text Alternative Return to parent-slide containing images. United States 29 percent, China 15 percent, Japan 11 percent, United Kingdom 4 percent, South Korea 3 percent, France 3 percent, India 3 percent, Canada 3 percent, Germany 3 percent, Taiwan 2 percent, Other 24 percent. Return to parent-slide containing images.<br>
slide42. Figure 1.5 Income levels and environmental pollution – Text Alternative Return to parent-slide containing images. On the graph, the x axis represents income per capita, while the y axis represents pollution levels. One data line shows that carbon dioxide emissions rise sharply as income per capita increases. Carbon dioxide emissions continue rising as income rises. Another hump-shaped data line shows that other pollutants (unspecified) rise as income per capita increases, but peaks at the $8,000 level mark. From this point, the level of other pollutants decreases as income continues increasing. Return to parent-slide containing images.<br>
slide43. Figure 1.6 Percentage of the world’s population living in poverty during 1981 to 2015 – Text Alternative Return to parent-slide containing images. Note that all figures are approximate: Poverty headcount ratio at one dollar and ninety cents per day: 42 percent in 1981; 30 percent in 1995; 20 percent in 2005; 10 percent in 2015. Poverty headcount ratio at five dollars and fifty cents per day: 66 percent in 1981; 68 percent in 1995; 60 percent in 2005; 46 percent in 2015. Return to parent-slide containing images.<br>