
Greater Manchester Strategy: performance report
KB
Published · 20 slides · 0 views
1 / 1






Description
Greater Manchester Strategy: performance report update final October 2018 Performance Report update This version of the dashboard provides the second assessment of performance against headline Greater Manchester Strategy (GMS) targets
Related Topics
Share
Embed code
Download this presentation From Below
"Greater Manchester Strategy: performance report" is the property of its rightful owner. Permission is granted to download and print the materials on this website for personal, non-commercial use only, and to display it on your personal computer provided you do not modify the materials and that you retain all copyright notices contained in the materials. By downloading content from our website, you accept the terms of this agreement.
Presentation Transcript
01
Greater Manchester Strategy: performance report update –final October 2018<br>
02
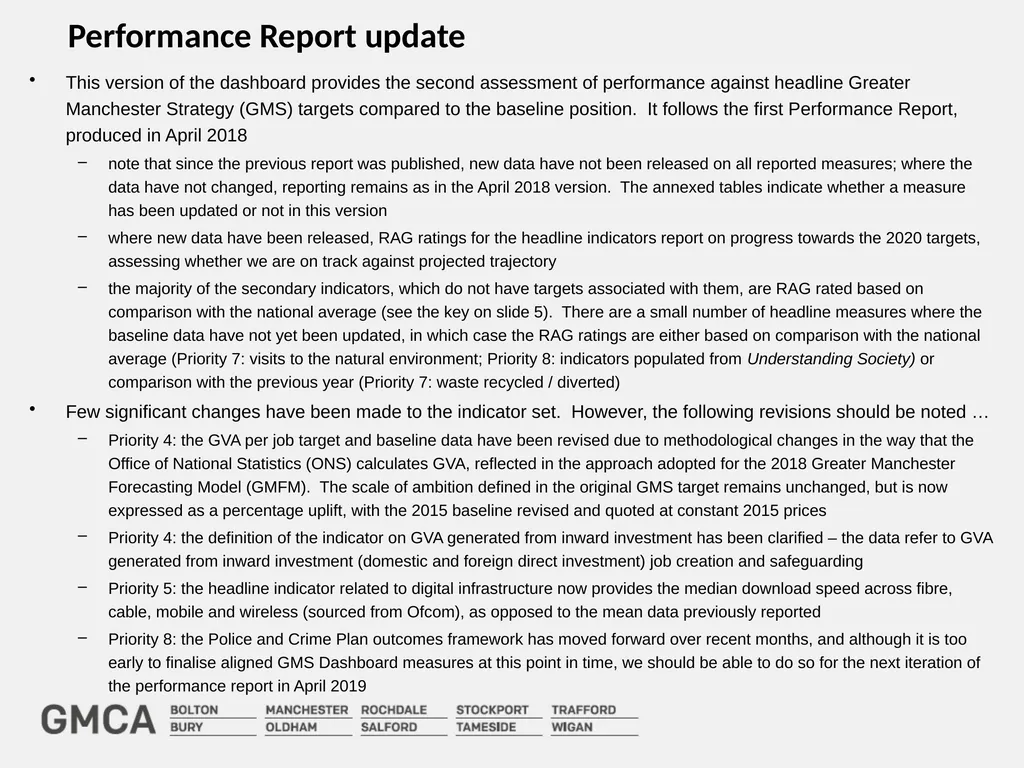
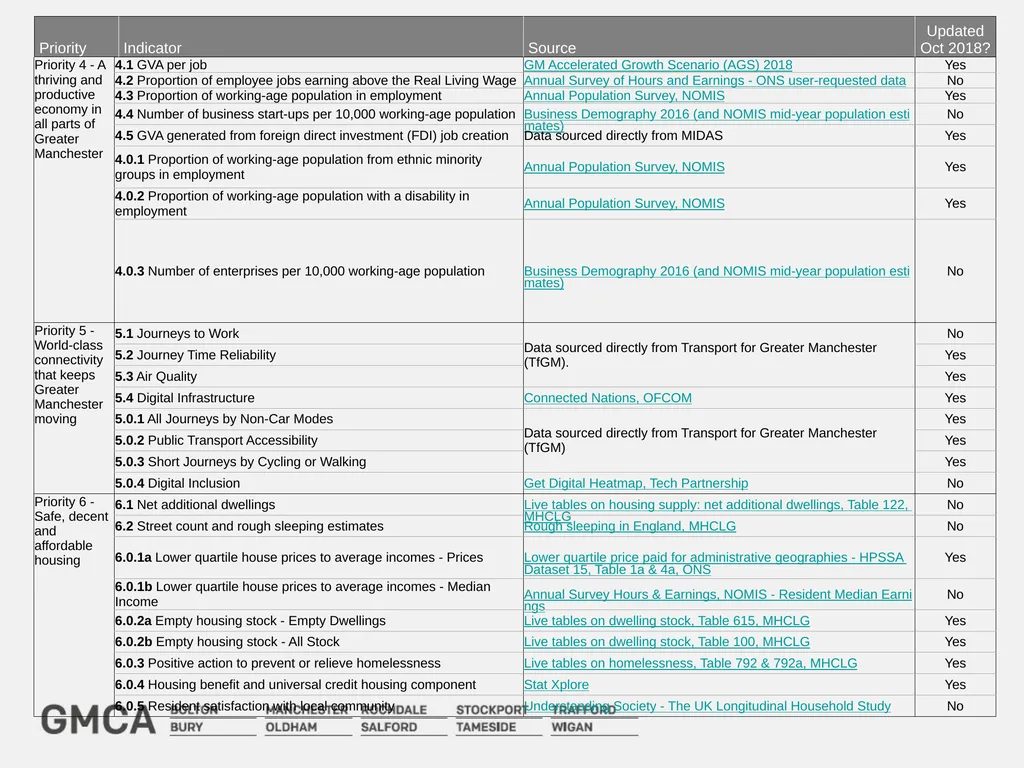
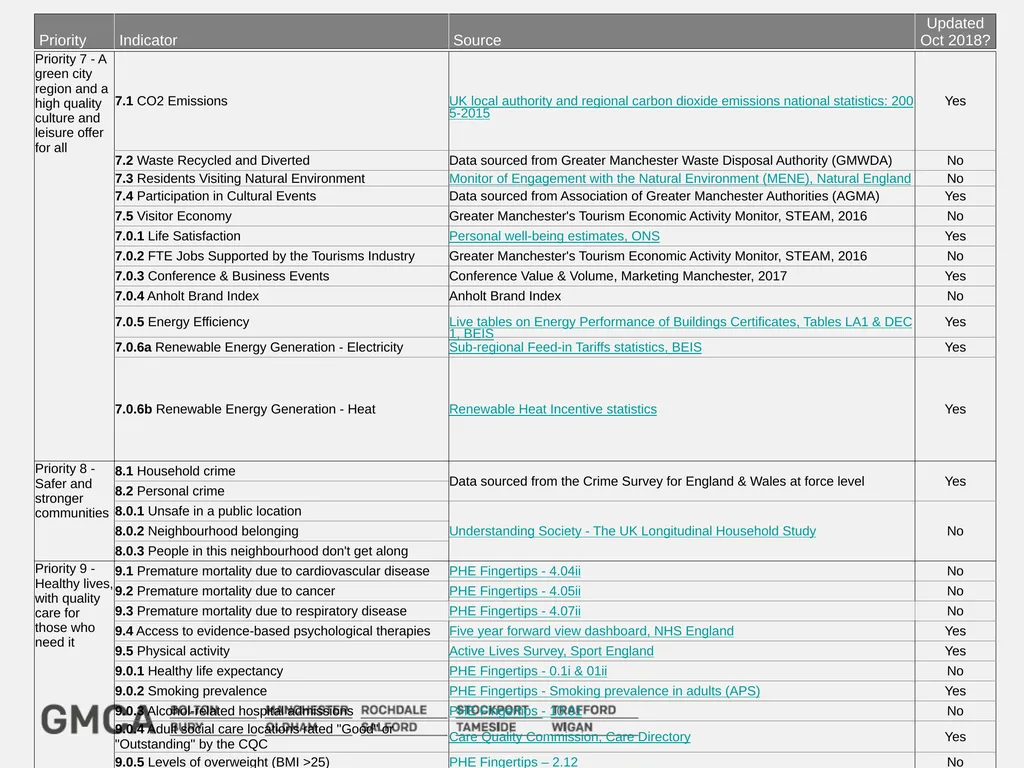
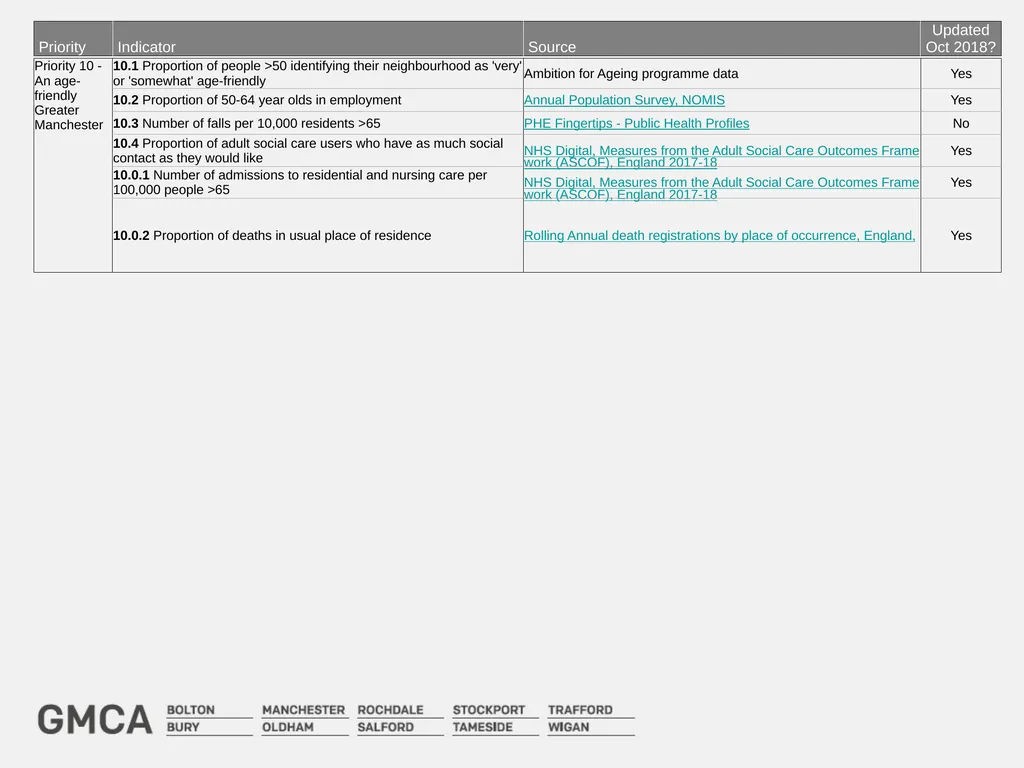
Performance Report update This version of the dashboard provides the second assessment of performance against headline Greater Manchester Strategy (GMS) targets compared to the baseline position. It follows the first Performance Report, produced in April 2018
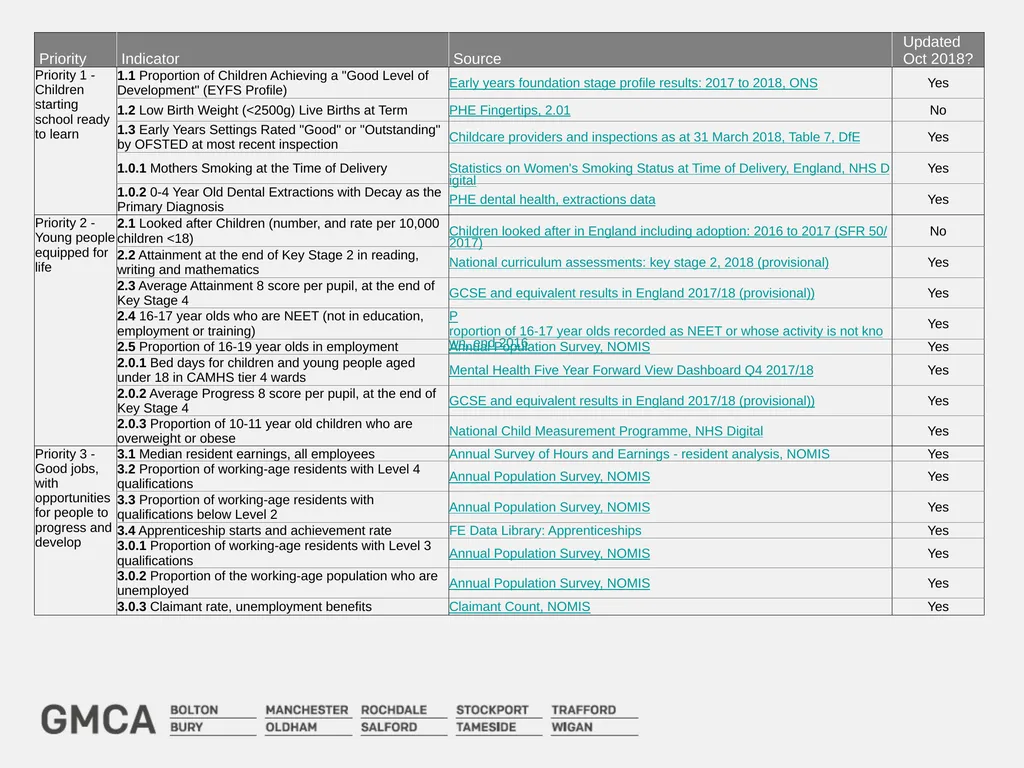
note that since the previous report was published, new data have not been released on all reported measures; where the data have not changed, reporting remains as in the April 2018 version. The annexed tables indicate whether a measure has been updated or not in this version
where new data have been released, RAG ratings for the headline indicators report on progress towards the 2020 targets, assessing whether we are on track against projected trajectory
the majority of the secondary indicators, which do not have targets associated with them, are RAG rated based on comparison with the national average (see the key on slide 5). There are a small number of headline measures where the baseline data have not yet been updated, in which case the RAG ratings are either based on comparison with the national average (Priority 7: visits to the natural environment; Priority 8: indicators populated from Understanding Society) or comparison with the previous year (Priority 7: waste recycled / diverted)
Few significant changes have been made to the indicator set. However, the following revisions should be noted …
Priority 4: the GVA per job target and baseline data have been revised due to methodological changes in the way that the Office of National Statistics (ONS) calculates GVA, reflected in the approach adopted for the 2018 Greater Manchester Forecasting Model (GMFM). The scale of ambition defined in the original GMS target remains unchanged, but is now expressed as a percentage uplift, with the 2015 baseline revised and quoted at constant 2015 prices
Priority 4: the definition of the indicator on GVA generated from inward investment has been clarified – the data refer to GVA generated from inward investment (domestic and foreign direct investment) job creation and safeguarding
Priority 5: the headline indicator related to digital infrastructure now provides the median download speed across fibre, cable, mobile and wireless (sourced from Ofcom), as opposed to the mean data previously reported
Priority 8: the Police and Crime Plan outcomes framework has moved forward over recent months, and although it is too early to finalise aligned GMS Dashboard measures at this point in time, we should be able to do so for the next iteration of the performance report in April 2019<br>
note that since the previous report was published, new data have not been released on all reported measures; where the data have not changed, reporting remains as in the April 2018 version. The annexed tables indicate whether a measure has been updated or not in this version
where new data have been released, RAG ratings for the headline indicators report on progress towards the 2020 targets, assessing whether we are on track against projected trajectory
the majority of the secondary indicators, which do not have targets associated with them, are RAG rated based on comparison with the national average (see the key on slide 5). There are a small number of headline measures where the baseline data have not yet been updated, in which case the RAG ratings are either based on comparison with the national average (Priority 7: visits to the natural environment; Priority 8: indicators populated from Understanding Society) or comparison with the previous year (Priority 7: waste recycled / diverted)
Few significant changes have been made to the indicator set. However, the following revisions should be noted …
Priority 4: the GVA per job target and baseline data have been revised due to methodological changes in the way that the Office of National Statistics (ONS) calculates GVA, reflected in the approach adopted for the 2018 Greater Manchester Forecasting Model (GMFM). The scale of ambition defined in the original GMS target remains unchanged, but is now expressed as a percentage uplift, with the 2015 baseline revised and quoted at constant 2015 prices
Priority 4: the definition of the indicator on GVA generated from inward investment has been clarified – the data refer to GVA generated from inward investment (domestic and foreign direct investment) job creation and safeguarding
Priority 5: the headline indicator related to digital infrastructure now provides the median download speed across fibre, cable, mobile and wireless (sourced from Ofcom), as opposed to the mean data previously reported
Priority 8: the Police and Crime Plan outcomes framework has moved forward over recent months, and although it is too early to finalise aligned GMS Dashboard measures at this point in time, we should be able to do so for the next iteration of the performance report in April 2019<br>
03
GMS Outcomes Framework<br>
04
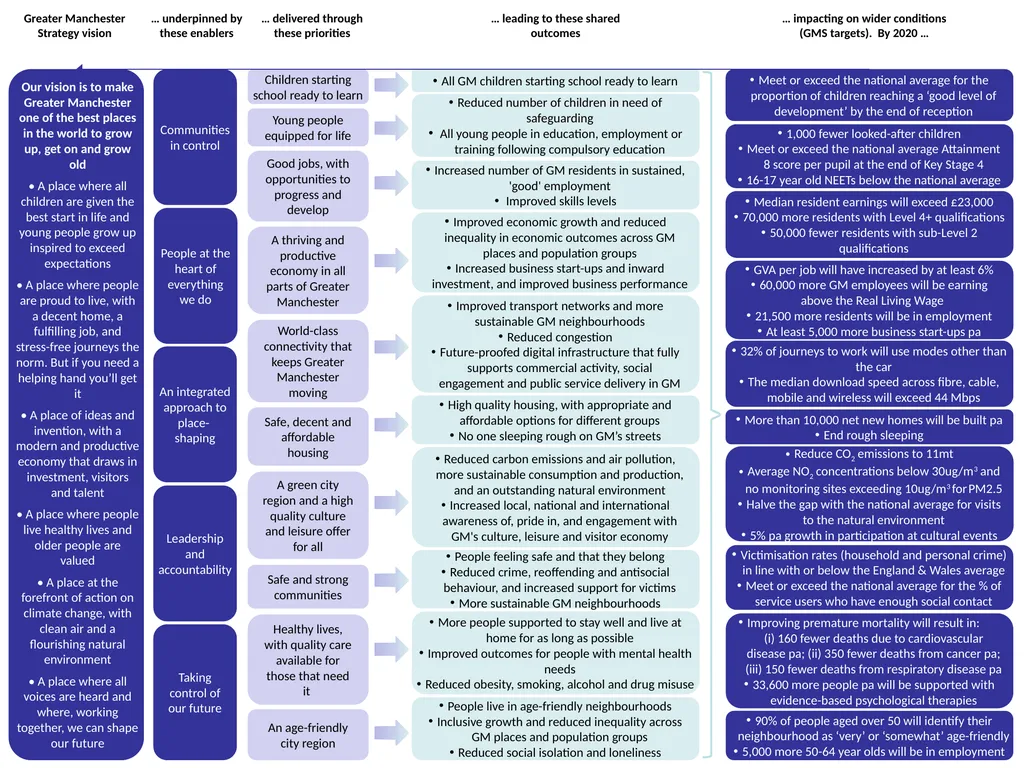
… delivered through these priorities Greater Manchester Strategy vision … impacting on wider conditions (GMS targets). By 2020 … … leading to these shared outcomes Our vision is to make Greater Manchester one of the best places in the world to grow up, get on and grow old
• A place where all children are given the best start in life and young people grow up inspired to exceed expectations
• A place where people are proud to live, with a decent home, a fulfilling job, and stress-free journeys the norm. But if you need a helping hand you’ll get it
• A place of ideas and invention, with a modern and productive economy that draws in investment, visitors and talent
• A place where people live healthy lives and older people are valued
• A place at the forefront of action on climate change, with clean air and a flourishing natural environment
• A place where all voices are heard and where, working together, we can shape our future … underpinned by these enablers Victimisation rates (household and personal crime) in line with or below the England & Wales average
Meet or exceed the national average for the % of service users who have enough social contact Improving premature mortality will result in: (i) 160 fewer deaths due to cardiovascular disease pa; (ii) 350 fewer deaths from cancer pa; (iii) 150 fewer deaths from respiratory disease pa
33,600 more people pa will be supported with evidence-based psychological therapies An integrated approach to place- shaping<br>
• A place where all children are given the best start in life and young people grow up inspired to exceed expectations
• A place where people are proud to live, with a decent home, a fulfilling job, and stress-free journeys the norm. But if you need a helping hand you’ll get it
• A place of ideas and invention, with a modern and productive economy that draws in investment, visitors and talent
• A place where people live healthy lives and older people are valued
• A place at the forefront of action on climate change, with clean air and a flourishing natural environment
• A place where all voices are heard and where, working together, we can shape our future … underpinned by these enablers Victimisation rates (household and personal crime) in line with or below the England & Wales average
Meet or exceed the national average for the % of service users who have enough social contact Improving premature mortality will result in: (i) 160 fewer deaths due to cardiovascular disease pa; (ii) 350 fewer deaths from cancer pa; (iii) 150 fewer deaths from respiratory disease pa
33,600 more people pa will be supported with evidence-based psychological therapies An integrated approach to place- shaping<br>
05
GMS Performance Dashboard
October 2018 performance report update
All figures are accurate as of 25 October 2018
New data have not been released on all reported measures; where the data have not changed, reporting remains as in the April 2018 version. The annexed tables indicate whether a measure has been updated or not in this version.<br>
October 2018 performance report update
All figures are accurate as of 25 October 2018
New data have not been released on all reported measures; where the data have not changed, reporting remains as in the April 2018 version. The annexed tables indicate whether a measure has been updated or not in this version.<br>
06
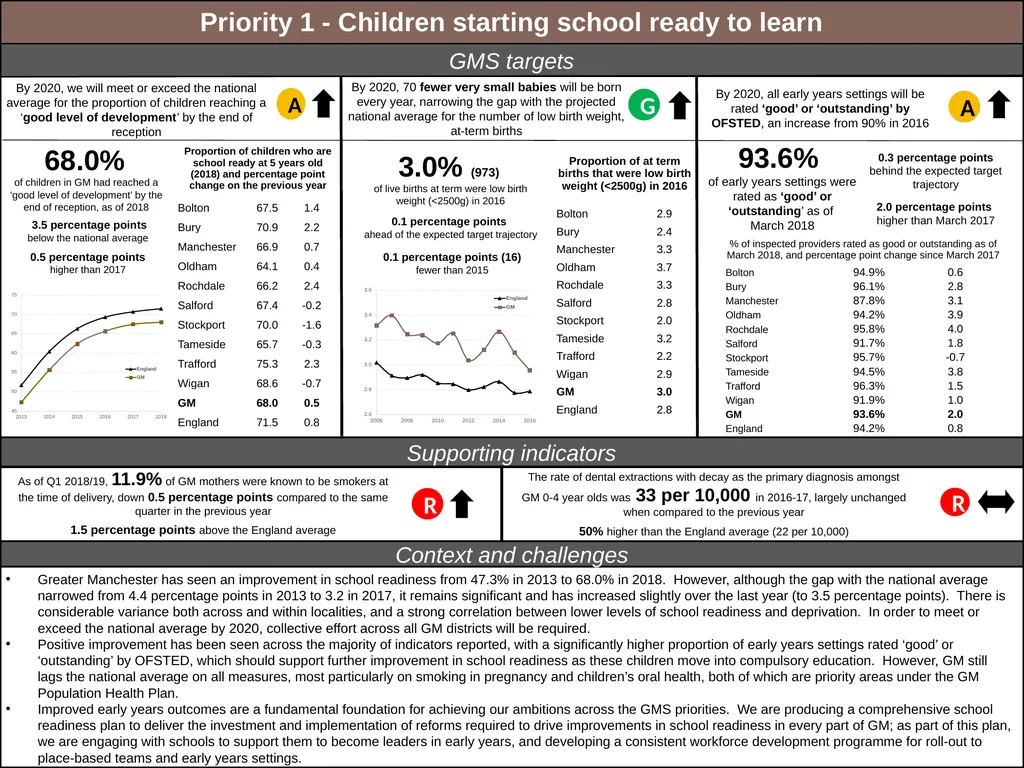
Supporting indicators Context and challenges Priority 1 - Children starting school ready to learn GMS targets 68.0%
of children in GM had reached a ‘good level of development’ by the end of reception, as of 2018 As of Q1 2018/19, 11.9% of GM mothers were known to be smokers at the time of delivery, down 0.5 percentage points compared to the same quarter in the previous year
1.5 percentage points above the England average 0.5 percentage points
higher than 2017 The rate of dental extractions with decay as the primary diagnosis amongst GM 0-4 year olds was 33 per 10,000 in 2016-17, largely unchanged when compared to the previous year
50% higher than the England average (22 per 10,000) 3.5 percentage points
below the national average 93.6%
of early years settings were rated as ‘good’ or ‘outstanding’ as of
March 2018 Greater Manchester has seen an improvement in school readiness from 47.3% in 2013 to 68.0% in 2018. However, although the gap with the national average narrowed from 4.4 percentage points in 2013 to 3.2 in 2017, it remains significant and has increased slightly over the last year (to 3.5 percentage points). There is considerable variance both across and within localities, and a strong correlation between lower levels of school readiness and deprivation. In order to meet or exceed the national average by 2020, collective effort across all GM districts will be required.
Positive improvement has been seen across the majority of indicators reported, with a significantly higher proportion of early years settings rated ‘good’ or ‘outstanding’ by OFSTED, which should support further improvement in school readiness as these children move into compulsory education. However, GM still lags the national average on all measures, most particularly on smoking in pregnancy and children’s oral health, both of which are priority areas under the GM Population Health Plan.
Improved early years outcomes are a fundamental foundation for achieving our ambitions across the GMS priorities. We are producing a comprehensive school readiness plan to deliver the investment and implementation of reforms required to drive improvements in school readiness in every part of GM; as part of this plan, we are engaging with schools to support them to become leaders in early years, and developing a consistent workforce development programme for roll-out to place-based teams and early years settings. A 3.0% (973)
of live births at term were low birth weight (<2500g) in 2016 By 2020, we will meet or exceed the national average for the proportion of children reaching a ‘good level of development’ by the end of reception By 2020, 70 fewer very small babies will be born every year, narrowing the gap with the projected national average for the number of low birth weight, at-term births By 2020, all early years settings will be rated ‘good’ or ‘outstanding’ by OFSTED, an increase from 90% in 2016 0.1 percentage points
ahead of the expected target trajectory 0.1 percentage points (16)
fewer than 2015 2.0 percentage points
higher than March 2017 0.3 percentage points behind the expected target trajectory R G A R<br>
of children in GM had reached a ‘good level of development’ by the end of reception, as of 2018 As of Q1 2018/19, 11.9% of GM mothers were known to be smokers at the time of delivery, down 0.5 percentage points compared to the same quarter in the previous year
1.5 percentage points above the England average 0.5 percentage points
higher than 2017 The rate of dental extractions with decay as the primary diagnosis amongst GM 0-4 year olds was 33 per 10,000 in 2016-17, largely unchanged when compared to the previous year
50% higher than the England average (22 per 10,000) 3.5 percentage points
below the national average 93.6%
of early years settings were rated as ‘good’ or ‘outstanding’ as of
March 2018 Greater Manchester has seen an improvement in school readiness from 47.3% in 2013 to 68.0% in 2018. However, although the gap with the national average narrowed from 4.4 percentage points in 2013 to 3.2 in 2017, it remains significant and has increased slightly over the last year (to 3.5 percentage points). There is considerable variance both across and within localities, and a strong correlation between lower levels of school readiness and deprivation. In order to meet or exceed the national average by 2020, collective effort across all GM districts will be required.
Positive improvement has been seen across the majority of indicators reported, with a significantly higher proportion of early years settings rated ‘good’ or ‘outstanding’ by OFSTED, which should support further improvement in school readiness as these children move into compulsory education. However, GM still lags the national average on all measures, most particularly on smoking in pregnancy and children’s oral health, both of which are priority areas under the GM Population Health Plan.
Improved early years outcomes are a fundamental foundation for achieving our ambitions across the GMS priorities. We are producing a comprehensive school readiness plan to deliver the investment and implementation of reforms required to drive improvements in school readiness in every part of GM; as part of this plan, we are engaging with schools to support them to become leaders in early years, and developing a consistent workforce development programme for roll-out to place-based teams and early years settings. A 3.0% (973)
of live births at term were low birth weight (<2500g) in 2016 By 2020, we will meet or exceed the national average for the proportion of children reaching a ‘good level of development’ by the end of reception By 2020, 70 fewer very small babies will be born every year, narrowing the gap with the projected national average for the number of low birth weight, at-term births By 2020, all early years settings will be rated ‘good’ or ‘outstanding’ by OFSTED, an increase from 90% in 2016 0.1 percentage points
ahead of the expected target trajectory 0.1 percentage points (16)
fewer than 2015 2.0 percentage points
higher than March 2017 0.3 percentage points behind the expected target trajectory R G A R<br>
07
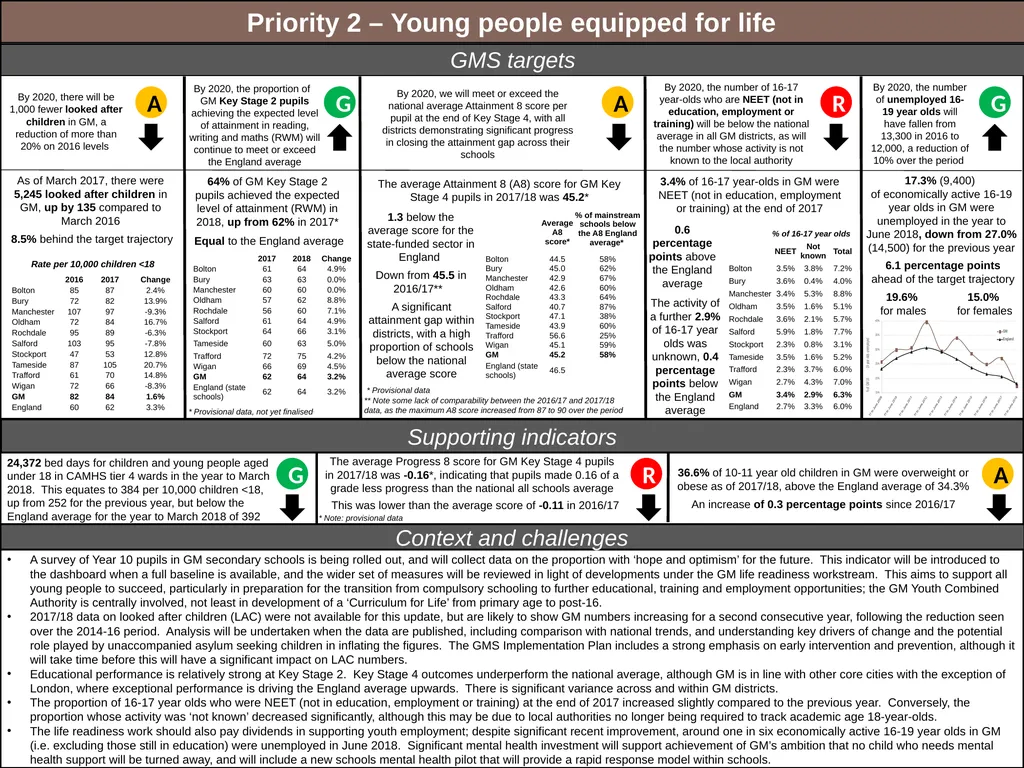
By 2020, we will meet or exceed the national average Attainment 8 score per pupil at the end of Key Stage 4, with all districts demonstrating significant progress in closing the attainment gap across their schools As of March 2017, there were 5,245 looked after children in GM, up by 135 compared to March 2016
8.5% behind the target trajectory 24,372 bed days for children and young people aged under 18 in CAMHS tier 4 wards in the year to March 2018. This equates to 384 per 10,000 children <18, up from 252 for the previous year, but below the England average for the year to March 2018 of 392 36.6% of 10-11 year old children in GM were overweight or obese as of 2017/18, above the England average of 34.3%
An increase of 0.3 percentage points since 2016/17 The average Attainment 8 (A8) score for GM Key Stage 4 pupils in 2017/18 was 45.2* 1.3 below the average score for the state-funded sector in England 64% of GM Key Stage 2 pupils achieved the expected level of attainment (RWM) in 2018, up from 62% in 2017* 3.4% of 16-17 year-olds in GM were NEET (not in education, employment or training) at the end of 2017 The activity of a further 2.9% of 16-17 year olds was unknown, 0.4 percentage points below the England average A Supporting indicators Context and challenges Priority 2 – Young people equipped for life GMS targets By 2020, the number of 16-17 year-olds who are NEET (not in education, employment or training) will be below the national average in all GM districts, as will the number whose activity is not known to the local authority By 2020, there will be 1,000 fewer looked after children in GM, a reduction of more than 20% on 2016 levels R By 2020, the number of unemployed 16-19 year olds will have fallen from 13,300 in 2016 to 12,000, a reduction of 10% over the period A 17.3% (9,400)
of economically active 16-19 year olds in GM were unemployed in the year to June 2018, down from 27.0% (14,500) for the previous year 19.6%
for males 15.0%
for females 6.1 percentage points ahead of the target trajectory G A Rate per 10,000 children <18 0.6 percentage points above the England average % of 16-17 year olds A survey of Year 10 pupils in GM secondary schools is being rolled out, and will collect data on the proportion with ‘hope and optimism’ for the future. This indicator will be introduced to the dashboard when a full baseline is available, and the wider set of measures will be reviewed in light of developments under the GM life readiness workstream. This aims to support all young people to succeed, particularly in preparation for the transition from compulsory schooling to further educational, training and employment opportunities; the GM Youth Combined Authority is centrally involved, not least in development of a ‘Curriculum for Life’ from primary age to post-16.
2017/18 data on looked after children (LAC) were not available for this update, but are likely to show GM numbers increasing for a second consecutive year, following the reduction seen over the 2014-16 period. Analysis will be undertaken when the data are published, including comparison with national trends, and understanding key drivers of change and the potential role played by unaccompanied asylum seeking children in inflating the figures. The GMS Implementation Plan includes a strong emphasis on early intervention and prevention, although it will take time before this will have a significant impact on LAC numbers.
Educational performance is relatively strong at Key Stage 2. Key Stage 4 outcomes underperform the national average, although GM is in line with other core cities with the exception of London, where exceptional performance is driving the England average upwards. There is significant variance across and within GM districts.
The proportion of 16-17 year olds who were NEET (not in education, employment or training) at the end of 2017 increased slightly compared to the previous year. Conversely, the proportion whose activity was ‘not known’ decreased significantly, although this may be due to local authorities no longer being required to track academic age 18-year-olds.
The life readiness work should also pay dividends in supporting youth employment; despite significant recent improvement, around one in six economically active 16-19 year olds in GM (i.e. excluding those still in education) were unemployed in June 2018. Significant mental health investment will support achievement of GM’s ambition that no child who needs mental health support will be turned away, and will include a new schools mental health pilot that will provide a rapid response model within schools. * Provisional data The average Progress 8 score for GM Key Stage 4 pupils in 2017/18 was -0.16*, indicating that pupils made 0.16 of a grade less progress than the national all schools average
This was lower than the average score of -0.11 in 2016/17 G By 2020, the proportion of GM Key Stage 2 pupils achieving the expected level of attainment in reading, writing and maths (RWM) will continue to meet or exceed the England average Equal to the England average A significant attainment gap within districts, with a high proportion of schools below the national average score R * Provisional data, not yet finalised. G Down from 45.5 in 2016/17** * Note: provisional data ** Note some lack of comparability between the 2016/17 and 2017/18 data, as the maximum A8 score increased from 87 to 90 over the period<br>
8.5% behind the target trajectory 24,372 bed days for children and young people aged under 18 in CAMHS tier 4 wards in the year to March 2018. This equates to 384 per 10,000 children <18, up from 252 for the previous year, but below the England average for the year to March 2018 of 392 36.6% of 10-11 year old children in GM were overweight or obese as of 2017/18, above the England average of 34.3%
An increase of 0.3 percentage points since 2016/17 The average Attainment 8 (A8) score for GM Key Stage 4 pupils in 2017/18 was 45.2* 1.3 below the average score for the state-funded sector in England 64% of GM Key Stage 2 pupils achieved the expected level of attainment (RWM) in 2018, up from 62% in 2017* 3.4% of 16-17 year-olds in GM were NEET (not in education, employment or training) at the end of 2017 The activity of a further 2.9% of 16-17 year olds was unknown, 0.4 percentage points below the England average A Supporting indicators Context and challenges Priority 2 – Young people equipped for life GMS targets By 2020, the number of 16-17 year-olds who are NEET (not in education, employment or training) will be below the national average in all GM districts, as will the number whose activity is not known to the local authority By 2020, there will be 1,000 fewer looked after children in GM, a reduction of more than 20% on 2016 levels R By 2020, the number of unemployed 16-19 year olds will have fallen from 13,300 in 2016 to 12,000, a reduction of 10% over the period A 17.3% (9,400)
of economically active 16-19 year olds in GM were unemployed in the year to June 2018, down from 27.0% (14,500) for the previous year 19.6%
for males 15.0%
for females 6.1 percentage points ahead of the target trajectory G A Rate per 10,000 children <18 0.6 percentage points above the England average % of 16-17 year olds A survey of Year 10 pupils in GM secondary schools is being rolled out, and will collect data on the proportion with ‘hope and optimism’ for the future. This indicator will be introduced to the dashboard when a full baseline is available, and the wider set of measures will be reviewed in light of developments under the GM life readiness workstream. This aims to support all young people to succeed, particularly in preparation for the transition from compulsory schooling to further educational, training and employment opportunities; the GM Youth Combined Authority is centrally involved, not least in development of a ‘Curriculum for Life’ from primary age to post-16.
2017/18 data on looked after children (LAC) were not available for this update, but are likely to show GM numbers increasing for a second consecutive year, following the reduction seen over the 2014-16 period. Analysis will be undertaken when the data are published, including comparison with national trends, and understanding key drivers of change and the potential role played by unaccompanied asylum seeking children in inflating the figures. The GMS Implementation Plan includes a strong emphasis on early intervention and prevention, although it will take time before this will have a significant impact on LAC numbers.
Educational performance is relatively strong at Key Stage 2. Key Stage 4 outcomes underperform the national average, although GM is in line with other core cities with the exception of London, where exceptional performance is driving the England average upwards. There is significant variance across and within GM districts.
The proportion of 16-17 year olds who were NEET (not in education, employment or training) at the end of 2017 increased slightly compared to the previous year. Conversely, the proportion whose activity was ‘not known’ decreased significantly, although this may be due to local authorities no longer being required to track academic age 18-year-olds.
The life readiness work should also pay dividends in supporting youth employment; despite significant recent improvement, around one in six economically active 16-19 year olds in GM (i.e. excluding those still in education) were unemployed in June 2018. Significant mental health investment will support achievement of GM’s ambition that no child who needs mental health support will be turned away, and will include a new schools mental health pilot that will provide a rapid response model within schools. * Provisional data The average Progress 8 score for GM Key Stage 4 pupils in 2017/18 was -0.16*, indicating that pupils made 0.16 of a grade less progress than the national all schools average
This was lower than the average score of -0.11 in 2016/17 G By 2020, the proportion of GM Key Stage 2 pupils achieving the expected level of attainment in reading, writing and maths (RWM) will continue to meet or exceed the England average Equal to the England average A significant attainment gap within districts, with a high proportion of schools below the national average score R * Provisional data, not yet finalised. G Down from 45.5 in 2016/17** * Note: provisional data ** Note some lack of comparability between the 2016/17 and 2017/18 data, as the maximum A8 score increased from 87 to 90 over the period<br>
08
By 2020, more than 40,000 GM residents per annum will start an apprenticeship, and the achievement rate for apprenticeship programmes will reach 75%. This compares to 30,379 apprenticeship starts in 2015/16, and an achievement rate of 66.4% By 2020, there will be 70,000 more GM working-age residents with Level 4+ (degree level or equivalent) qualifications, an increase from 34.6% of the working-age population in 2016 to 38.3% By 2020, there will be at least 50,000 fewer GM working-age residents with qualifications below Level 2, a reduction from 27.7% of the working-age population in 2016 to 24.6% By 2020, median resident earnings (all employees) will exceed £23,000, up from £21,585 in 2016 A Median earnings of GM residents (all employees) were £22,565
per annum in 2018 18.2% of working age residents in GM had Level 3 as their highest level of qualification in 2017, above the England average of 17.3% and up from 18.0% the previous year G A A 35.0%
of GM working-age residents (620,000) had a Level 4+ qualification in 2017 27.2%
of GM working-age residents (480,000) had qualifications below Level 2 in 2017 £1,733 below the England median of £24,298 £536 higher than in
2017 (at current prices) 1.6% behind the expected target trajectory 0.4 percentage points (9,000) above the 2016 position 0.2% behind the expected target trajectory A decrease of
0.5 percentage points (7,000) since 2016 G 1.5% ahead of the
target trajectory Whilst GM skills levels have improved steadily since 2004, relative performance remains poor. There are identified skills gaps in several key sectors, including construction, digital and hospitality, along with some public service areas such as nursing. Policy is focused on reducing gaps and shortages, especially in ‘technical’ roles (Level 3 and 4).
GM will assume responsibility for Adult Education Budget (AEB) commissioning in 2019, providing further opportunity to target development of the skills required by local employers and key sectors, and to reduce the currently significant proportion of ‘second-chance’ provision and lower-level skills. Over time, this will also be supported by further improvements in ‘school readiness’ and subsequent attainment in compulsory education.
The downturn in apprenticeship starts is mirrored in the national data, and is driven by employer uncertainty over the introduction of the apprenticeship levy. An apprenticeship action plan has been developed to increase both quality and volumes, and includes an SME support programme, a public sector apprenticeship approach and a new digital talent pipeline. Dialogue with government as part of the GM Local Industrial Strategy will focus on designing a system to meet local needs and address growth ambitions.
The ILO unemployment rate is at its lowest level for 15 years, although the roll-out of Universal Credit is inflating the claimant count as more people are required to look for work. By August 2018, Working Well had supported more than 3,200 people into employment, and the new Work and Health programme had received over 3,000 referrals. The GM Employer Charter is being co-designed with employers and employees, and will support achievement of GM’s ‘good work’ ambitions. 4.6% of economically active GM working-age residents were unemployed in the year to June 2018, above the England average of 4.3%, but down from 5.6% for the previous year 3.1% of GM working-age residents (55,000) were claiming unemployment benefits* in September 2018, above the England average of 2.2% and higher than the September 2017 rate of 2.6% * Job Seekers Allowance and unemployed Universal Credit claimants R There were
28,426
apprenticeship starts in 2016/17, 12.0% (3,900) behind the expected target trajectory, and down from 30,379 in 2015/16 The apprenticeship achievement rate in 2016/17 was 67.6%,
0.5 percentage points behind the expected target trajectory, but up 1.2 percentage points compared to 2015/16 R A<br>
per annum in 2018 18.2% of working age residents in GM had Level 3 as their highest level of qualification in 2017, above the England average of 17.3% and up from 18.0% the previous year G A A 35.0%
of GM working-age residents (620,000) had a Level 4+ qualification in 2017 27.2%
of GM working-age residents (480,000) had qualifications below Level 2 in 2017 £1,733 below the England median of £24,298 £536 higher than in
2017 (at current prices) 1.6% behind the expected target trajectory 0.4 percentage points (9,000) above the 2016 position 0.2% behind the expected target trajectory A decrease of
0.5 percentage points (7,000) since 2016 G 1.5% ahead of the
target trajectory Whilst GM skills levels have improved steadily since 2004, relative performance remains poor. There are identified skills gaps in several key sectors, including construction, digital and hospitality, along with some public service areas such as nursing. Policy is focused on reducing gaps and shortages, especially in ‘technical’ roles (Level 3 and 4).
GM will assume responsibility for Adult Education Budget (AEB) commissioning in 2019, providing further opportunity to target development of the skills required by local employers and key sectors, and to reduce the currently significant proportion of ‘second-chance’ provision and lower-level skills. Over time, this will also be supported by further improvements in ‘school readiness’ and subsequent attainment in compulsory education.
The downturn in apprenticeship starts is mirrored in the national data, and is driven by employer uncertainty over the introduction of the apprenticeship levy. An apprenticeship action plan has been developed to increase both quality and volumes, and includes an SME support programme, a public sector apprenticeship approach and a new digital talent pipeline. Dialogue with government as part of the GM Local Industrial Strategy will focus on designing a system to meet local needs and address growth ambitions.
The ILO unemployment rate is at its lowest level for 15 years, although the roll-out of Universal Credit is inflating the claimant count as more people are required to look for work. By August 2018, Working Well had supported more than 3,200 people into employment, and the new Work and Health programme had received over 3,000 referrals. The GM Employer Charter is being co-designed with employers and employees, and will support achievement of GM’s ‘good work’ ambitions. 4.6% of economically active GM working-age residents were unemployed in the year to June 2018, above the England average of 4.3%, but down from 5.6% for the previous year 3.1% of GM working-age residents (55,000) were claiming unemployment benefits* in September 2018, above the England average of 2.2% and higher than the September 2017 rate of 2.6% * Job Seekers Allowance and unemployed Universal Credit claimants R There were
28,426
apprenticeship starts in 2016/17, 12.0% (3,900) behind the expected target trajectory, and down from 30,379 in 2015/16 The apprenticeship achievement rate in 2016/17 was 67.6%,
0.5 percentage points behind the expected target trajectory, but up 1.2 percentage points compared to 2015/16 R A<br>
09
By 2020, GVA per job will have increased by at least 6%, compared to the 2015 baseline* By 2020, 60,000 more GM employees will be earning above the Real Living Wage, an increase from 75.6% of employee jobs in 2016 to 80% By 2020, 21,500 more GM residents will be in employment, relative to a 2016 baseline of 1,273,000 By 2020, there will be at least 5,000 more business start-ups pa compared to 2015 levels, an increase from 90 start-ups per 10,000 GM working-age residents to 117 or more By 2020, GVA generated from inward investment job creation and safeguarding will be £310m, up from £290m in 2016/17 78.2%
of employee jobs (>18) working in GM (880,000) were
earning above the Real Living Wage* in 2017 There were 631 enterprises per 10,000 working age residents in GM in 2016, below the England average of 717, up from 578 in 2015 3.1% (40,000) ahead of the target trajectory The business start-up rate was 115
per 10,000 WAP in 2016 (20,500 business births pa) £337m
in GVA was generated from inward investment (domestic and FDI) job creation and safeguarding in GM in 2017/18 GVA per job* was
£44,072
in 2016
(GMFM-2018) R Down from £44,172 in 2015 £474 behind the target trajectory, and nearly £5,000 per job below the 2016 UK average of £49,050 2.6 percentage points (60,000) higher than in 2016 5.7% (50,000) ahead of the target trajectory 1,324,000
GM residents (16+)
were in employment in the year to June 2018 2.5% (32,000) higher than in June 2017 An increase from 90 in 2015 (4,600 additional births) 16.5% (3,500 births) ahead of the target trajectory 14.3% ahead of the target trajectory, and up £46m from 2016/17 * As defined by the Living Wage Foundation G G GMFM-2018 outputs show that productivity in GM declined slightly between 2015 and 2016, as it did for the UK as a whole. The GM productivity gap continues, with GVA per job in GM hovering consistently at around 90% of the UK average over the last decade. If GVA per head in GM were the same as the national average, GM’s economy would be a fifth larger. GM’s Local Industrial Strategy will take a deep-dive into productivity performance, and identify key policy levers that could enhance future growth.
Good performance against the other GMS headline targets in part reflects the conservative nature of these targets, which were developed in 2017 and align with the cautious forecasts outlined in the 2017 Greater Manchester Forecasting Model (GMFM) in light of Brexit uncertainty. To date, the GM economy has proved more resilient than anticipated, although Brexit could have a significant dampening effect moving forward – government forecasts suggest that GDP in the North West will be between 2.5% and 12% lower over the next 15 years, depending on the nature of the trade deal we agree with the EU.
New data for the Real Living Wage, business start-ups and business density (number of enterprises per 10,000 working-age residents) measures have not yet been released. Employment outcomes for the adult population are positive, and the June 2018 gap of 1.0 percentage points between the GM employment rate and the England average is the lowest for more than a decade. However, between June 2017 and June 2018 the employment rate decreased in 3 districts, and employment of disabled people and residents from ethnic minority groups is well below national rates, illustrating the need to address distributional variation in growth across GM. Growth in the regional centre, strategic employment sites and town centres will be driven by a range of activity including the Local Industrial Strategy, Productivity and Inclusive Growth programme, and the Town Centre Challenge. The employment rate for working age residents in GM from ethnic minority groups was 59.6% in the year to June 2018, below the England average of 65.5%, but broadly comparable to the previous year (59.8%) The employment rate for working age residents in GM with a disability* was 48.8% in the year to June 2018, below the England average of 53.7%, up from 47.0% in the previous year A * Equality Act core or work-limiting disabled G * All GVA data quoted at constant 2015 prices G A * Note: the original target and baseline have been redefined due to methodological changes in GVA measurement, but the scale of the targeted increase remains unchanged R<br>
of employee jobs (>18) working in GM (880,000) were
earning above the Real Living Wage* in 2017 There were 631 enterprises per 10,000 working age residents in GM in 2016, below the England average of 717, up from 578 in 2015 3.1% (40,000) ahead of the target trajectory The business start-up rate was 115
per 10,000 WAP in 2016 (20,500 business births pa) £337m
in GVA was generated from inward investment (domestic and FDI) job creation and safeguarding in GM in 2017/18 GVA per job* was
£44,072
in 2016
(GMFM-2018) R Down from £44,172 in 2015 £474 behind the target trajectory, and nearly £5,000 per job below the 2016 UK average of £49,050 2.6 percentage points (60,000) higher than in 2016 5.7% (50,000) ahead of the target trajectory 1,324,000
GM residents (16+)
were in employment in the year to June 2018 2.5% (32,000) higher than in June 2017 An increase from 90 in 2015 (4,600 additional births) 16.5% (3,500 births) ahead of the target trajectory 14.3% ahead of the target trajectory, and up £46m from 2016/17 * As defined by the Living Wage Foundation G G GMFM-2018 outputs show that productivity in GM declined slightly between 2015 and 2016, as it did for the UK as a whole. The GM productivity gap continues, with GVA per job in GM hovering consistently at around 90% of the UK average over the last decade. If GVA per head in GM were the same as the national average, GM’s economy would be a fifth larger. GM’s Local Industrial Strategy will take a deep-dive into productivity performance, and identify key policy levers that could enhance future growth.
Good performance against the other GMS headline targets in part reflects the conservative nature of these targets, which were developed in 2017 and align with the cautious forecasts outlined in the 2017 Greater Manchester Forecasting Model (GMFM) in light of Brexit uncertainty. To date, the GM economy has proved more resilient than anticipated, although Brexit could have a significant dampening effect moving forward – government forecasts suggest that GDP in the North West will be between 2.5% and 12% lower over the next 15 years, depending on the nature of the trade deal we agree with the EU.
New data for the Real Living Wage, business start-ups and business density (number of enterprises per 10,000 working-age residents) measures have not yet been released. Employment outcomes for the adult population are positive, and the June 2018 gap of 1.0 percentage points between the GM employment rate and the England average is the lowest for more than a decade. However, between June 2017 and June 2018 the employment rate decreased in 3 districts, and employment of disabled people and residents from ethnic minority groups is well below national rates, illustrating the need to address distributional variation in growth across GM. Growth in the regional centre, strategic employment sites and town centres will be driven by a range of activity including the Local Industrial Strategy, Productivity and Inclusive Growth programme, and the Town Centre Challenge. The employment rate for working age residents in GM from ethnic minority groups was 59.6% in the year to June 2018, below the England average of 65.5%, but broadly comparable to the previous year (59.8%) The employment rate for working age residents in GM with a disability* was 48.8% in the year to June 2018, below the England average of 53.7%, up from 47.0% in the previous year A * Equality Act core or work-limiting disabled G * All GVA data quoted at constant 2015 prices G A * Note: the original target and baseline have been redefined due to methodological changes in GVA measurement, but the scale of the targeted increase remains unchanged R<br>
10
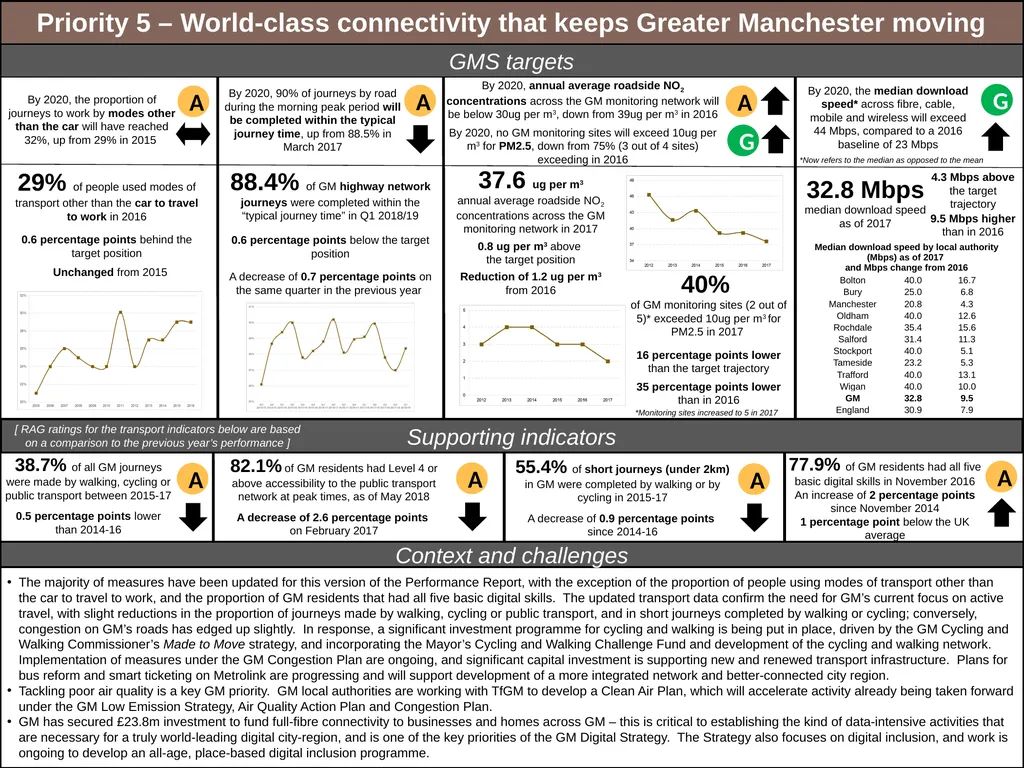
29% of people used modes of transport other than the car to travel to work in 2016
0.6 percentage points behind the target position Unchanged from 2015 38.7% of all GM journeys were made by walking, cycling or public transport between 2015-17
0.5 percentage points lower than 2014-16 88.4% of GM highway network journeys were completed within the “typical journey time” in Q1 2018/19
0.6 percentage points below the target position
A decrease of 0.7 percentage points on the same quarter in the previous year 82.1% of GM residents had Level 4 or above accessibility to the public transport network at peak times, as of May 2018
A decrease of 2.6 percentage points
on February 2017 55.4% of short journeys (under 2km) in GM were completed by walking or by cycling in 2015-17
A decrease of 0.9 percentage points
since 2014-16 By 2020, the proportion of journeys to work by modes other than the car will have reached 32%, up from 29% in 2015 By 2020, 90% of journeys by road during the morning peak period will be completed within the typical journey time, up from 88.5% in March 2017 By 2020, annual average roadside NO2 concentrations across the GM monitoring network will be below 30ug per m3, down from 39ug per m3 in 2016
By 2020, no GM monitoring sites will exceed 10ug per m3 for PM2.5, down from 75% (3 out of 4 sites) exceeding in 2016 A [ RAG ratings for the transport indicators below are based on a comparison to the previous year’s performance ] 77.9% of GM residents had all five basic digital skills in November 2016
An increase of 2 percentage points since November 2014
1 percentage point below the UK average By 2020, the median download speed* across fibre, cable, mobile and wireless will exceed 44 Mbps, compared to a 2016 baseline of 23 Mbps 32.8 Mbps
median download speed as of 2017 4.3 Mbps above the target trajectory 9.5 Mbps higher than in 2016 A The majority of measures have been updated for this version of the Performance Report, with the exception of the proportion of people using modes of transport other than the car to travel to work, and the proportion of GM residents that had all five basic digital skills. The updated transport data confirm the need for GM’s current focus on active travel, with slight reductions in the proportion of journeys made by walking, cycling or public transport, and in short journeys completed by walking or cycling; conversely, congestion on GM’s roads has edged up slightly. In response, a significant investment programme for cycling and walking is being put in place, driven by the GM Cycling and Walking Commissioner’s Made to Move strategy, and incorporating the Mayor’s Cycling and Walking Challenge Fund and development of the cycling and walking network. Implementation of measures under the GM Congestion Plan are ongoing, and significant capital investment is supporting new and renewed transport infrastructure. Plans for bus reform and smart ticketing on Metrolink are progressing and will support development of a more integrated network and better-connected city region.
Tackling poor air quality is a key GM priority. GM local authorities are working with TfGM to develop a Clean Air Plan, which will accelerate activity already being taken forward under the GM Low Emission Strategy, Air Quality Action Plan and Congestion Plan.
GM has secured £23.8m investment to fund full-fibre connectivity to businesses and homes across GM – this is critical to establishing the kind of data-intensive activities that are necessary for a truly world-leading digital city-region, and is one of the key priorities of the GM Digital Strategy. The Strategy also focuses on digital inclusion, and work is ongoing to develop an all-age, place-based digital inclusion programme. 37.6 ug per m3
annual average roadside NO2 concentrations across the GM monitoring network in 2017
0.8 ug per m3 above
the target position
Reduction of 1.2 ug per m3
from 2016 A 40%
of GM monitoring sites (2 out of 5)* exceeded 10ug per m3 for PM2.5 in 2017
16 percentage points lower than the target trajectory
35 percentage points lower than in 2016 A A A A G *Monitoring sites increased to 5 in 2017 G *Now refers to the median as opposed to the mean<br>
0.6 percentage points behind the target position Unchanged from 2015 38.7% of all GM journeys were made by walking, cycling or public transport between 2015-17
0.5 percentage points lower than 2014-16 88.4% of GM highway network journeys were completed within the “typical journey time” in Q1 2018/19
0.6 percentage points below the target position
A decrease of 0.7 percentage points on the same quarter in the previous year 82.1% of GM residents had Level 4 or above accessibility to the public transport network at peak times, as of May 2018
A decrease of 2.6 percentage points
on February 2017 55.4% of short journeys (under 2km) in GM were completed by walking or by cycling in 2015-17
A decrease of 0.9 percentage points
since 2014-16 By 2020, the proportion of journeys to work by modes other than the car will have reached 32%, up from 29% in 2015 By 2020, 90% of journeys by road during the morning peak period will be completed within the typical journey time, up from 88.5% in March 2017 By 2020, annual average roadside NO2 concentrations across the GM monitoring network will be below 30ug per m3, down from 39ug per m3 in 2016
By 2020, no GM monitoring sites will exceed 10ug per m3 for PM2.5, down from 75% (3 out of 4 sites) exceeding in 2016 A [ RAG ratings for the transport indicators below are based on a comparison to the previous year’s performance ] 77.9% of GM residents had all five basic digital skills in November 2016
An increase of 2 percentage points since November 2014
1 percentage point below the UK average By 2020, the median download speed* across fibre, cable, mobile and wireless will exceed 44 Mbps, compared to a 2016 baseline of 23 Mbps 32.8 Mbps
median download speed as of 2017 4.3 Mbps above the target trajectory 9.5 Mbps higher than in 2016 A The majority of measures have been updated for this version of the Performance Report, with the exception of the proportion of people using modes of transport other than the car to travel to work, and the proportion of GM residents that had all five basic digital skills. The updated transport data confirm the need for GM’s current focus on active travel, with slight reductions in the proportion of journeys made by walking, cycling or public transport, and in short journeys completed by walking or cycling; conversely, congestion on GM’s roads has edged up slightly. In response, a significant investment programme for cycling and walking is being put in place, driven by the GM Cycling and Walking Commissioner’s Made to Move strategy, and incorporating the Mayor’s Cycling and Walking Challenge Fund and development of the cycling and walking network. Implementation of measures under the GM Congestion Plan are ongoing, and significant capital investment is supporting new and renewed transport infrastructure. Plans for bus reform and smart ticketing on Metrolink are progressing and will support development of a more integrated network and better-connected city region.
Tackling poor air quality is a key GM priority. GM local authorities are working with TfGM to develop a Clean Air Plan, which will accelerate activity already being taken forward under the GM Low Emission Strategy, Air Quality Action Plan and Congestion Plan.
GM has secured £23.8m investment to fund full-fibre connectivity to businesses and homes across GM – this is critical to establishing the kind of data-intensive activities that are necessary for a truly world-leading digital city-region, and is one of the key priorities of the GM Digital Strategy. The Strategy also focuses on digital inclusion, and work is ongoing to develop an all-age, place-based digital inclusion programme. 37.6 ug per m3
annual average roadside NO2 concentrations across the GM monitoring network in 2017
0.8 ug per m3 above
the target position
Reduction of 1.2 ug per m3
from 2016 A 40%
of GM monitoring sites (2 out of 5)* exceeded 10ug per m3 for PM2.5 in 2017
16 percentage points lower than the target trajectory
35 percentage points lower than in 2016 A A A A G *Monitoring sites increased to 5 in 2017 G *Now refers to the median as opposed to the mean<br>
11
By 2020, more than 10,000 net additional dwellings will be built per annum, up from 6,190 in 2015/16 End rough sleeping by 2020, from an estimated 189 rough sleepers in 2016 7,892 net new additional dwellings in GM in 2016/17
940 dwellings ahead of the target trajectory An estimated 268 rough sleepers in GM in 2017, or 0.23 per 1,000 households In 2016/17, 0.9% of GM housing stock (10,827 properties) had been empty for over 6 months, compared to 0.86% for England as a whole
A decrease of 323 properties since 2015/16 In Q1 2018, positive action was successful in preventing or relieving homelessness in 4,871 cases, a rate of 4.1 per 1,000 households, compared to 2.4 for England as a whole
Up on the previous year by 116 cases Note: this indicator is drawn from responses to Understanding Society, the UK Household Longitudinal Survey. The indicator may be modified to gather more timely data using responses from a proposed GM residents’ survey In December 2017, the ratio of lower quartile house prices to median incomes in GM was 4.3, compared to the England average of 5.2
Affordability in GM declined slightly compared to 2016, when the ratio was 4.1 R R A further 1,706 new dwellings compared to 2015-16 Up from 189 in 2016 G G Above the England average of 0.20 per 1,000 households, with individual districts (particularly Manchester and Salford) significantly above In 2016, 93.5% of GM residents stated that they “liked the neighbourhood” they live in, compared to 94.9% nationally, an increase of 1.0 percentage point from 2013 A In March 2018, there were 238,600 people in receipt of housing benefit or households in receipt of the housing element of Universal Credit, a rate of 85 per 1,000 of the population, compared to 71 nationally.
The gap between GM and the national average closed by 9% when compared to
March 2017 G The majority of measures that have been updated for this version of the Performance Report show positive progress, including a reduction in the proportion of empty properties, closing of the gap with the national average for the number of people claiming housing benefit (albeit that a significant gap remains), and an increase in the proportion of residents stating that they ‘liked the neighbourhood’ where they lived.
Consultation on the revised Greater Manchester Spatial Framework (GMSF) will take place in autumn 2018, with the aim of ensuring that we have the right land available in the right places to deliver the homes and jobs needed by the city-region up to 2035. The headline measure on net additional dwellings has not updated for this Performance Report, but the significant increase between 2015/16 and 2016/17 indicated that we were on track towards the target of delivering more than 10,000 new homes by 2020.
The rough sleepers data (which have also not yet updated) are not particularly robust, and local intelligence suggests that there may be as many as 500 rough sleepers across GM, around double the official count. Despite some success in alleviating rough sleeping, there remains an ‘on-flow’ of people onto the streets, negating against a reduction in overall numbers. A three-year strategy to end rough sleeping and reduce homelessness has been agreed, driven by the GM Homelessness Action Network, and our rough sleeping social impact bond had resettled 112 rough sleepers by August 2018. Winter planning is a key focus, and it is imperative to ensure that sufficient cold weather provision is in place across GM so we can provide accommodation for those who need it. Homelessness prevention activity includes the development of pathways for key groups, including young people, ex-offenders and people with mental health needs. Work is also ongoing to improve our intelligence on rough sleeping and homelessness – more robust and timely data is necessary to track the amount of available accommodation and understand how this relates to the number of rough sleepers at a particular point in time.<br>
940 dwellings ahead of the target trajectory An estimated 268 rough sleepers in GM in 2017, or 0.23 per 1,000 households In 2016/17, 0.9% of GM housing stock (10,827 properties) had been empty for over 6 months, compared to 0.86% for England as a whole
A decrease of 323 properties since 2015/16 In Q1 2018, positive action was successful in preventing or relieving homelessness in 4,871 cases, a rate of 4.1 per 1,000 households, compared to 2.4 for England as a whole
Up on the previous year by 116 cases Note: this indicator is drawn from responses to Understanding Society, the UK Household Longitudinal Survey. The indicator may be modified to gather more timely data using responses from a proposed GM residents’ survey In December 2017, the ratio of lower quartile house prices to median incomes in GM was 4.3, compared to the England average of 5.2
Affordability in GM declined slightly compared to 2016, when the ratio was 4.1 R R A further 1,706 new dwellings compared to 2015-16 Up from 189 in 2016 G G Above the England average of 0.20 per 1,000 households, with individual districts (particularly Manchester and Salford) significantly above In 2016, 93.5% of GM residents stated that they “liked the neighbourhood” they live in, compared to 94.9% nationally, an increase of 1.0 percentage point from 2013 A In March 2018, there were 238,600 people in receipt of housing benefit or households in receipt of the housing element of Universal Credit, a rate of 85 per 1,000 of the population, compared to 71 nationally.
The gap between GM and the national average closed by 9% when compared to
March 2017 G The majority of measures that have been updated for this version of the Performance Report show positive progress, including a reduction in the proportion of empty properties, closing of the gap with the national average for the number of people claiming housing benefit (albeit that a significant gap remains), and an increase in the proportion of residents stating that they ‘liked the neighbourhood’ where they lived.
Consultation on the revised Greater Manchester Spatial Framework (GMSF) will take place in autumn 2018, with the aim of ensuring that we have the right land available in the right places to deliver the homes and jobs needed by the city-region up to 2035. The headline measure on net additional dwellings has not updated for this Performance Report, but the significant increase between 2015/16 and 2016/17 indicated that we were on track towards the target of delivering more than 10,000 new homes by 2020.
The rough sleepers data (which have also not yet updated) are not particularly robust, and local intelligence suggests that there may be as many as 500 rough sleepers across GM, around double the official count. Despite some success in alleviating rough sleeping, there remains an ‘on-flow’ of people onto the streets, negating against a reduction in overall numbers. A three-year strategy to end rough sleeping and reduce homelessness has been agreed, driven by the GM Homelessness Action Network, and our rough sleeping social impact bond had resettled 112 rough sleepers by August 2018. Winter planning is a key focus, and it is imperative to ensure that sufficient cold weather provision is in place across GM so we can provide accommodation for those who need it. Homelessness prevention activity includes the development of pathways for key groups, including young people, ex-offenders and people with mental health needs. Work is also ongoing to improve our intelligence on rough sleeping and homelessness – more robust and timely data is necessary to track the amount of available accommodation and understand how this relates to the number of rough sleepers at a particular point in time.<br>
12
By 2020, GM will have reduced CO2 emissions to 11mt, down from 13.6mt in 2014 By 2020, we will have halved the gap with the national average for the proportion of GM residents reporting that they visited the natural environment at least once during the previous seven days By 2020, participation at cultural events and venues will be growing by at least 5% pa By 2020, 50% of waste in GM will be recycled and 90% diverted, up from 46.7% and 88% respectively in 2016/17 By 2020, the GM visitor economy will be valued at £8.8bn, up from £7.9bn in 2015 94,000 FTE jobs supported by Greater Manchester’s tourism
industry in 2016
100 more FTEs than in 2015 £904m generated by the conference and business events sector in 2017* 46.7%
of waste recycled
in 2016/17
An increase of
2.5 percentage points
on the previous year 88%
of waste diverted
in 2016/17
An increase of
5 percentage
points
on the previous year 12.5mt
of CO2 emissions in 2016, or 4.49t per capita £8.1bn
generated by the visitor economy in 2016
An increase of £0.2bn since 2015 80.3% of GM residents reported that they had high or very high life satisfaction in 2017/18 1.7 percentage points below the England average,
0.8 percentage points above the previous year A GM was ranked 24th
in the Anholt Brand Index in 2017
Up from 27nd in 2015 G 30,0085 renewable electricity generation installations in GM in June 2018, with a combined capacity of 127,528 kW.
22,675 kW higher than in June 2017,
52% lower per household than the England average. G 38%
of GM residents reported that they had visited the natural environment at least once during the previous seven days in 2015-16* 87.6% of GM lodgements had an energy efficiency rating of D or above (EPC/DEC) in Q2 2018 6.5 percentage point above the England average
3.9 percentage points higher than Q2 2017 944 accredited renewable heat incentives in August 2018 with a combined capacity (non-domestic only) of 53.8 MW.
2.5 MW higher than August 2017,
64% lower per household than the England average A reduction of 0.5mt since 2015 0.2mt ahead of the target trajectory of 12.7mt R 3.2m engagements by GM residents with cultural organisations supported by AGMA in 2017/18* 7.5% increase on 2016/17 levels An increase of 3 percentage points compared to 2014-15, but below the
2015-16 England average of 42% New data were available for around half of the Priority 7 measures reported above. Performance remains on track in terms of achieving the 2020 target for CO2 emissions, although much of the carbon reduction reported is due to national measures, decarbonisation of the grid, and warmer weather, which reduces the need for heating. We are now considering longer term ambitions, including progressing actions agreed at the March 2018 Green Summit.
GM still falls significantly behind the national average for local renewable energy production, although again the position has improved since previously reported. Our response includes proposals to create a GM Energy Company, development of a Smart Energy Plan, and piloting smart energy generation systems through an Energy Transition Region.
Reported life satisfaction in GM has seen a significant improvement, but remains below the national average. There is also considerable variance across GM districts.
The key challenge for the visitor economy is to maintain growth in day and staying visits. Business visits in particular have seen little recent growth. We need to remain competitive, increase our profile and introduce new product. Recruitment and retention of staff is an issue, and will be further exacerbated by Brexit.
Under the Great Place initiative, we are developing a new approach to assessing levels of engagement with culture, which will enable us to target our resources more effectively and address significant variation by geography and population group. Under the current methodology, engagement levels have increased, exceeding target expectations. * Looking to replace this with a more robust measure, potentially sourced from a new GM residents’ survey * This measure only covers participation in cultural provision by AGMA-funded organisations, and counts frequent attenders multiple times. We will use information from the Greater Manchester Resident survey and from analysis of Audience Finder data to set a new benchmark, which will measure successful delivery of the Greater Manchester Culture Strategy, from 2019 onwards. * Note: comparator data cannot be quoted due to methodological changes, therefore the trend indication is not shown. The RAG rating is based on a subjective assessment of performance. A<br>
industry in 2016
100 more FTEs than in 2015 £904m generated by the conference and business events sector in 2017* 46.7%
of waste recycled
in 2016/17
An increase of
2.5 percentage points
on the previous year 88%
of waste diverted
in 2016/17
An increase of
5 percentage
points
on the previous year 12.5mt
of CO2 emissions in 2016, or 4.49t per capita £8.1bn
generated by the visitor economy in 2016
An increase of £0.2bn since 2015 80.3% of GM residents reported that they had high or very high life satisfaction in 2017/18 1.7 percentage points below the England average,
0.8 percentage points above the previous year A GM was ranked 24th
in the Anholt Brand Index in 2017
Up from 27nd in 2015 G 30,0085 renewable electricity generation installations in GM in June 2018, with a combined capacity of 127,528 kW.
22,675 kW higher than in June 2017,
52% lower per household than the England average. G 38%
of GM residents reported that they had visited the natural environment at least once during the previous seven days in 2015-16* 87.6% of GM lodgements had an energy efficiency rating of D or above (EPC/DEC) in Q2 2018 6.5 percentage point above the England average
3.9 percentage points higher than Q2 2017 944 accredited renewable heat incentives in August 2018 with a combined capacity (non-domestic only) of 53.8 MW.
2.5 MW higher than August 2017,
64% lower per household than the England average A reduction of 0.5mt since 2015 0.2mt ahead of the target trajectory of 12.7mt R 3.2m engagements by GM residents with cultural organisations supported by AGMA in 2017/18* 7.5% increase on 2016/17 levels An increase of 3 percentage points compared to 2014-15, but below the
2015-16 England average of 42% New data were available for around half of the Priority 7 measures reported above. Performance remains on track in terms of achieving the 2020 target for CO2 emissions, although much of the carbon reduction reported is due to national measures, decarbonisation of the grid, and warmer weather, which reduces the need for heating. We are now considering longer term ambitions, including progressing actions agreed at the March 2018 Green Summit.
GM still falls significantly behind the national average for local renewable energy production, although again the position has improved since previously reported. Our response includes proposals to create a GM Energy Company, development of a Smart Energy Plan, and piloting smart energy generation systems through an Energy Transition Region.
Reported life satisfaction in GM has seen a significant improvement, but remains below the national average. There is also considerable variance across GM districts.
The key challenge for the visitor economy is to maintain growth in day and staying visits. Business visits in particular have seen little recent growth. We need to remain competitive, increase our profile and introduce new product. Recruitment and retention of staff is an issue, and will be further exacerbated by Brexit.
Under the Great Place initiative, we are developing a new approach to assessing levels of engagement with culture, which will enable us to target our resources more effectively and address significant variation by geography and population group. Under the current methodology, engagement levels have increased, exceeding target expectations. * Looking to replace this with a more robust measure, potentially sourced from a new GM residents’ survey * This measure only covers participation in cultural provision by AGMA-funded organisations, and counts frequent attenders multiple times. We will use information from the Greater Manchester Resident survey and from analysis of Audience Finder data to set a new benchmark, which will measure successful delivery of the Greater Manchester Culture Strategy, from 2019 onwards. * Note: comparator data cannot be quoted due to methodological changes, therefore the trend indication is not shown. The RAG rating is based on a subjective assessment of performance. A<br>
13
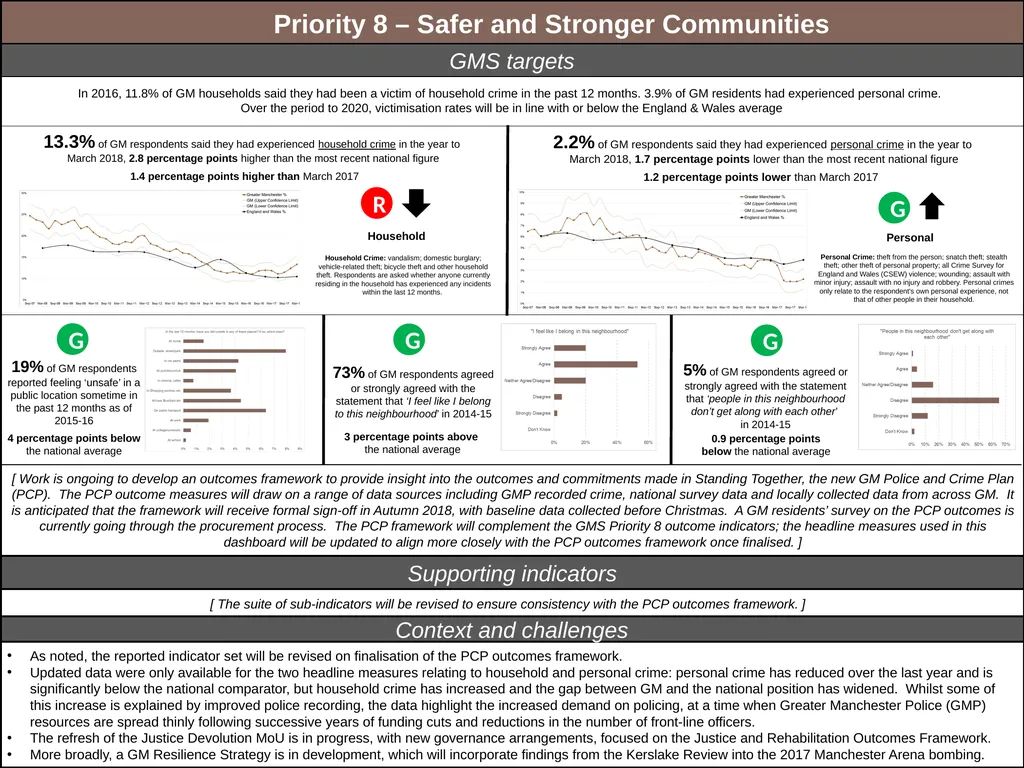
In 2016, 11.8% of GM households said they had been a victim of household crime in the past 12 months. 3.9% of GM residents had experienced personal crime.
Over the period to 2020, victimisation rates will be in line with or below the England & Wales average Household Crime: vandalism; domestic burglary; vehicle-related theft; bicycle theft and other household theft. Respondents are asked whether anyone currently residing in the household has experienced any incidents within the last 12 months. Personal Crime: theft from the person; snatch theft; stealth theft; other theft of personal property; all Crime Survey for England and Wales (CSEW) violence; wounding; assault with minor injury; assault with no injury and robbery. Personal crimes only relate to the respondent's own personal experience, not that of other people in their household. 13.3% of GM respondents said they had experienced household crime in the year to
March 2018, 2.8 percentage points higher than the most recent national figure 2.2% of GM respondents said they had experienced personal crime in the year to
March 2018, 1.7 percentage points lower than the most recent national figure 19% of GM respondents reported feeling ‘unsafe’ in a public location sometime in the past 12 months as of 2015-16 [ The suite of sub-indicators will be revised to ensure consistency with the PCP outcomes framework. ] [ Work is ongoing to develop an outcomes framework to provide insight into the outcomes and commitments made in Standing Together, the new GM Police and Crime Plan (PCP). The PCP outcome measures will draw on a range of data sources including GMP recorded crime, national survey data and locally collected data from across GM. It is anticipated that the framework will receive formal sign-off in Autumn 2018, with baseline data collected before Christmas. A GM residents’ survey on the PCP outcomes is currently going through the procurement process. The PCP framework will complement the GMS Priority 8 outcome indicators; the headline measures used in this dashboard will be updated to align more closely with the PCP outcomes framework once finalised. ] Household Personal G 1.4 percentage points higher than March 2017 1.2 percentage points lower than March 2017 73% of GM respondents agreed or strongly agreed with the statement that ‘I feel like I belong to this neighbourhood’ in 2014-15 5% of GM respondents agreed or strongly agreed with the statement that ‘people in this neighbourhood don’t get along with each other’
in 2014-15 G 4 percentage points below the national average G 3 percentage points above
the national average 0.9 percentage points below the national average G As noted, the reported indicator set will be revised on finalisation of the PCP outcomes framework.
Updated data were only available for the two headline measures relating to household and personal crime: personal crime has reduced over the last year and is significantly below the national comparator, but household crime has increased and the gap between GM and the national position has widened. Whilst some of this increase is explained by improved police recording, the data highlight the increased demand on policing, at a time when Greater Manchester Police (GMP) resources are spread thinly following successive years of funding cuts and reductions in the number of front-line officers.
The refresh of the Justice Devolution MoU is in progress, with new governance arrangements, focused on the Justice and Rehabilitation Outcomes Framework.
More broadly, a GM Resilience Strategy is in development, which will incorporate findings from the Kerslake Review into the 2017 Manchester Arena bombing. R<br>
Over the period to 2020, victimisation rates will be in line with or below the England & Wales average Household Crime: vandalism; domestic burglary; vehicle-related theft; bicycle theft and other household theft. Respondents are asked whether anyone currently residing in the household has experienced any incidents within the last 12 months. Personal Crime: theft from the person; snatch theft; stealth theft; other theft of personal property; all Crime Survey for England and Wales (CSEW) violence; wounding; assault with minor injury; assault with no injury and robbery. Personal crimes only relate to the respondent's own personal experience, not that of other people in their household. 13.3% of GM respondents said they had experienced household crime in the year to
March 2018, 2.8 percentage points higher than the most recent national figure 2.2% of GM respondents said they had experienced personal crime in the year to
March 2018, 1.7 percentage points lower than the most recent national figure 19% of GM respondents reported feeling ‘unsafe’ in a public location sometime in the past 12 months as of 2015-16 [ The suite of sub-indicators will be revised to ensure consistency with the PCP outcomes framework. ] [ Work is ongoing to develop an outcomes framework to provide insight into the outcomes and commitments made in Standing Together, the new GM Police and Crime Plan (PCP). The PCP outcome measures will draw on a range of data sources including GMP recorded crime, national survey data and locally collected data from across GM. It is anticipated that the framework will receive formal sign-off in Autumn 2018, with baseline data collected before Christmas. A GM residents’ survey on the PCP outcomes is currently going through the procurement process. The PCP framework will complement the GMS Priority 8 outcome indicators; the headline measures used in this dashboard will be updated to align more closely with the PCP outcomes framework once finalised. ] Household Personal G 1.4 percentage points higher than March 2017 1.2 percentage points lower than March 2017 73% of GM respondents agreed or strongly agreed with the statement that ‘I feel like I belong to this neighbourhood’ in 2014-15 5% of GM respondents agreed or strongly agreed with the statement that ‘people in this neighbourhood don’t get along with each other’
in 2014-15 G 4 percentage points below the national average G 3 percentage points above
the national average 0.9 percentage points below the national average G As noted, the reported indicator set will be revised on finalisation of the PCP outcomes framework.
Updated data were only available for the two headline measures relating to household and personal crime: personal crime has reduced over the last year and is significantly below the national comparator, but household crime has increased and the gap between GM and the national position has widened. Whilst some of this increase is explained by improved police recording, the data highlight the increased demand on policing, at a time when Greater Manchester Police (GMP) resources are spread thinly following successive years of funding cuts and reductions in the number of front-line officers.
The refresh of the Justice Devolution MoU is in progress, with new governance arrangements, focused on the Justice and Rehabilitation Outcomes Framework.
More broadly, a GM Resilience Strategy is in development, which will incorporate findings from the Kerslake Review into the 2017 Manchester Arena bombing. R<br>
14
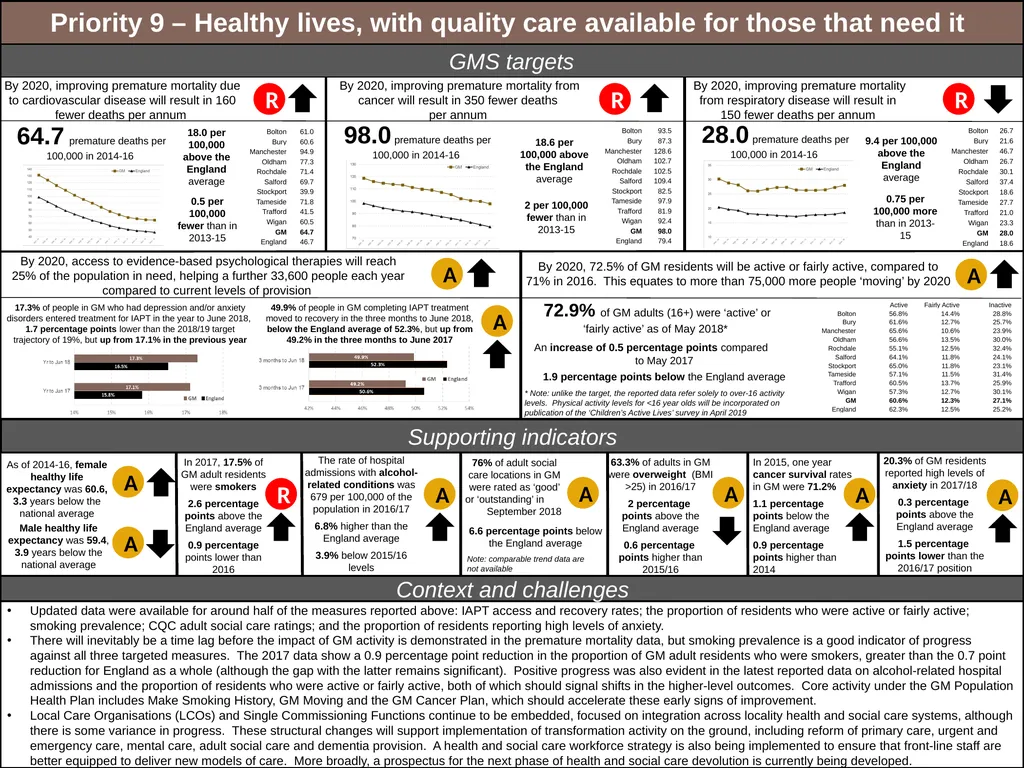
Male healthy life expectancy was 59.4, 3.9 years below the national average As of 2014-16, female healthy life expectancy was 60.6, 3.3 years below the national average 63.3% of adults in GM were overweight (BMI >25) in 2016/17
2 percentage
points above the England average
0.6 percentage
points higher than 2015/16 In 2015, one year cancer survival rates in GM were 71.2%
1.1 percentage points below the England average
0.9 percentage points higher than 2014 64.7 premature deaths per 100,000 in 2014-16 98.0 premature deaths per 100,000 in 2014-16 28.0 premature deaths per 100,000 in 2014-16 In 2017, 17.5% of GM adult residents were smokers
2.6 percentage points above the England average
0.9 percentage points lower than 2016 The rate of hospital admissions with alcohol-related conditions was 679 per 100,000 of the population in 2016/17
6.8% higher than the England average
3.9% below 2015/16 levels By 2020, improving premature mortality due to cardiovascular disease will result in 160 fewer deaths per annum By 2020, access to evidence-based psychological therapies will reach 25% of the population in need, helping a further 33,600 people each year compared to current levels of provision By 2020, 72.5% of GM residents will be active or fairly active, compared to 71% in 2016. This equates to more than 75,000 more people ‘moving’ by 2020 By 2020, improving premature mortality from respiratory disease will result in
150 fewer deaths per annum By 2020, improving premature mortality from cancer will result in 350 fewer deaths
per annum 18.0 per 100,000 above the England average 18.6 per 100,000 above the England average 9.4 per 100,000 above the England average 0.5 per 100,000 fewer than in 2013-15 2 per 100,000 fewer than in 2013-15 0.75 per 100,000 more
than in 2013-15 72.9% of GM adults (16+) were ‘active’ or ‘fairly active’ as of May 2018* 49.9% of people in GM completing IAPT treatment moved to recovery in the three months to June 2018, below the England average of 52.3%, but up from 49.2% in the three months to June 2017 17.3% of people in GM who had depression and/or anxiety disorders entered treatment for IAPT in the year to June 2018, 1.7 percentage points lower than the 2018/19 target trajectory of 19%, but up from 17.1% in the previous year * Note: unlike the target, the reported data refer solely to over-16 activity levels. Physical activity levels for <16 year olds will be incorporated on publication of the ‘Children’s Active Lives’ survey in April 2019 An increase of 0.5 percentage points compared to May 2017
1.9 percentage points below the England average 20.3% of GM residents reported high levels of anxiety in 2017/18
0.3 percentage
points above the England average
1.5 percentage
points lower than the 2016/17 position A R R R R Updated data were available for around half of the measures reported above: IAPT access and recovery rates; the proportion of residents who were active or fairly active; smoking prevalence; CQC adult social care ratings; and the proportion of residents reporting high levels of anxiety.
There will inevitably be a time lag before the impact of GM activity is demonstrated in the premature mortality data, but smoking prevalence is a good indicator of progress against all three targeted measures. The 2017 data show a 0.9 percentage point reduction in the proportion of GM adult residents who were smokers, greater than the 0.7 point reduction for England as a whole (although the gap with the latter remains significant). Positive progress was also evident in the latest reported data on alcohol-related hospital admissions and the proportion of residents who were active or fairly active, both of which should signal shifts in the higher-level outcomes. Core activity under the GM Population Health Plan includes Make Smoking History, GM Moving and the GM Cancer Plan, which should accelerate these early signs of improvement.
Local Care Organisations (LCOs) and Single Commissioning Functions continue to be embedded, focused on integration across locality health and social care systems, although there is some variance in progress. These structural changes will support implementation of transformation activity on the ground, including reform of primary care, urgent and emergency care, mental care, adult social care and dementia provision. A health and social care workforce strategy is also being implemented to ensure that front-line staff are better equipped to deliver new models of care. More broadly, a prospectus for the next phase of health and social care devolution is currently being developed. A A 76% of adult social care locations in GM were rated as ‘good’ or ‘outstanding’ in September 2018 A Note: comparable trend data are not available 6.6 percentage points below the England average A<br>
2 percentage
points above the England average
0.6 percentage
points higher than 2015/16 In 2015, one year cancer survival rates in GM were 71.2%
1.1 percentage points below the England average
0.9 percentage points higher than 2014 64.7 premature deaths per 100,000 in 2014-16 98.0 premature deaths per 100,000 in 2014-16 28.0 premature deaths per 100,000 in 2014-16 In 2017, 17.5% of GM adult residents were smokers
2.6 percentage points above the England average
0.9 percentage points lower than 2016 The rate of hospital admissions with alcohol-related conditions was 679 per 100,000 of the population in 2016/17
6.8% higher than the England average
3.9% below 2015/16 levels By 2020, improving premature mortality due to cardiovascular disease will result in 160 fewer deaths per annum By 2020, access to evidence-based psychological therapies will reach 25% of the population in need, helping a further 33,600 people each year compared to current levels of provision By 2020, 72.5% of GM residents will be active or fairly active, compared to 71% in 2016. This equates to more than 75,000 more people ‘moving’ by 2020 By 2020, improving premature mortality from respiratory disease will result in
150 fewer deaths per annum By 2020, improving premature mortality from cancer will result in 350 fewer deaths
per annum 18.0 per 100,000 above the England average 18.6 per 100,000 above the England average 9.4 per 100,000 above the England average 0.5 per 100,000 fewer than in 2013-15 2 per 100,000 fewer than in 2013-15 0.75 per 100,000 more
than in 2013-15 72.9% of GM adults (16+) were ‘active’ or ‘fairly active’ as of May 2018* 49.9% of people in GM completing IAPT treatment moved to recovery in the three months to June 2018, below the England average of 52.3%, but up from 49.2% in the three months to June 2017 17.3% of people in GM who had depression and/or anxiety disorders entered treatment for IAPT in the year to June 2018, 1.7 percentage points lower than the 2018/19 target trajectory of 19%, but up from 17.1% in the previous year * Note: unlike the target, the reported data refer solely to over-16 activity levels. Physical activity levels for <16 year olds will be incorporated on publication of the ‘Children’s Active Lives’ survey in April 2019 An increase of 0.5 percentage points compared to May 2017
1.9 percentage points below the England average 20.3% of GM residents reported high levels of anxiety in 2017/18
0.3 percentage
points above the England average
1.5 percentage
points lower than the 2016/17 position A R R R R Updated data were available for around half of the measures reported above: IAPT access and recovery rates; the proportion of residents who were active or fairly active; smoking prevalence; CQC adult social care ratings; and the proportion of residents reporting high levels of anxiety.
There will inevitably be a time lag before the impact of GM activity is demonstrated in the premature mortality data, but smoking prevalence is a good indicator of progress against all three targeted measures. The 2017 data show a 0.9 percentage point reduction in the proportion of GM adult residents who were smokers, greater than the 0.7 point reduction for England as a whole (although the gap with the latter remains significant). Positive progress was also evident in the latest reported data on alcohol-related hospital admissions and the proportion of residents who were active or fairly active, both of which should signal shifts in the higher-level outcomes. Core activity under the GM Population Health Plan includes Make Smoking History, GM Moving and the GM Cancer Plan, which should accelerate these early signs of improvement.
Local Care Organisations (LCOs) and Single Commissioning Functions continue to be embedded, focused on integration across locality health and social care systems, although there is some variance in progress. These structural changes will support implementation of transformation activity on the ground, including reform of primary care, urgent and emergency care, mental care, adult social care and dementia provision. A health and social care workforce strategy is also being implemented to ensure that front-line staff are better equipped to deliver new models of care. More broadly, a prospectus for the next phase of health and social care devolution is currently being developed. A A 76% of adult social care locations in GM were rated as ‘good’ or ‘outstanding’ in September 2018 A Note: comparable trend data are not available 6.6 percentage points below the England average A<br>
15
By 2020, 5,000 more 50-64 year olds will be in employment, relative to a June 2016 baseline of 316,000 By 2020, 90% of people aged over 50 in GM will identify their neighbourhood as ‘very’ or ‘somewhat’ age-friendly, compared to 80% in 2017 In 2015/16, there were 10,426 hospital admissions due to falls amongst GM residents aged over 65. By 2020, we will have reduced this to fewer than 9,700 falls pa By 2020, we will meet or exceed the national average for the proportion of adult social care users who have as much social contact as they would like 80.6% of people aged over 50
in eight GM localities identified their neighbourhood as ‘very’ or ‘somewhat’ age-friendly, as reported by the Ambition for Ageing programme in the year to July 2018* 67.6%
of 50-64 year old GM residents (335,000) were in employment in the year to June 2018 2,398
hospital admissions for falls per 10,000 GM residents aged >65 in 2016/17 (10,096 in total) In 2017/18, there were 766 admissions to residential and nursing care per 100,000 GM residents aged >65, down from 820 in 2016/17, but significantly above the 2017/18 England average (569 per 100,000) R 42.6% of deaths in GM during the year to June 2018 occurred at the person’s usual place of residence, slightly above the figure for the previous year (42.2%), but below the England average for the year to June 2018 (46.7%) A 44.7% of adult social care service users had as much social contact as they would like in 2017/18* A Up from 66.6% (325,000) for the year to June 2017 5.0% (16,000) ahead of the estimated target trajectory Down from 2,512 in 2015/16 3.1% behind the target trajectory Up from 42.2% in 2016/17 1.3 percentage points
below the national average (46.0%) 1.1 percentage points behind the target trajectory, and slightly below the year to July 2017 (81.2%) * Looking to modify this measure to capture data for all 10 localities through a potential new GM residents’ survey Note that the most recent data (Q1 2018/19) are provisional All of the Priority 10 indicators have been updated in this version of the Performance Report, with the exception of the number of hospital admissions for falls. With regard to the proportion of people identifying their neighbourhood as ‘very’ or ‘somewhat’ age-friendly, performance is slightly down compared to the previously reported period, and lags the target trajectory, but this may reflect Ambition for Ageing’s recent focus in engaging with people who are more excluded and socially isolated. In line with data reported under other GMS priorities, progress on employment is good, with a higher proportion of 50-64 years in work, although still a significant gap with the England average. Similarly, improved performance is evident on the proportion of adult social care users who have as much social contact as they would like, the number of care home admissions and end of life experience, albeit the gap with the national data remains.
GM is seeking to address the challenges of an ageing population with a positive vision of ageing, set out in the GM Age-Friendly Strategy. Key actions have included the publication of new reports: with TfGM to support age-friendly transport; and with the Centre for Ageing Better (CfAB) and Manchester School of Architecture on housing and ageing.
We are also working with CfAB to identify a new suite of indicators for the Age-Friendly Strategy, and will reflect this in a refreshed indicator set for future Priority 10 reporting.
The Mayoral Challenge was launched by GMCA with GMCVO, and will lead to 50 age-friendly communities by 2020.
The first GM Festival of Ageing was held in July 2018, led by VCSE agencies, and comprised 360 local events plus large events in each locality. 103 small investments were awarded and overall there were 12,639 attendees. A * Looking to replace this with a measure that is representative of older people more broadly and the extent to which they feel socially isolated, potentially sourced from a new GM residents’ survey G<br>
in eight GM localities identified their neighbourhood as ‘very’ or ‘somewhat’ age-friendly, as reported by the Ambition for Ageing programme in the year to July 2018* 67.6%
of 50-64 year old GM residents (335,000) were in employment in the year to June 2018 2,398
hospital admissions for falls per 10,000 GM residents aged >65 in 2016/17 (10,096 in total) In 2017/18, there were 766 admissions to residential and nursing care per 100,000 GM residents aged >65, down from 820 in 2016/17, but significantly above the 2017/18 England average (569 per 100,000) R 42.6% of deaths in GM during the year to June 2018 occurred at the person’s usual place of residence, slightly above the figure for the previous year (42.2%), but below the England average for the year to June 2018 (46.7%) A 44.7% of adult social care service users had as much social contact as they would like in 2017/18* A Up from 66.6% (325,000) for the year to June 2017 5.0% (16,000) ahead of the estimated target trajectory Down from 2,512 in 2015/16 3.1% behind the target trajectory Up from 42.2% in 2016/17 1.3 percentage points
below the national average (46.0%) 1.1 percentage points behind the target trajectory, and slightly below the year to July 2017 (81.2%) * Looking to modify this measure to capture data for all 10 localities through a potential new GM residents’ survey Note that the most recent data (Q1 2018/19) are provisional All of the Priority 10 indicators have been updated in this version of the Performance Report, with the exception of the number of hospital admissions for falls. With regard to the proportion of people identifying their neighbourhood as ‘very’ or ‘somewhat’ age-friendly, performance is slightly down compared to the previously reported period, and lags the target trajectory, but this may reflect Ambition for Ageing’s recent focus in engaging with people who are more excluded and socially isolated. In line with data reported under other GMS priorities, progress on employment is good, with a higher proportion of 50-64 years in work, although still a significant gap with the England average. Similarly, improved performance is evident on the proportion of adult social care users who have as much social contact as they would like, the number of care home admissions and end of life experience, albeit the gap with the national data remains.
GM is seeking to address the challenges of an ageing population with a positive vision of ageing, set out in the GM Age-Friendly Strategy. Key actions have included the publication of new reports: with TfGM to support age-friendly transport; and with the Centre for Ageing Better (CfAB) and Manchester School of Architecture on housing and ageing.
We are also working with CfAB to identify a new suite of indicators for the Age-Friendly Strategy, and will reflect this in a refreshed indicator set for future Priority 10 reporting.
The Mayoral Challenge was launched by GMCA with GMCVO, and will lead to 50 age-friendly communities by 2020.
The first GM Festival of Ageing was held in July 2018, led by VCSE agencies, and comprised 360 local events plus large events in each locality. 103 small investments were awarded and overall there were 12,639 attendees. A * Looking to replace this with a measure that is representative of older people more broadly and the extent to which they feel socially isolated, potentially sourced from a new GM residents’ survey G<br>
16
Annex: data sources and update log<br>