
HELCOM biodiversity, litter, underwater noise and
SB
Published · 22 slides · 0 views

1 / 1


Description
HELCOM biodiversity, litter, underwater noise and effective regional measures for the Baltic Sea (HELCOM BLUES) Final summary overview (25.01.2021-24.01.2023) Grant information Programme concerned: MARINE STRATEGY FRAMEWORK DIRECTIVE:
Related Topics
Share
Embed code
Download this presentation From Below
"HELCOM biodiversity, litter, underwater noise and" is the property of its rightful owner. Permission is granted to download and print the materials on this website for personal, non-commercial use only, and to display it on your personal computer provided you do not modify the materials and that you retain all copyright notices contained in the materials. By downloading content from our website, you accept the terms of this agreement.
Presentation Transcript
01
HELCOM biodiversity, litter, underwater noise and effective regional measures for the Baltic Sea (HELCOM BLUES) Final summary overview (25.01.2021-24.01.2023)<br>
02
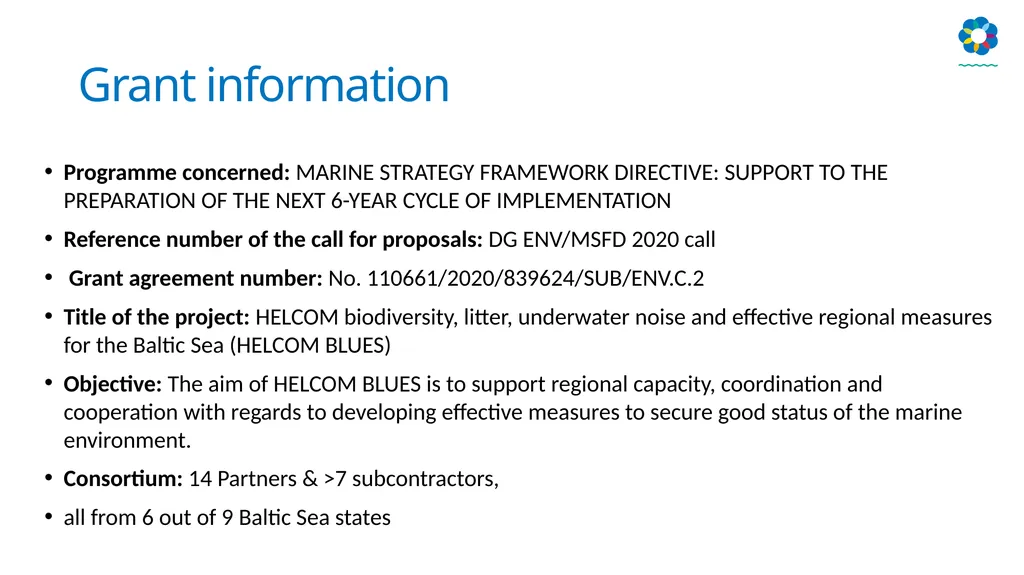
Grant information Programme concerned: MARINE STRATEGY FRAMEWORK DIRECTIVE: SUPPORT TO THE PREPARATION OF THE NEXT 6-YEAR CYCLE OF IMPLEMENTATION
Reference number of the call for proposals: DG ENV/MSFD 2020 call
Grant agreement number: No. 110661/2020/839624/SUB/ENV.C.2
Title of the project: HELCOM biodiversity, litter, underwater noise and effective regional measures for the Baltic Sea (HELCOM BLUES)
Objective: The aim of HELCOM BLUES is to support regional capacity, coordination and cooperation with regards to developing effective measures to secure good status of the marine environment.
Consortium: 14 Partners & >7 subcontractors,
all from 6 out of 9 Baltic Sea states<br>
03
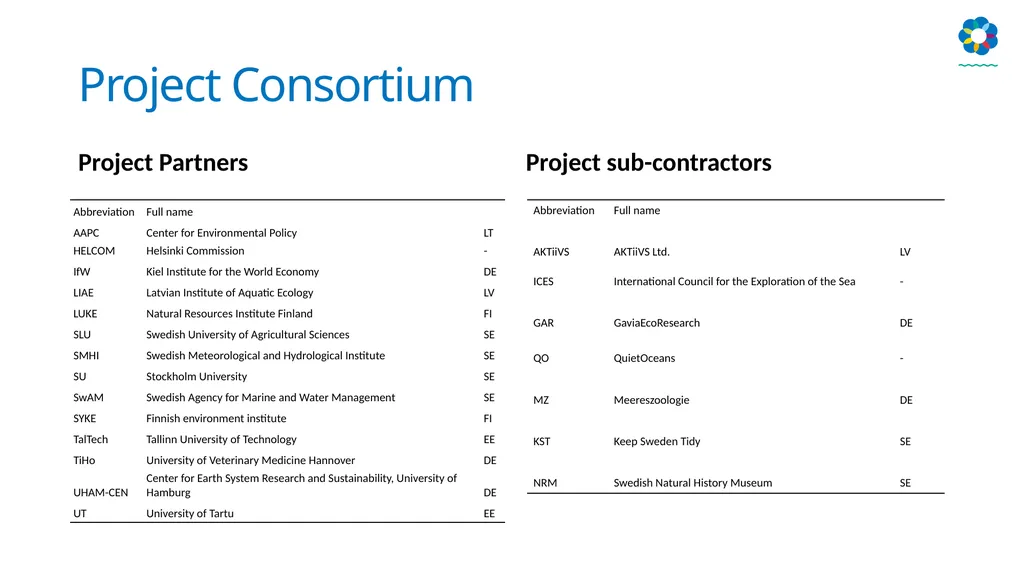
Project Consortium Project Partners Project sub-contractors<br>
04
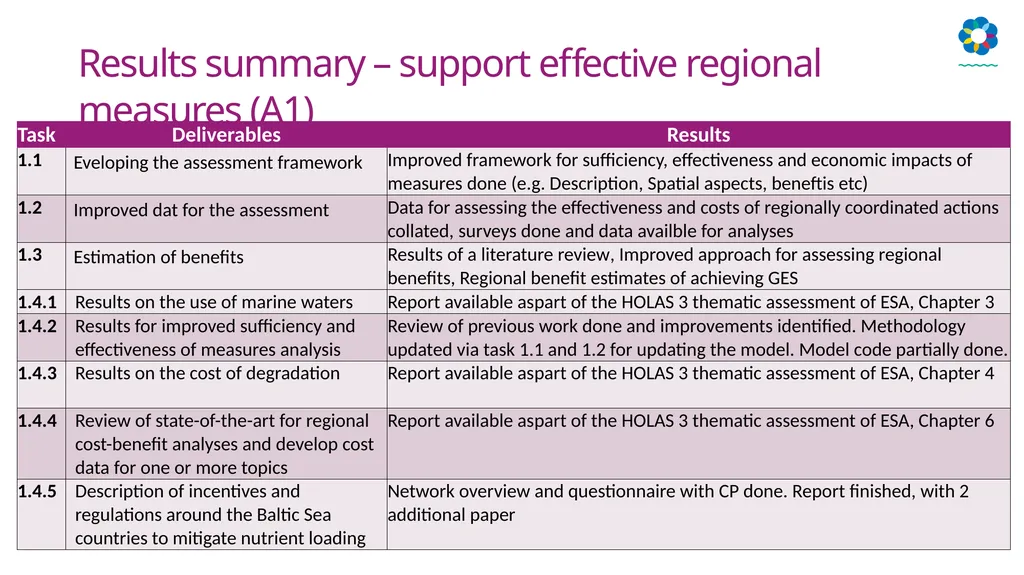
Results summary – support effective regional measures (A1)<br>
05
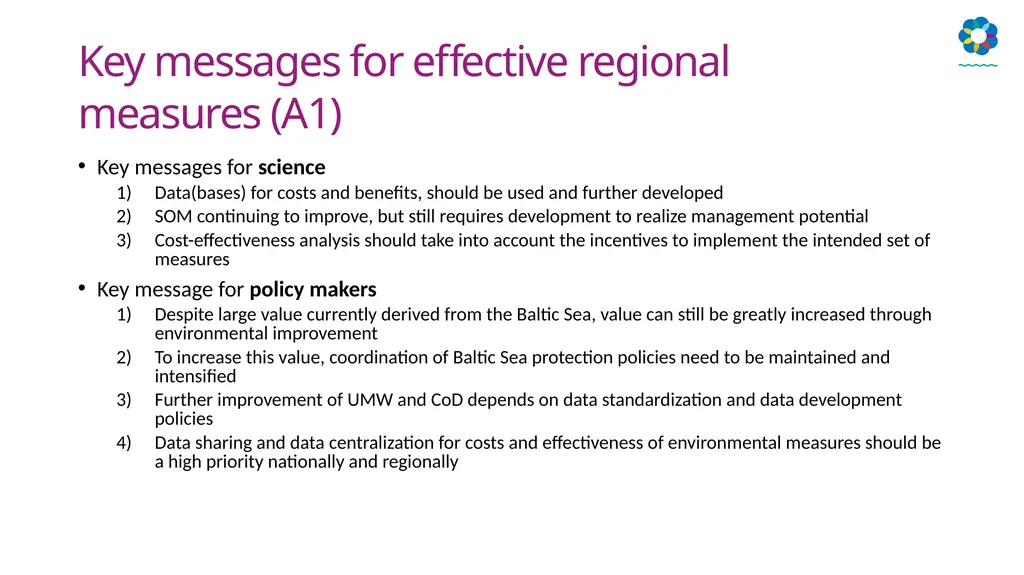
Key messages for effective regional measures (A1) Key messages for science
Data(bases) for costs and benefits, should be used and further developed
SOM continuing to improve, but still requires development to realize management potential
Cost-effectiveness analysis should take into account the incentives to implement the intended set of measures
Key message for policy makers
Despite large value currently derived from the Baltic Sea, value can still be greatly increased through environmental improvement
To increase this value, coordination of Baltic Sea protection policies need to be maintained and intensified
Further improvement of UMW and CoD depends on data standardization and data development policies
Data sharing and data centralization for costs and effectiveness of environmental measures should be a high priority nationally and regionally<br>
06
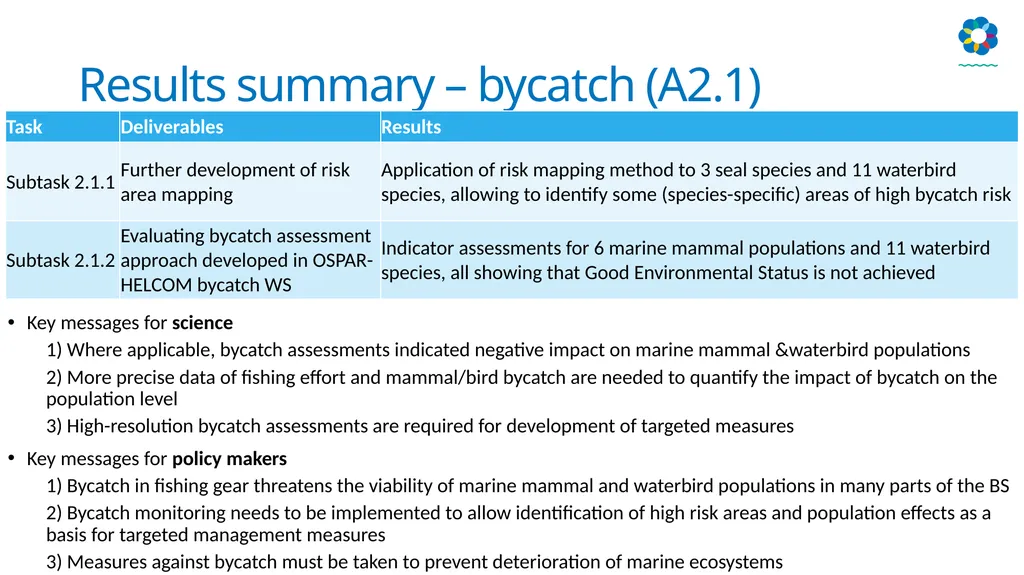
Results summary – bycatch (A2.1) Key messages for science
1) Where applicable, bycatch assessments indicated negative impact on marine mammal &waterbird populations
2) More precise data of fishing effort and mammal/bird bycatch are needed to quantify the impact of bycatch on the population level
3) High-resolution bycatch assessments are required for development of targeted measures
Key messages for policy makers
1) Bycatch in fishing gear threatens the viability of marine mammal and waterbird populations in many parts of the BS
2) Bycatch monitoring needs to be implemented to allow identification of high risk areas and population effects as a basis for targeted management measures
3) Measures against bycatch must be taken to prevent deterioration of marine ecosystems<br>
07
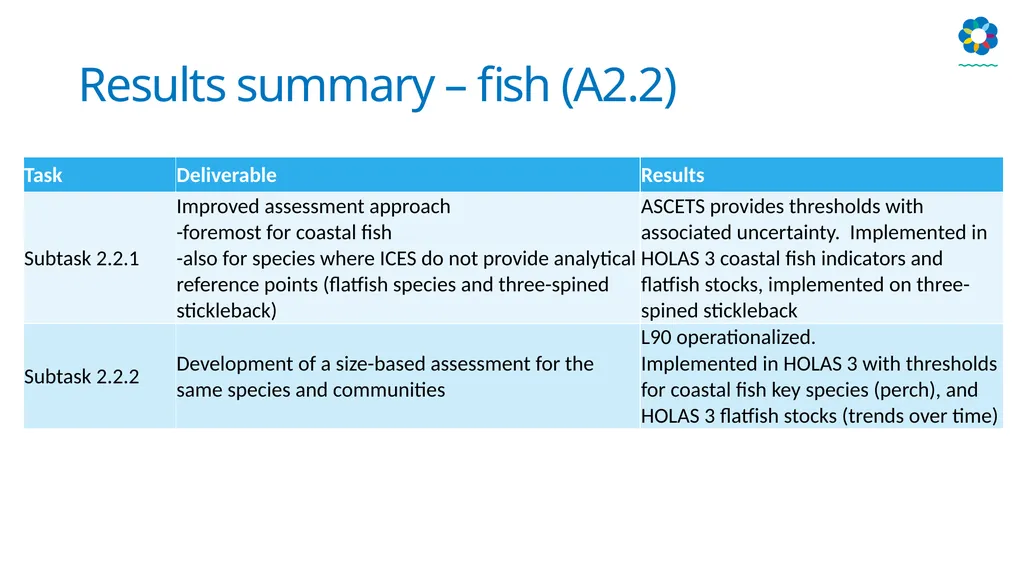
Results summary – fish (A2.2)<br>
08
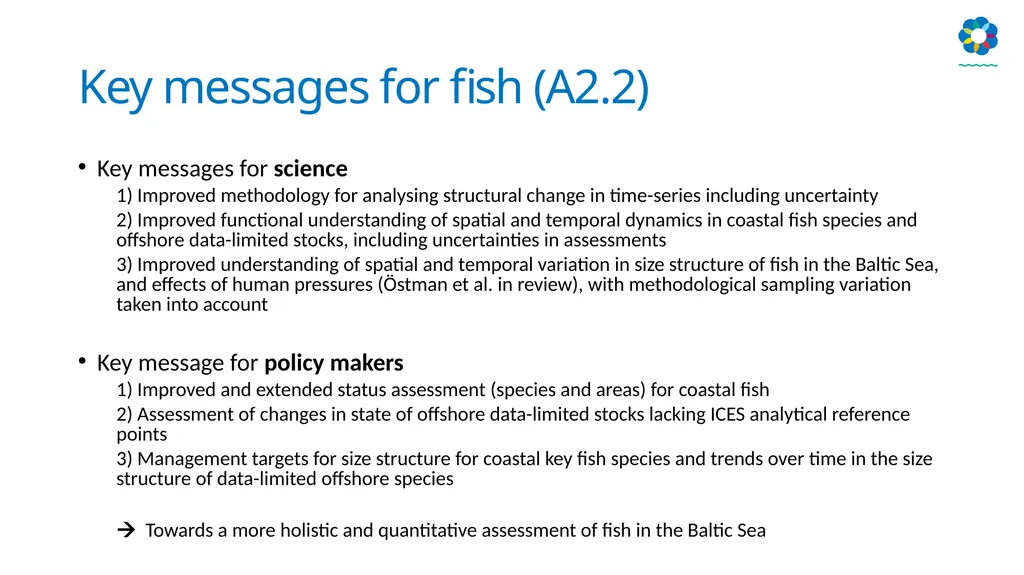
Key messages for fish (A2.2) Key messages for science
1) Improved methodology for analysing structural change in time-series including uncertainty
2) Improved functional understanding of spatial and temporal dynamics in coastal fish species and offshore data-limited stocks, including uncertainties in assessments
3) Improved understanding of spatial and temporal variation in size structure of fish in the Baltic Sea, and effects of human pressures (Östman et al. in review), with methodological sampling variation taken into account
Key message for policy makers
1) Improved and extended status assessment (species and areas) for coastal fish
2) Assessment of changes in state of offshore data-limited stocks lacking ICES analytical reference points
3) Management targets for size structure for coastal key fish species and trends over time in the size structure of data-limited offshore species
Towards a more holistic and quantitative assessment of fish in the Baltic Sea<br>
09
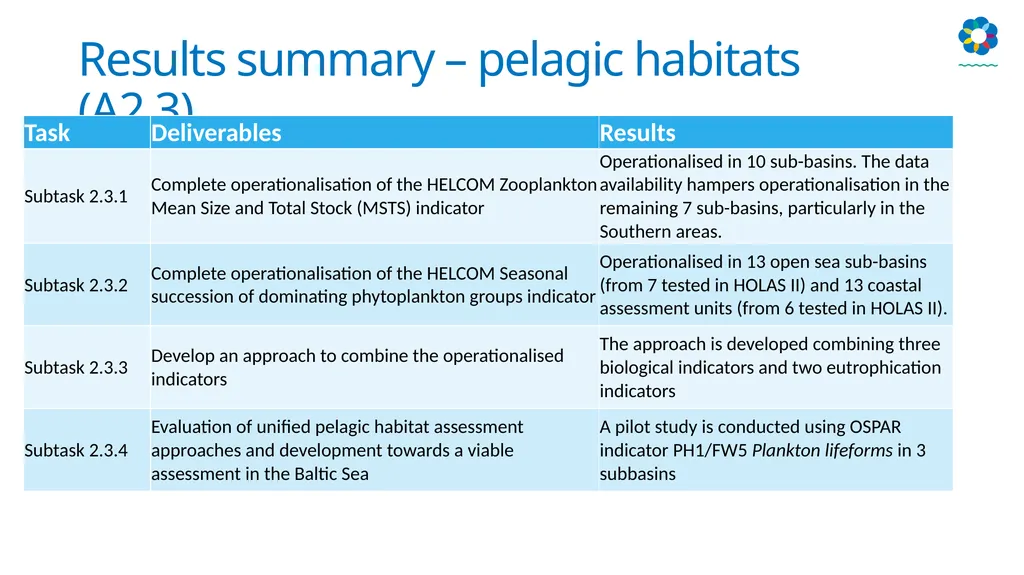
Results summary – pelagic habitats (A2.3)<br>
10
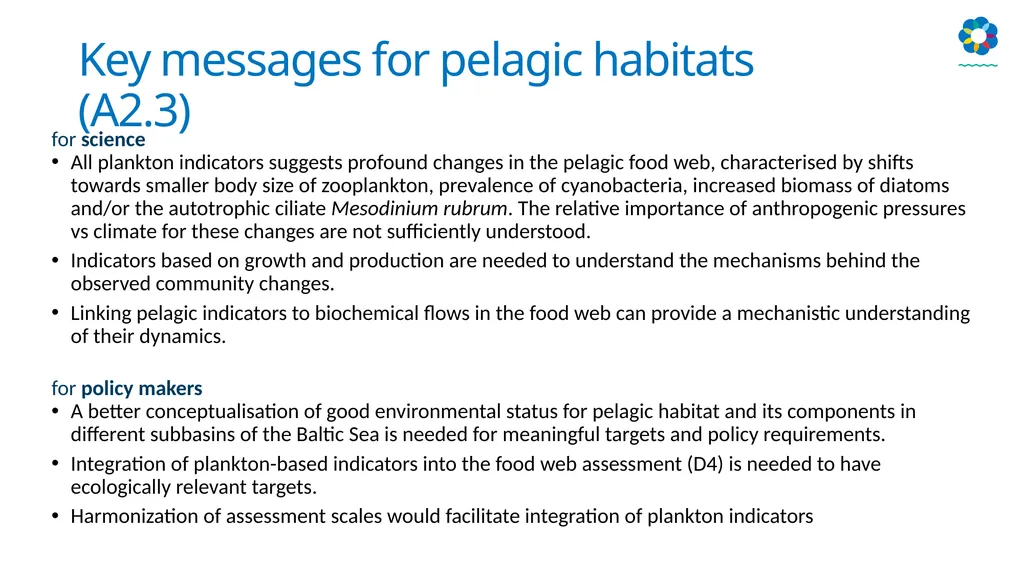
Key messages for pelagic habitats (A2.3) for science
All plankton indicators suggests profound changes in the pelagic food web, characterised by shifts towards smaller body size of zooplankton, prevalence of cyanobacteria, increased biomass of diatoms and/or the autotrophic ciliate Mesodinium rubrum. The relative importance of anthropogenic pressures vs climate for these changes are not sufficiently understood.
Indicators based on growth and production are needed to understand the mechanisms behind the observed community changes.
Linking pelagic indicators to biochemical flows in the food web can provide a mechanistic understanding of their dynamics.
for policy makers
A better conceptualisation of good environmental status for pelagic habitat and its components in different subbasins of the Baltic Sea is needed for meaningful targets and policy requirements.
Integration of plankton-based indicators into the food web assessment (D4) is needed to have ecologically relevant targets.
Harmonization of assessment scales would facilitate integration of plankton indicators<br>
11
Results summary - harbour porpoise (A2.4)<br>
12
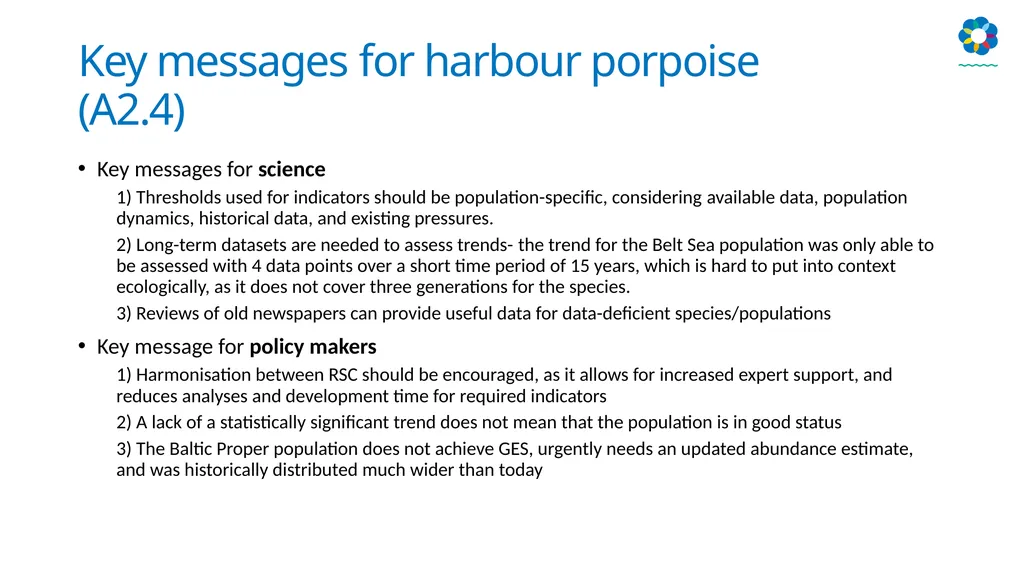
Key messages for harbour porpoise (A2.4) Key messages for science
1) Thresholds used for indicators should be population-specific, considering available data, population dynamics, historical data, and existing pressures.
2) Long-term datasets are needed to assess trends- the trend for the Belt Sea population was only able to be assessed with 4 data points over a short time period of 15 years, which is hard to put into context ecologically, as it does not cover three generations for the species.
3) Reviews of old newspapers can provide useful data for data-deficient species/populations
Key message for policy makers
1) Harmonisation between RSC should be encouraged, as it allows for increased expert support, and reduces analyses and development time for required indicators
2) A lack of a statistically significant trend does not mean that the population is in good status
3) The Baltic Proper population does not achieve GES, urgently needs an updated abundance estimate, and was historically distributed much wider than today<br>
13
Results summary - BEAT/ food web (A2.5) Key messages for science
1) Further indicator development needed to cover all biodiversity aspects and increase spatial coverage
2) Specific food web indicators needed, including energy flows and transfer efficiency
3) Indicator threshold setting an important aspect of integrated assessments
Key message for policy makers
1) Monitoring important as the foundation of the assessments
2) Streamlining assessments across policies advantageous
3) Ecosystem-based management need to include food web aspects<br>
14
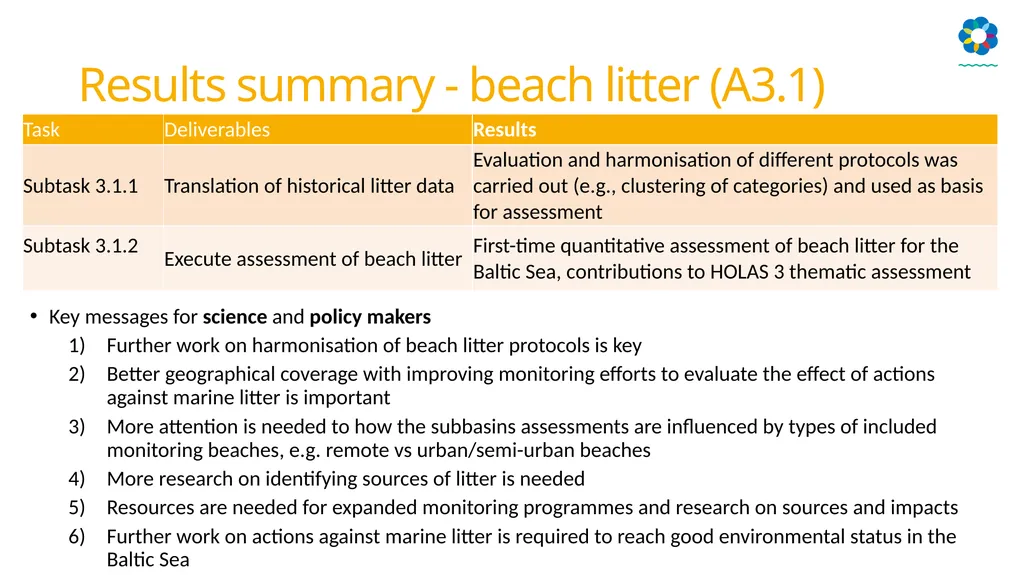
Results summary - beach litter (A3.1) Key messages for science and policy makers
Further work on harmonisation of beach litter protocols is key
Better geographical coverage with improving monitoring efforts to evaluate the effect of actions against marine litter is important
More attention is needed to how the subbasins assessments are influenced by types of included monitoring beaches, e.g. remote vs urban/semi-urban beaches
More research on identifying sources of litter is needed
Resources are needed for expanded monitoring programmes and research on sources and impacts
Further work on actions against marine litter is required to reach good environmental status in the Baltic Sea<br>
15
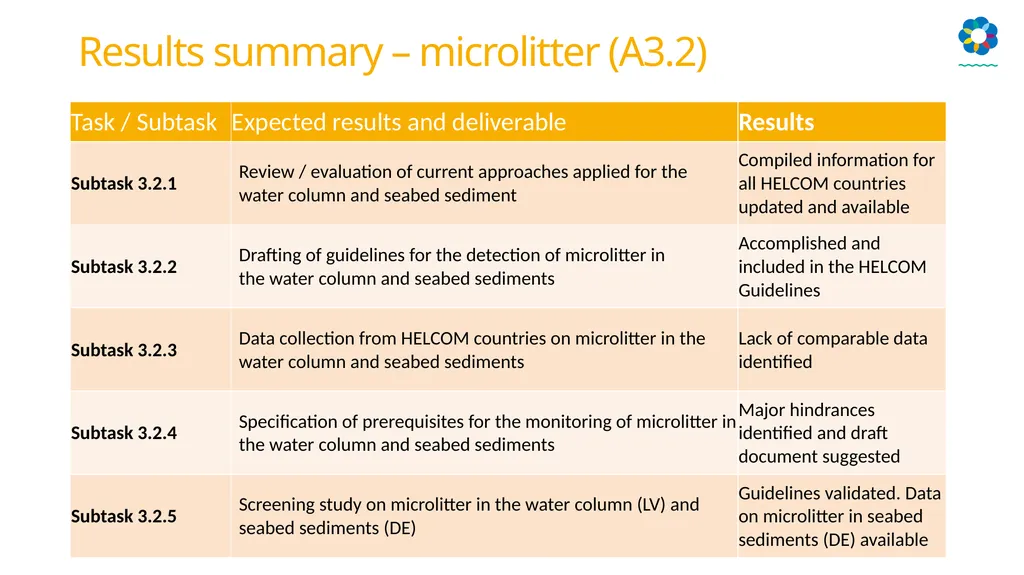
Results summary – microlitter (A3.2)<br>
16
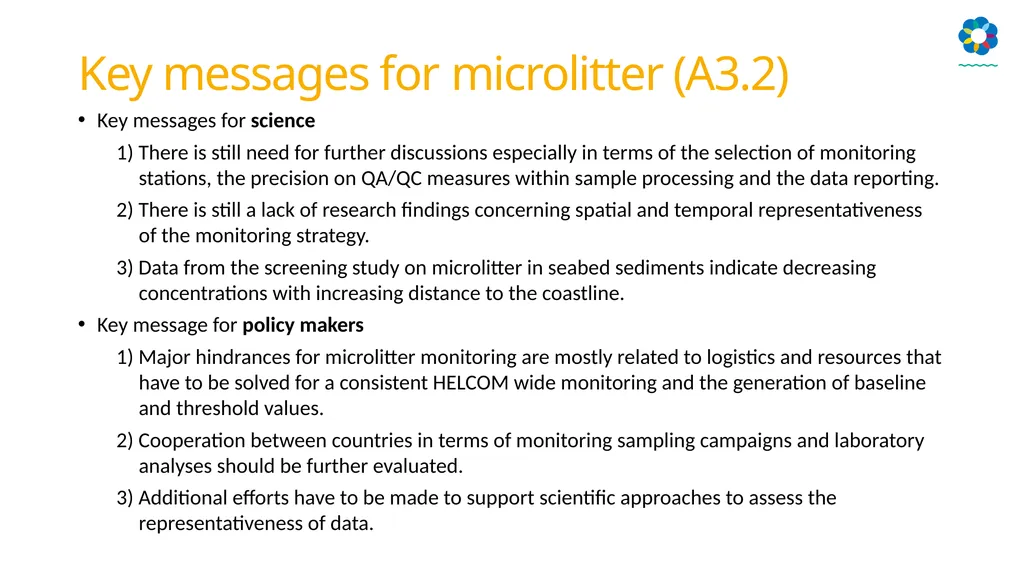
Key messages for microlitter (A3.2) Key messages for science
1) There is still need for further discussions especially in terms of the selection of monitoring stations, the precision on QA/QC measures within sample processing and the data reporting.
2) There is still a lack of research findings concerning spatial and temporal representativeness of the monitoring strategy.
3) Data from the screening study on microlitter in seabed sediments indicate decreasing concentrations with increasing distance to the coastline.
Key message for policy makers
1) Major hindrances for microlitter monitoring are mostly related to logistics and resources that have to be solved for a consistent HELCOM wide monitoring and the generation of baseline and threshold values.
2) Cooperation between countries in terms of monitoring sampling campaigns and laboratory analyses should be further evaluated.
3) Additional efforts have to be made to support scientific approaches to assess the representativeness of data.<br>
17
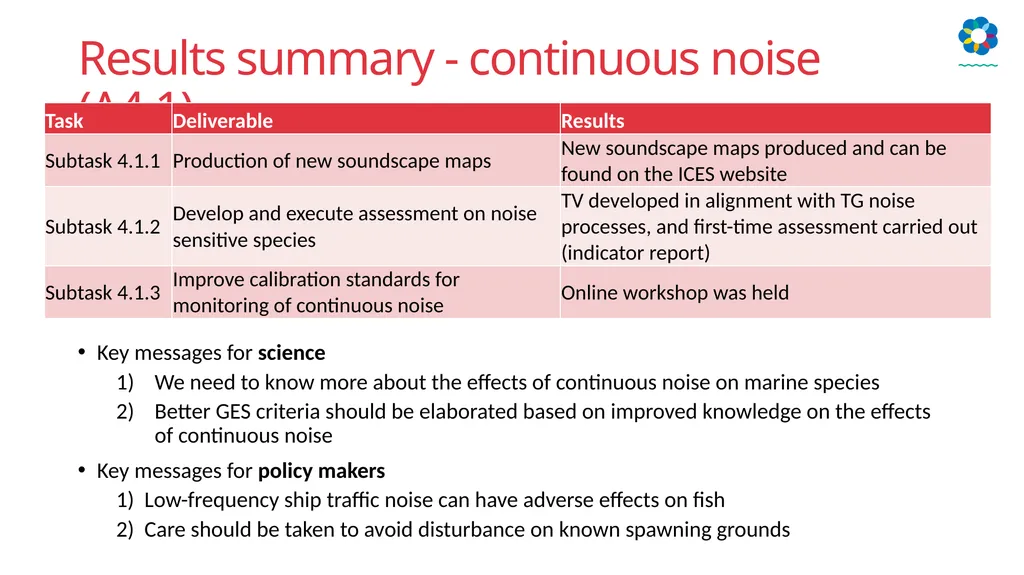
Results summary - continuous noise (A4.1) Key messages for science
We need to know more about the effects of continuous noise on marine species
Better GES criteria should be elaborated based on improved knowledge on the effects of continuous noise
Key messages for policy makers
1) Low-frequency ship traffic noise can have adverse effects on fish
2) Care should be taken to avoid disturbance on known spawning grounds<br>
18
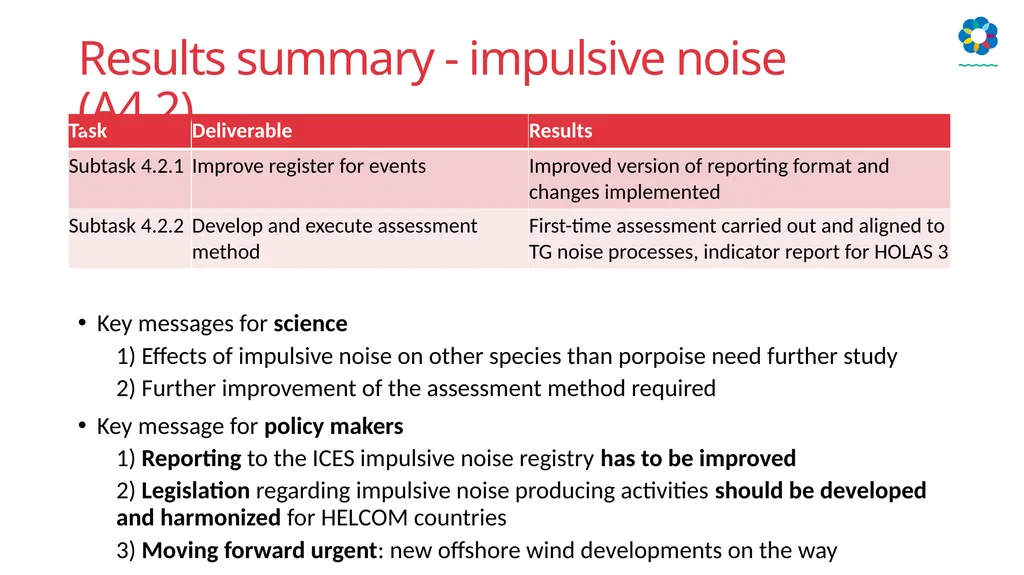
Key messages for science
1) Effects of impulsive noise on other species than porpoise need further study
2) Further improvement of the assessment method required
Key message for policy makers
1) Reporting to the ICES impulsive noise registry has to be improved
2) Legislation regarding impulsive noise producing activities should be developed and harmonized for HELCOM countries
3) Moving forward urgent: new offshore wind developments on the way Results summary - impulsive noise (A4.2)<br>
19
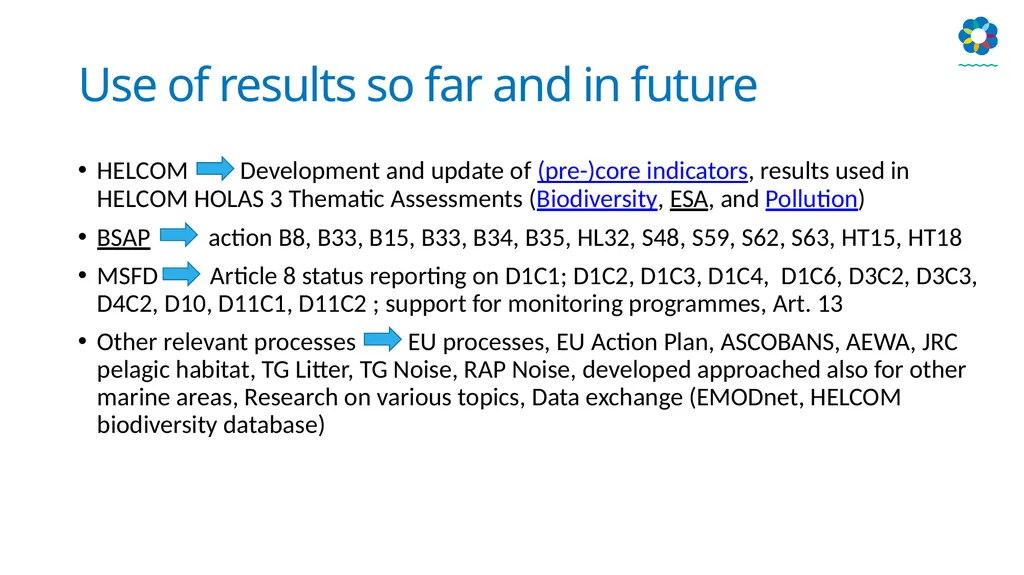
Use of results so far and in future HELCOM Development and update of (pre-)core indicators, results used in HELCOM HOLAS 3 Thematic Assessments (Biodiversity, ESA, and Pollution)
BSAP action B8, B33, B15, B33, B34, B35, HL32, S48, S59, S62, S63, HT15, HT18
MSFD Article 8 status reporting on D1C1; D1C2, D1C3, D1C4, D1C6, D3C2, D3C3, D4C2, D10, D11C1, D11C2 ; support for monitoring programmes, Art. 13
Other relevant processes EU processes, EU Action Plan, ASCOBANS, AEWA, JRC pelagic habitat, TG Litter, TG Noise, RAP Noise, developed approached also for other marine areas, Research on various topics, Data exchange (EMODnet, HELCOM biodiversity database)<br>
20
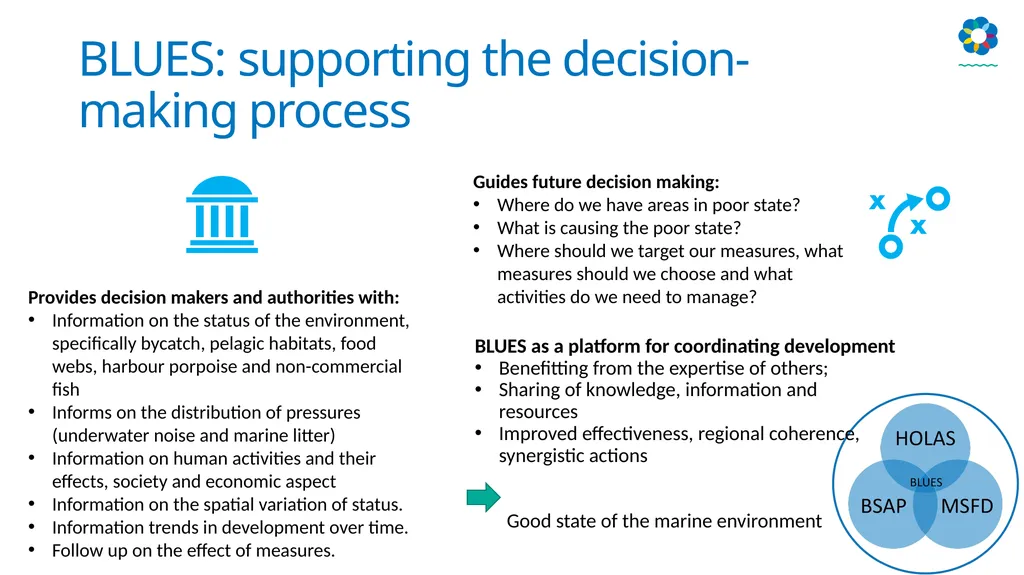
BLUES: supporting the decision-making process Provides decision makers and authorities with:
Information on the status of the environment, specifically bycatch, pelagic habitats, food webs, harbour porpoise and non-commercial fish
Informs on the distribution of pressures (underwater noise and marine litter)
Information on human activities and their effects, society and economic aspect
Information on the spatial variation of status.
Information trends in development over time.
Follow up on the effect of measures. Guides future decision making:
Where do we have areas in poor state?
What is causing the poor state?
Where should we target our measures, what measures should we choose and what activities do we need to manage? BLUES as a platform for coordinating development
Benefitting from the expertise of others;
Sharing of knowledge, information and resources
Improved effectiveness, regional coherence, synergistic actions
Good state of the marine environment<br>
21
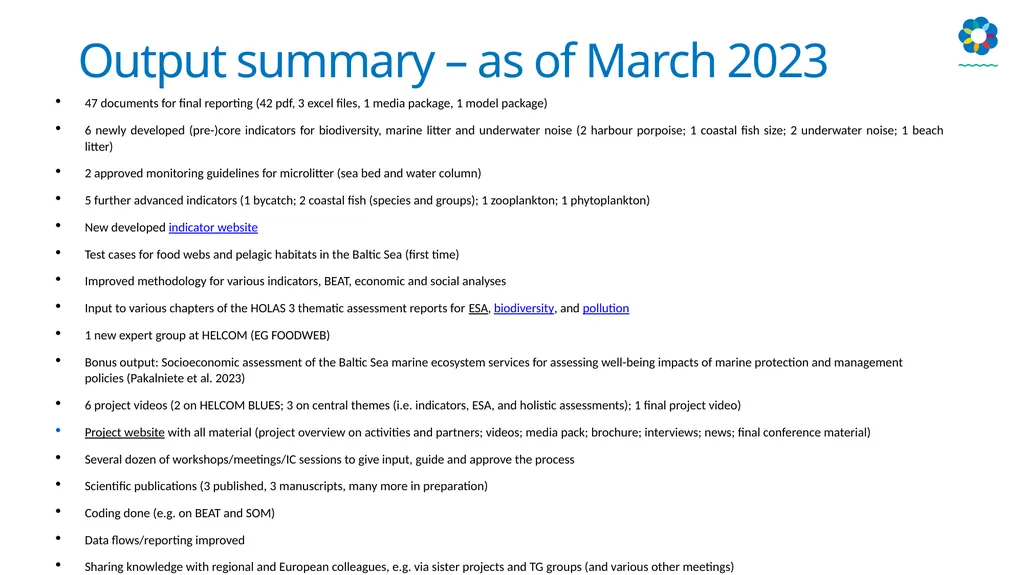
Output summary – as of March 2023 47 documents for final reporting (42 pdf, 3 excel files, 1 media package, 1 model package)
6 newly developed (pre-)core indicators for biodiversity, marine litter and underwater noise (2 harbour porpoise; 1 coastal fish size; 2 underwater noise; 1 beach litter)
2 approved monitoring guidelines for microlitter (sea bed and water column)
5 further advanced indicators (1 bycatch; 2 coastal fish (species and groups); 1 zooplankton; 1 phytoplankton)
New developed indicator website
Test cases for food webs and pelagic habitats in the Baltic Sea (first time)
Improved methodology for various indicators, BEAT, economic and social analyses
Input to various chapters of the HOLAS 3 thematic assessment reports for ESA, biodiversity, and pollution
1 new expert group at HELCOM (EG FOODWEB)
Bonus output: Socioeconomic assessment of the Baltic Sea marine ecosystem services for assessing well-being impacts of marine protection and management policies (Pakalniete et al. 2023)
6 project videos (2 on HELCOM BLUES; 3 on central themes (i.e. indicators, ESA, and holistic assessments); 1 final project video)
Project website with all material (project overview on activities and partners; videos; media pack; brochure; interviews; news; final conference material)
Several dozen of workshops/meetings/IC sessions to give input, guide and approve the process
Scientific publications (3 published, 3 manuscripts, many more in preparation)
Coding done (e.g. on BEAT and SOM)
Data flows/reporting improved
Sharing knowledge with regional and European colleagues, e.g. via sister projects and TG groups (and various other meetings)<br>
22
Thank you very much for your interest and support! Contacts at HELCOM:
Project manager: Jannica Haldin Project coordinator: Jana Wolf<br>
Project manager: Jannica Haldin Project coordinator: Jana Wolf<br>