
Hierarchical Linear Modeling (HLM): A Conceptual


Description: Hierarchical Linear Modeling (HLM): A Conceptual Introduction Jessaca Spybrook Educational Leadership, Research, and Technology Slide 2 Overview What is hierarchical data? Why is it a problem for analysis? Example Modeling the hierarchical
Related Topics
Download Presentation
"Hierarchical Linear Modeling (HLM): A Conceptual" is the property of its rightful owner. Permission is granted to download and print the materials on this website for personal, non-commercial use only, and to display it on your personal computer provided you do not modify the materials and that you retain all copyright notices contained in the materials. By downloading content from our website, you accept the terms of this agreement.
Presentation Transcript
slide1. Hierarchical Linear Modeling (HLM): A Conceptual Introduction Jessaca Spybrook
Educational Leadership, Research, and Technology<br>
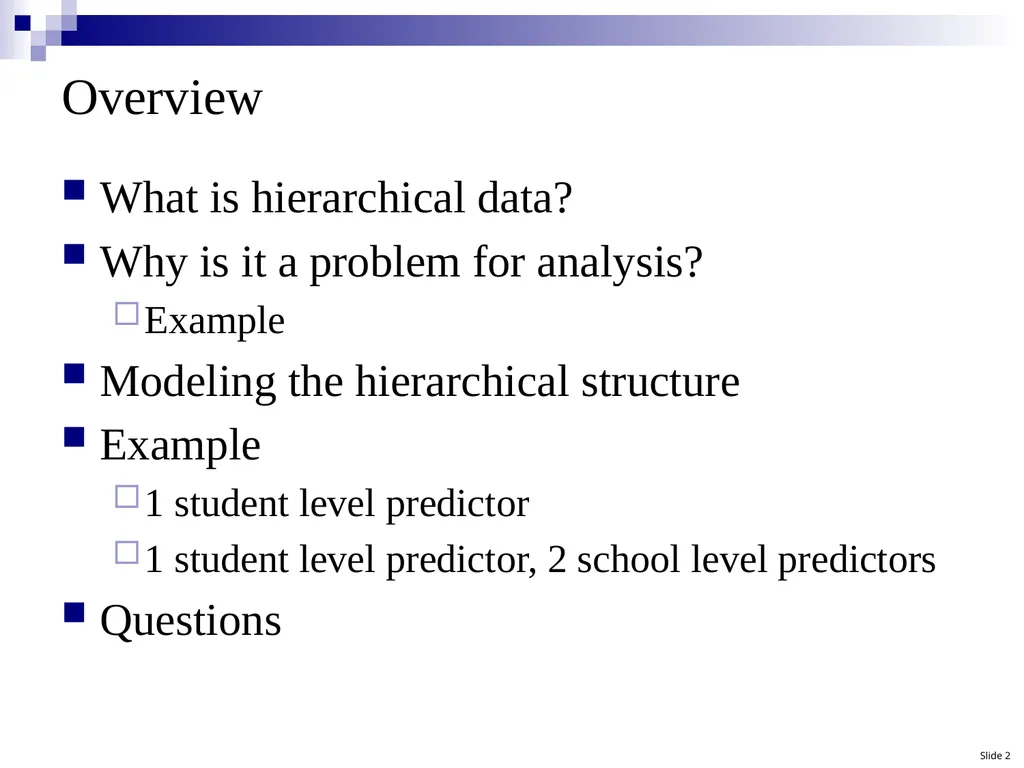
slide2. Slide 2 Overview What is hierarchical data?
Why is it a problem for analysis?
Example
Modeling the hierarchical structure
Example
1 student level predictor
1 student level predictor, 2 school level predictors
Questions<br>
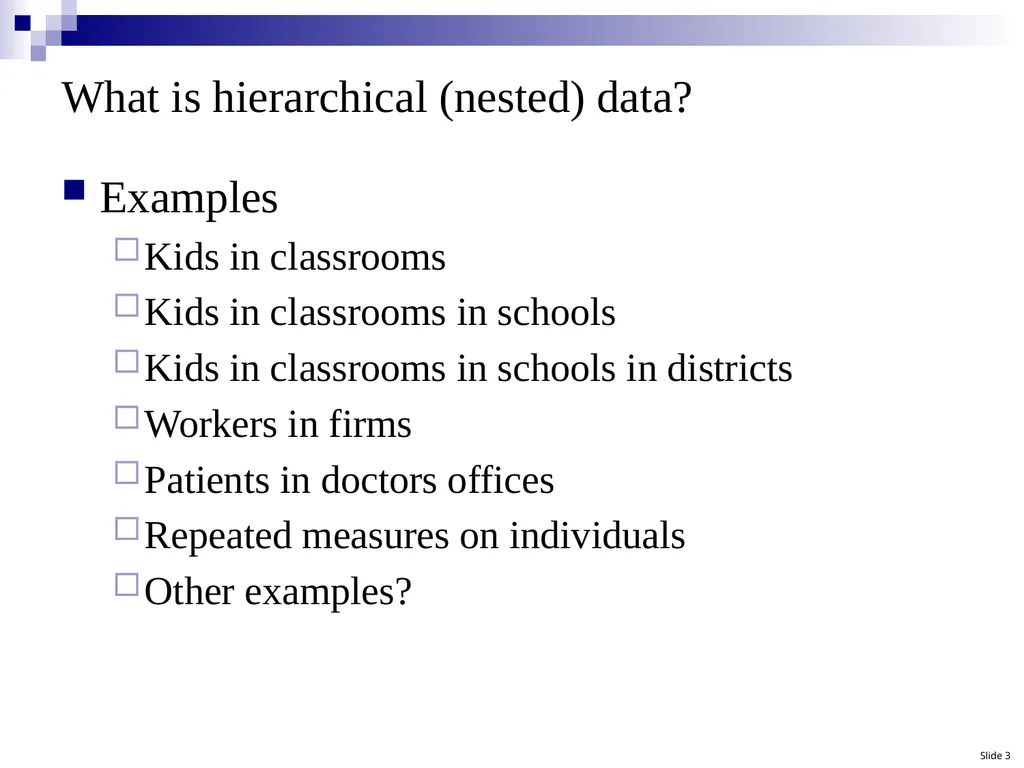
slide3. What is hierarchical (nested) data? Examples
Kids in classrooms
Kids in classrooms in schools
Kids in classrooms in schools in districts
Workers in firms
Patients in doctors offices
Repeated measures on individuals
Other examples? Slide 3<br>
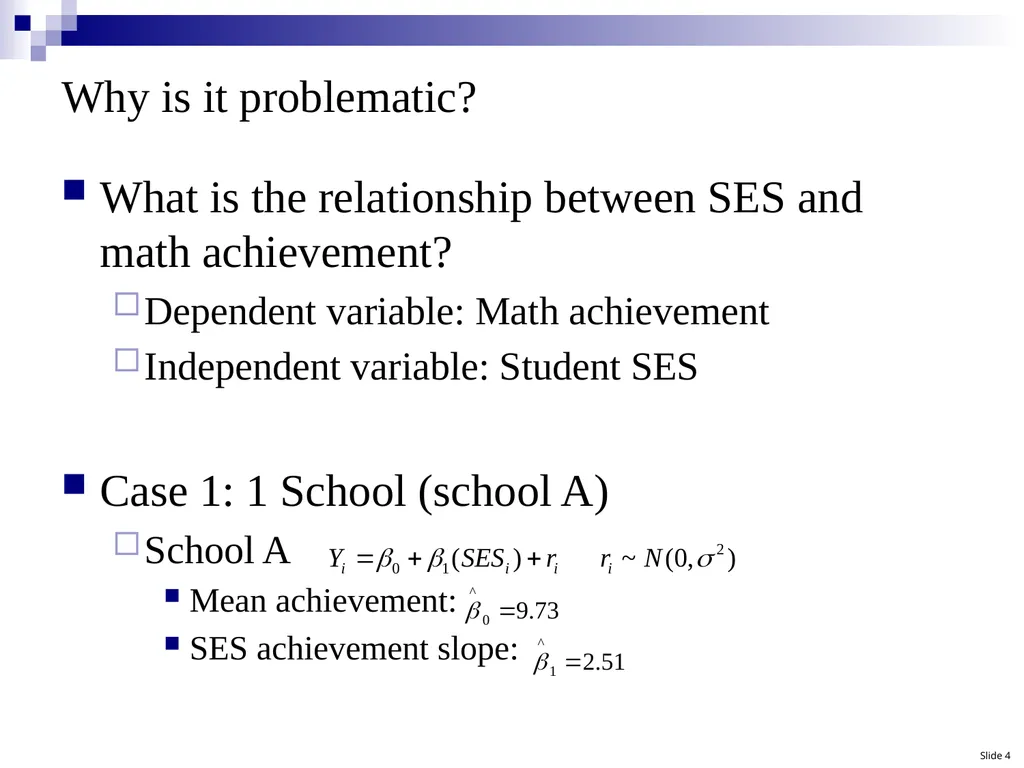
slide4. Why is it problematic? What is the relationship between SES and math achievement?
Dependent variable: Math achievement
Independent variable: Student SES
Case 1: 1 School (school A)
School A
Mean achievement:
SES achievement slope: Slide 4<br>
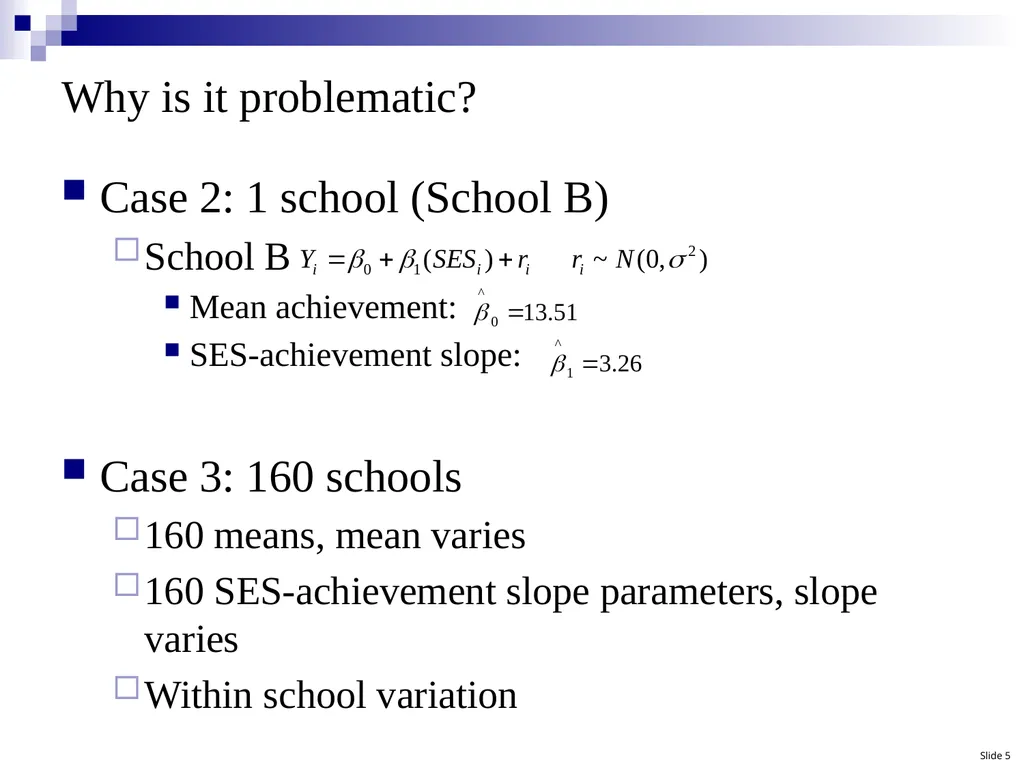
slide5. Why is it problematic? Case 2: 1 school (School B)
School B
Mean achievement:
SES-achievement slope:
Case 3: 160 schools
160 means, mean varies
160 SES-achievement slope parameters, slope varies
Within school variation Slide 5<br>
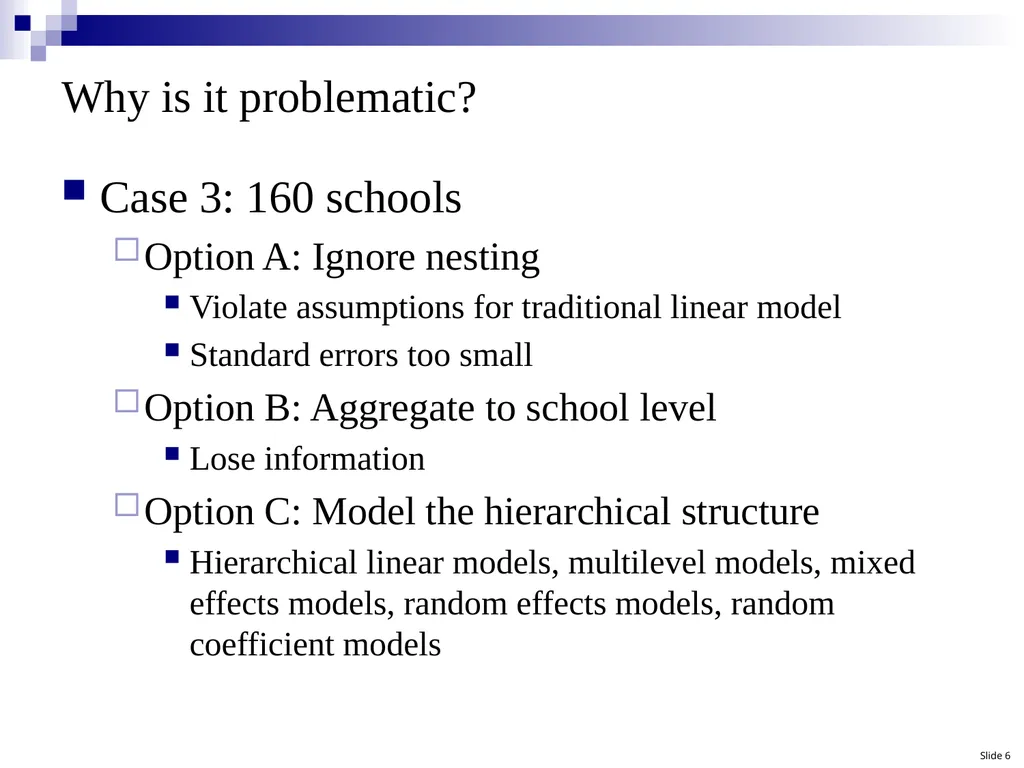
slide6. Why is it problematic? Case 3: 160 schools
Option A: Ignore nesting
Violate assumptions for traditional linear model
Standard errors too small
Option B: Aggregate to school level
Lose information
Option C: Model the hierarchical structure
Hierarchical linear models, multilevel models, mixed effects models, random effects models, random coefficient models Slide 6<br>
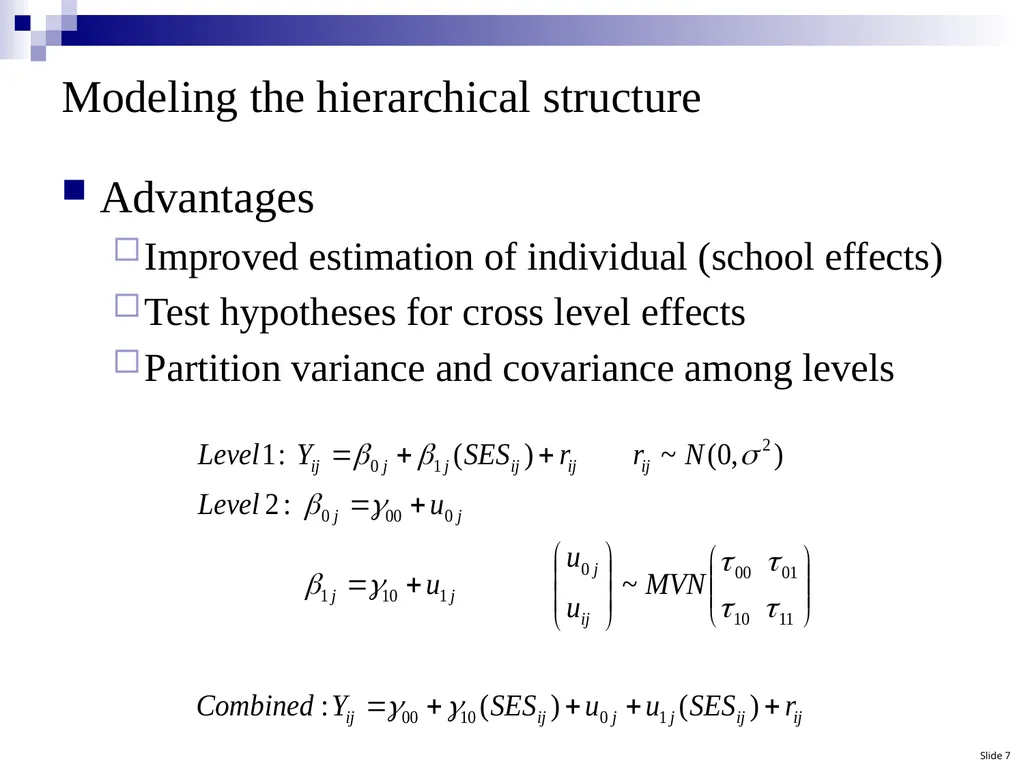
slide7. Modeling the hierarchical structure Advantages
Improved estimation of individual (school effects)
Test hypotheses for cross level effects
Partition variance and covariance among levels Slide 7<br>
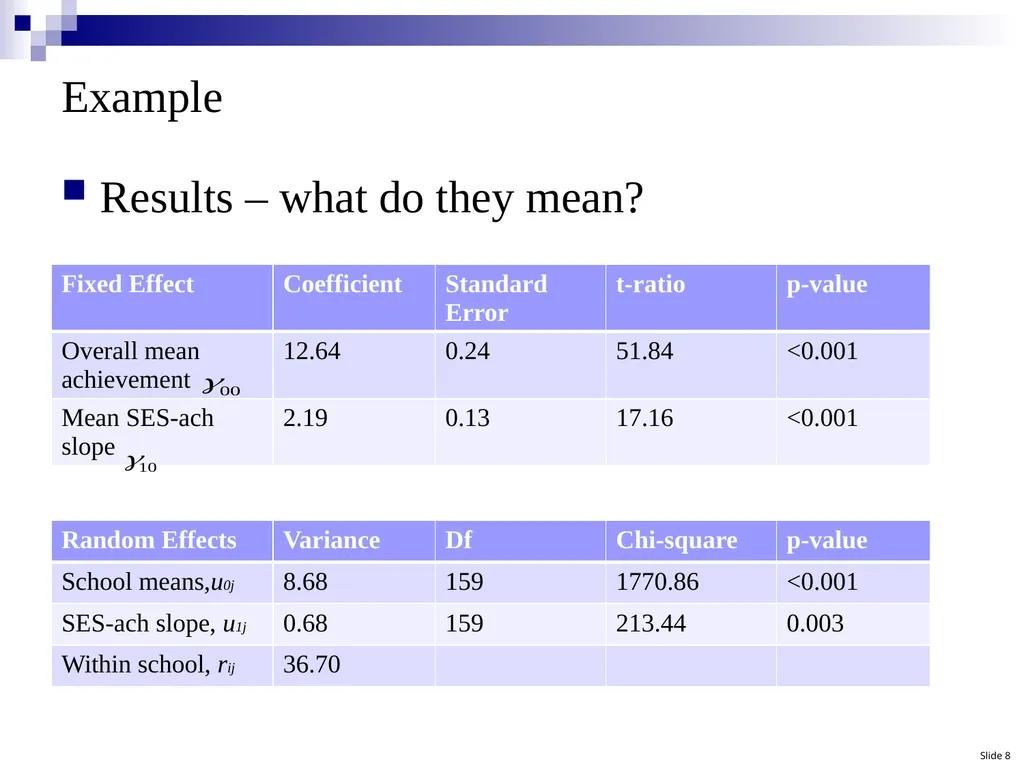
slide8. Example Results – what do they mean? Slide 8<br>
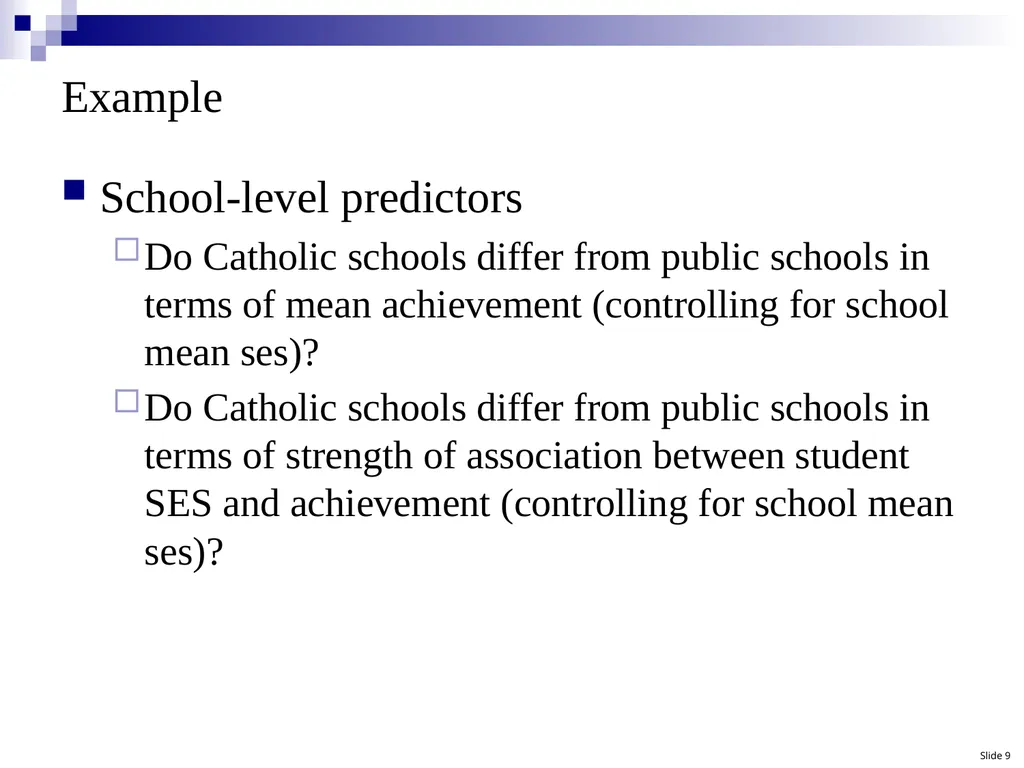
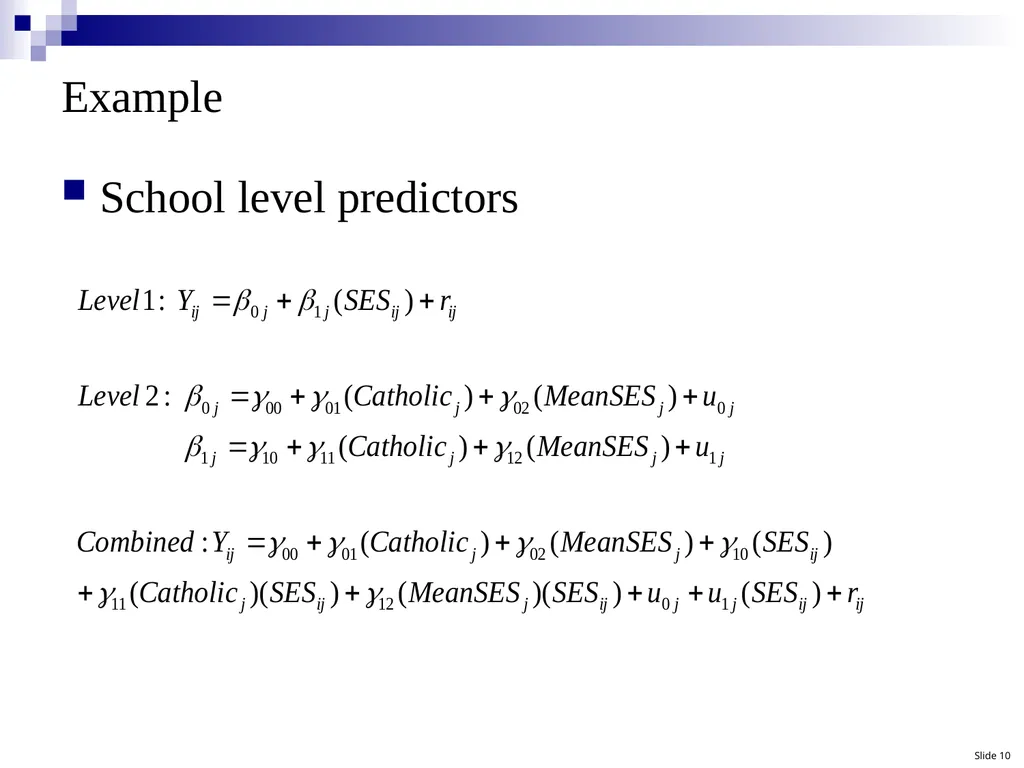
slide9. Example School-level predictors
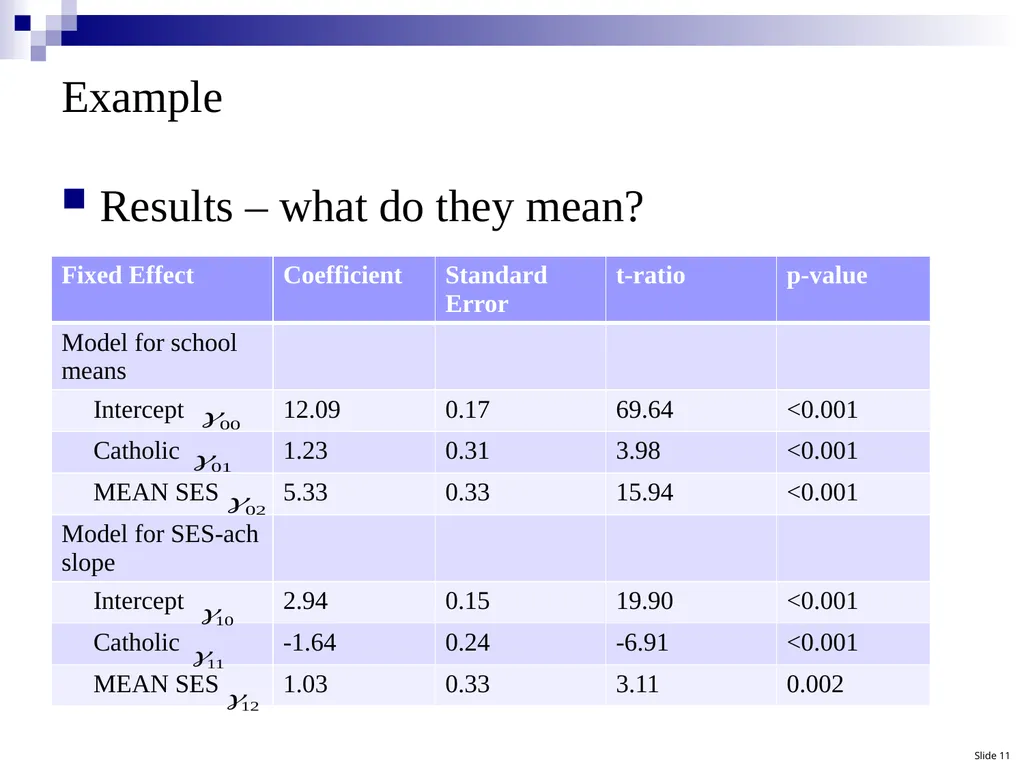
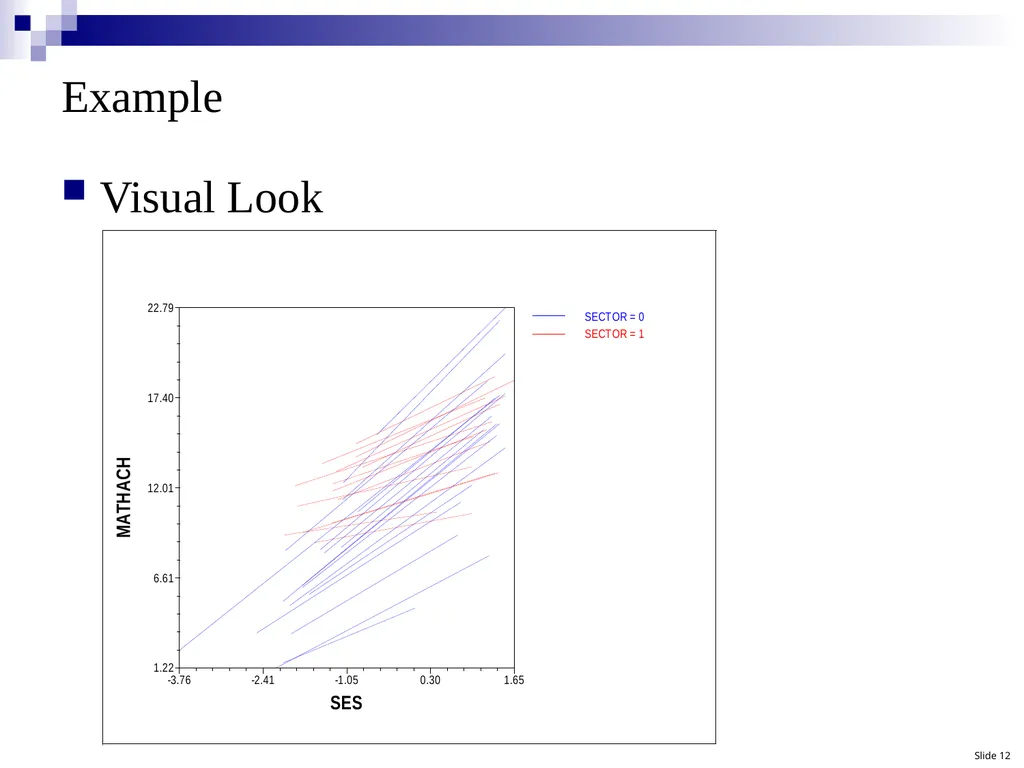
Do Catholic schools differ from public schools in terms of mean achievement (controlling for school mean ses)?
Do Catholic schools differ from public schools in terms of strength of association between student SES and achievement (controlling for school mean ses)? Slide 9<br>
slide10. Example School level predictors Slide 10<br>
slide11. Example Results – what do they mean? Slide 11<br>
slide12. Example Visual Look Slide 12<br>
Educational Leadership, Research, and Technology<br>
slide2. Slide 2 Overview What is hierarchical data?
Why is it a problem for analysis?
Example
Modeling the hierarchical structure
Example
1 student level predictor
1 student level predictor, 2 school level predictors
Questions<br>
slide3. What is hierarchical (nested) data? Examples
Kids in classrooms
Kids in classrooms in schools
Kids in classrooms in schools in districts
Workers in firms
Patients in doctors offices
Repeated measures on individuals
Other examples? Slide 3<br>
slide4. Why is it problematic? What is the relationship between SES and math achievement?
Dependent variable: Math achievement
Independent variable: Student SES
Case 1: 1 School (school A)
School A
Mean achievement:
SES achievement slope: Slide 4<br>
slide5. Why is it problematic? Case 2: 1 school (School B)
School B
Mean achievement:
SES-achievement slope:
Case 3: 160 schools
160 means, mean varies
160 SES-achievement slope parameters, slope varies
Within school variation Slide 5<br>
slide6. Why is it problematic? Case 3: 160 schools
Option A: Ignore nesting
Violate assumptions for traditional linear model
Standard errors too small
Option B: Aggregate to school level
Lose information
Option C: Model the hierarchical structure
Hierarchical linear models, multilevel models, mixed effects models, random effects models, random coefficient models Slide 6<br>
slide7. Modeling the hierarchical structure Advantages
Improved estimation of individual (school effects)
Test hypotheses for cross level effects
Partition variance and covariance among levels Slide 7<br>
slide8. Example Results – what do they mean? Slide 8<br>
slide9. Example School-level predictors
Do Catholic schools differ from public schools in terms of mean achievement (controlling for school mean ses)?
Do Catholic schools differ from public schools in terms of strength of association between student SES and achievement (controlling for school mean ses)? Slide 9<br>
slide10. Example School level predictors Slide 10<br>
slide11. Example Results – what do they mean? Slide 11<br>
slide12. Example Visual Look Slide 12<br>