
Highest and Best Use: Market Analysis and
KL
Published · 65 slides · 0 views

1 / 1

Description
Highest and Best Use: Market Analysis and Valuation Tom Hamilton, PhD, MAI, CRE, FRICS Gerald Fogelson Distinguished Chair in Real Estate Roosevelt University, Chicago School of Real Estate Chicago, Illinois for the 2016 Arkansas Day with
Related Topics
Share
Embed code
Download this presentation From Below
"Highest and Best Use: Market Analysis and" is the property of its rightful owner. Permission is granted to download and print the materials on this website for personal, non-commercial use only, and to display it on your personal computer provided you do not modify the materials and that you retain all copyright notices contained in the materials. By downloading content from our website, you accept the terms of this agreement.
Presentation Transcript
01
Highest and Best Use:
Market Analysis and Valuation Tom Hamilton, PhD, MAI, CRE, FRICS
Gerald Fogelson Distinguished Chair in Real Estate
Roosevelt University, Chicago School of Real Estate Chicago, Illinois
for the
2016 Arkansas Day with Appraisers
Little Rock, Arkansas
May 12, 2016<br>
Gerald Fogelson Distinguished Chair in Real Estate
Roosevelt University, Chicago School of Real Estate Chicago, Illinois
for the
2016 Arkansas Day with Appraisers
Little Rock, Arkansas
May 12, 2016<br>
02
Important Issues Inextricably Intertwined: An economic principle used and recognized for well over 100 years. Unitary valuation principle—can’t value the real property components and sum them up because some components’ values can be worth very little or even worthless without their economic linkage (connection) with the other property components.
ABKA Ltd. v. Fontana-On-Geneva-Lake (231 Wis. 2d 328, 603 N.W.2d 217 (1999), 98-0851): “Income that is attributable to land, rather than personal to the owner, is inextricably intertwined with the land and is transferable to future owners.” 2<br>
ABKA Ltd. v. Fontana-On-Geneva-Lake (231 Wis. 2d 328, 603 N.W.2d 217 (1999), 98-0851): “Income that is attributable to land, rather than personal to the owner, is inextricably intertwined with the land and is transferable to future owners.” 2<br>
03
Important Issues Net Lease Drugstore Market: The Boulder Group of Chicago develops “The Net Lease Drug Store Report”. Has other market reports for “Dollar Stores”, “Banks”, “Auto Parts”, and “Big Box”.
“Big Box” includes sub-sectors for “Large” (80,000+ sqft), “Mid” (40-60,000 sqft) and “Junior” (20-40,000 sqft) formats. 3<br>
“Big Box” includes sub-sectors for “Large” (80,000+ sqft), “Mid” (40-60,000 sqft) and “Junior” (20-40,000 sqft) formats. 3<br>
04
Important Issues Location Matters: In the Bucktown Neighborhood in Chicago, a Walgreens at nearly $11,900,000 (at a 5% cap rate with $595,000 annual NNN rent). Regarding this property, The Boulder Group states,
“The Walgreens vastly out positions the nearby older midblock CVS that does not have a drive thru providing for a significant competitive advantage.” 4<br>
“The Walgreens vastly out positions the nearby older midblock CVS that does not have a drive thru providing for a significant competitive advantage.” 4<br>
05
Important Issues Fee Simple: The concept does not require a property to be vacant and available to lease.
Fee Simple Subject To A Lease (FSSTAL): Real property owned by individual(s) or entity(ies) but occupied by others under lease. The lease is a contract and is subject to contract law.
Contract Rent = Market Rent: The real property owned (FSSTAL) has a value equal to the fee simple value of the subject because the marginal value of the lease contract is $0. Using market rent indicators is necessary when valuing the fee simple interest. 5<br>
Fee Simple Subject To A Lease (FSSTAL): Real property owned by individual(s) or entity(ies) but occupied by others under lease. The lease is a contract and is subject to contract law.
Contract Rent = Market Rent: The real property owned (FSSTAL) has a value equal to the fee simple value of the subject because the marginal value of the lease contract is $0. Using market rent indicators is necessary when valuing the fee simple interest. 5<br>
06
Important Issues Leased Fee: An appraisal term (not a legal term) that values a property based on the present value of a property’s specific rental terms and conditions (net operating income) plus the present value of the reversionary value of the property upon the lease expiration. This is synonymous with value in use.
Leasehold Interests can be Personal Property: Unless they exist for more than 30 additional years, leasehold interests are considered personal property and cannot be used in IRS Section 1031 Exchanges. 6<br>
Leasehold Interests can be Personal Property: Unless they exist for more than 30 additional years, leasehold interests are considered personal property and cannot be used in IRS Section 1031 Exchanges. 6<br>
07
Highest and Best Use The definition and fundamentals of highest and best use.
Highest and best use versus current use.
The role of the appraisal principles in a highest and best use analysis.
The interaction of the market forces and highest and best use. 7<br>
Highest and best use versus current use.
The role of the appraisal principles in a highest and best use analysis.
The interaction of the market forces and highest and best use. 7<br>
08
Highest and Best Use The three tests for highest and best use; plus the maximum.
Highest and best use is singular.
Highest and best use and the three valuation methods: it drives the valuation process.
Highest and best use must be correct for the valuation assignment to be correct. 8<br>
Highest and best use is singular.
Highest and best use and the three valuation methods: it drives the valuation process.
Highest and best use must be correct for the valuation assignment to be correct. 8<br>
09
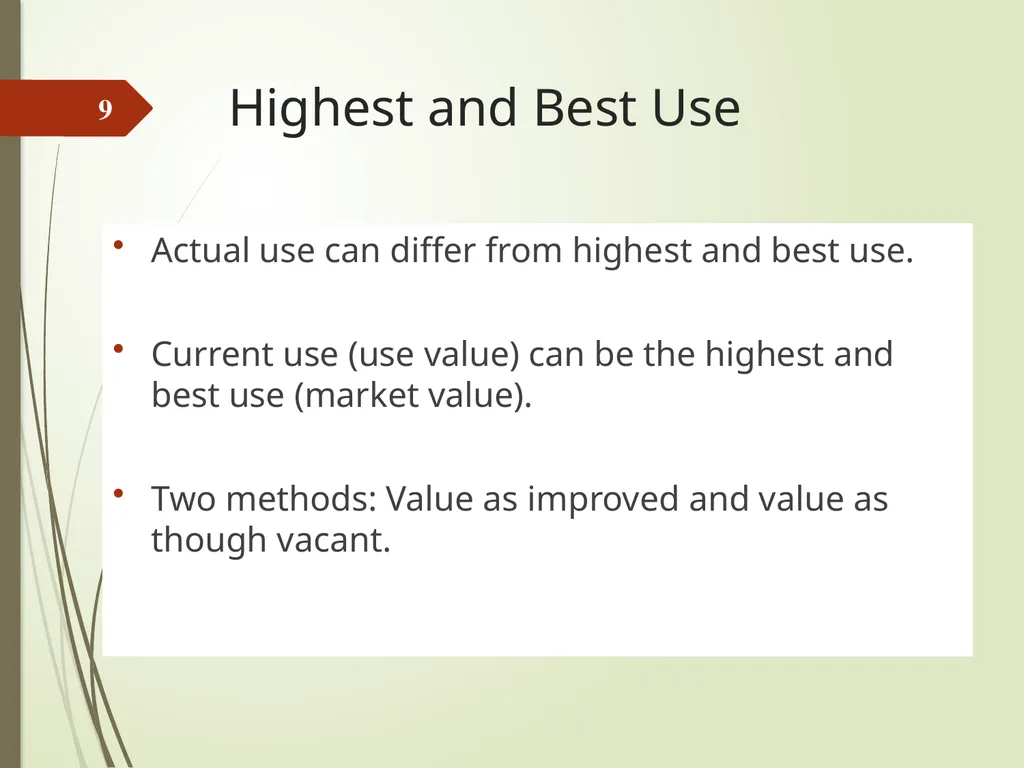
Highest and Best Use Actual use can differ from highest and best use.
Current use (use value) can be the highest and best use (market value).
Two methods: Value as improved and value as though vacant. 9<br>
Current use (use value) can be the highest and best use (market value).
Two methods: Value as improved and value as though vacant. 9<br>
10
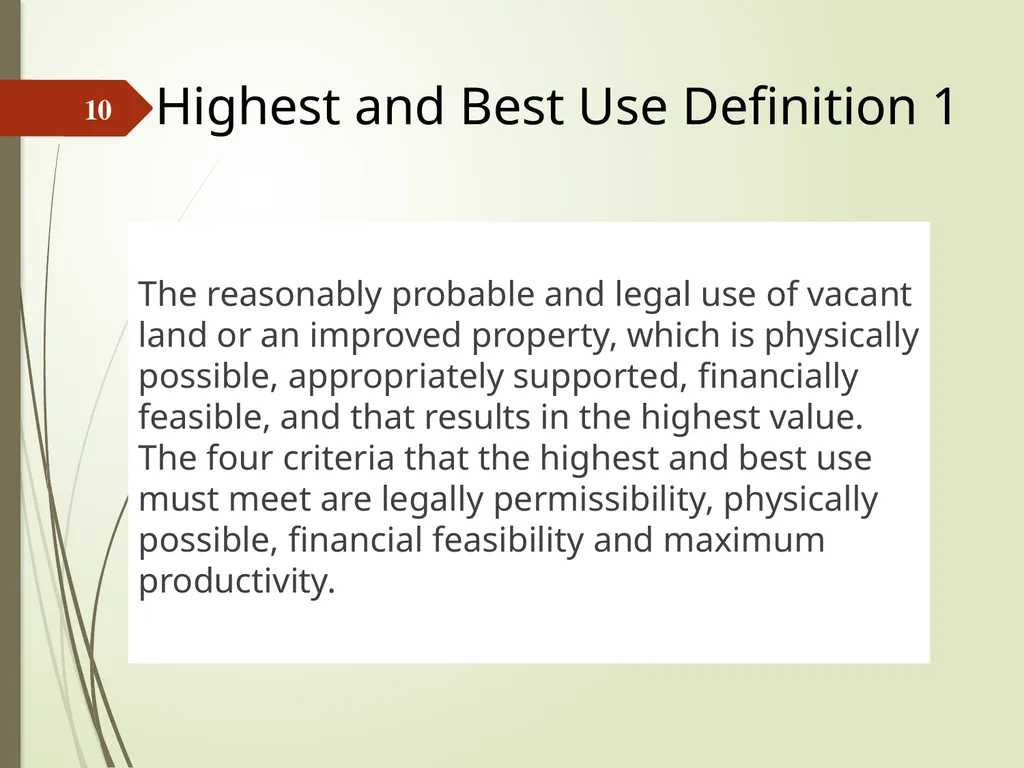
The reasonably probable and legal use of vacant land or an improved property, which is physically possible, appropriately supported, financially feasible, and that results in the highest value. The four criteria that the highest and best use must meet are legally permissibility, physically possible, financial feasibility and maximum productivity. Highest and Best Use Definition 1 10<br>
11
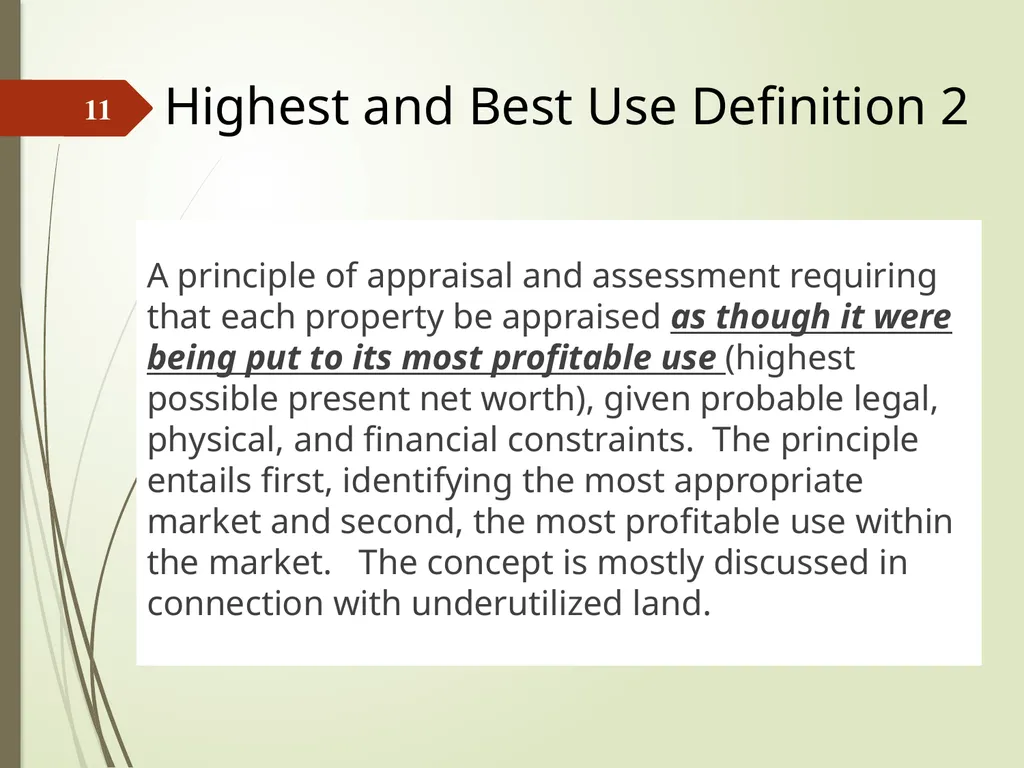
Highest and Best Use Definition 2 A principle of appraisal and assessment requiring that each property be appraised as though it were being put to its most profitable use (highest possible present net worth), given probable legal, physical, and financial constraints. The principle entails first, identifying the most appropriate market and second, the most profitable use within the market. The concept is mostly discussed in connection with underutilized land. 11<br>
12
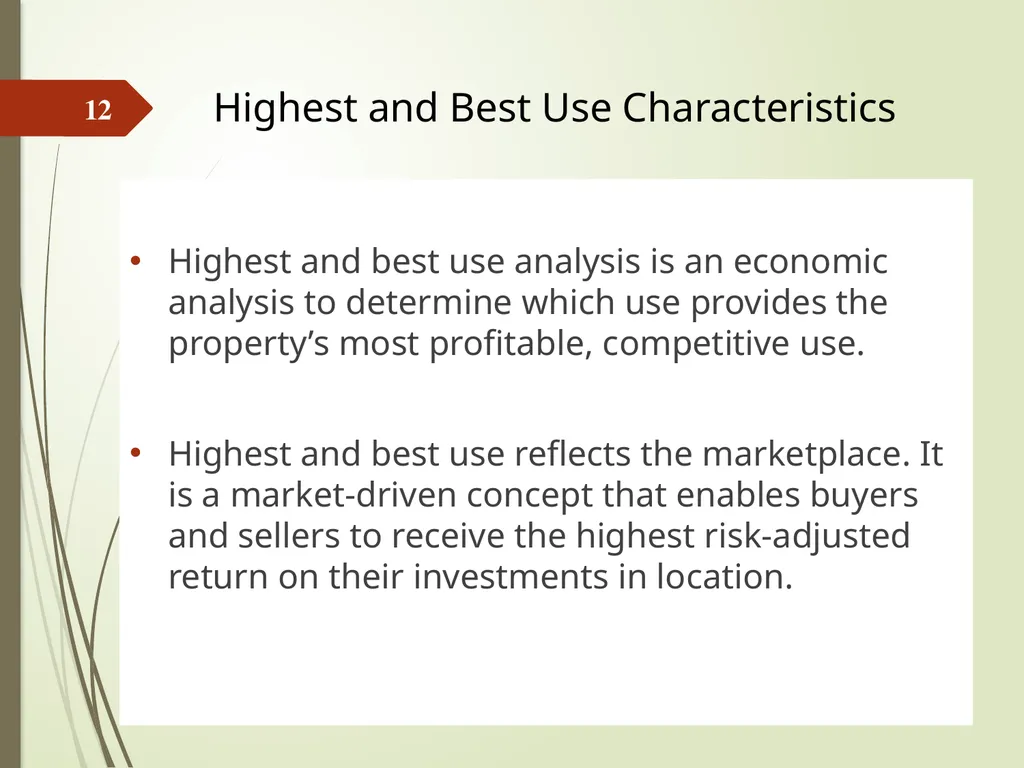
Highest and best use analysis is an economic analysis to determine which use provides the property’s most profitable, competitive use.
Highest and best use reflects the marketplace. It is a market-driven concept that enables buyers and sellers to receive the highest risk-adjusted return on their investments in location. Highest and Best Use Characteristics 12<br>
Highest and best use reflects the marketplace. It is a market-driven concept that enables buyers and sellers to receive the highest risk-adjusted return on their investments in location. Highest and Best Use Characteristics 12<br>
13
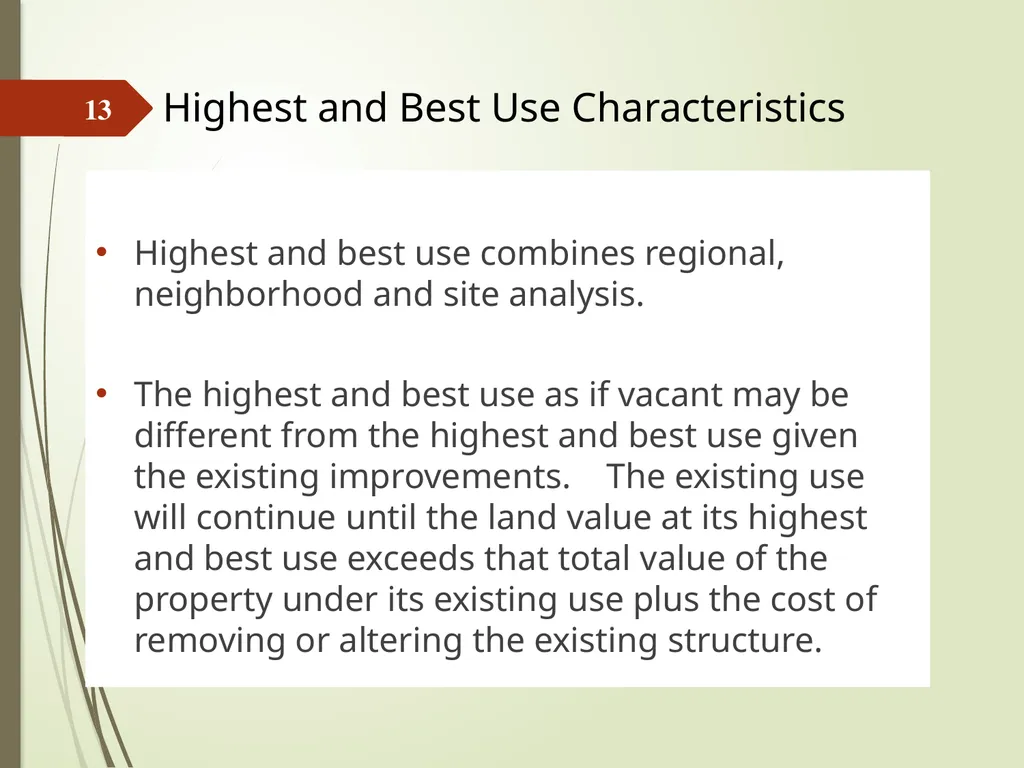
Highest and best use combines regional, neighborhood and site analysis.
The highest and best use as if vacant may be different from the highest and best use given the existing improvements. The existing use will continue until the land value at its highest and best use exceeds that total value of the property under its existing use plus the cost of removing or altering the existing structure. Highest and Best Use Characteristics 13<br>
The highest and best use as if vacant may be different from the highest and best use given the existing improvements. The existing use will continue until the land value at its highest and best use exceeds that total value of the property under its existing use plus the cost of removing or altering the existing structure. Highest and Best Use Characteristics 13<br>
14
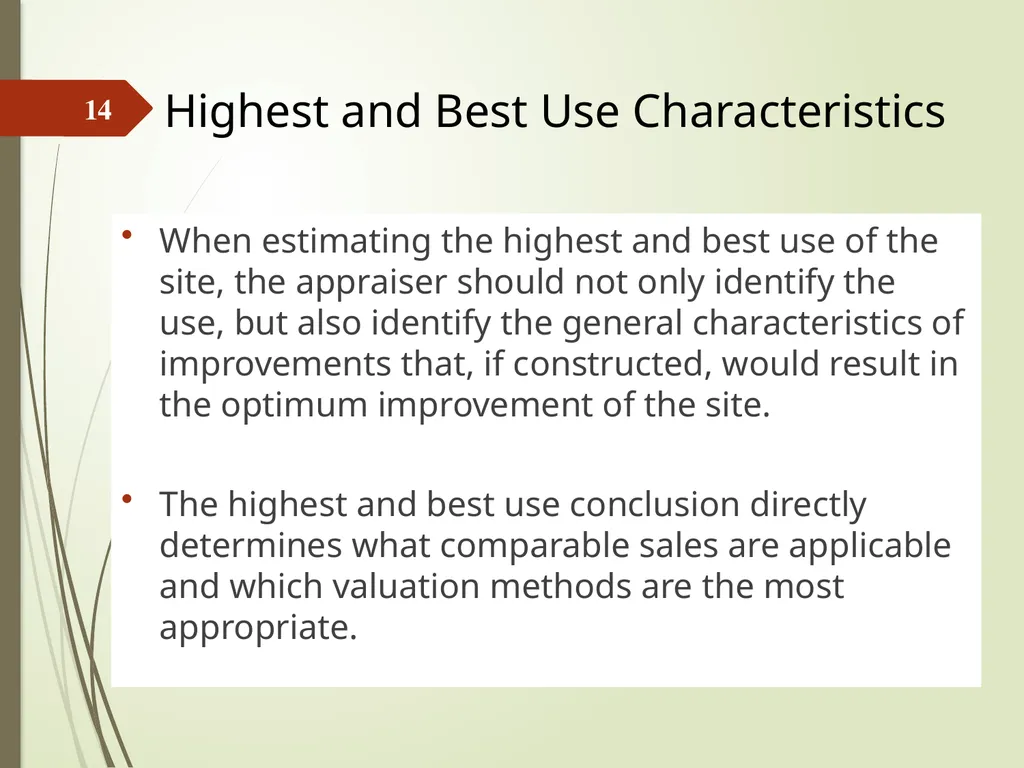
Highest and Best Use Characteristics When estimating the highest and best use of the site, the appraiser should not only identify the use, but also identify the general characteristics of improvements that, if constructed, would result in the optimum improvement of the site.
The highest and best use conclusion directly determines what comparable sales are applicable and which valuation methods are the most appropriate. 14<br>
The highest and best use conclusion directly determines what comparable sales are applicable and which valuation methods are the most appropriate. 14<br>
15
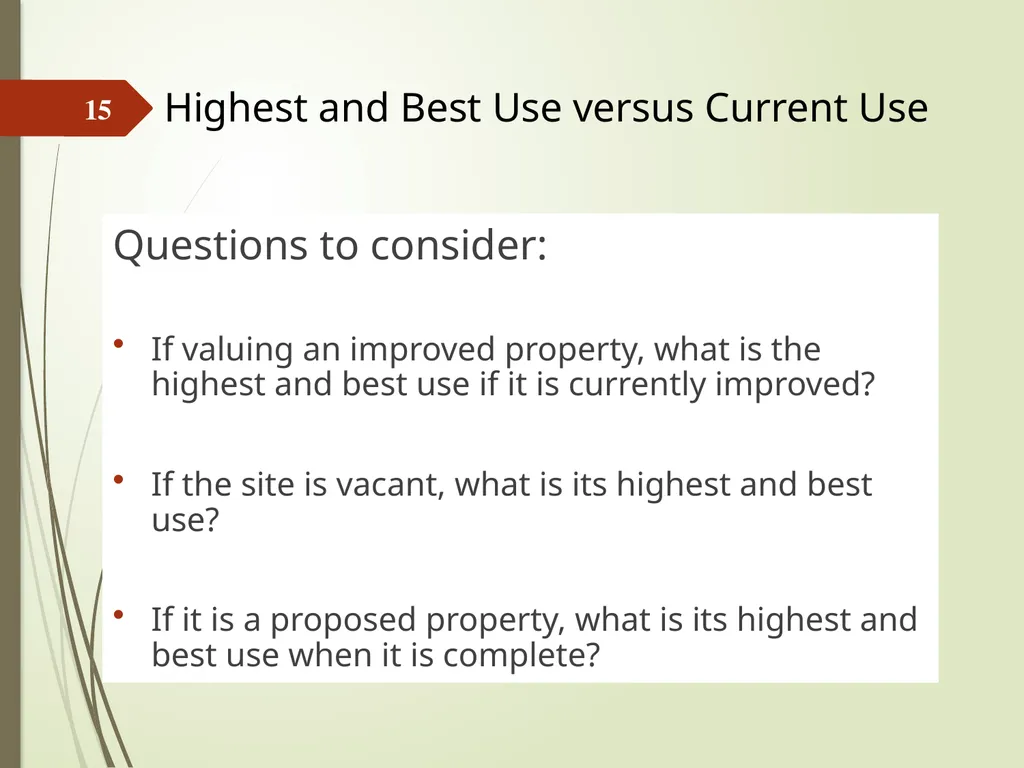
Highest and Best Use versus Current Use Questions to consider:
If valuing an improved property, what is the highest and best use if it is currently improved?
If the site is vacant, what is its highest and best use?
If it is a proposed property, what is its highest and best use when it is complete? 15<br>
If valuing an improved property, what is the highest and best use if it is currently improved?
If the site is vacant, what is its highest and best use?
If it is a proposed property, what is its highest and best use when it is complete? 15<br>
16
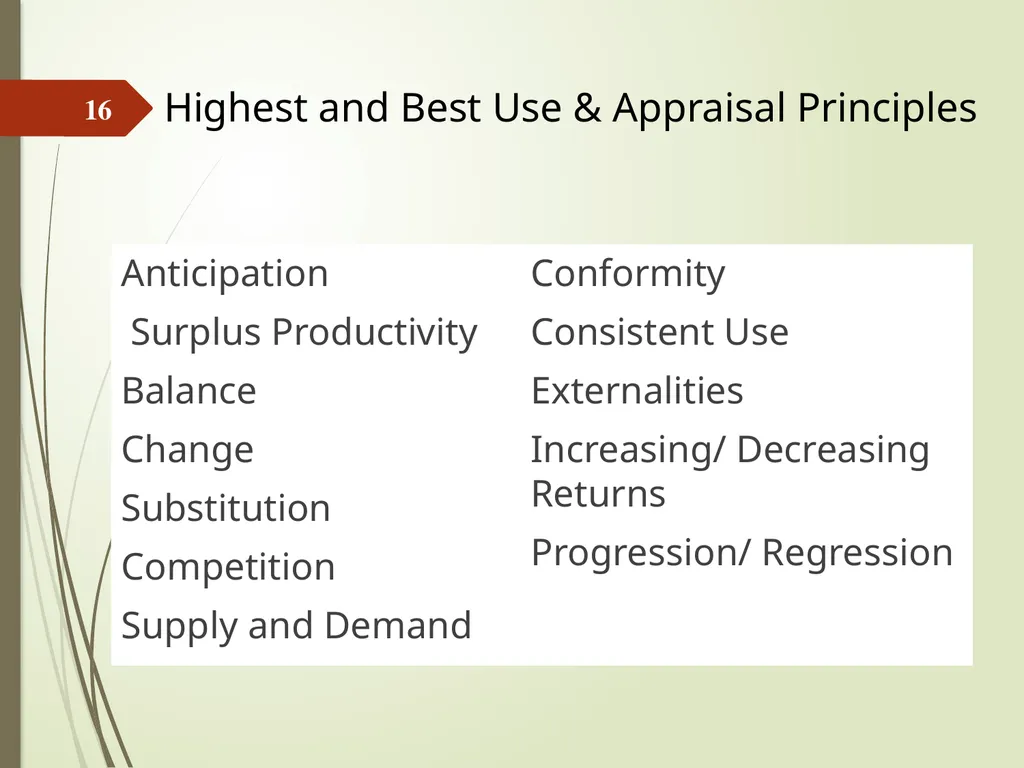
Highest and Best Use & Appraisal Principles Anticipation
Surplus Productivity
Balance
Change
Substitution
Competition
Supply and Demand Conformity
Consistent Use
Externalities
Increasing/ Decreasing Returns
Progression/ Regression 16<br>
Surplus Productivity
Balance
Change
Substitution
Competition
Supply and Demand Conformity
Consistent Use
Externalities
Increasing/ Decreasing Returns
Progression/ Regression 16<br>
17
Highest and Best Use Market Forces Physical (environmental) factors
Physical factors are both natural and man-made physical circumstances that affect the highest and best of a property.
The most significant physical factor in real estate highest and best use analysis is location. 17<br>
Physical factors are both natural and man-made physical circumstances that affect the highest and best of a property.
The most significant physical factor in real estate highest and best use analysis is location. 17<br>
18
Highest and Best Use Market Forces In looking at physical factors it is useful to distinguish between the internal concepts of site and external situation attributes.
Internal site attributes are the size, topography and other physical features of a given parcel. (S & W)
Situation attributes focus on the location of the parcel relative to other places such as the central business district, freeway access, shopping, schools, etc. (O & T)
Helps to develop a SWOT analysis—internal and external economics of the property. 18<br>
Internal site attributes are the size, topography and other physical features of a given parcel. (S & W)
Situation attributes focus on the location of the parcel relative to other places such as the central business district, freeway access, shopping, schools, etc. (O & T)
Helps to develop a SWOT analysis—internal and external economics of the property. 18<br>
19
Highest and Best Use Market Forces Market economics drive commercial real estate.
Employment levels and types, and interest rates, tax rates, etc., are more important to commercial and industrial properties since income flow is the primary purpose of commercial properties.
Physical and social factors are most important to both rural and residential properties, although different.
Soil type and land productivity are primary influences on agricultural property.
Municipal, community and educational factors play a major roles for residential properties. 19<br>
Employment levels and types, and interest rates, tax rates, etc., are more important to commercial and industrial properties since income flow is the primary purpose of commercial properties.
Physical and social factors are most important to both rural and residential properties, although different.
Soil type and land productivity are primary influences on agricultural property.
Municipal, community and educational factors play a major roles for residential properties. 19<br>
20
Economic factors influence supply and demand and the buying public’s economic ability to satisfy its wants and needs through property purchases.
Demand factors that affect value include employment levels, wage rates, income levels, purchasing power, the availability of financing, interest rates, etc.
Supply factors include the quantity of available land, development costs, financing costs, taxes, etc. Highest and Best Use Market Forces 20<br>
Demand factors that affect value include employment levels, wage rates, income levels, purchasing power, the availability of financing, interest rates, etc.
Supply factors include the quantity of available land, development costs, financing costs, taxes, etc. Highest and Best Use Market Forces 20<br>
21
Economic factors influence the quality of residential neighborhoods and the quality of residential housing within them.
Economic factors have a direct bearing on the income producing capability of commercial, industrial, and rural properties.
Government factors at all levels affect all property types through taxation, zoning, planning, lending, etc. Highest and Best Use Market Forces 21<br>
Economic factors have a direct bearing on the income producing capability of commercial, industrial, and rural properties.
Government factors at all levels affect all property types through taxation, zoning, planning, lending, etc. Highest and Best Use Market Forces 21<br>
22
A highest and best use study consists of three basic tests that must be looked at for both vacant and improved properties:
Legally permissible
Physically possible
Financially feasible
Most productive (greatest value: default)
The four criteria are like a filtering system and should be considered in sequential order. Highest and Best Use Four (Three) Tests 22<br>
Legally permissible
Physically possible
Financially feasible
Most productive (greatest value: default)
The four criteria are like a filtering system and should be considered in sequential order. Highest and Best Use Four (Three) Tests 22<br>
23
Legally permissible:
The process of making a judgment of which possible uses are legally permitted:
Zoning ordinances or restrictions.
Non-conforming uses.
Conditional use permits.
Building codes.
Subdivision regulations and deed restrictions.
Environmental laws.
Easements and rights of way. Highest and Best Use Four (Three) Tests 23<br>
The process of making a judgment of which possible uses are legally permitted:
Zoning ordinances or restrictions.
Non-conforming uses.
Conditional use permits.
Building codes.
Subdivision regulations and deed restrictions.
Environmental laws.
Easements and rights of way. Highest and Best Use Four (Three) Tests 23<br>
24
Physically possible (usually after legally permissible):
Physical attributes that should be considered include; size, shape, frontage, depth area, terrain, soil and subsoil conditions, subsurface water, topography, etc.
Public utilities must be available to the land and the utility systems must have the capacity to handle the intended use of the property. Highest and Best Use Four (Three) Tests 24<br>
Physical attributes that should be considered include; size, shape, frontage, depth area, terrain, soil and subsoil conditions, subsurface water, topography, etc.
Public utilities must be available to the land and the utility systems must have the capacity to handle the intended use of the property. Highest and Best Use Four (Three) Tests 24<br>
25
Physically possible (usually after legally permissible):
Another part of the physical analysis would be the possibility of site modifications.
Assemblage and Plottage
Example: Walgreen’s acquires two or more contiguous tracts in an area and combines the lots into one parcel that now has a larger value per square foot than what the lots had as single parcels. The value gain is plottage, combination of lots is assemblage. Highest and Best Use Four (Three) Tests 25<br>
Another part of the physical analysis would be the possibility of site modifications.
Assemblage and Plottage
Example: Walgreen’s acquires two or more contiguous tracts in an area and combines the lots into one parcel that now has a larger value per square foot than what the lots had as single parcels. The value gain is plottage, combination of lots is assemblage. Highest and Best Use Four (Three) Tests 25<br>
26
Physically Possible: Excess land vs. Surplus land
Excess land is land remaining after improvements are in place that can either be developed later or separated off for another use.
Excess land can have a separate highest and best use. Highest and Best Use Four (Three) Tests 26<br>
Excess land is land remaining after improvements are in place that can either be developed later or separated off for another use.
Excess land can have a separate highest and best use. Highest and Best Use Four (Three) Tests 26<br>
27
Physically Possible: Excess land vs. Surplus land
Surplus land cannot be sold or effectively utilized because of the limitations of its size or other physical characteristics.
Land can be assembled to create excess land from two or more areas of surplus land.
The combined surplus areas can also be separated off to create a new parcel with its own use value. Highest and Best Use Four (Three) Tests 27<br>
Surplus land cannot be sold or effectively utilized because of the limitations of its size or other physical characteristics.
Land can be assembled to create excess land from two or more areas of surplus land.
The combined surplus areas can also be separated off to create a new parcel with its own use value. Highest and Best Use Four (Three) Tests 27<br>
28
Financially feasible:
Once the parcel has a set of uses that are “reasonably probable”, e.g., legally permissible and physically possible, the next step is to analyze the financial feasibility of each reasonably probable use.
The question to be answered is simply, “Can the ‘reasonably probable use’ provide sufficient income to justify itself?
Financial feasibility is based on supply (who is the competition) and demand (who are the potential buyers, tenants and customers). Highest and Best Use Four (Three) Tests 28<br>
Once the parcel has a set of uses that are “reasonably probable”, e.g., legally permissible and physically possible, the next step is to analyze the financial feasibility of each reasonably probable use.
The question to be answered is simply, “Can the ‘reasonably probable use’ provide sufficient income to justify itself?
Financial feasibility is based on supply (who is the competition) and demand (who are the potential buyers, tenants and customers). Highest and Best Use Four (Three) Tests 28<br>
29
Financially feasible:
Requires extensive market research and accurate predictions of future market changes in supply and demand if the highest and best use differs from the current use.
This process involves the development of a detailed market analysis for each use that is determined to be legally permissible and physically possible to ensure that the use is financially feasible (profitable).
The one, singular use that achieves the derives the largest, net financial benefit is, by definition, the highest and best use. Highest and Best Use Four (Three) Tests 29<br>
Requires extensive market research and accurate predictions of future market changes in supply and demand if the highest and best use differs from the current use.
This process involves the development of a detailed market analysis for each use that is determined to be legally permissible and physically possible to ensure that the use is financially feasible (profitable).
The one, singular use that achieves the derives the largest, net financial benefit is, by definition, the highest and best use. Highest and Best Use Four (Three) Tests 29<br>
30
Market studies
Absorption analyses
Marketability studies
Site selection analyses Highest and Best Use: Where Else Used? 30<br>
Absorption analyses
Marketability studies
Site selection analyses Highest and Best Use: Where Else Used? 30<br>
31
Feasibility Example: “Front Door” Feasibility can be tested by analyzing the fundamental economics required to financially justify new construction. The required rate of return necessary on the cost of new construction (including soft costs, profit and land) can be compared with achievable market rent levels for new construction. This is called the front-door approach. 31<br>
32
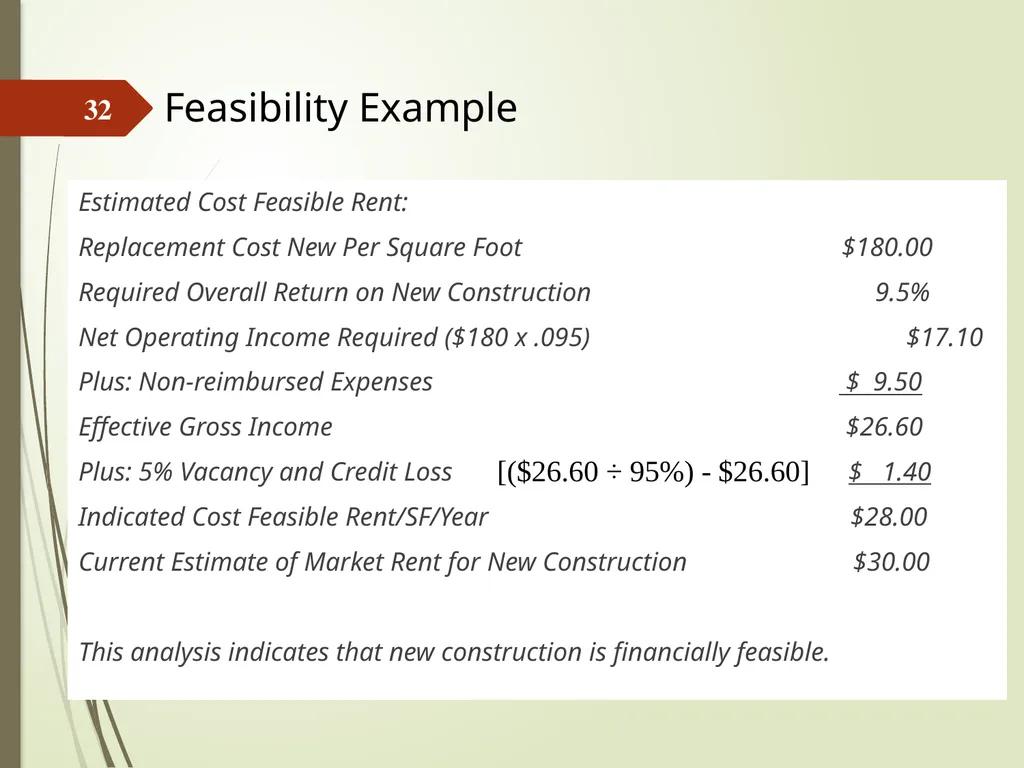
Feasibility Example Estimated Cost Feasible Rent:
Replacement Cost New Per Square Foot $180.00
Required Overall Return on New Construction 9.5%
Net Operating Income Required ($180 x .095) $17.10
Plus: Non-reimbursed Expenses $ 9.50
Effective Gross Income $26.60
Plus: 5% Vacancy and Credit Loss $ 1.40
Indicated Cost Feasible Rent/SF/Year $28.00
Current Estimate of Market Rent for New Construction $30.00
This analysis indicates that new construction is financially feasible. 32<br>
Replacement Cost New Per Square Foot $180.00
Required Overall Return on New Construction 9.5%
Net Operating Income Required ($180 x .095) $17.10
Plus: Non-reimbursed Expenses $ 9.50
Effective Gross Income $26.60
Plus: 5% Vacancy and Credit Loss $ 1.40
Indicated Cost Feasible Rent/SF/Year $28.00
Current Estimate of Market Rent for New Construction $30.00
This analysis indicates that new construction is financially feasible. 32<br>
33
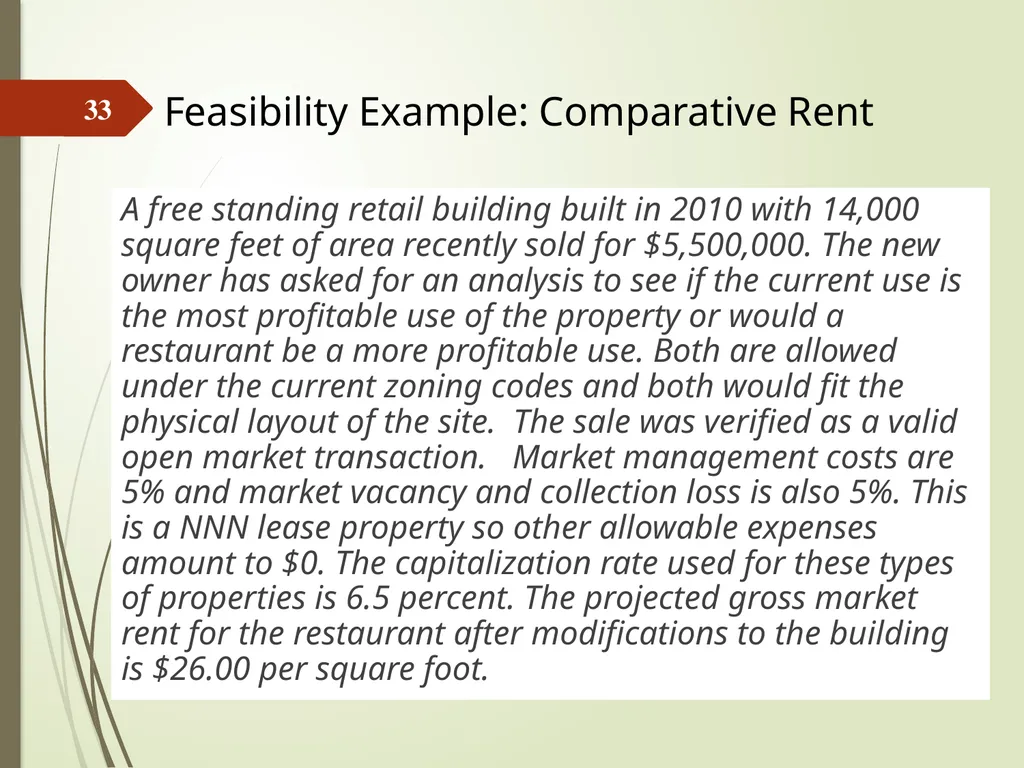
Feasibility Example: Comparative Rent A free standing retail building built in 2010 with 14,000 square feet of area recently sold for $5,500,000. The new owner has asked for an analysis to see if the current use is the most profitable use of the property or would a restaurant be a more profitable use. Both are allowed under the current zoning codes and both would fit the physical layout of the site. The sale was verified as a valid open market transaction. Market management costs are 5% and market vacancy and collection loss is also 5%. This is a NNN lease property so other allowable expenses amount to $0. The capitalization rate used for these types of properties is 6.5 percent. The projected gross market rent for the restaurant after modifications to the building is $26.00 per square foot. 33<br>
34
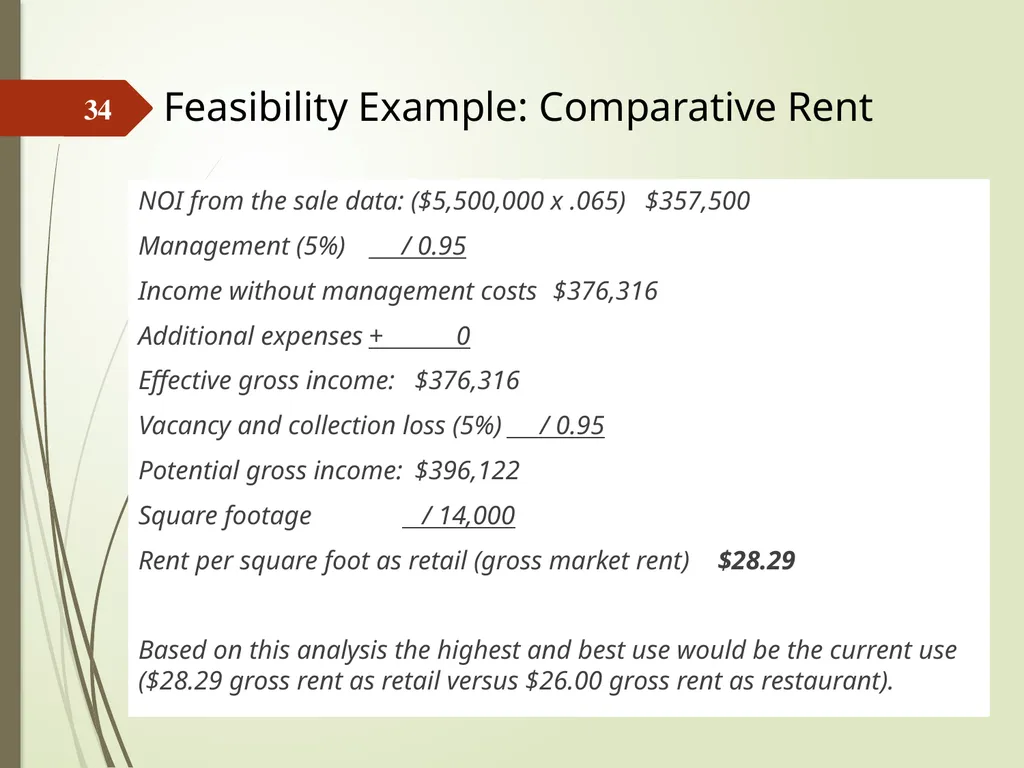
NOI from the sale data: ($5,500,000 x .065) $357,500
Management (5%) / 0.95
Income without management costs $376,316
Additional expenses + 0
Effective gross income: $376,316
Vacancy and collection loss (5%) / 0.95
Potential gross income: $396,122
Square footage / 14,000
Rent per square foot as retail (gross market rent) $28.29
Based on this analysis the highest and best use would be the current use ($28.29 gross rent as retail versus $26.00 gross rent as restaurant). Feasibility Example: Comparative Rent 34<br>
Management (5%) / 0.95
Income without management costs $376,316
Additional expenses + 0
Effective gross income: $376,316
Vacancy and collection loss (5%) / 0.95
Potential gross income: $396,122
Square footage / 14,000
Rent per square foot as retail (gross market rent) $28.29
Based on this analysis the highest and best use would be the current use ($28.29 gross rent as retail versus $26.00 gross rent as restaurant). Feasibility Example: Comparative Rent 34<br>
35
Assemblage and Plottage Value
If assemblage is possible, it must also be determined if plottage value exists. If not, then it may be most feasible to leave the properties separated in their current use.
Value of Frontage, Access and Visibility
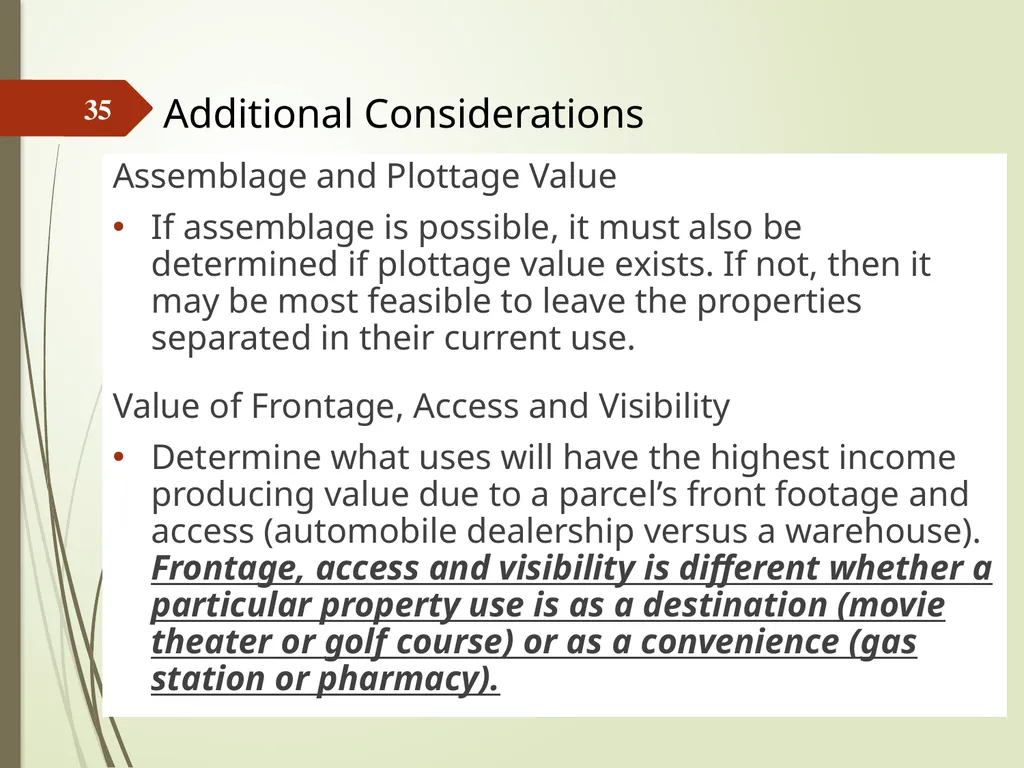
Determine what uses will have the highest income producing value due to a parcel’s front footage and access (automobile dealership versus a warehouse). Frontage, access and visibility is different whether a particular property use is as a destination (movie theater or golf course) or as a convenience (gas station or pharmacy). Additional Considerations 35<br>
If assemblage is possible, it must also be determined if plottage value exists. If not, then it may be most feasible to leave the properties separated in their current use.
Value of Frontage, Access and Visibility
Determine what uses will have the highest income producing value due to a parcel’s front footage and access (automobile dealership versus a warehouse). Frontage, access and visibility is different whether a particular property use is as a destination (movie theater or golf course) or as a convenience (gas station or pharmacy). Additional Considerations 35<br>
36
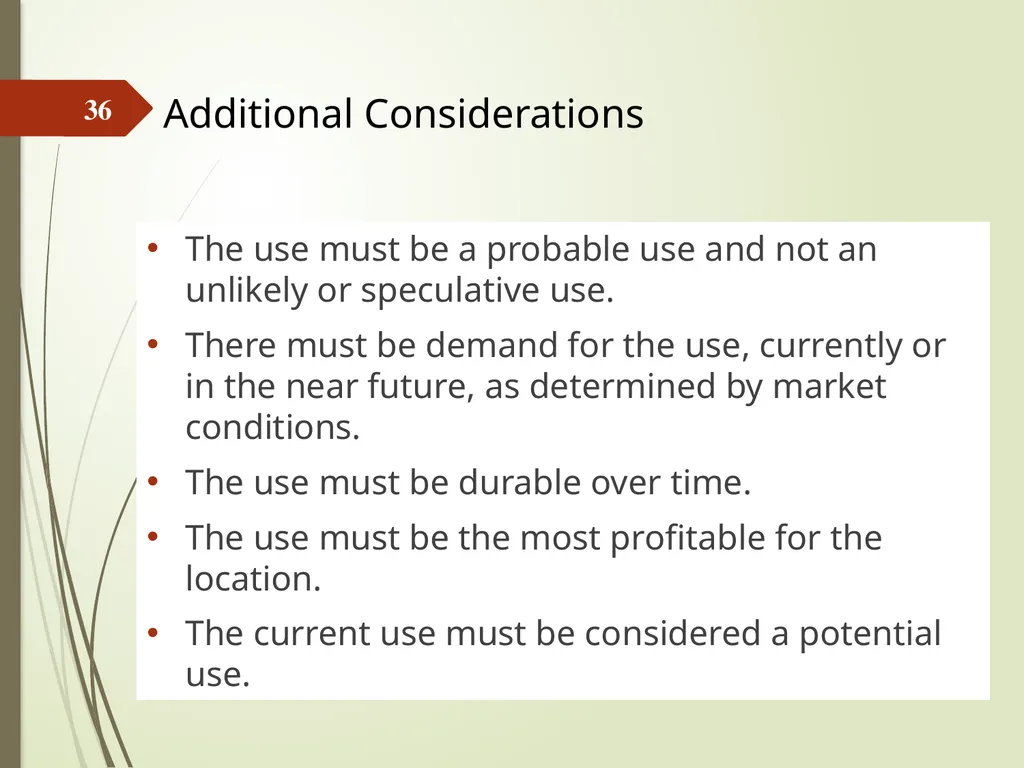
The use must be a probable use and not an unlikely or speculative use.
There must be demand for the use, currently or in the near future, as determined by market conditions.
The use must be durable over time.
The use must be the most profitable for the location.
The current use must be considered a potential use. Additional Considerations 36<br>
There must be demand for the use, currently or in the near future, as determined by market conditions.
The use must be durable over time.
The use must be the most profitable for the location.
The current use must be considered a potential use. Additional Considerations 36<br>
37
If you are valuing an improved property, what is the highest and best use as currently improved?
If the site is vacant, what is its highest and best use?
If it is a proposed property, what is the highest and best use when it is complete? HBU Questions to Consider 37<br>
If the site is vacant, what is its highest and best use?
If it is a proposed property, what is the highest and best use when it is complete? HBU Questions to Consider 37<br>
38
Land as though vacant
As though vacant is the fundamental basis of land value.
Critical data in estimating the highest and best use of land includes vacant land sales, zoning, demographic data for the subject neighborhood, market trends, income and expense data for the type of improvements being considered and the demand and supply data for the market.
If the land is already vacant, it is analyzed as is. HBU as Vacant 38<br>
As though vacant is the fundamental basis of land value.
Critical data in estimating the highest and best use of land includes vacant land sales, zoning, demographic data for the subject neighborhood, market trends, income and expense data for the type of improvements being considered and the demand and supply data for the market.
If the land is already vacant, it is analyzed as is. HBU as Vacant 38<br>
39
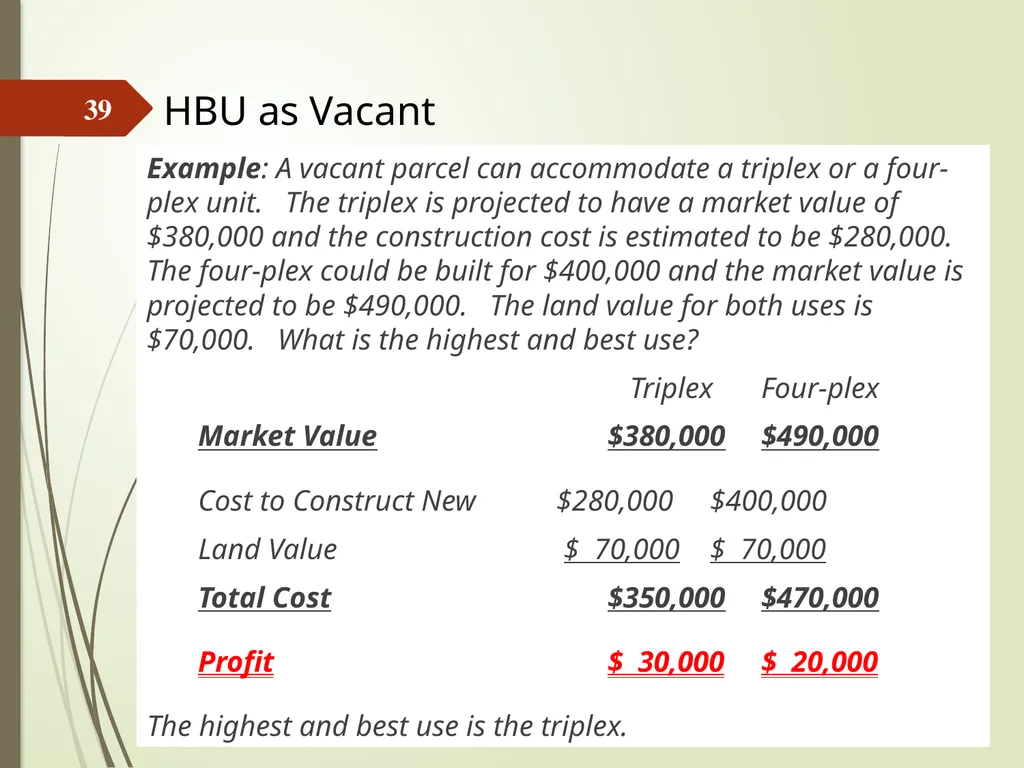
Example: A vacant parcel can accommodate a triplex or a four-plex unit. The triplex is projected to have a market value of $380,000 and the construction cost is estimated to be $280,000. The four-plex could be built for $400,000 and the market value is projected to be $490,000. The land value for both uses is $70,000. What is the highest and best use?
Triplex Four-plex
Market Value $380,000 $490,000
Cost to Construct New $280,000 $400,000
Land Value $ 70,000 $ 70,000
Total Cost $350,000 $470,000
Profit $ 30,000 $ 20,000
The highest and best use is the triplex. HBU as Vacant 39<br>
Triplex Four-plex
Market Value $380,000 $490,000
Cost to Construct New $280,000 $400,000
Land Value $ 70,000 $ 70,000
Total Cost $350,000 $470,000
Profit $ 30,000 $ 20,000
The highest and best use is the triplex. HBU as Vacant 39<br>
40
If the land is already improved, it is analyzed as a vacant property as if the improvements were removed.
When the land is already improved, the land as though vacant analysis includes the cost of demolition of the existing improvements.
Example: If the vacant land value exceeds the value as improved considering both at their highest and best use, then the appraisal would proceed under the hypothetical condition that the property value is equal to the vacant land ready for development to its highest and best use, less the cost of demolishing of existing improvements. HBU as Vacant 40<br>
When the land is already improved, the land as though vacant analysis includes the cost of demolition of the existing improvements.
Example: If the vacant land value exceeds the value as improved considering both at their highest and best use, then the appraisal would proceed under the hypothetical condition that the property value is equal to the vacant land ready for development to its highest and best use, less the cost of demolishing of existing improvements. HBU as Vacant 40<br>
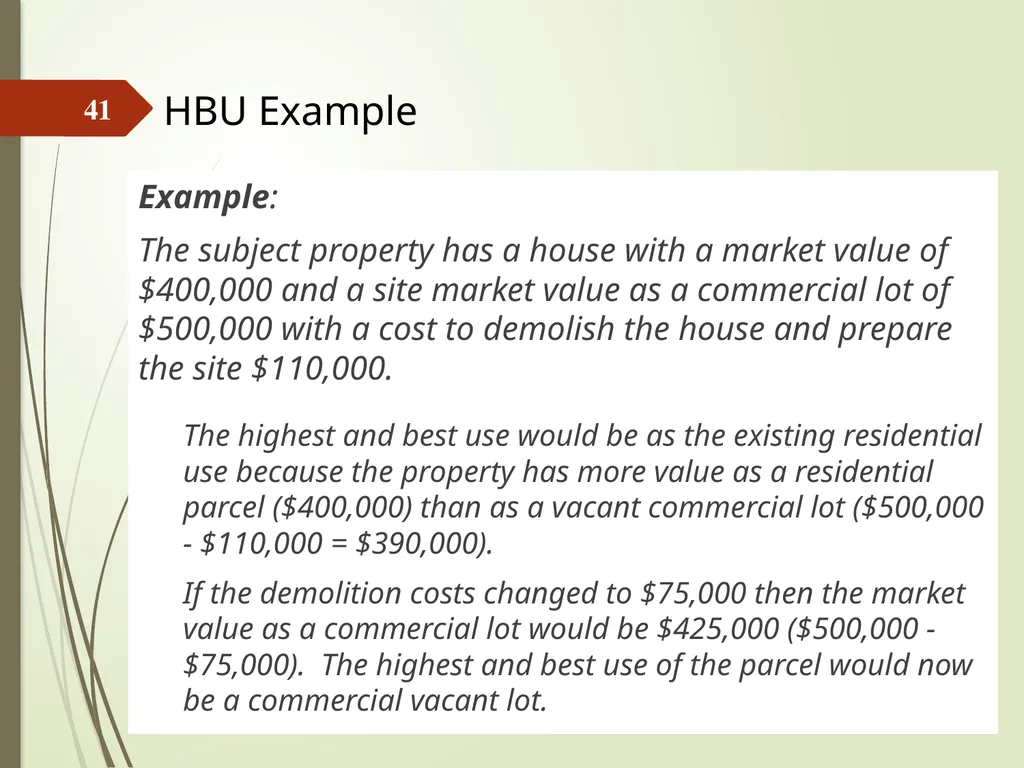
41
Example:
The subject property has a house with a market value of $400,000 and a site market value as a commercial lot of $500,000 with a cost to demolish the house and prepare the site $110,000.
The highest and best use would be as the existing residential use because the property has more value as a residential parcel ($400,000) than as a vacant commercial lot ($500,000 - $110,000 = $390,000).
If the demolition costs changed to $75,000 then the market value as a commercial lot would be $425,000 ($500,000 - $75,000). The highest and best use of the parcel would now be a commercial vacant lot. HBU Example 41<br>
The subject property has a house with a market value of $400,000 and a site market value as a commercial lot of $500,000 with a cost to demolish the house and prepare the site $110,000.
The highest and best use would be as the existing residential use because the property has more value as a residential parcel ($400,000) than as a vacant commercial lot ($500,000 - $110,000 = $390,000).
If the demolition costs changed to $75,000 then the market value as a commercial lot would be $425,000 ($500,000 - $75,000). The highest and best use of the parcel would now be a commercial vacant lot. HBU Example 41<br>
42
When the land is already improved, the land as improved analysis may include the cost of demolition of the existing improvements. In this process the market value of the existing improvements is compared with the potential market value in an alternate use. This is a measure of potential functional obsolescence comparing the current use with the alternate use.
Highest and best use as improved may involve rehabilitation, modernization, expansion or conversion to another use instead of demolition. Any rehabilitation should make certain that there will be the highest possible profit realized from the hypothetical changes to the property. HBU as Improved 42<br>
Highest and best use as improved may involve rehabilitation, modernization, expansion or conversion to another use instead of demolition. Any rehabilitation should make certain that there will be the highest possible profit realized from the hypothetical changes to the property. HBU as Improved 42<br>
43
Example:
An older “challenged” single family house is in an area zoned for commercial use. If there is more demand for residential than commercial use, it may be advantageous to remodel the house and rent it out. If the residential demand increases, it may be feasible to expand the rental into a duplex. As commercial demand increases, the owner might receive more rent by converting the duplex into office space. Then, when the demand for conventional retail buildings becomes high enough, it’s time to demolish and rebuild. HBU as Improved and the Principle of Change 43<br>
An older “challenged” single family house is in an area zoned for commercial use. If there is more demand for residential than commercial use, it may be advantageous to remodel the house and rent it out. If the residential demand increases, it may be feasible to expand the rental into a duplex. As commercial demand increases, the owner might receive more rent by converting the duplex into office space. Then, when the demand for conventional retail buildings becomes high enough, it’s time to demolish and rebuild. HBU as Improved and the Principle of Change 43<br>
44
Cost Approach:
The economic concepts of utility and substitution drive both the cost approach and the highest and best use analysis. The highest and best use of a property determines its utility to a potential purchaser. The purchaser of such a property would pay “not one dollar more” than a competing property with the same utility while a seller would accept “not one dollar less” than a seller of a comparable property.
In the cost approach the site is valued at its highest and best use, but the highest and best use as if vacant may be different than that as improved. HBU & Valuation Approaches 44<br>
The economic concepts of utility and substitution drive both the cost approach and the highest and best use analysis. The highest and best use of a property determines its utility to a potential purchaser. The purchaser of such a property would pay “not one dollar more” than a competing property with the same utility while a seller would accept “not one dollar less” than a seller of a comparable property.
In the cost approach the site is valued at its highest and best use, but the highest and best use as if vacant may be different than that as improved. HBU & Valuation Approaches 44<br>
45
Sales Comparison Approach:
In the sales comparison approach the highest and best use is significant when selecting comparable properties.
Appraisers must be consistent in selecting comparable properties that have the same highest and best use.
If, due to limited sales of properties, comparable properties and the subject have different highest and best uses, the appraiser must make certain to account for any value differences attributable to the differences in highest and best use. HBU & Valuation Approaches 45<br>
In the sales comparison approach the highest and best use is significant when selecting comparable properties.
Appraisers must be consistent in selecting comparable properties that have the same highest and best use.
If, due to limited sales of properties, comparable properties and the subject have different highest and best uses, the appraiser must make certain to account for any value differences attributable to the differences in highest and best use. HBU & Valuation Approaches 45<br>
46
Income Approach:
The rent, expenses, vacancy rate and capitalization rate used to value a property by the income approach, should reflect the highest and best use of the property.
Just like in the sales comparison approach the rental, expense and other data should be collected from comparable properties that have the same highest and best use as your subject property.
When there is a conflict with the actual use versus the highest and best use as determined by the assessor/appraiser, then an adjustment for conversion costs may be needed to bring the property to its highest and best use. HBU & Valuation Approaches 46<br>
The rent, expenses, vacancy rate and capitalization rate used to value a property by the income approach, should reflect the highest and best use of the property.
Just like in the sales comparison approach the rental, expense and other data should be collected from comparable properties that have the same highest and best use as your subject property.
When there is a conflict with the actual use versus the highest and best use as determined by the assessor/appraiser, then an adjustment for conversion costs may be needed to bring the property to its highest and best use. HBU & Valuation Approaches 46<br>
47
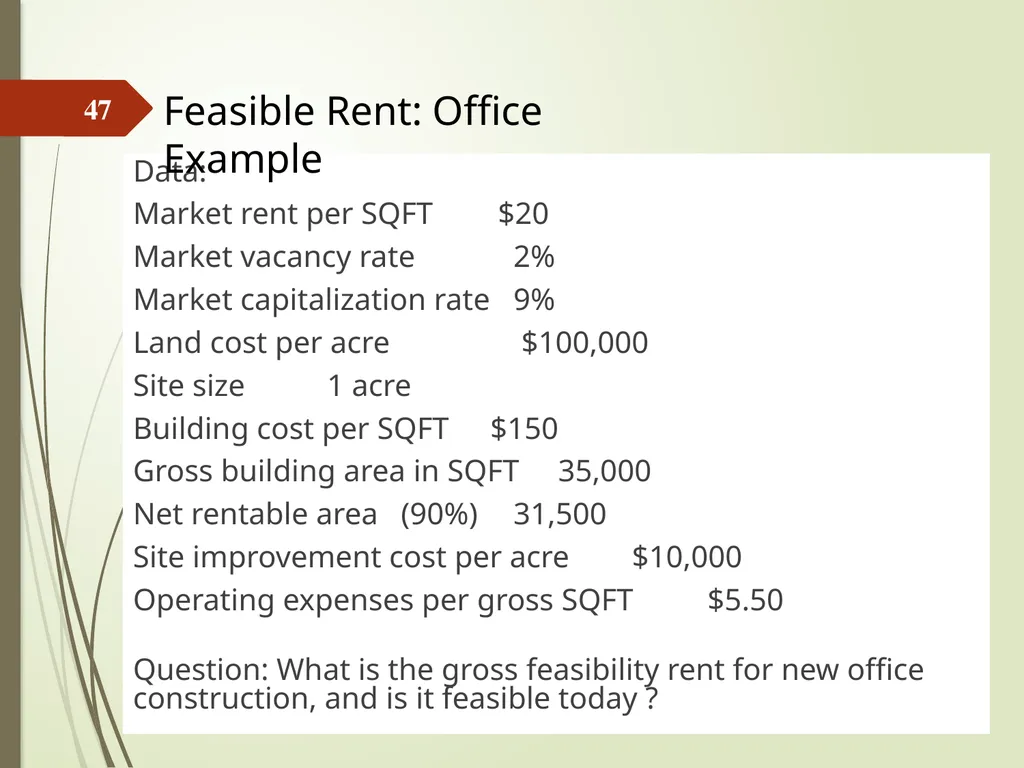
Data:
Market rent per SQFT $20
Market vacancy rate 2%
Market capitalization rate 9%
Land cost per acre $100,000
Site size 1 acre
Building cost per SQFT $150
Gross building area in SQFT 35,000
Net rentable area (90%) 31,500
Site improvement cost per acre $10,000
Operating expenses per gross SQFT $5.50
Question: What is the gross feasibility rent for new office construction, and is it feasible today ? Feasible Rent: Office Example 47<br>
Market rent per SQFT $20
Market vacancy rate 2%
Market capitalization rate 9%
Land cost per acre $100,000
Site size 1 acre
Building cost per SQFT $150
Gross building area in SQFT 35,000
Net rentable area (90%) 31,500
Site improvement cost per acre $10,000
Operating expenses per gross SQFT $5.50
Question: What is the gross feasibility rent for new office construction, and is it feasible today ? Feasible Rent: Office Example 47<br>
48
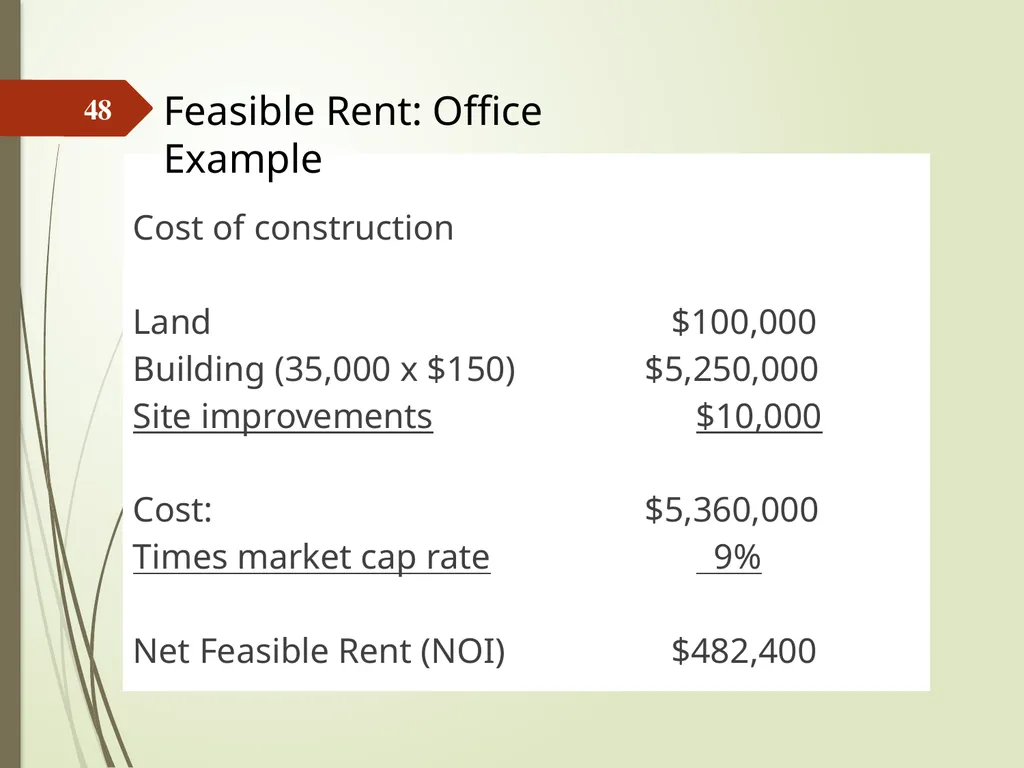
Cost of construction
Land $100,000
Building (35,000 x $150) $5,250,000
Site improvements $10,000
Cost: $5,360,000
Times market cap rate 9%
Net Feasible Rent (NOI) $482,400 Feasible Rent: Office Example 48<br>
Land $100,000
Building (35,000 x $150) $5,250,000
Site improvements $10,000
Cost: $5,360,000
Times market cap rate 9%
Net Feasible Rent (NOI) $482,400 Feasible Rent: Office Example 48<br>
49
NOI $482,400
plus operating expenses $192,500
Effective gross income $674,900
divided by (1-vacancy rate) 0.98
Potential gross income $688,673
divided by rentable SQFT 31,500
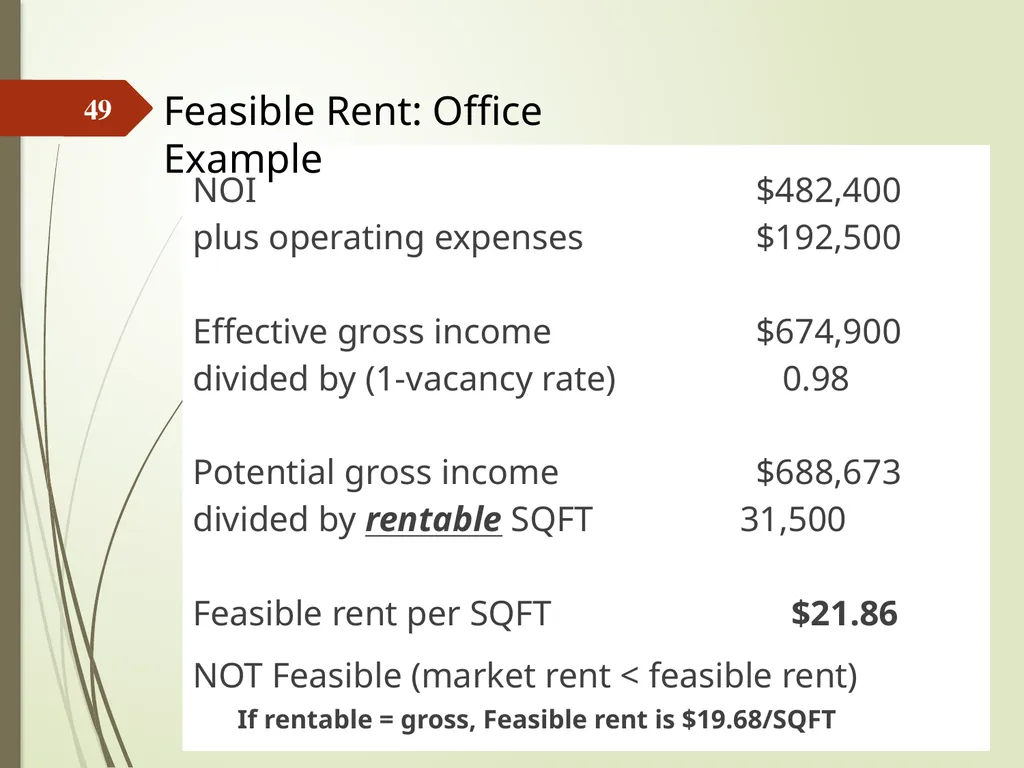
Feasible rent per SQFT $21.86
NOT Feasible (market rent < feasible rent)
If rentable = gross, Feasible rent is $19.68/SQFT Feasible Rent: Office Example 49<br>
plus operating expenses $192,500
Effective gross income $674,900
divided by (1-vacancy rate) 0.98
Potential gross income $688,673
divided by rentable SQFT 31,500
Feasible rent per SQFT $21.86
NOT Feasible (market rent < feasible rent)
If rentable = gross, Feasible rent is $19.68/SQFT Feasible Rent: Office Example 49<br>
50
Total current supply (units) 1,000
Total current demand (units) 900
Future demand (5 years, in units) 1,100
Frictional vacancy 5%
1. How many units must be absorbed to reach stabilized occupancy?
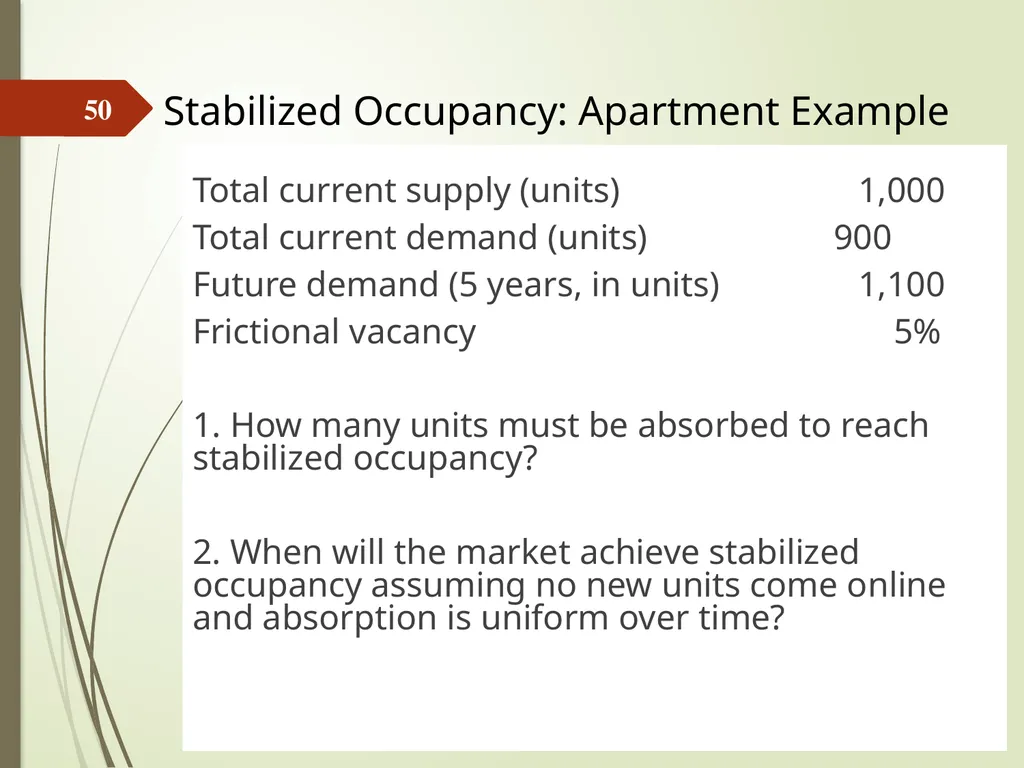
2. When will the market achieve stabilized occupancy assuming no new units come online and absorption is uniform over time? Stabilized Occupancy: Apartment Example 50<br>
Total current demand (units) 900
Future demand (5 years, in units) 1,100
Frictional vacancy 5%
1. How many units must be absorbed to reach stabilized occupancy?
2. When will the market achieve stabilized occupancy assuming no new units come online and absorption is uniform over time? Stabilized Occupancy: Apartment Example 50<br>
51
Total current supply (units) 1,000
Total current demand (units) 900
Future demand (5 years, in units) 1,100
Frictional vacancy 5%
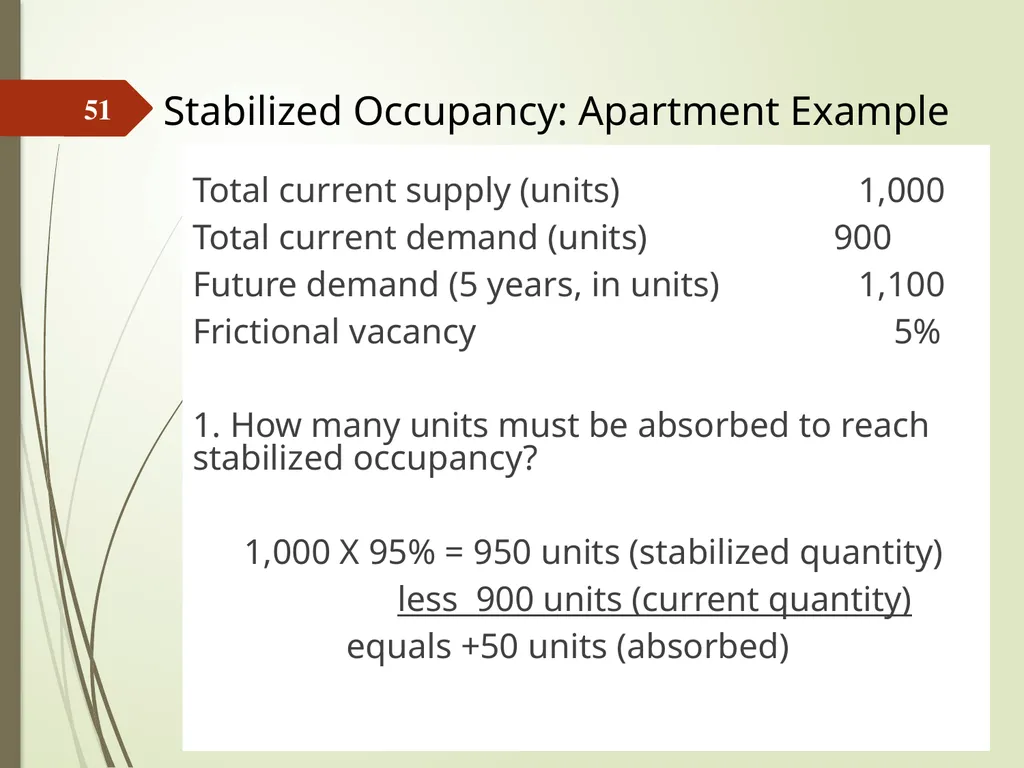
1. How many units must be absorbed to reach stabilized occupancy?
1,000 X 95% = 950 units (stabilized quantity)
less 900 units (current quantity)
equals +50 units (absorbed) Stabilized Occupancy: Apartment Example 51<br>
Total current demand (units) 900
Future demand (5 years, in units) 1,100
Frictional vacancy 5%
1. How many units must be absorbed to reach stabilized occupancy?
1,000 X 95% = 950 units (stabilized quantity)
less 900 units (current quantity)
equals +50 units (absorbed) Stabilized Occupancy: Apartment Example 51<br>
52
Total current supply (units) 1,000
Total current demand (units) 900
Future demand (5 years, in units) 1,100
Frictional vacancy 5%
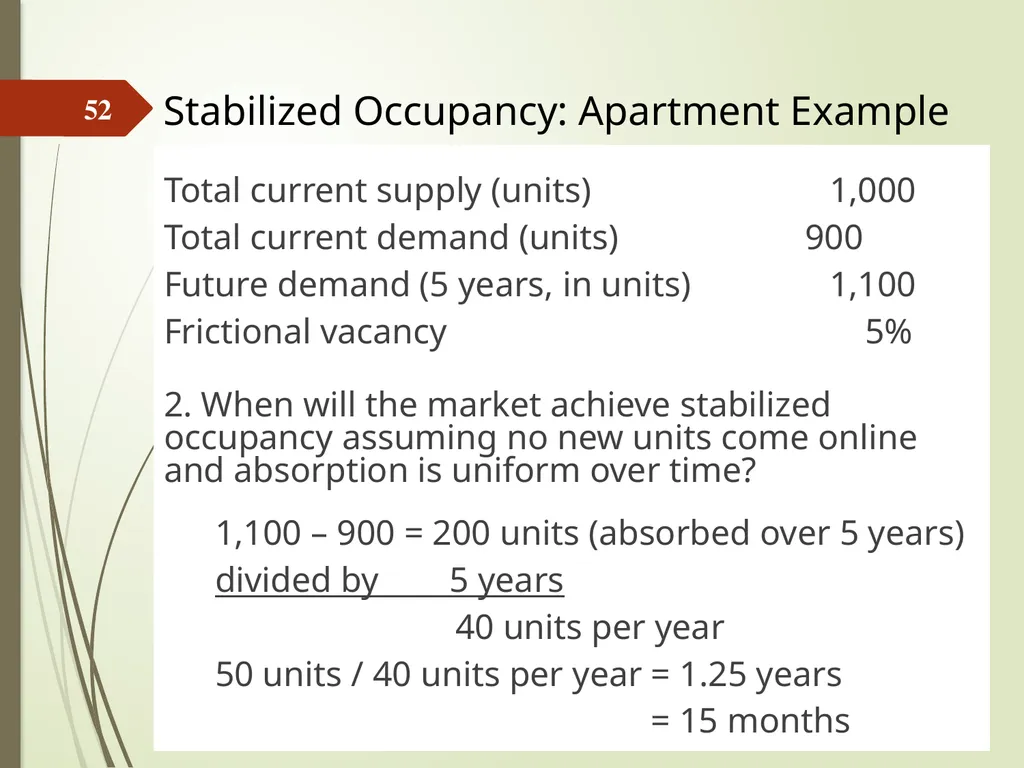
2. When will the market achieve stabilized occupancy assuming no new units come online and absorption is uniform over time?
1,100 – 900 = 200 units (absorbed over 5 years)
divided by 5 years
40 units per year
50 units / 40 units per year = 1.25 years
= 15 months Stabilized Occupancy: Apartment Example 52<br>
Total current demand (units) 900
Future demand (5 years, in units) 1,100
Frictional vacancy 5%
2. When will the market achieve stabilized occupancy assuming no new units come online and absorption is uniform over time?
1,100 – 900 = 200 units (absorbed over 5 years)
divided by 5 years
40 units per year
50 units / 40 units per year = 1.25 years
= 15 months Stabilized Occupancy: Apartment Example 52<br>
53
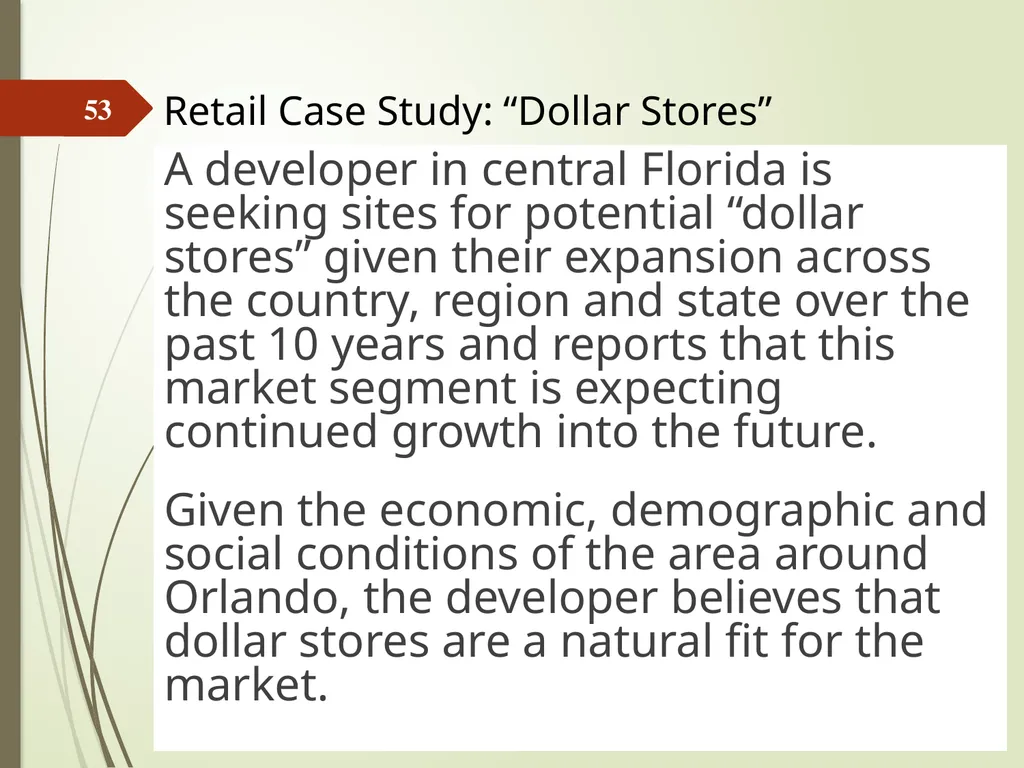
A developer in central Florida is seeking sites for potential “dollar stores” given their expansion across the country, region and state over the past 10 years and reports that this market segment is expecting continued growth into the future.
Given the economic, demographic and social conditions of the area around Orlando, the developer believes that dollar stores are a natural fit for the market. Retail Case Study: “Dollar Stores” 53<br>
Given the economic, demographic and social conditions of the area around Orlando, the developer believes that dollar stores are a natural fit for the market. Retail Case Study: “Dollar Stores” 53<br>
54
Population and household growth in the Orlando area is toward the east, and there are only a few competing dollar stores in the path of development. Therefore, this should be a good potential area to find the “best” locations for this property market segment provided the demand data support this type of retail.
The developer will analyze the physical, legal, and demographic/economic characteristics of the area to use in a financial feasibility analysis to determine the best locations for potential dollar stores. Retail Case Study: “Dollar Stores” 54<br>
The developer will analyze the physical, legal, and demographic/economic characteristics of the area to use in a financial feasibility analysis to determine the best locations for potential dollar stores. Retail Case Study: “Dollar Stores” 54<br>
55
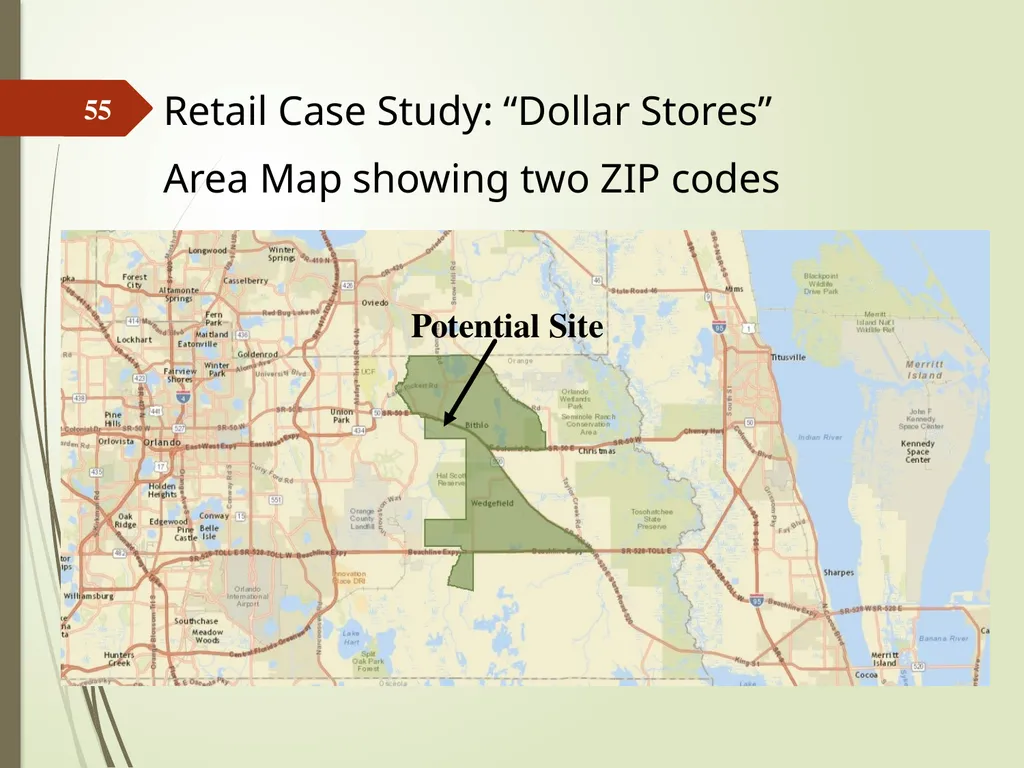
55 Retail Case Study: “Dollar Stores”
Area Map showing two ZIP codes Potential Site<br>
Area Map showing two ZIP codes Potential Site<br>
56
56<br>
57
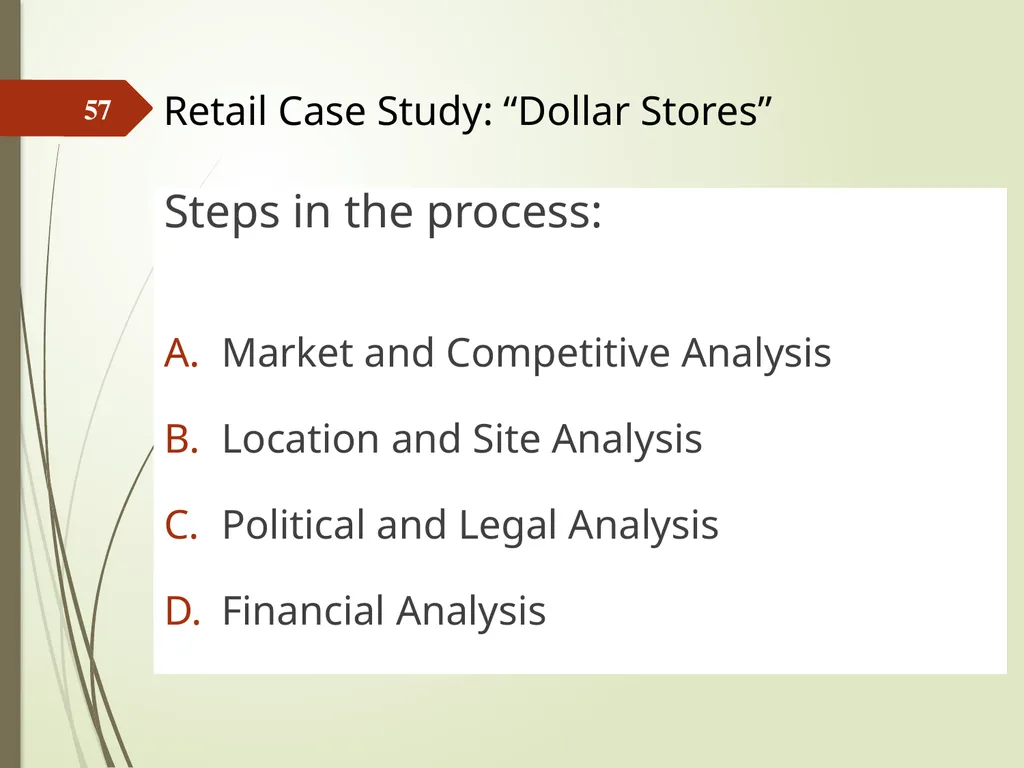
Steps in the process:
Market and Competitive Analysis
Location and Site Analysis
Political and Legal Analysis
Financial Analysis Retail Case Study: “Dollar Stores” 57<br>
Market and Competitive Analysis
Location and Site Analysis
Political and Legal Analysis
Financial Analysis Retail Case Study: “Dollar Stores” 57<br>
58
Market and Competitive Analysis
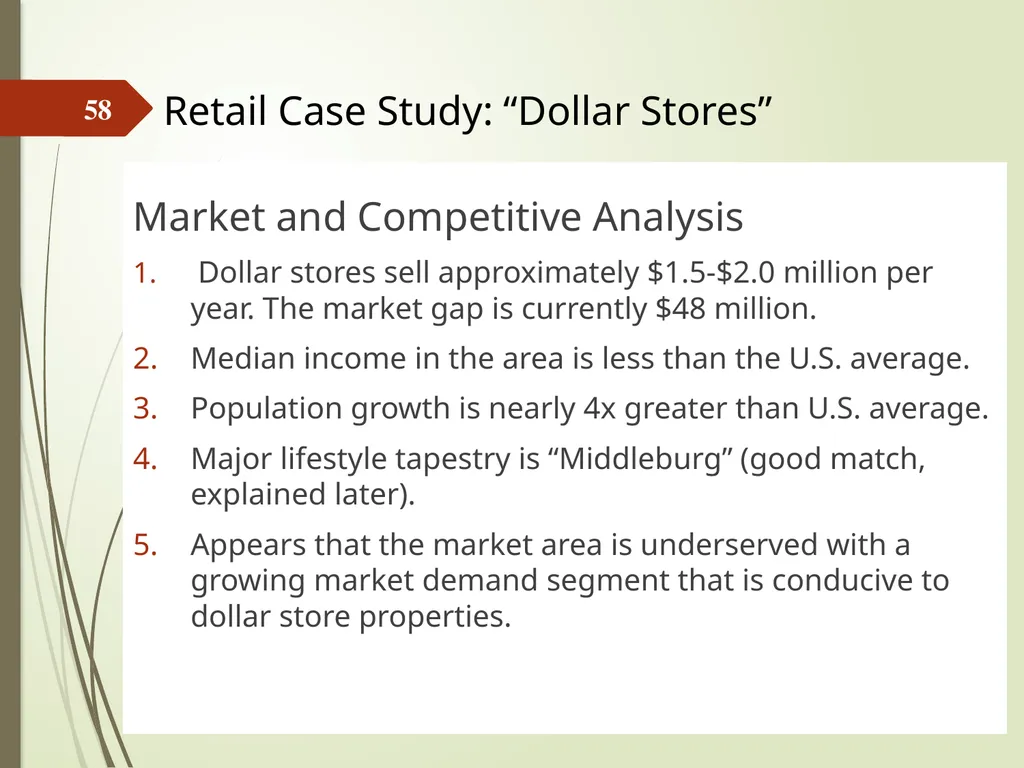
Dollar stores sell approximately $1.5-$2.0 million per year. The market gap is currently $48 million.
Median income in the area is less than the U.S. average.
Population growth is nearly 4x greater than U.S. average.
Major lifestyle tapestry is “Middleburg” (good match, explained later).
Appears that the market area is underserved with a growing market demand segment that is conducive to dollar store properties. Retail Case Study: “Dollar Stores” 58<br>
Dollar stores sell approximately $1.5-$2.0 million per year. The market gap is currently $48 million.
Median income in the area is less than the U.S. average.
Population growth is nearly 4x greater than U.S. average.
Major lifestyle tapestry is “Middleburg” (good match, explained later).
Appears that the market area is underserved with a growing market demand segment that is conducive to dollar store properties. Retail Case Study: “Dollar Stores” 58<br>
59
59<br>
60
Location and Site Analysis
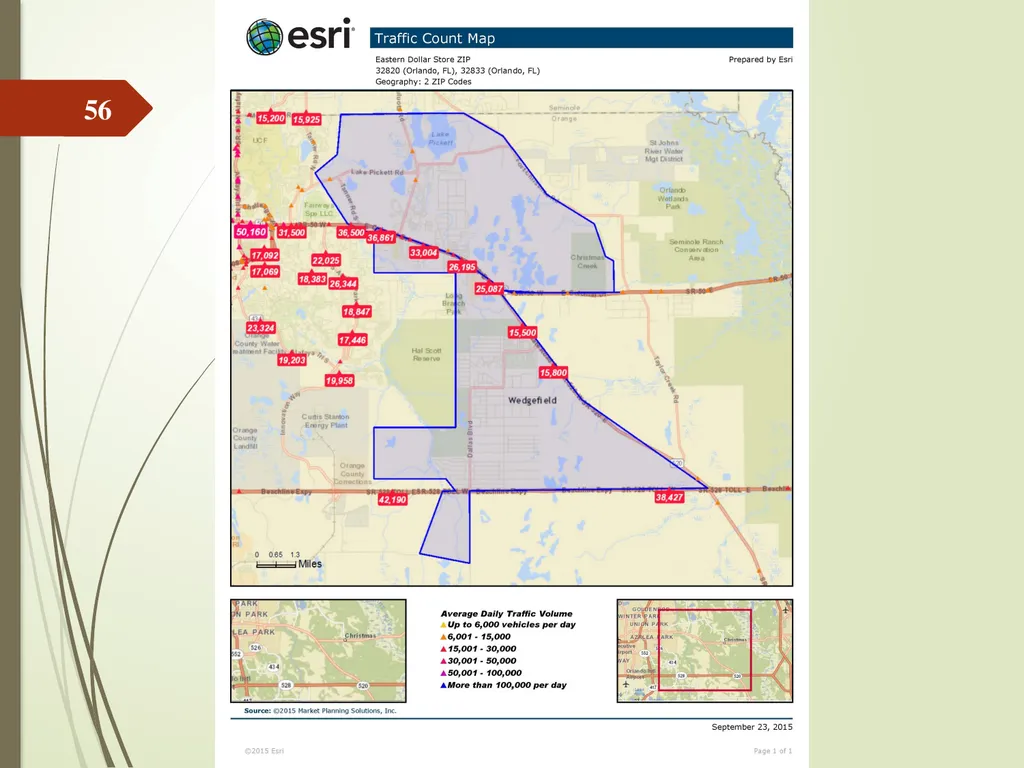
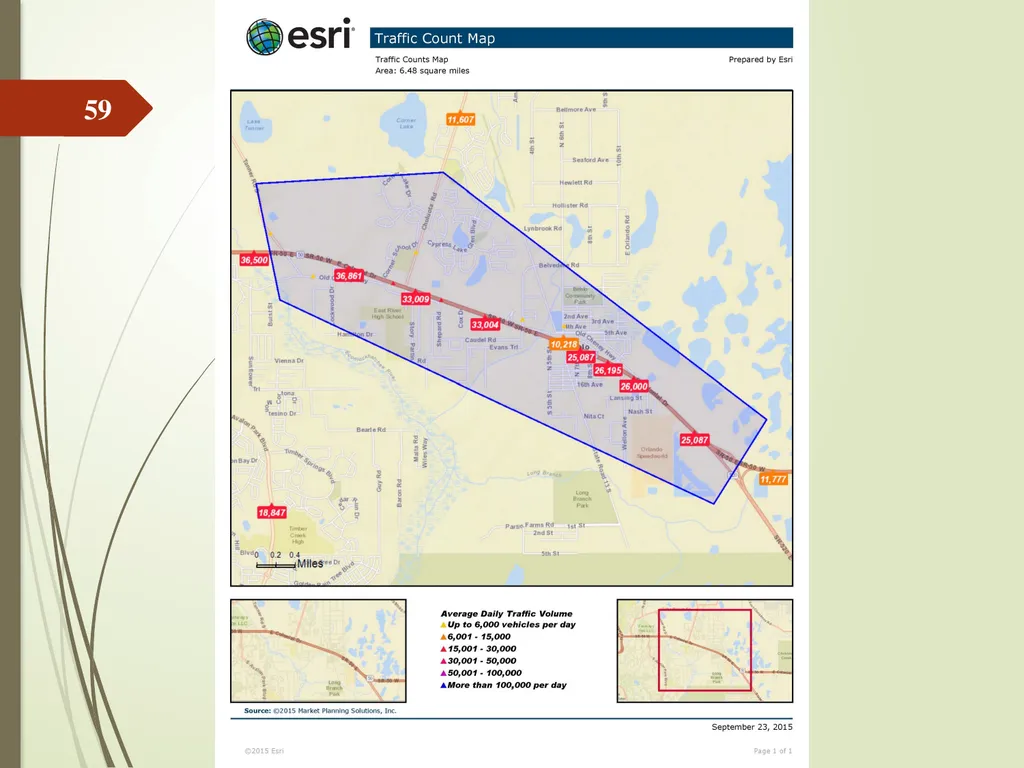
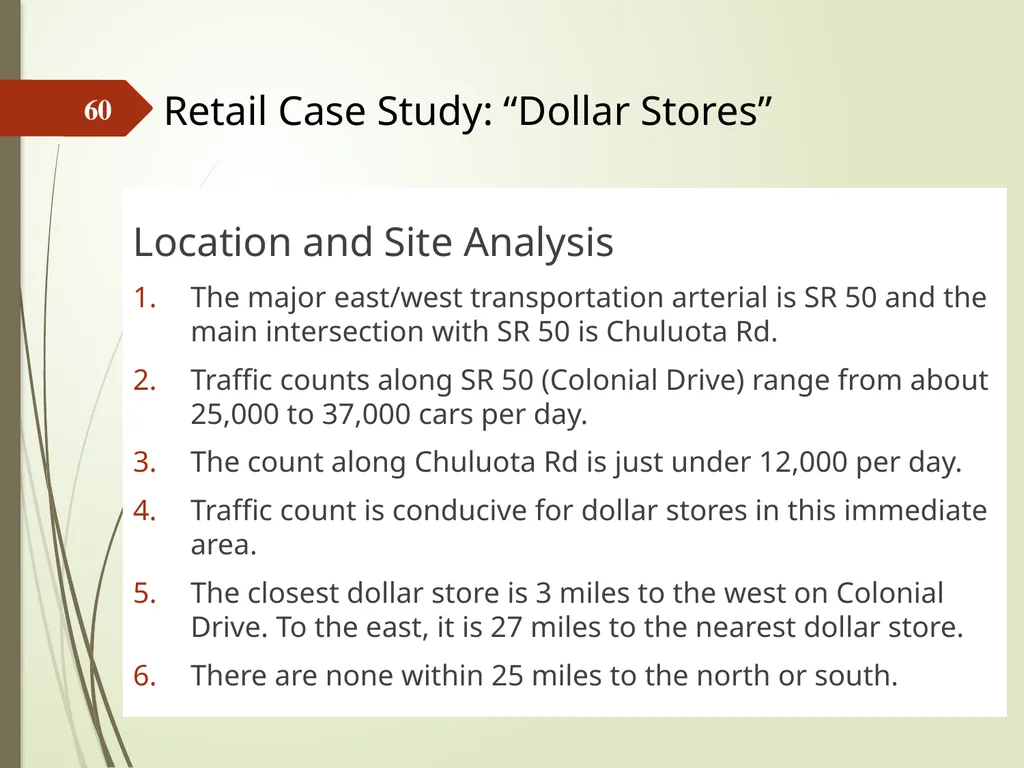
The major east/west transportation arterial is SR 50 and the main intersection with SR 50 is Chuluota Rd.
Traffic counts along SR 50 (Colonial Drive) range from about 25,000 to 37,000 cars per day.
The count along Chuluota Rd is just under 12,000 per day.
Traffic count is conducive for dollar stores in this immediate area.
The closest dollar store is 3 miles to the west on Colonial Drive. To the east, it is 27 miles to the nearest dollar store.
There are none within 25 miles to the north or south. Retail Case Study: “Dollar Stores” 60<br>
The major east/west transportation arterial is SR 50 and the main intersection with SR 50 is Chuluota Rd.
Traffic counts along SR 50 (Colonial Drive) range from about 25,000 to 37,000 cars per day.
The count along Chuluota Rd is just under 12,000 per day.
Traffic count is conducive for dollar stores in this immediate area.
The closest dollar store is 3 miles to the west on Colonial Drive. To the east, it is 27 miles to the nearest dollar store.
There are none within 25 miles to the north or south. Retail Case Study: “Dollar Stores” 60<br>
61
Location and Site Analysis
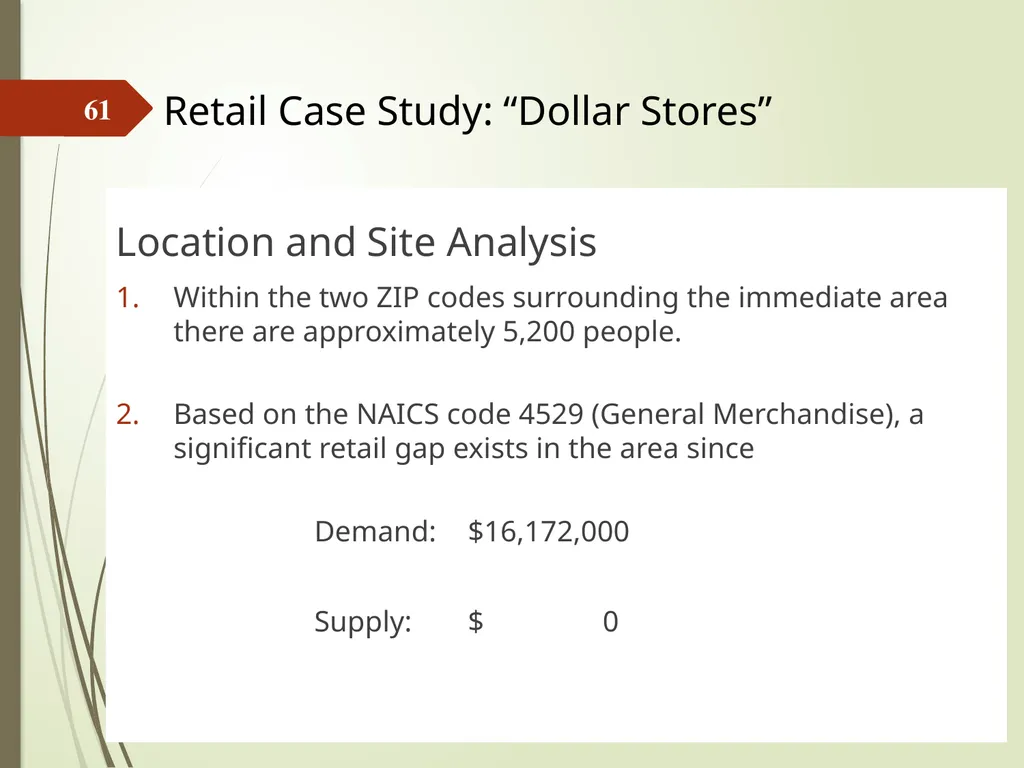
Within the two ZIP codes surrounding the immediate area there are approximately 5,200 people.
Based on the NAICS code 4529 (General Merchandise), a significant retail gap exists in the area since
Demand: $16,172,000
Supply: $ 0 Retail Case Study: “Dollar Stores” 61<br>
Within the two ZIP codes surrounding the immediate area there are approximately 5,200 people.
Based on the NAICS code 4529 (General Merchandise), a significant retail gap exists in the area since
Demand: $16,172,000
Supply: $ 0 Retail Case Study: “Dollar Stores” 61<br>
62
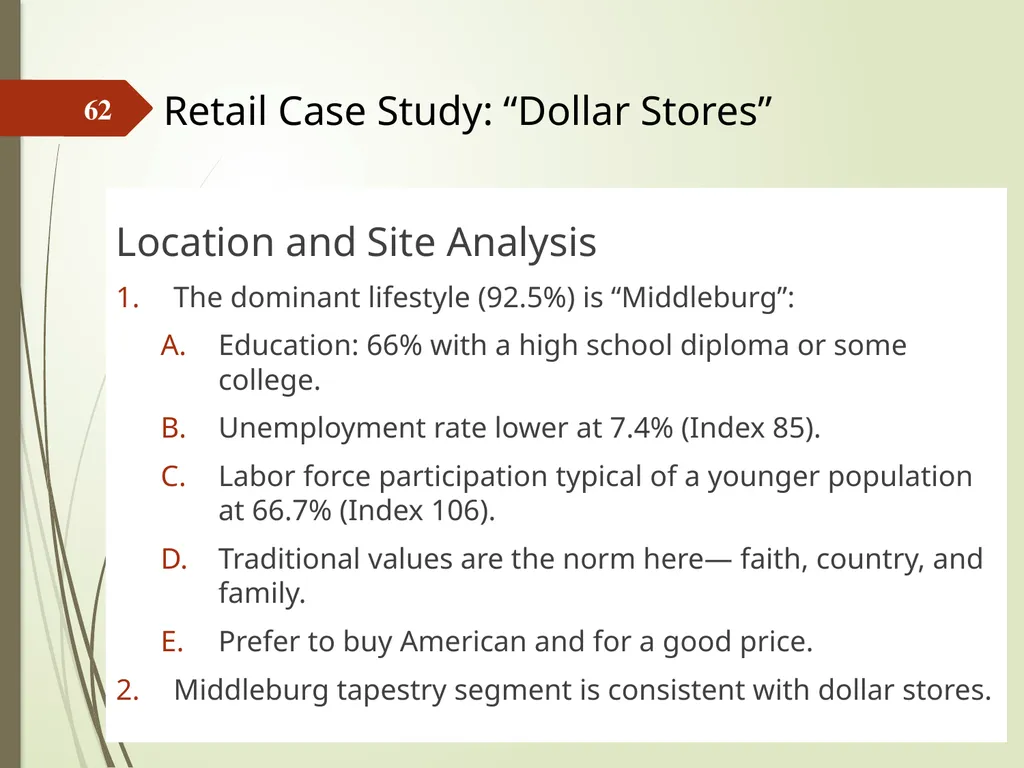
Location and Site Analysis
The dominant lifestyle (92.5%) is “Middleburg”:
Education: 66% with a high school diploma or some college.
Unemployment rate lower at 7.4% (Index 85).
Labor force participation typical of a younger population at 66.7% (Index 106).
Traditional values are the norm here— faith, country, and family.
Prefer to buy American and for a good price.
Middleburg tapestry segment is consistent with dollar stores. Retail Case Study: “Dollar Stores” 62<br>
The dominant lifestyle (92.5%) is “Middleburg”:
Education: 66% with a high school diploma or some college.
Unemployment rate lower at 7.4% (Index 85).
Labor force participation typical of a younger population at 66.7% (Index 106).
Traditional values are the norm here— faith, country, and family.
Prefer to buy American and for a good price.
Middleburg tapestry segment is consistent with dollar stores. Retail Case Study: “Dollar Stores” 62<br>
63
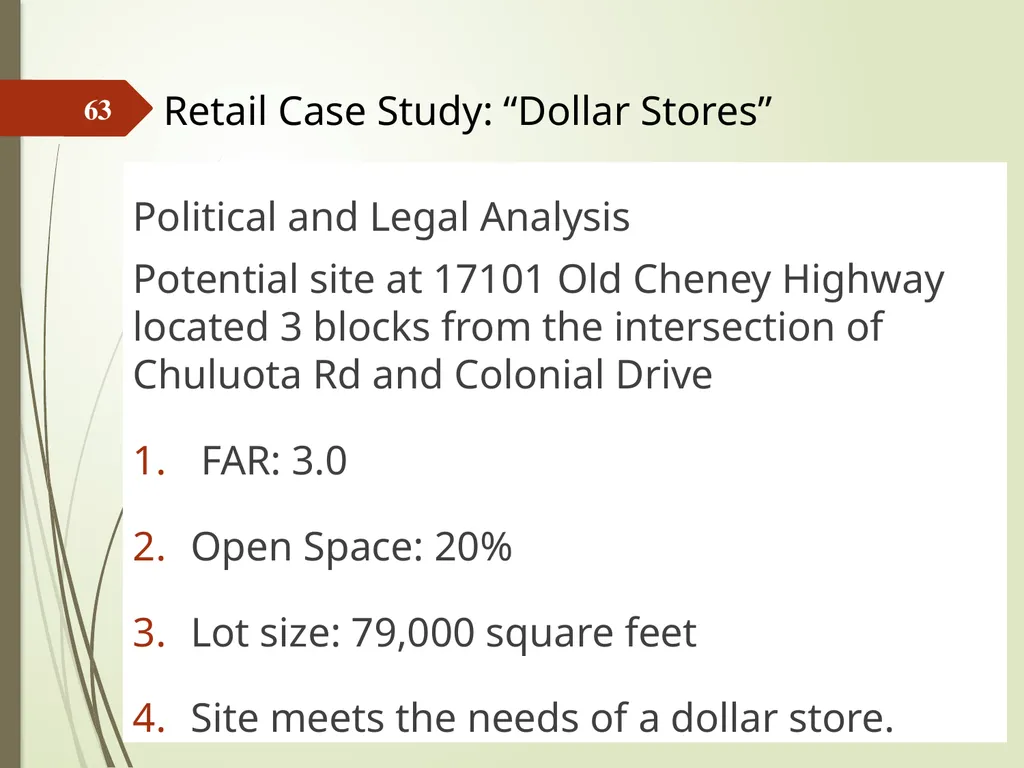
Political and Legal Analysis
Potential site at 17101 Old Cheney Highway located 3 blocks from the intersection of Chuluota Rd and Colonial Drive
FAR: 3.0
Open Space: 20%
Lot size: 79,000 square feet
Site meets the needs of a dollar store. Retail Case Study: “Dollar Stores” 63<br>
Potential site at 17101 Old Cheney Highway located 3 blocks from the intersection of Chuluota Rd and Colonial Drive
FAR: 3.0
Open Space: 20%
Lot size: 79,000 square feet
Site meets the needs of a dollar store. Retail Case Study: “Dollar Stores” 63<br>
64
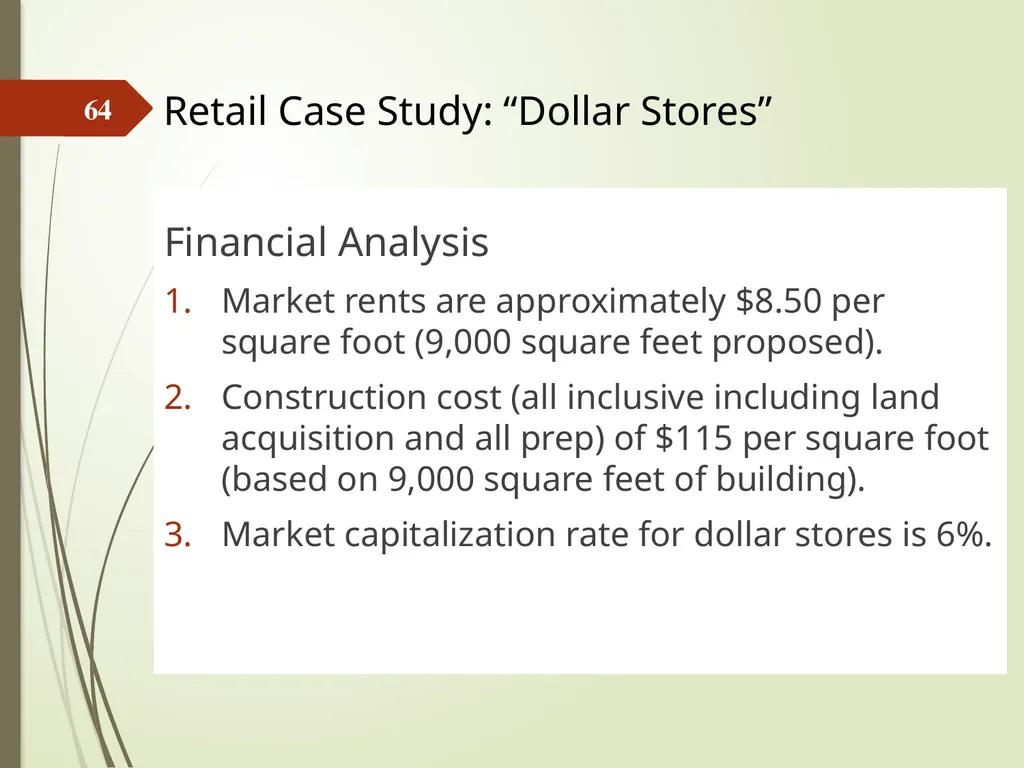
Financial Analysis
Market rents are approximately $8.50 per square foot (9,000 square feet proposed).
Construction cost (all inclusive including land acquisition and all prep) of $115 per square foot (based on 9,000 square feet of building).
Market capitalization rate for dollar stores is 6%. Retail Case Study: “Dollar Stores” 64<br>
Market rents are approximately $8.50 per square foot (9,000 square feet proposed).
Construction cost (all inclusive including land acquisition and all prep) of $115 per square foot (based on 9,000 square feet of building).
Market capitalization rate for dollar stores is 6%. Retail Case Study: “Dollar Stores” 64<br>
65
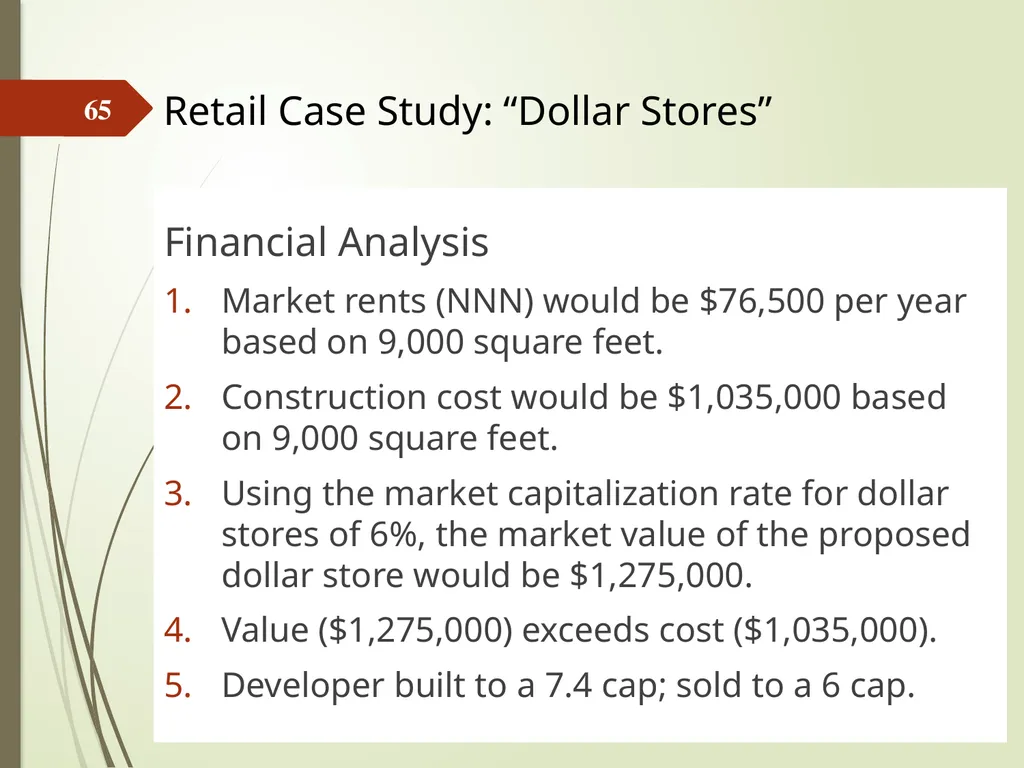
Financial Analysis
Market rents (NNN) would be $76,500 per year based on 9,000 square feet.
Construction cost would be $1,035,000 based on 9,000 square feet.
Using the market capitalization rate for dollar stores of 6%, the market value of the proposed dollar store would be $1,275,000.
Value ($1,275,000) exceeds cost ($1,035,000).
Developer built to a 7.4 cap; sold to a 6 cap. Retail Case Study: “Dollar Stores” 65<br>
Market rents (NNN) would be $76,500 per year based on 9,000 square feet.
Construction cost would be $1,035,000 based on 9,000 square feet.
Using the market capitalization rate for dollar stores of 6%, the market value of the proposed dollar store would be $1,275,000.
Value ($1,275,000) exceeds cost ($1,035,000).
Developer built to a 7.4 cap; sold to a 6 cap. Retail Case Study: “Dollar Stores” 65<br>