
Hopestone Kayiska Chavula Macroeconomic Analysis


Description: Hopestone Kayiska Chavula Macroeconomic Analysis Section Macroeconomics, Finance and Governance Division UN Economic Commission for Africa Addis Ababa, Ethiopia DEBT EVOLUTUION AND STRUCTURE Public debt levels have been increasing globally
Related Topics
Download Presentation
"Hopestone Kayiska Chavula Macroeconomic Analysis" is the property of its rightful owner. Permission is granted to download and print the materials on this website for personal, non-commercial use only, and to display it on your personal computer provided you do not modify the materials and that you retain all copyright notices contained in the materials. By downloading content from our website, you accept the terms of this agreement.
Presentation Transcript
slide1. Hopestone Kayiska Chavula
Macroeconomic Analysis Section
Macroeconomics, Finance and Governance Division
UN Economic Commission for Africa
Addis Ababa, Ethiopia<br>
slide2. DEBT EVOLUTUION AND STRUCTURE<br>
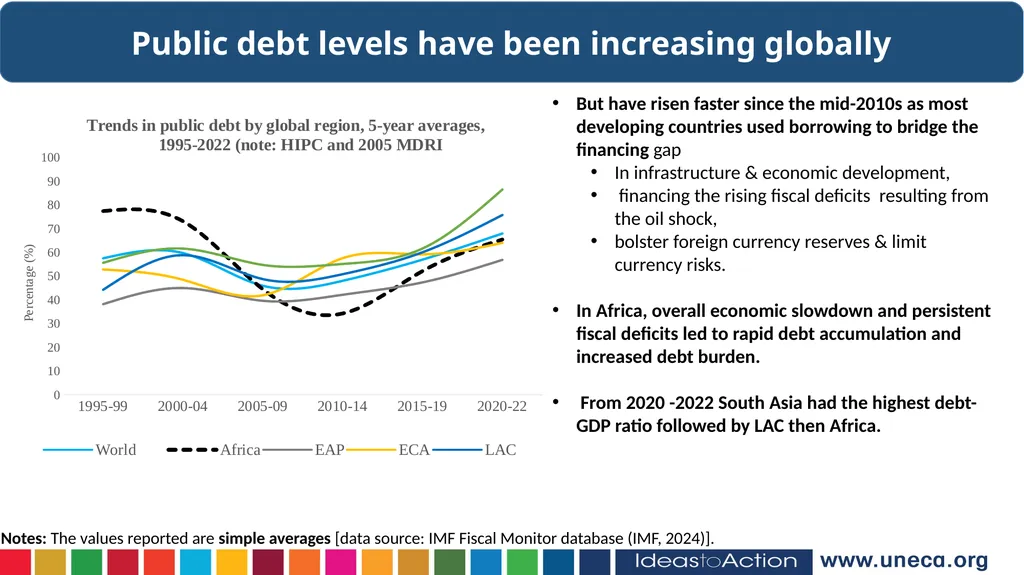
slide3. Public debt levels have been increasing globally Notes: The values reported are simple averages [data source: IMF Fiscal Monitor database (IMF, 2024)]. But have risen faster since the mid-2010s as most developing countries used borrowing to bridge the financing gap
In infrastructure & economic development,
financing the rising fiscal deficits resulting from the oil shock,
bolster foreign currency reserves & limit currency risks.
In Africa, overall economic slowdown and persistent fiscal deficits led to rapid debt accumulation and increased debt burden.
From 2020 -2022 South Asia had the highest debt-GDP ratio followed by LAC then Africa.<br>
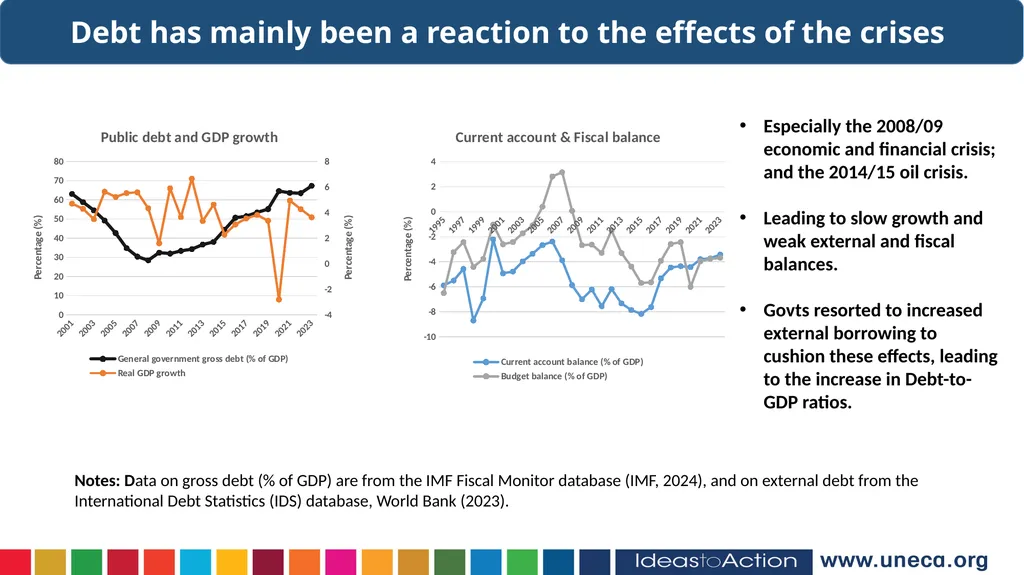
slide4. Debt has mainly been a reaction to the effects of the crises Notes: Data on gross debt (% of GDP) are from the IMF Fiscal Monitor database (IMF, 2024), and on external debt from the International Debt Statistics (IDS) database, World Bank (2023). Especially the 2008/09 economic and financial crisis; and the 2014/15 oil crisis.
Leading to slow growth and weak external and fiscal balances.
Govts resorted to increased external borrowing to cushion these effects, leading to the increase in Debt-to-GDP ratios.<br>
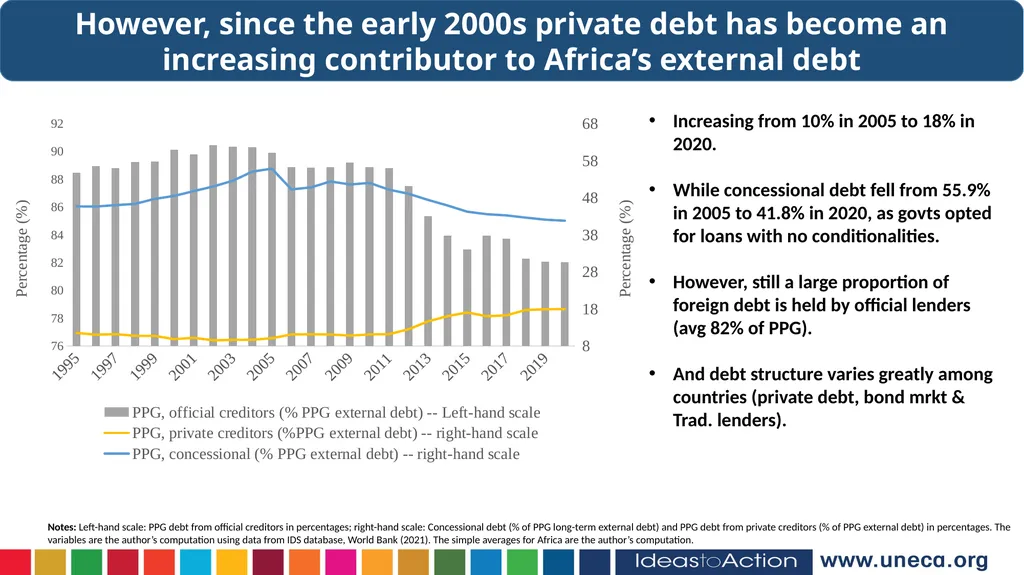
slide5. However, since the early 2000s private debt has become an increasing contributor to Africa’s external debt Notes: Left-hand scale: PPG debt from official creditors in percentages; right-hand scale: Concessional debt (% of PPG long-term external debt) and PPG debt from private creditors (% of PPG external debt) in percentages. The variables are the author’s computation using data from IDS database, World Bank (2021). The simple averages for Africa are the author’s computation. Increasing from 10% in 2005 to 18% in 2020.
While concessional debt fell from 55.9% in 2005 to 41.8% in 2020, as govts opted for loans with no conditionalities.
However, still a large proportion of foreign debt is held by official lenders (avg 82% of PPG).
And debt structure varies greatly among countries (private debt, bond mrkt & Trad. lenders).<br>
slide6. DEBT SUSTAINABILITY Debt is sustainable if current and future obligations are met without exceptional financial assistance or an interruption in development or going into default.
This is done by looking at a country’s solvency and liquidity aspects<br>
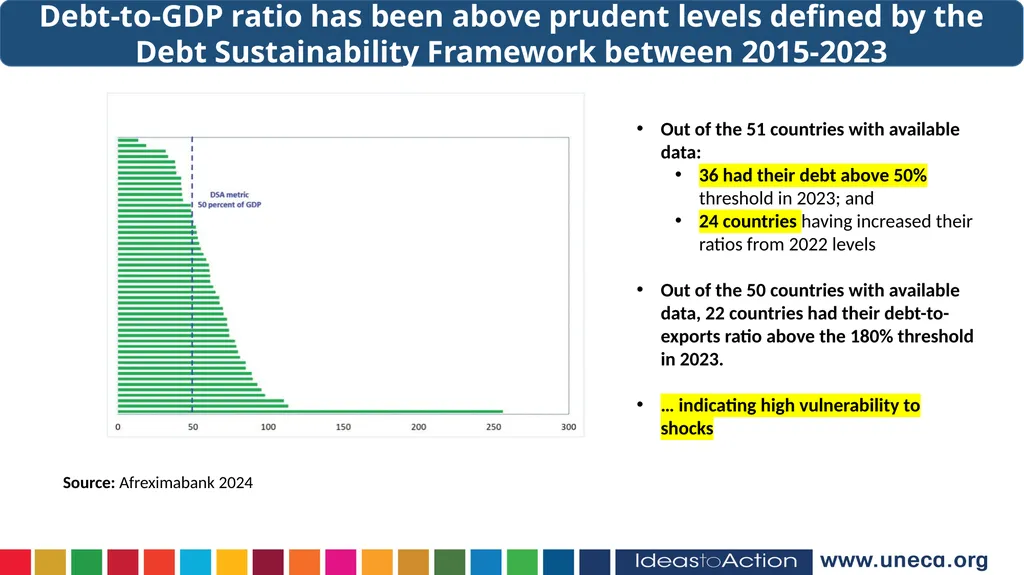
slide7. Debt-to-GDP ratio has been above prudent levels defined by the Debt Sustainability Framework between 2015-2023 Source: Afreximabank 2024 Out of the 51 countries with available data:
36 had their debt above 50% threshold in 2023; and
24 countries having increased their ratios from 2022 levels
Out of the 50 countries with available data, 22 countries had their debt-to-exports ratio above the 180% threshold in 2023.
… indicating high vulnerability to shocks<br>
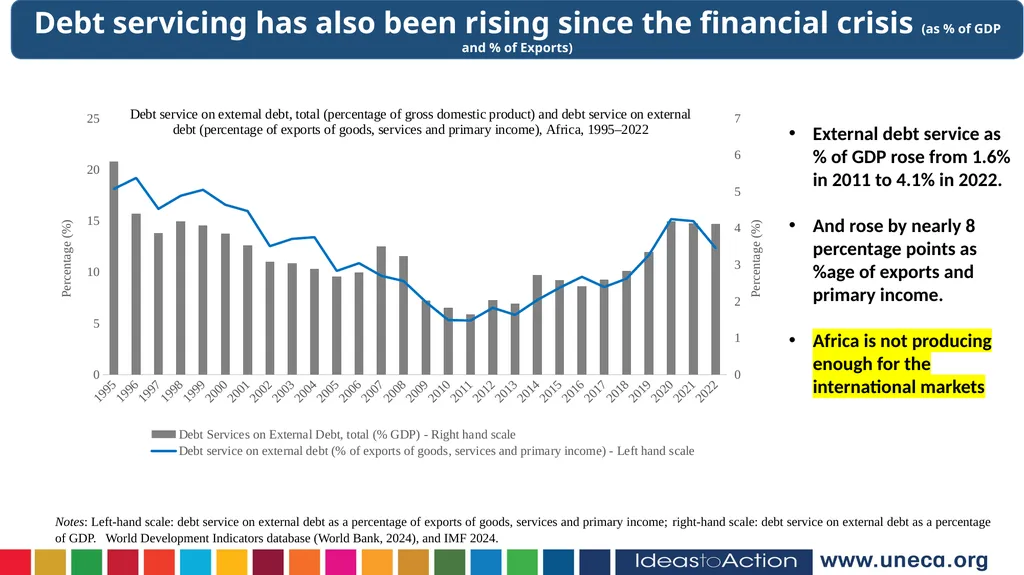
slide8. Debt servicing has also been rising since the financial crisis (as % of GDP and % of Exports) Notes: Left-hand scale: debt service on external debt as a percentage of exports of goods, services and primary income; right-hand scale: debt service on external debt as a percentage of GDP. World Development Indicators database (World Bank, 2024), and IMF 2024. External debt service as % of GDP rose from 1.6% in 2011 to 4.1% in 2022.
And rose by nearly 8 percentage points as %age of exports and primary income.
Africa is not producing enough for the international markets<br>
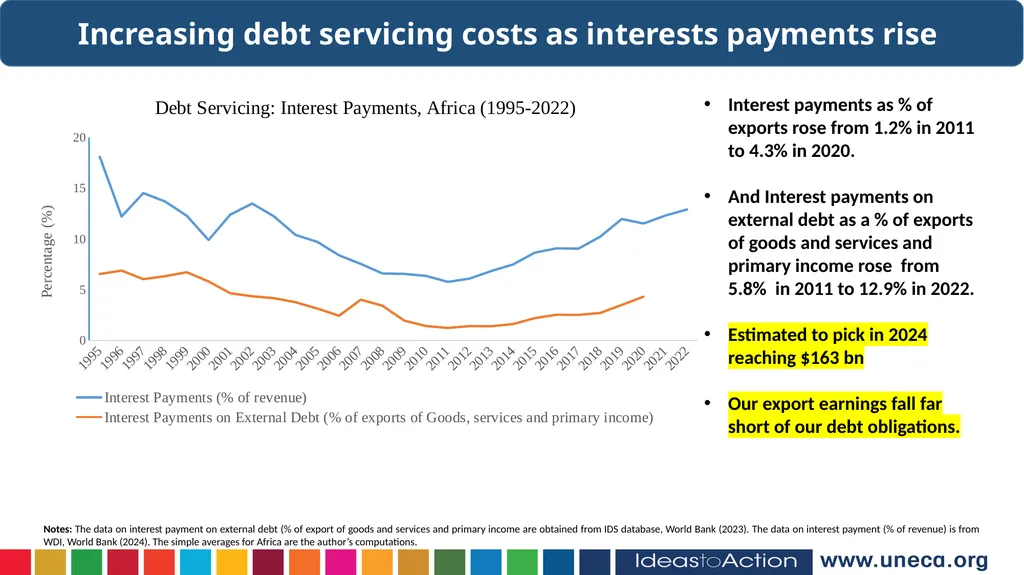
slide9. Increasing debt servicing costs as interests payments rise Notes: The data on interest payment on external debt (% of export of goods and services and primary income are obtained from IDS database, World Bank (2023). The data on interest payment (% of revenue) is from WDI, World Bank (2024). The simple averages for Africa are the author’s computations. Interest payments as % of exports rose from 1.2% in 2011 to 4.3% in 2020.
And Interest payments on external debt as a % of exports of goods and services and primary income rose from 5.8% in 2011 to 12.9% in 2022.
Estimated to pick in 2024 reaching $163 bn
Our export earnings fall far short of our debt obligations.<br>
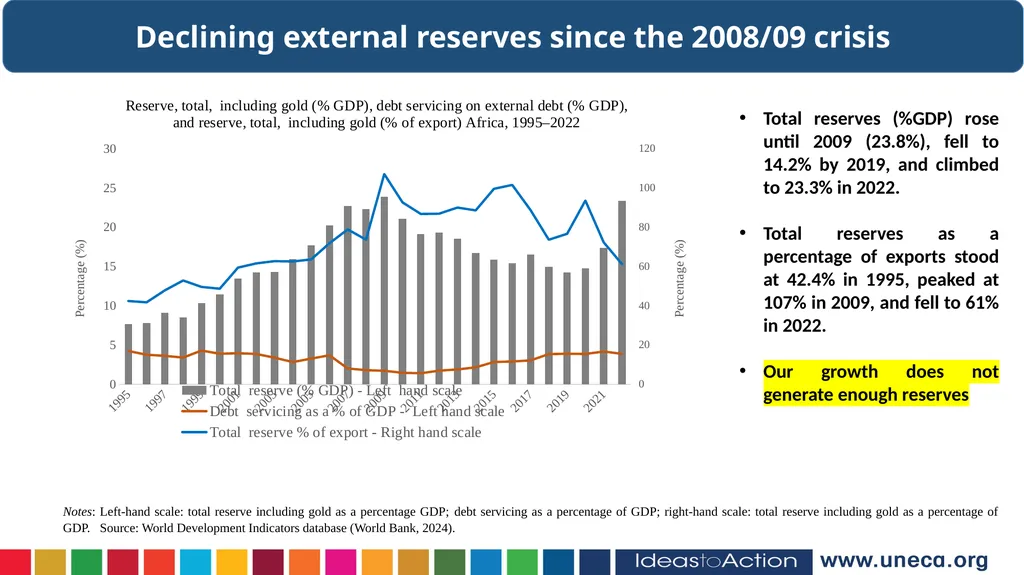
slide10. Declining external reserves since the 2008/09 crisis Notes: Left-hand scale: total reserve including gold as a percentage GDP; debt servicing as a percentage of GDP; right-hand scale: total reserve including gold as a percentage of GDP. Source: World Development Indicators database (World Bank, 2024). Total reserves (%GDP) rose until 2009 (23.8%), fell to 14.2% by 2019, and climbed to 23.3% in 2022.
Total reserves as a percentage of exports stood at 42.4% in 1995, peaked at 107% in 2009, and fell to 61% in 2022.
Our growth does not generate enough reserves<br>
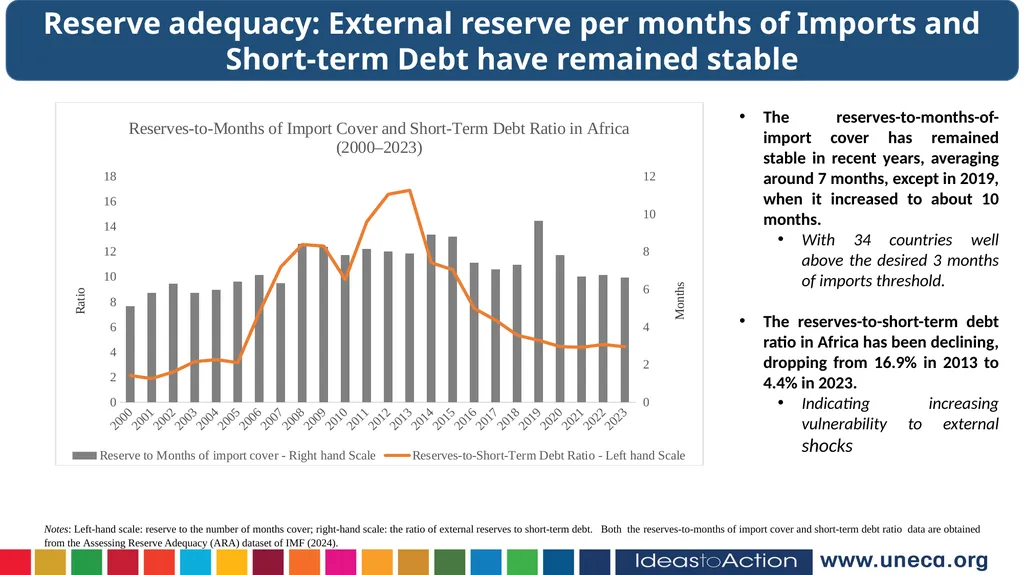
slide11. Reserve adequacy: External reserve per months of Imports and Short-term Debt have remained stable Notes: Left-hand scale: reserve to the number of months cover; right-hand scale: the ratio of external reserves to short-term debt. Both the reserves-to-months of import cover and short-term debt ratio data are obtained from the Assessing Reserve Adequacy (ARA) dataset of IMF (2024). The reserves-to-months-of-import cover has remained stable in recent years, averaging around 7 months, except in 2019, when it increased to about 10 months.
With 34 countries well above the desired 3 months of imports threshold.
The reserves-to-short-term debt ratio in Africa has been declining, dropping from 16.9% in 2013 to 4.4% in 2023.
Indicating increasing vulnerability to external shocks<br>
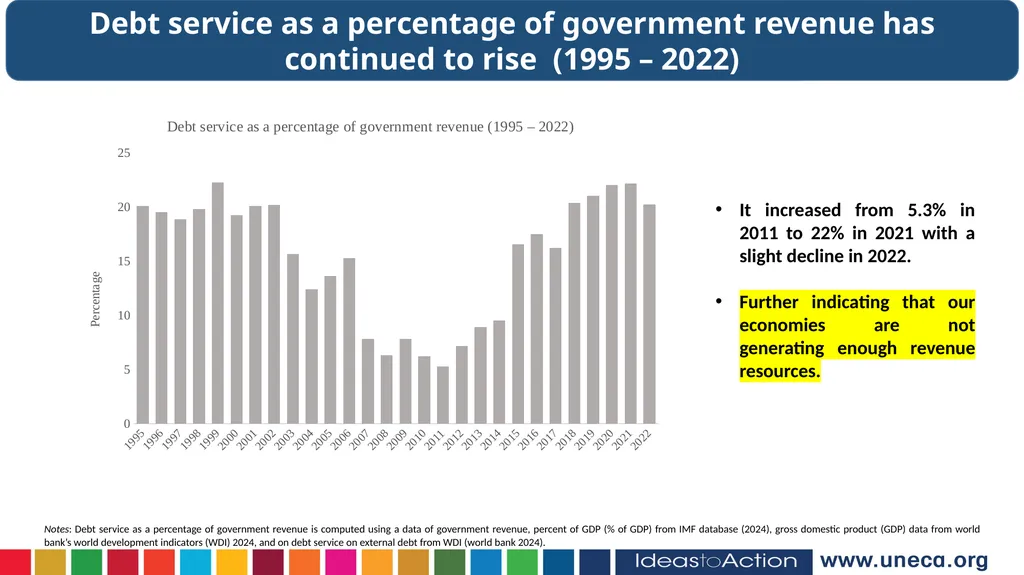
slide12. Debt service as a percentage of government revenue has continued to rise (1995 – 2022) Notes: Debt service as a percentage of government revenue is computed using a data of government revenue, percent of GDP (% of GDP) from IMF database (2024), gross domestic product (GDP) data from world bank’s world development indicators (WDI) 2024, and on debt service on external debt from WDI (world bank 2024). It increased from 5.3% in 2011 to 22% in 2021 with a slight decline in 2022.
Further indicating that our economies are not generating enough revenue resources.<br>
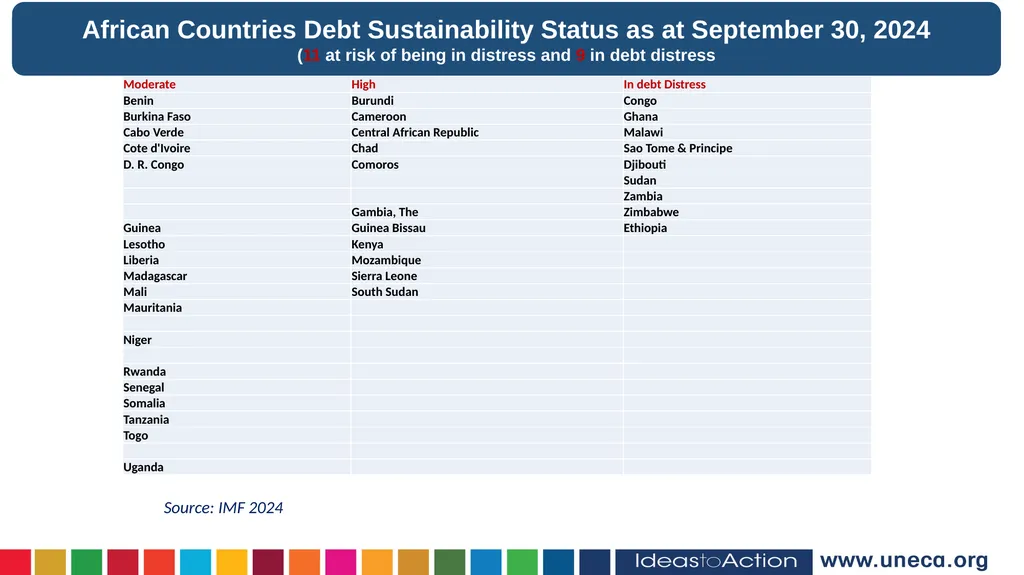
slide13. African Countries Debt Sustainability Status as at September 30, 2024
(11 at risk of being in distress and 9 in debt distress Source: IMF 2024<br>
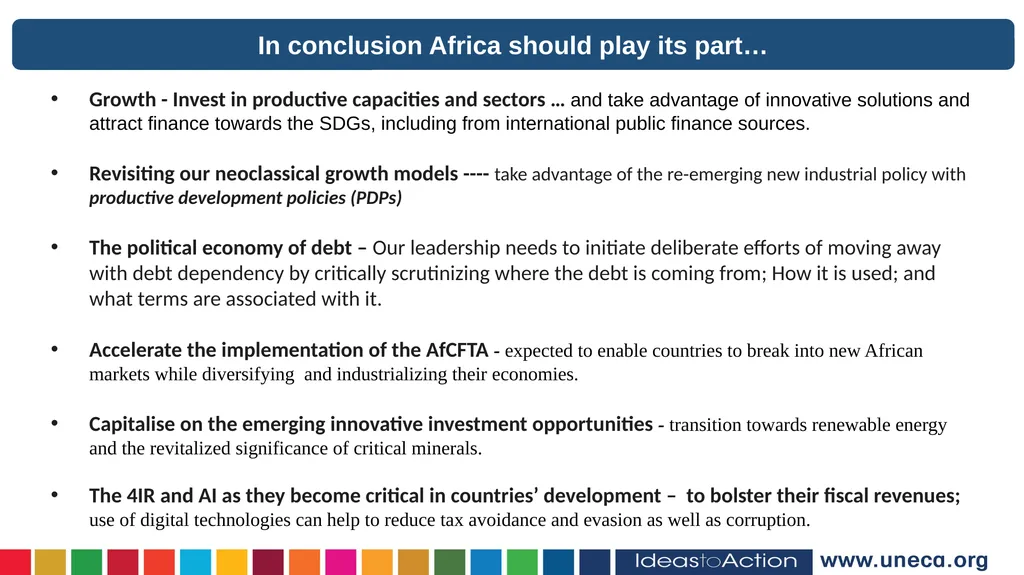
slide14. In conclusion Africa should play its part… Growth - Invest in productive capacities and sectors … and take advantage of innovative solutions and attract finance towards the SDGs, including from international public finance sources.
Revisiting our neoclassical growth models ---- take advantage of the re-emerging new industrial policy with productive development policies (PDPs)
The political economy of debt – Our leadership needs to initiate deliberate efforts of moving away with debt dependency by critically scrutinizing where the debt is coming from; How it is used; and what terms are associated with it.
Accelerate the implementation of the AfCFTA - expected to enable countries to break into new African markets while diversifying and industrializing their economies.
Capitalise on the emerging innovative investment opportunities - transition towards renewable energy and the revitalized significance of critical minerals.
The 4IR and AI as they become critical in countries’ development – to bolster their fiscal revenues; use of digital technologies can help to reduce tax avoidance and evasion as well as corruption.<br>
slide15. THANK YOU!<br>
Macroeconomic Analysis Section
Macroeconomics, Finance and Governance Division
UN Economic Commission for Africa
Addis Ababa, Ethiopia<br>
slide2. DEBT EVOLUTUION AND STRUCTURE<br>
slide3. Public debt levels have been increasing globally Notes: The values reported are simple averages [data source: IMF Fiscal Monitor database (IMF, 2024)]. But have risen faster since the mid-2010s as most developing countries used borrowing to bridge the financing gap
In infrastructure & economic development,
financing the rising fiscal deficits resulting from the oil shock,
bolster foreign currency reserves & limit currency risks.
In Africa, overall economic slowdown and persistent fiscal deficits led to rapid debt accumulation and increased debt burden.
From 2020 -2022 South Asia had the highest debt-GDP ratio followed by LAC then Africa.<br>
slide4. Debt has mainly been a reaction to the effects of the crises Notes: Data on gross debt (% of GDP) are from the IMF Fiscal Monitor database (IMF, 2024), and on external debt from the International Debt Statistics (IDS) database, World Bank (2023). Especially the 2008/09 economic and financial crisis; and the 2014/15 oil crisis.
Leading to slow growth and weak external and fiscal balances.
Govts resorted to increased external borrowing to cushion these effects, leading to the increase in Debt-to-GDP ratios.<br>
slide5. However, since the early 2000s private debt has become an increasing contributor to Africa’s external debt Notes: Left-hand scale: PPG debt from official creditors in percentages; right-hand scale: Concessional debt (% of PPG long-term external debt) and PPG debt from private creditors (% of PPG external debt) in percentages. The variables are the author’s computation using data from IDS database, World Bank (2021). The simple averages for Africa are the author’s computation. Increasing from 10% in 2005 to 18% in 2020.
While concessional debt fell from 55.9% in 2005 to 41.8% in 2020, as govts opted for loans with no conditionalities.
However, still a large proportion of foreign debt is held by official lenders (avg 82% of PPG).
And debt structure varies greatly among countries (private debt, bond mrkt & Trad. lenders).<br>
slide6. DEBT SUSTAINABILITY Debt is sustainable if current and future obligations are met without exceptional financial assistance or an interruption in development or going into default.
This is done by looking at a country’s solvency and liquidity aspects<br>
slide7. Debt-to-GDP ratio has been above prudent levels defined by the Debt Sustainability Framework between 2015-2023 Source: Afreximabank 2024 Out of the 51 countries with available data:
36 had their debt above 50% threshold in 2023; and
24 countries having increased their ratios from 2022 levels
Out of the 50 countries with available data, 22 countries had their debt-to-exports ratio above the 180% threshold in 2023.
… indicating high vulnerability to shocks<br>
slide8. Debt servicing has also been rising since the financial crisis (as % of GDP and % of Exports) Notes: Left-hand scale: debt service on external debt as a percentage of exports of goods, services and primary income; right-hand scale: debt service on external debt as a percentage of GDP. World Development Indicators database (World Bank, 2024), and IMF 2024. External debt service as % of GDP rose from 1.6% in 2011 to 4.1% in 2022.
And rose by nearly 8 percentage points as %age of exports and primary income.
Africa is not producing enough for the international markets<br>
slide9. Increasing debt servicing costs as interests payments rise Notes: The data on interest payment on external debt (% of export of goods and services and primary income are obtained from IDS database, World Bank (2023). The data on interest payment (% of revenue) is from WDI, World Bank (2024). The simple averages for Africa are the author’s computations. Interest payments as % of exports rose from 1.2% in 2011 to 4.3% in 2020.
And Interest payments on external debt as a % of exports of goods and services and primary income rose from 5.8% in 2011 to 12.9% in 2022.
Estimated to pick in 2024 reaching $163 bn
Our export earnings fall far short of our debt obligations.<br>
slide10. Declining external reserves since the 2008/09 crisis Notes: Left-hand scale: total reserve including gold as a percentage GDP; debt servicing as a percentage of GDP; right-hand scale: total reserve including gold as a percentage of GDP. Source: World Development Indicators database (World Bank, 2024). Total reserves (%GDP) rose until 2009 (23.8%), fell to 14.2% by 2019, and climbed to 23.3% in 2022.
Total reserves as a percentage of exports stood at 42.4% in 1995, peaked at 107% in 2009, and fell to 61% in 2022.
Our growth does not generate enough reserves<br>
slide11. Reserve adequacy: External reserve per months of Imports and Short-term Debt have remained stable Notes: Left-hand scale: reserve to the number of months cover; right-hand scale: the ratio of external reserves to short-term debt. Both the reserves-to-months of import cover and short-term debt ratio data are obtained from the Assessing Reserve Adequacy (ARA) dataset of IMF (2024). The reserves-to-months-of-import cover has remained stable in recent years, averaging around 7 months, except in 2019, when it increased to about 10 months.
With 34 countries well above the desired 3 months of imports threshold.
The reserves-to-short-term debt ratio in Africa has been declining, dropping from 16.9% in 2013 to 4.4% in 2023.
Indicating increasing vulnerability to external shocks<br>
slide12. Debt service as a percentage of government revenue has continued to rise (1995 – 2022) Notes: Debt service as a percentage of government revenue is computed using a data of government revenue, percent of GDP (% of GDP) from IMF database (2024), gross domestic product (GDP) data from world bank’s world development indicators (WDI) 2024, and on debt service on external debt from WDI (world bank 2024). It increased from 5.3% in 2011 to 22% in 2021 with a slight decline in 2022.
Further indicating that our economies are not generating enough revenue resources.<br>
slide13. African Countries Debt Sustainability Status as at September 30, 2024
(11 at risk of being in distress and 9 in debt distress Source: IMF 2024<br>
slide14. In conclusion Africa should play its part… Growth - Invest in productive capacities and sectors … and take advantage of innovative solutions and attract finance towards the SDGs, including from international public finance sources.
Revisiting our neoclassical growth models ---- take advantage of the re-emerging new industrial policy with productive development policies (PDPs)
The political economy of debt – Our leadership needs to initiate deliberate efforts of moving away with debt dependency by critically scrutinizing where the debt is coming from; How it is used; and what terms are associated with it.
Accelerate the implementation of the AfCFTA - expected to enable countries to break into new African markets while diversifying and industrializing their economies.
Capitalise on the emerging innovative investment opportunities - transition towards renewable energy and the revitalized significance of critical minerals.
The 4IR and AI as they become critical in countries’ development – to bolster their fiscal revenues; use of digital technologies can help to reduce tax avoidance and evasion as well as corruption.<br>
slide15. THANK YOU!<br>