
How to determine the correct sample size of a
TD
Published · 24 slides · 0 views

1 / 1


Description
How to determine the correct sample size of a research Dr Aseel Mugahed M.B.B.S, PGDPH, Msc Global health Training course in research methodology and research protocol development, Geneva 2022 Sample size calculation The sample size
Related Topics
Share
Embed code
Download this presentation From Below
"How to determine the correct sample size of a" is the property of its rightful owner. Permission is granted to download and print the materials on this website for personal, non-commercial use only, and to display it on your personal computer provided you do not modify the materials and that you retain all copyright notices contained in the materials. By downloading content from our website, you accept the terms of this agreement.
Presentation Transcript
01
How to determine the correct sample size of a research Dr Aseel Mugahed
M.B.B.S, PGDPH, Msc Global health Training course in research methodology and research protocol development, Geneva 2022<br>
M.B.B.S, PGDPH, Msc Global health Training course in research methodology and research protocol development, Geneva 2022<br>
02
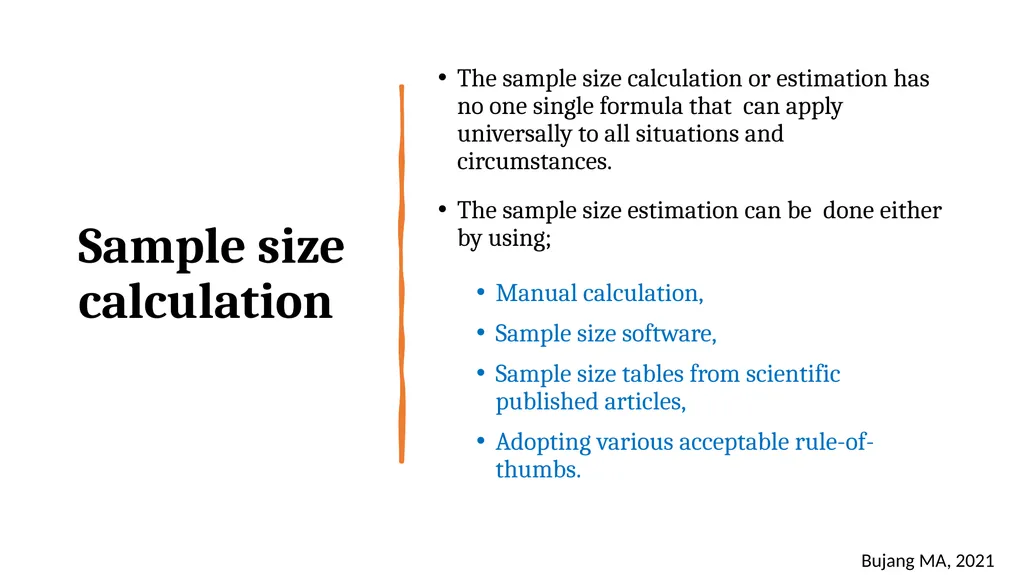
Sample size calculation The sample size calculation or estimation has no one single formula that can apply universally to all situations and circumstances.
The sample size estimation can be done either by using;
Manual calculation,
Sample size software,
Sample size tables from scientific published articles,
Adopting various acceptable rule-of-thumbs. Bujang MA, 2021<br>
The sample size estimation can be done either by using;
Manual calculation,
Sample size software,
Sample size tables from scientific published articles,
Adopting various acceptable rule-of-thumbs. Bujang MA, 2021<br>
03
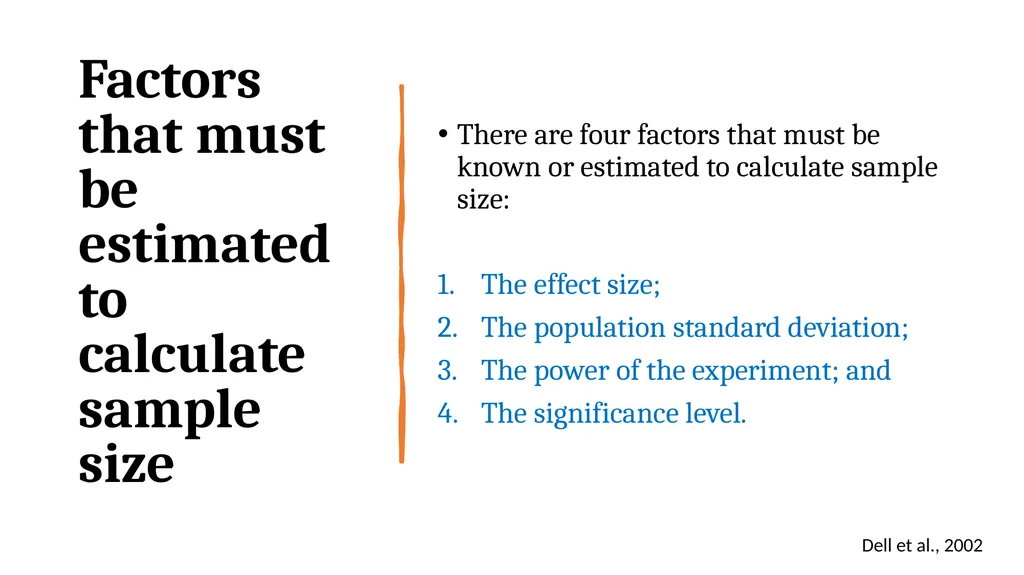
Factors that must be estimated to calculate sample size There are four factors that must be known or estimated to calculate sample size:
The effect size;
The population standard deviation;
The power of the experiment; and
The significance level. Dell et al., 2002<br>
The effect size;
The population standard deviation;
The power of the experiment; and
The significance level. Dell et al., 2002<br>
04
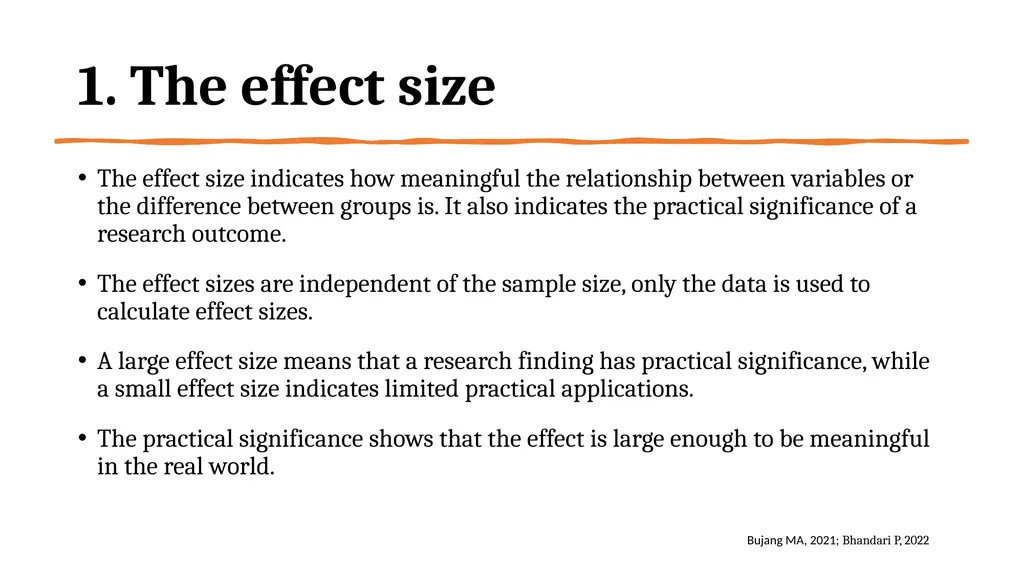
1. The effect size The effect size indicates how meaningful the relationship between variables or the difference between groups is. It also indicates the practical significance of a research outcome.
The effect sizes are independent of the sample size, only the data is used to calculate effect sizes.
A large effect size means that a research finding has practical significance, while a small effect size indicates limited practical applications.
The practical significance shows that the effect is large enough to be meaningful in the real world. Bujang MA, 2021; Bhandari P, 2022<br>
The effect sizes are independent of the sample size, only the data is used to calculate effect sizes.
A large effect size means that a research finding has practical significance, while a small effect size indicates limited practical applications.
The practical significance shows that the effect is large enough to be meaningful in the real world. Bujang MA, 2021; Bhandari P, 2022<br>
05
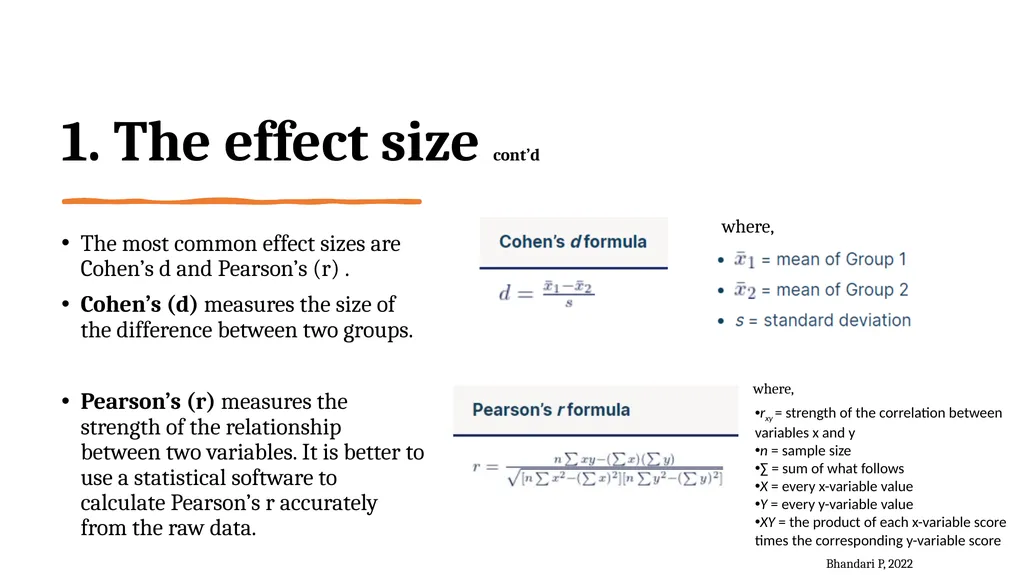
1. The effect size cont’d The most common effect sizes are Cohen’s d and Pearson’s (r) .
Cohen’s (d) measures the size of the difference between two groups.
Pearson’s (r) measures the strength of the relationship between two variables. It is better to use a statistical software to calculate Pearson’s r accurately from the raw data. Bhandari P, 2022 rxy = strength of the correlation between variables x and y
n = sample size
∑ = sum of what follows
X = every x-variable value
Y = every y-variable value
XY = the product of each x-variable score times the corresponding y-variable score where, where,<br>
Cohen’s (d) measures the size of the difference between two groups.
Pearson’s (r) measures the strength of the relationship between two variables. It is better to use a statistical software to calculate Pearson’s r accurately from the raw data. Bhandari P, 2022 rxy = strength of the correlation between variables x and y
n = sample size
∑ = sum of what follows
X = every x-variable value
Y = every y-variable value
XY = the product of each x-variable score times the corresponding y-variable score where, where,<br>
06
Estimation of the effect size It is usually quite challenging to estimate an accurate effect size since the exact value of the effect size is not known until the study is completed. However, the researcher will still have to set the value of effect size for the purpose of sample size calculation or estimation. Bujang MA, 2021<br>
07
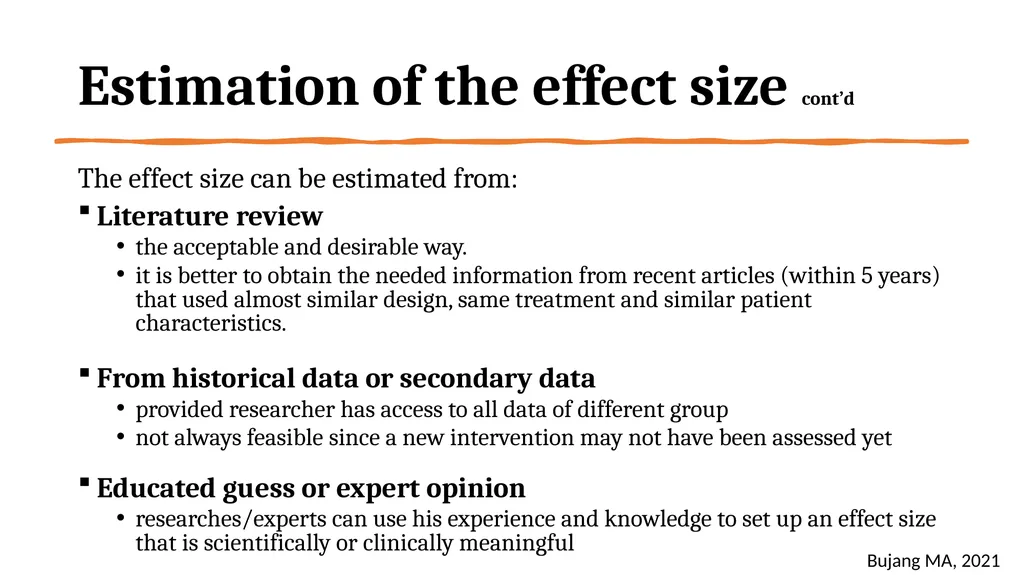
Estimation of the effect size cont’d The effect size can be estimated from:
Literature review
the acceptable and desirable way.
it is better to obtain the needed information from recent articles (within 5 years) that used almost similar design, same treatment and similar patient characteristics.
From historical data or secondary data
provided researcher has access to all data of different group
not always feasible since a new intervention may not have been assessed yet
Educated guess or expert opinion
researches/experts can use his experience and knowledge to set up an effect size that is scientifically or clinically meaningful Bujang MA, 2021<br>
Literature review
the acceptable and desirable way.
it is better to obtain the needed information from recent articles (within 5 years) that used almost similar design, same treatment and similar patient characteristics.
From historical data or secondary data
provided researcher has access to all data of different group
not always feasible since a new intervention may not have been assessed yet
Educated guess or expert opinion
researches/experts can use his experience and knowledge to set up an effect size that is scientifically or clinically meaningful Bujang MA, 2021<br>
08
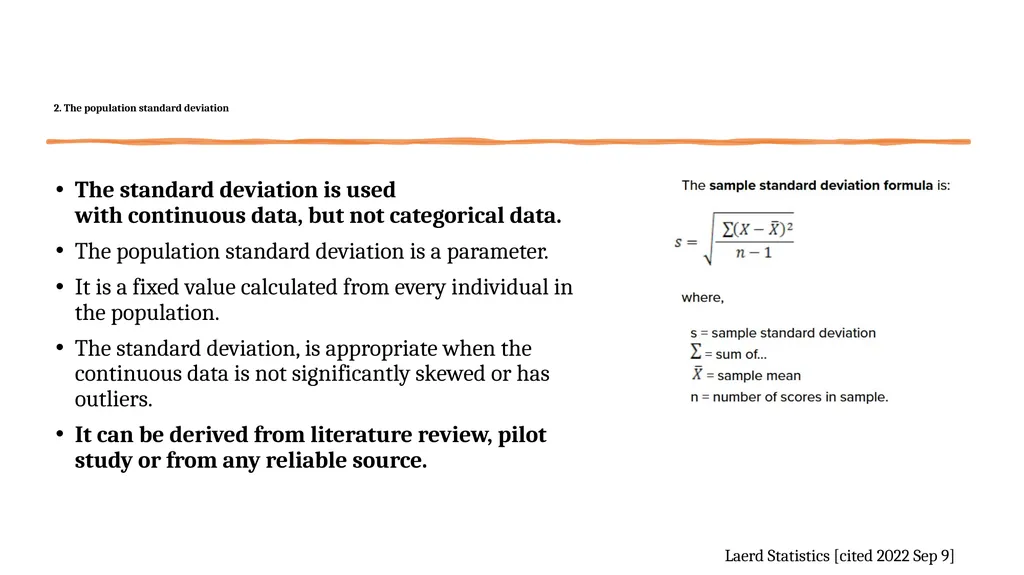
2. The population standard deviation The standard deviation is used with continuous data, but not categorical data.
The population standard deviation is a parameter.
It is a fixed value calculated from every individual in the population.
The standard deviation, is appropriate when the continuous data is not significantly skewed or has outliers.
It can be derived from literature review, pilot study or from any reliable source. Laerd Statistics [cited 2022 Sep 9]<br>
The population standard deviation is a parameter.
It is a fixed value calculated from every individual in the population.
The standard deviation, is appropriate when the continuous data is not significantly skewed or has outliers.
It can be derived from literature review, pilot study or from any reliable source. Laerd Statistics [cited 2022 Sep 9]<br>
09
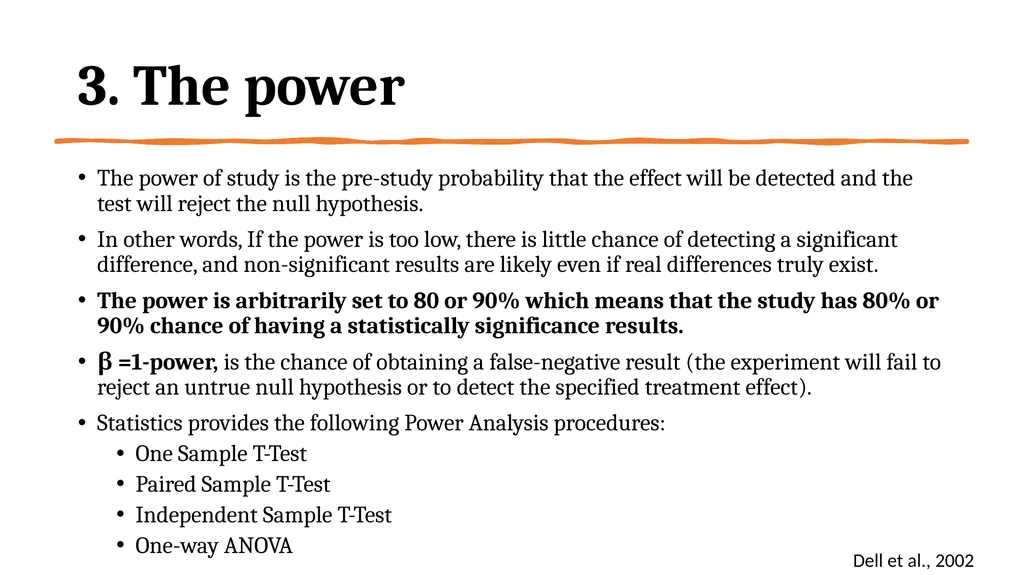
3. The power The power of study is the pre-study probability that the effect will be detected and the test will reject the null hypothesis.
In other words, If the power is too low, there is little chance of detecting a significant difference, and non-significant results are likely even if real differences truly exist.
The power is arbitrarily set to 80 or 90% which means that the study has 80% or 90% chance of having a statistically significance results.
β =1-power, is the chance of obtaining a false-negative result (the experiment will fail to reject an untrue null hypothesis or to detect the specified treatment effect).
Statistics provides the following Power Analysis procedures:
One Sample T-Test
Paired Sample T-Test
Independent Sample T-Test
One-way ANOVA Dell et al., 2002<br>
In other words, If the power is too low, there is little chance of detecting a significant difference, and non-significant results are likely even if real differences truly exist.
The power is arbitrarily set to 80 or 90% which means that the study has 80% or 90% chance of having a statistically significance results.
β =1-power, is the chance of obtaining a false-negative result (the experiment will fail to reject an untrue null hypothesis or to detect the specified treatment effect).
Statistics provides the following Power Analysis procedures:
One Sample T-Test
Paired Sample T-Test
Independent Sample T-Test
One-way ANOVA Dell et al., 2002<br>
10
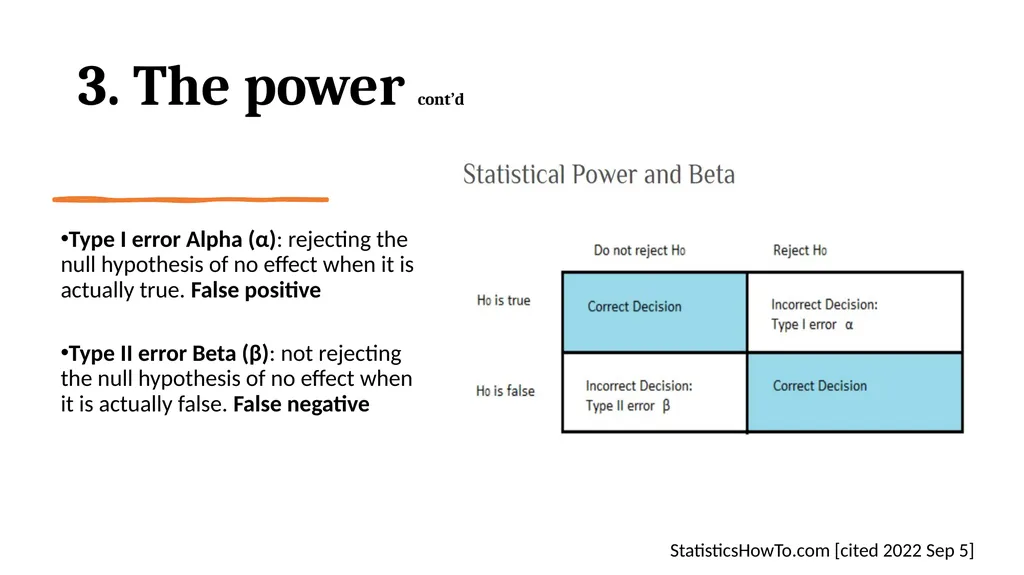
Type I error Alpha (α): rejecting the null hypothesis of no effect when it is actually true. False positive
Type II error Beta (β): not rejecting the null hypothesis of no effect when it is actually false. False negative 3. The power cont’d StatisticsHowTo.com [cited 2022 Sep 5]<br>
Type II error Beta (β): not rejecting the null hypothesis of no effect when it is actually false. False negative 3. The power cont’d StatisticsHowTo.com [cited 2022 Sep 5]<br>
11
4. The significance level The significance level, also known as alpha (α) is the probability that a positive finding is due to chance alone. It is a measure of the strength of the evidence that must be present in the sample before rejecting the null hypothesis and concluding that the effect is statistically significant.
The researcher determines the significance level before conducting the experiment and is usually chosen to be 0.05 or 0.01.
That is, the investigator wishes the chance of mistakenly designating a difference “significant” (when in fact there is no difference) to be no more than 5 or 1%.
Significance level is correlated with power: increasing the significance level (from 5% to 10%) increases power. Dell et al., 2002<br>
The researcher determines the significance level before conducting the experiment and is usually chosen to be 0.05 or 0.01.
That is, the investigator wishes the chance of mistakenly designating a difference “significant” (when in fact there is no difference) to be no more than 5 or 1%.
Significance level is correlated with power: increasing the significance level (from 5% to 10%) increases power. Dell et al., 2002<br>
12
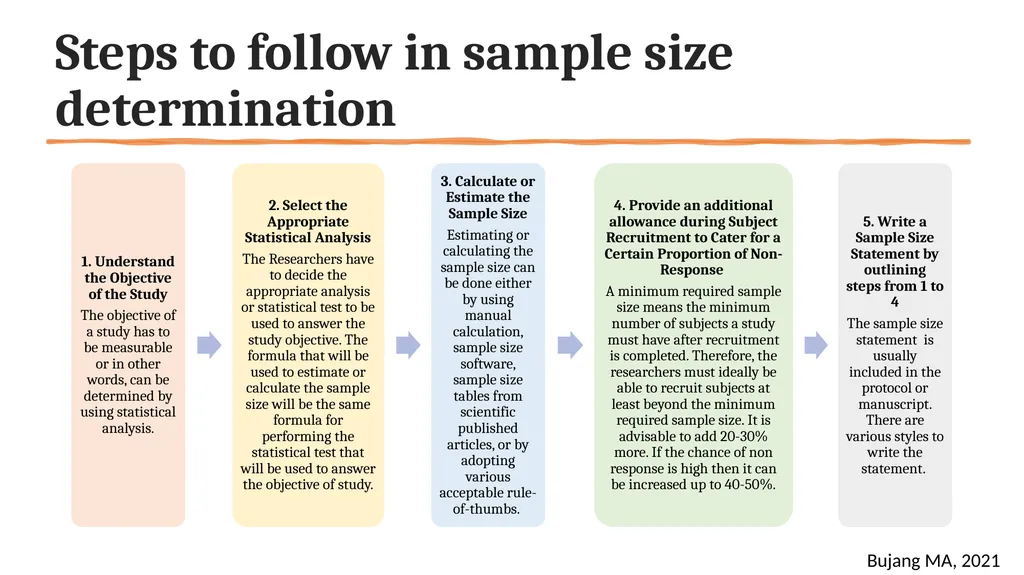
Steps to follow in sample size determination Bujang MA, 2021<br>
13
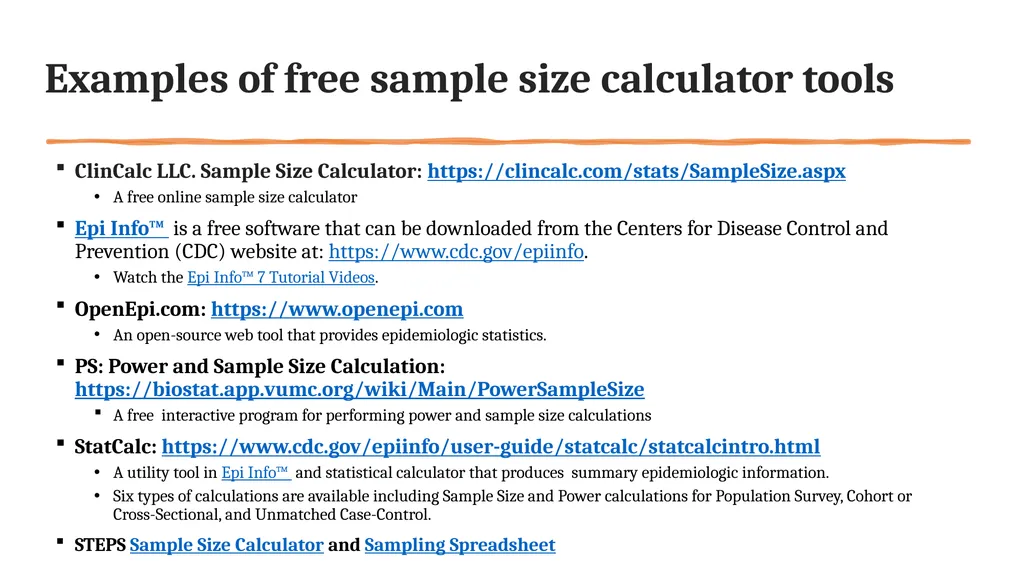
Examples of free sample size calculator tools ClinCalc LLC. Sample Size Calculator: https://clincalc.com/stats/SampleSize.aspx
A free online sample size calculator
Epi Info™ is a free software that can be downloaded from the Centers for Disease Control and Prevention (CDC) website at: https://www.cdc.gov/epiinfo.
Watch the Epi Info™ 7 Tutorial Videos.
OpenEpi.com: https://www.openepi.com
An open-source web tool that provides epidemiologic statistics.
PS: Power and Sample Size Calculation: https://biostat.app.vumc.org/wiki/Main/PowerSampleSize
A free interactive program for performing power and sample size calculations
StatCalc: https://www.cdc.gov/epiinfo/user-guide/statcalc/statcalcintro.html
A utility tool in Epi Info™ and statistical calculator that produces summary epidemiologic information.
Six types of calculations are available including Sample Size and Power calculations for Population Survey, Cohort or Cross-Sectional, and Unmatched Case-Control.
STEPS Sample Size Calculator and Sampling Spreadsheet<br>
A free online sample size calculator
Epi Info™ is a free software that can be downloaded from the Centers for Disease Control and Prevention (CDC) website at: https://www.cdc.gov/epiinfo.
Watch the Epi Info™ 7 Tutorial Videos.
OpenEpi.com: https://www.openepi.com
An open-source web tool that provides epidemiologic statistics.
PS: Power and Sample Size Calculation: https://biostat.app.vumc.org/wiki/Main/PowerSampleSize
A free interactive program for performing power and sample size calculations
StatCalc: https://www.cdc.gov/epiinfo/user-guide/statcalc/statcalcintro.html
A utility tool in Epi Info™ and statistical calculator that produces summary epidemiologic information.
Six types of calculations are available including Sample Size and Power calculations for Population Survey, Cohort or Cross-Sectional, and Unmatched Case-Control.
STEPS Sample Size Calculator and Sampling Spreadsheet<br>
14
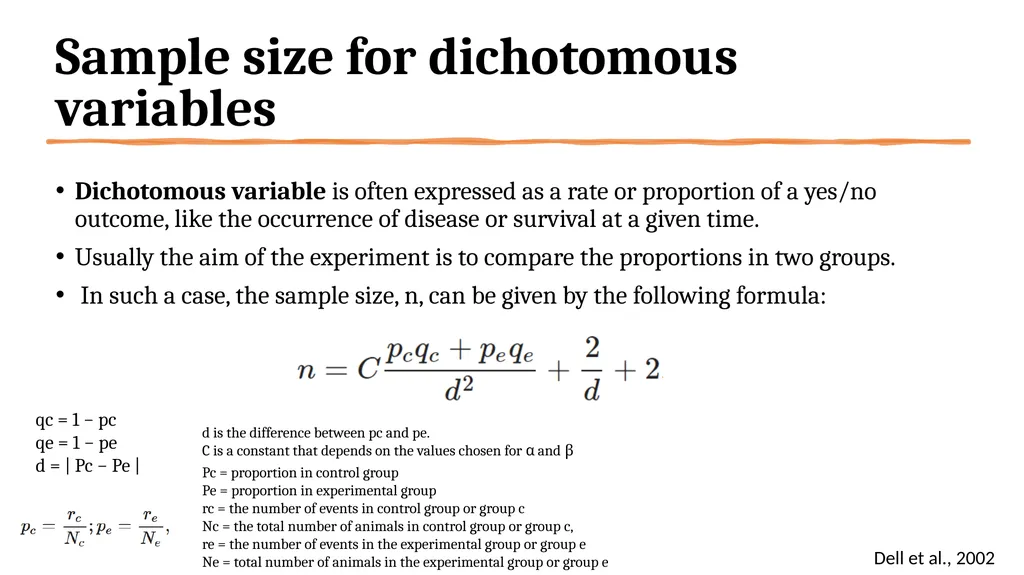
Sample size for dichotomous variables Dichotomous variable is often expressed as a rate or proportion of a yes/no outcome, like the occurrence of disease or survival at a given time.
Usually the aim of the experiment is to compare the proportions in two groups.
In such a case, the sample size, n, can be given by the following formula: qc = 1 − pc
qe = 1 − pe
d = | Pc − Pe | d is the difference between pc and pe.
C is a constant that depends on the values chosen for α and β Dell et al., 2002 Pc = proportion in control group
Pe = proportion in experimental group
rc = the number of events in control group or group c Nc = the total number of animals in control group or group c,
re = the number of events in the experimental group or group e
Ne = total number of animals in the experimental group or group e<br>
Usually the aim of the experiment is to compare the proportions in two groups.
In such a case, the sample size, n, can be given by the following formula: qc = 1 − pc
qe = 1 − pe
d = | Pc − Pe | d is the difference between pc and pe.
C is a constant that depends on the values chosen for α and β Dell et al., 2002 Pc = proportion in control group
Pe = proportion in experimental group
rc = the number of events in control group or group c Nc = the total number of animals in control group or group c,
re = the number of events in the experimental group or group e
Ne = total number of animals in the experimental group or group e<br>
15
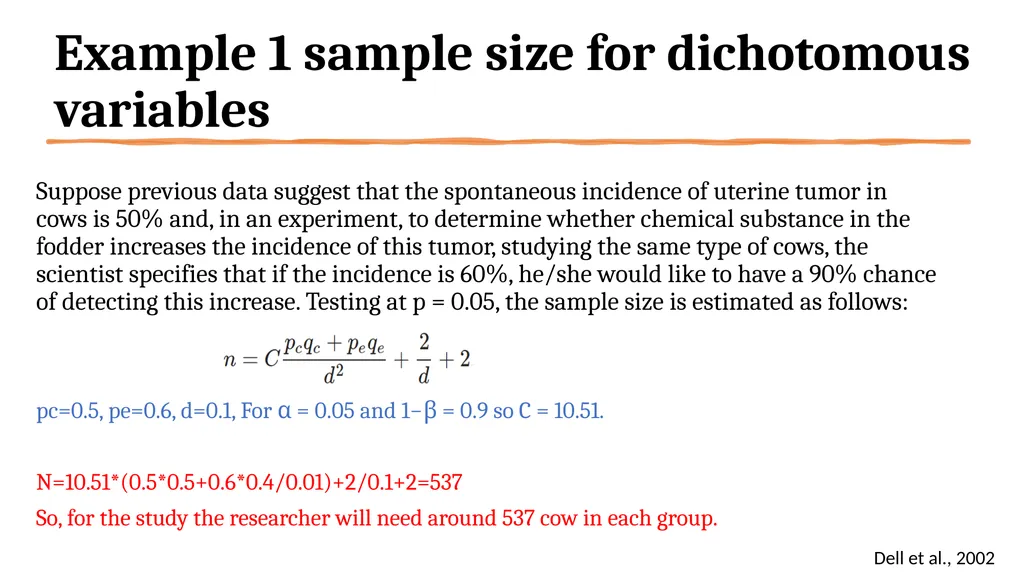
Dell et al., 2002 Example 1 sample size for dichotomous variables Suppose previous data suggest that the spontaneous incidence of uterine tumor in cows is 50% and, in an experiment, to determine whether chemical substance in the fodder increases the incidence of this tumor, studying the same type of cows, the scientist specifies that if the incidence is 60%, he/she would like to have a 90% chance of detecting this increase. Testing at p = 0.05, the sample size is estimated as follows:
pc=0.5, pe=0.6, d=0.1, For α = 0.05 and 1−β = 0.9 so C = 10.51.
N=10.51*(0.5*0.5+0.6*0.4/0.01)+2/0.1+2=537
So, for the study the researcher will need around 537 cow in each group.<br>
pc=0.5, pe=0.6, d=0.1, For α = 0.05 and 1−β = 0.9 so C = 10.51.
N=10.51*(0.5*0.5+0.6*0.4/0.01)+2/0.1+2=537
So, for the study the researcher will need around 537 cow in each group.<br>
16
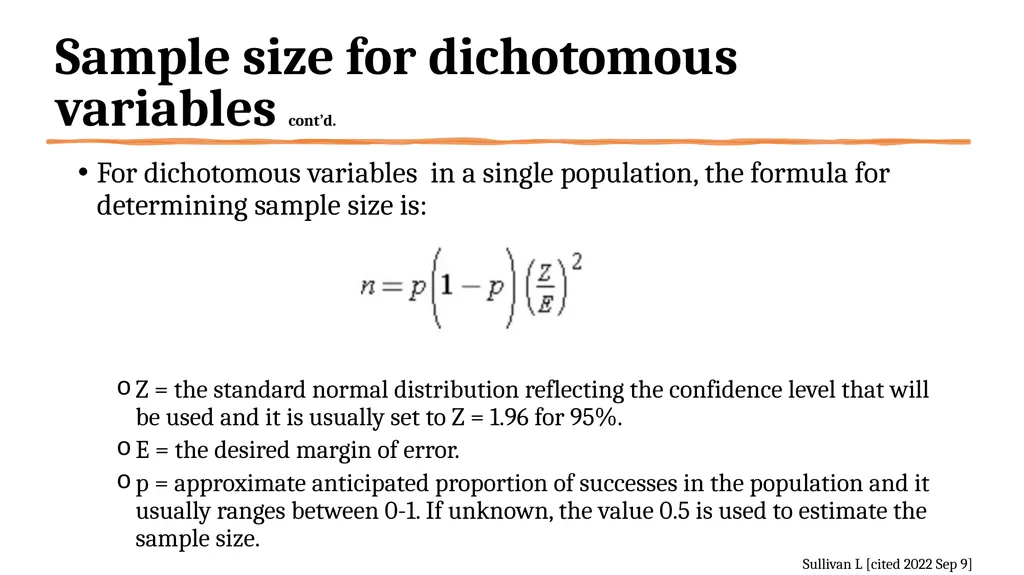
Sample size for dichotomous variables cont’d. For dichotomous variables in a single population, the formula for determining sample size is:
Z = the standard normal distribution reflecting the confidence level that will be used and it is usually set to Z = 1.96 for 95%.
E = the desired margin of error.
p = approximate anticipated proportion of successes in the population and it usually ranges between 0-1. If unknown, the value 0.5 is used to estimate the sample size. Sullivan L [cited 2022 Sep 9]<br>
Z = the standard normal distribution reflecting the confidence level that will be used and it is usually set to Z = 1.96 for 95%.
E = the desired margin of error.
p = approximate anticipated proportion of successes in the population and it usually ranges between 0-1. If unknown, the value 0.5 is used to estimate the sample size. Sullivan L [cited 2022 Sep 9]<br>
17
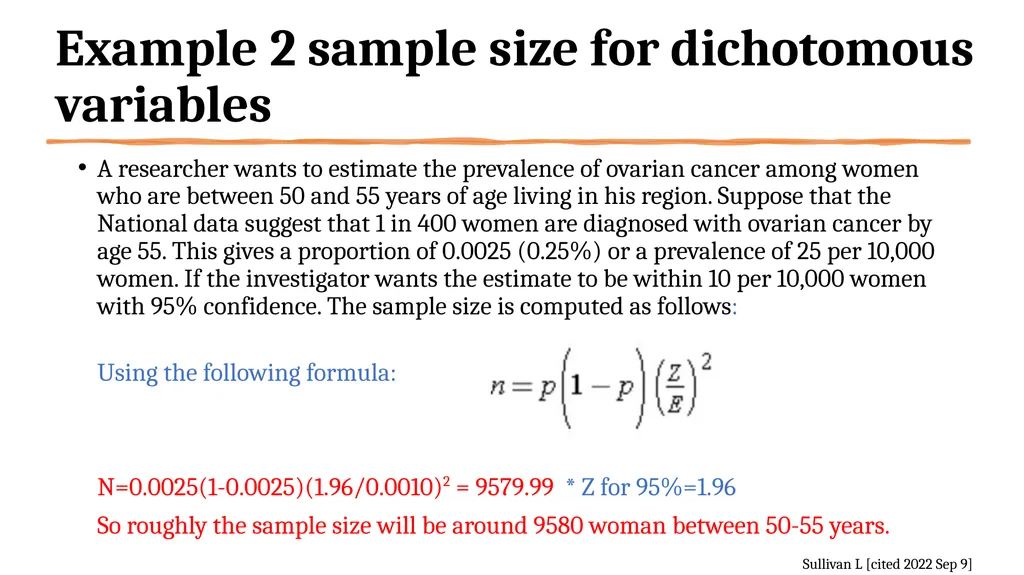
Sullivan L [cited 2022 Sep 9] Example 2 sample size for dichotomous variables A researcher wants to estimate the prevalence of ovarian cancer among women who are between 50 and 55 years of age living in his region. Suppose that the National data suggest that 1 in 400 women are diagnosed with ovarian cancer by age 55. This gives a proportion of 0.0025 (0.25%) or a prevalence of 25 per 10,000 women. If the investigator wants the estimate to be within 10 per 10,000 women with 95% confidence. The sample size is computed as follows: Using the following formula:
N=0.0025(1-0.0025)(1.96/0.0010)2 = 9579.99 * Z for 95%=1.96
So roughly the sample size will be around 9580 woman between 50-55 years.<br>
N=0.0025(1-0.0025)(1.96/0.0010)2 = 9579.99 * Z for 95%=1.96
So roughly the sample size will be around 9580 woman between 50-55 years.<br>
18
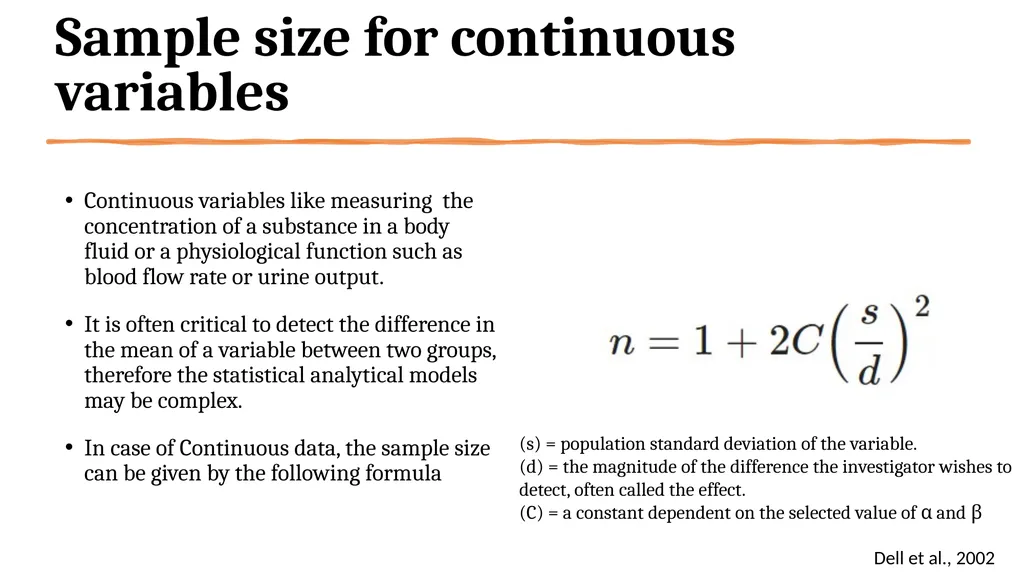
Sample size for continuous variables Continuous variables like measuring the concentration of a substance in a body fluid or a physiological function such as blood flow rate or urine output.
It is often critical to detect the difference in the mean of a variable between two groups, therefore the statistical analytical models may be complex.
In case of Continuous data, the sample size can be given by the following formula (s) = population standard deviation of the variable.
(d) = the magnitude of the difference the investigator wishes to detect, often called the effect.
(C) = a constant dependent on the selected value of α and β Dell et al., 2002<br>
It is often critical to detect the difference in the mean of a variable between two groups, therefore the statistical analytical models may be complex.
In case of Continuous data, the sample size can be given by the following formula (s) = population standard deviation of the variable.
(d) = the magnitude of the difference the investigator wishes to detect, often called the effect.
(C) = a constant dependent on the selected value of α and β Dell et al., 2002<br>
19
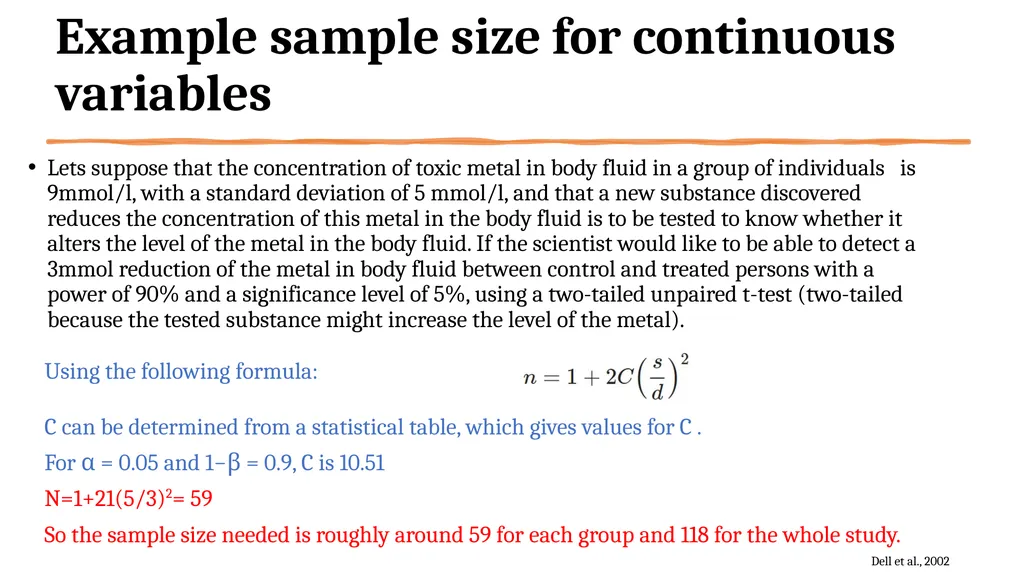
Example sample size for continuous variables Lets suppose that the concentration of toxic metal in body fluid in a group of individuals is 9mmol/l, with a standard deviation of 5 mmol/l, and that a new substance discovered reduces the concentration of this metal in the body fluid is to be tested to know whether it alters the level of the metal in the body fluid. If the scientist would like to be able to detect a 3mmol reduction of the metal in body fluid between control and treated persons with a power of 90% and a significance level of 5%, using a two-tailed unpaired t-test (two-tailed because the tested substance might increase the level of the metal). Dell et al., 2002 Using the following formula:
C can be determined from a statistical table, which gives values for C .
For α = 0.05 and 1−β = 0.9, C is 10.51
N=1+21(5/3)2= 59
So the sample size needed is roughly around 59 for each group and 118 for the whole study.<br>
C can be determined from a statistical table, which gives values for C .
For α = 0.05 and 1−β = 0.9, C is 10.51
N=1+21(5/3)2= 59
So the sample size needed is roughly around 59 for each group and 118 for the whole study.<br>
20
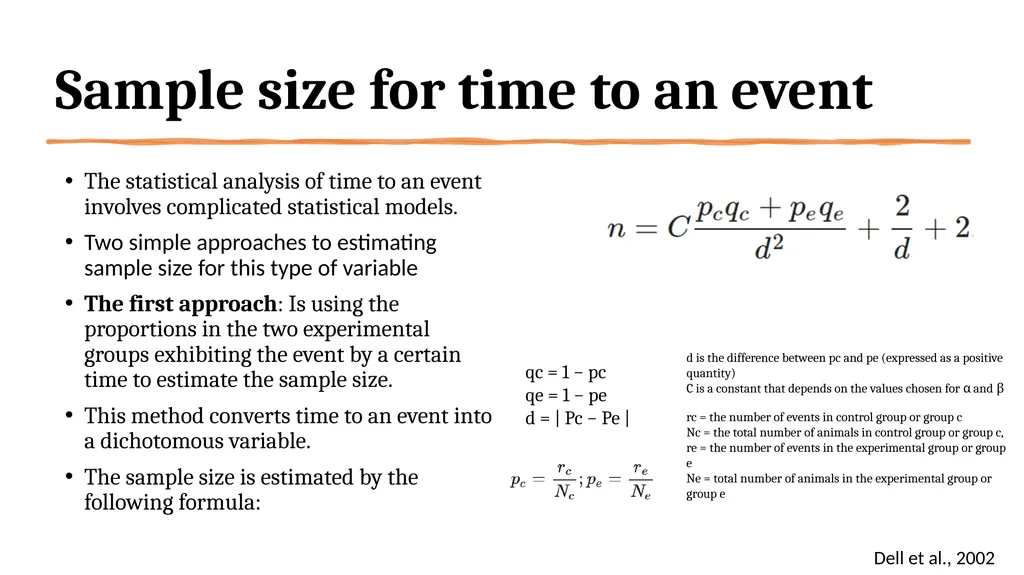
Sample size for time to an event The statistical analysis of time to an event involves complicated statistical models.
Two simple approaches to estimating sample size for this type of variable
The first approach: Is using the proportions in the two experimental groups exhibiting the event by a certain time to estimate the sample size.
This method converts time to an event into a dichotomous variable.
The sample size is estimated by the following formula: Dell et al., 2002 qc = 1 − pc
qe = 1 − pe
d = | Pc − Pe | d is the difference between pc and pe (expressed as a positive quantity)
C is a constant that depends on the values chosen for α and β rc = the number of events in control group or group c Nc = the total number of animals in control group or group c,
re = the number of events in the experimental group or group e
Ne = total number of animals in the experimental group or group e<br>
Two simple approaches to estimating sample size for this type of variable
The first approach: Is using the proportions in the two experimental groups exhibiting the event by a certain time to estimate the sample size.
This method converts time to an event into a dichotomous variable.
The sample size is estimated by the following formula: Dell et al., 2002 qc = 1 − pc
qe = 1 − pe
d = | Pc − Pe | d is the difference between pc and pe (expressed as a positive quantity)
C is a constant that depends on the values chosen for α and β rc = the number of events in control group or group c Nc = the total number of animals in control group or group c,
re = the number of events in the experimental group or group e
Ne = total number of animals in the experimental group or group e<br>
21
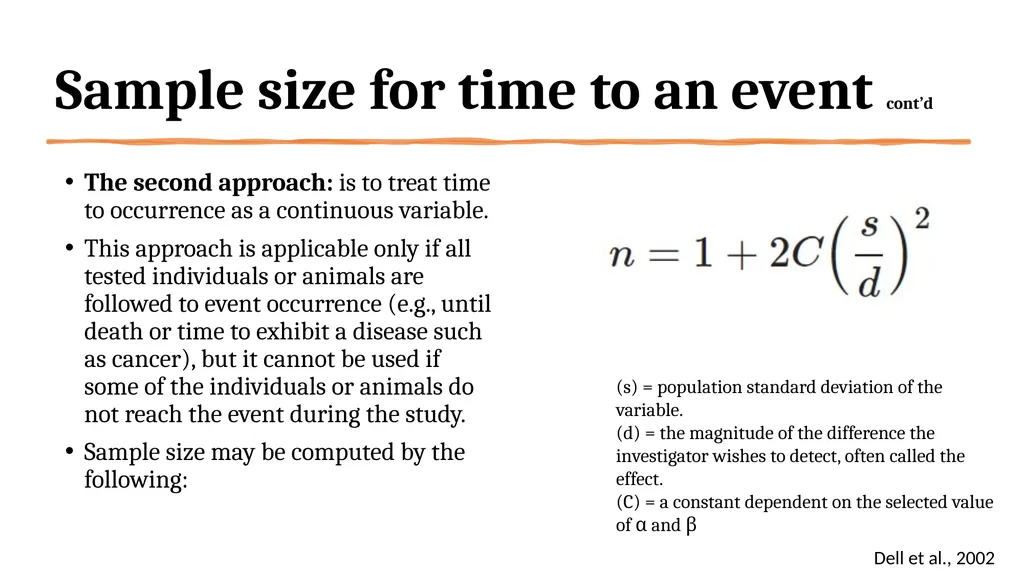
Sample size for time to an event cont’d The second approach: is to treat time to occurrence as a continuous variable.
This approach is applicable only if all tested individuals or animals are followed to event occurrence (e.g., until death or time to exhibit a disease such as cancer), but it cannot be used if some of the individuals or animals do not reach the event during the study.
Sample size may be computed by the following: Dell et al., 2002 (s) = population standard deviation of the variable.
(d) = the magnitude of the difference the investigator wishes to detect, often called the effect.
(C) = a constant dependent on the selected value of α and β<br>
This approach is applicable only if all tested individuals or animals are followed to event occurrence (e.g., until death or time to exhibit a disease such as cancer), but it cannot be used if some of the individuals or animals do not reach the event during the study.
Sample size may be computed by the following: Dell et al., 2002 (s) = population standard deviation of the variable.
(d) = the magnitude of the difference the investigator wishes to detect, often called the effect.
(C) = a constant dependent on the selected value of α and β<br>
22
References for more reading 1. Bhandari P. What is Effect Size and Why Does It Matter? (Examples) [Internet]. Scribbr. 2020 [cited 2022 Sep 9]. Available from: https://www.scribbr.com/statistics/effect-size/
2. Bujang MA. A Step-by-Step Process on Sample Size Determination for Medical Research. Malays J Med Sci MJMS. 2021 Apr;28(2):15–27.
3. Dell RB, Holleran S, Ramakrishnan R. Sample Size Determination. Ilar J. 2002;43(4):207–13.
4. Greenland S, Senn SJ, Rothman KJ, Carlin JB, Poole C, Goodman SN, et al. Statistical tests, P values, confidence intervals, and power: a guide to misinterpretations. Eur J Epidemiol. 2016;31:337–50.
5. Sullivan L. Power and Sample Size Determination [Internet]. [cited 2022 Sep 9]. Available from: https://sphweb.bumc.bu.edu/otlt/mph-modules/bs/bs704_power/bs704_power_print.html
6. Standard Deviation | How and when to use the Sample and Population Standard Deviation - A measure of spread | Laerd Statistics [Internet]. [cited 2022 Sep 9]. Available from: https://statistics.laerd.com/statistical-guides/measures-of-spread-standard-deviation.php
7. Statistical Power: What it is, How to Calculate it [Internet]. Statistics How To. [cited 2022 Sep 5]. Available from: https://www.statisticshowto.com/probability-and-statistics/statistics-definitions/statistical-power/<br>
2. Bujang MA. A Step-by-Step Process on Sample Size Determination for Medical Research. Malays J Med Sci MJMS. 2021 Apr;28(2):15–27.
3. Dell RB, Holleran S, Ramakrishnan R. Sample Size Determination. Ilar J. 2002;43(4):207–13.
4. Greenland S, Senn SJ, Rothman KJ, Carlin JB, Poole C, Goodman SN, et al. Statistical tests, P values, confidence intervals, and power: a guide to misinterpretations. Eur J Epidemiol. 2016;31:337–50.
5. Sullivan L. Power and Sample Size Determination [Internet]. [cited 2022 Sep 9]. Available from: https://sphweb.bumc.bu.edu/otlt/mph-modules/bs/bs704_power/bs704_power_print.html
6. Standard Deviation | How and when to use the Sample and Population Standard Deviation - A measure of spread | Laerd Statistics [Internet]. [cited 2022 Sep 9]. Available from: https://statistics.laerd.com/statistical-guides/measures-of-spread-standard-deviation.php
7. Statistical Power: What it is, How to Calculate it [Internet]. Statistics How To. [cited 2022 Sep 5]. Available from: https://www.statisticshowto.com/probability-and-statistics/statistics-definitions/statistical-power/<br>
23
Useful websites for sample size calculation ClinCalc LLC. Sample Size Calculator [website]. C2002. Available at: https://clincalc.com/stats/SampleSize.aspx
Dean AG, Sullivan KM, Soe MM. OpenEpi: Open Source Epidemiologic Statistics for Public Health, Version. www.OpenEpi.com, updated 2013/04/06. Available at: https://www.openepi.com
GIGAcalculator. Power & Sample Size Calculator [website]. c2017-2022. Available at: https://www.gigacalculator.com/calculators/power-sample-size-calculator.php
Kohn MA, Senyak J. Sample Size Calculators [website]. UCSF CTSI. 20 December 2021. Available at https://www.sample-size.net/
PS: Power and Sample Size Calculation [website]. Vanderbilt Biostatistics Wiki, c2013-2022. Available from: https://biostat.app.vumc.org/wiki/Main/PowerSampleSize.
StatCalc in Epi Info™, Division of Health Informatics & Surveillance (DHIS), Center for Surveillance, Epidemiology & Laboratory Services (CSELS) [website]. CDC. Available at: https://www.cdc.gov/epiinfo/user-guide/statcalc/samplesize.html
<http://www.biomath.info>: a simple website of the biomathematics division of the Department of Pediatrics at the College of Physicians & Surgeons at Columbia University, which implements the equations and conditions discussed in this article
<http://davidmlane.com/hyperstat/power.html>: a clear and concise review of the basic principles of statistics, which includes a discussion of sample size calculations with links to sites where actual calculations can be performed
nQuery Advisor, SPSS, MINITAB and SAS/STAT are paid statistical programs and software that can be used both for sample size calculations and statistical data analysis<br>
Dean AG, Sullivan KM, Soe MM. OpenEpi: Open Source Epidemiologic Statistics for Public Health, Version. www.OpenEpi.com, updated 2013/04/06. Available at: https://www.openepi.com
GIGAcalculator. Power & Sample Size Calculator [website]. c2017-2022. Available at: https://www.gigacalculator.com/calculators/power-sample-size-calculator.php
Kohn MA, Senyak J. Sample Size Calculators [website]. UCSF CTSI. 20 December 2021. Available at https://www.sample-size.net/
PS: Power and Sample Size Calculation [website]. Vanderbilt Biostatistics Wiki, c2013-2022. Available from: https://biostat.app.vumc.org/wiki/Main/PowerSampleSize.
StatCalc in Epi Info™, Division of Health Informatics & Surveillance (DHIS), Center for Surveillance, Epidemiology & Laboratory Services (CSELS) [website]. CDC. Available at: https://www.cdc.gov/epiinfo/user-guide/statcalc/samplesize.html
<http://www.biomath.info>: a simple website of the biomathematics division of the Department of Pediatrics at the College of Physicians & Surgeons at Columbia University, which implements the equations and conditions discussed in this article
<http://davidmlane.com/hyperstat/power.html>: a clear and concise review of the basic principles of statistics, which includes a discussion of sample size calculations with links to sites where actual calculations can be performed
nQuery Advisor, SPSS, MINITAB and SAS/STAT are paid statistical programs and software that can be used both for sample size calculations and statistical data analysis<br>
24
Thank you!<br>