04
What is Statistics? A way to make sense of information from data
Framework for thinking, for reaching insights, and solving problems.
Numbers alone mean very little without context
Statistics is a marriage of:
Math
Science
Art<br>
05
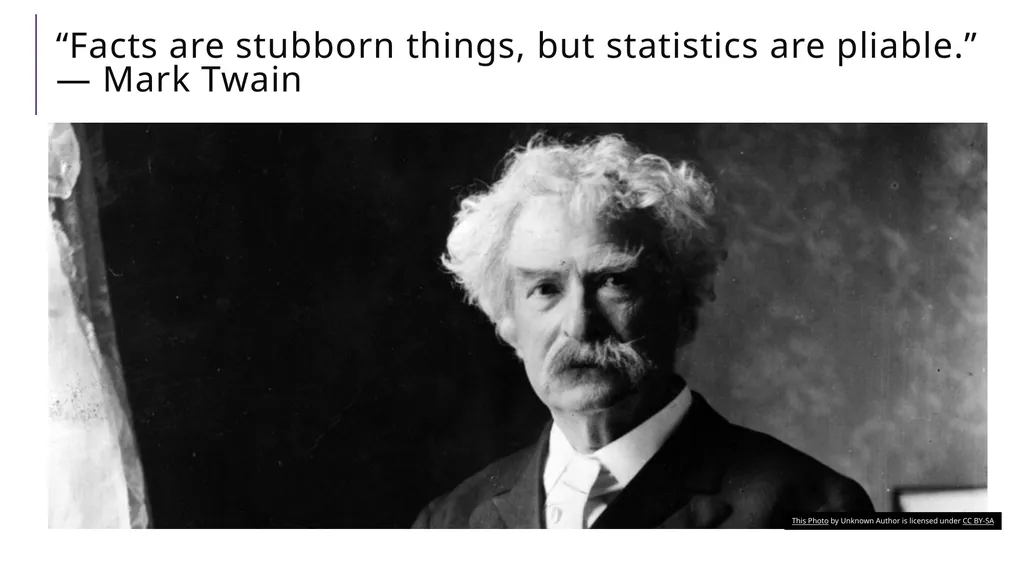
“Facts are stubborn things, but statistics are pliable.”
― Mark Twain This Photo by Unknown Author is licensed under CC BY-SA<br>
07
Sampling gone wrong (bias)<br>
08
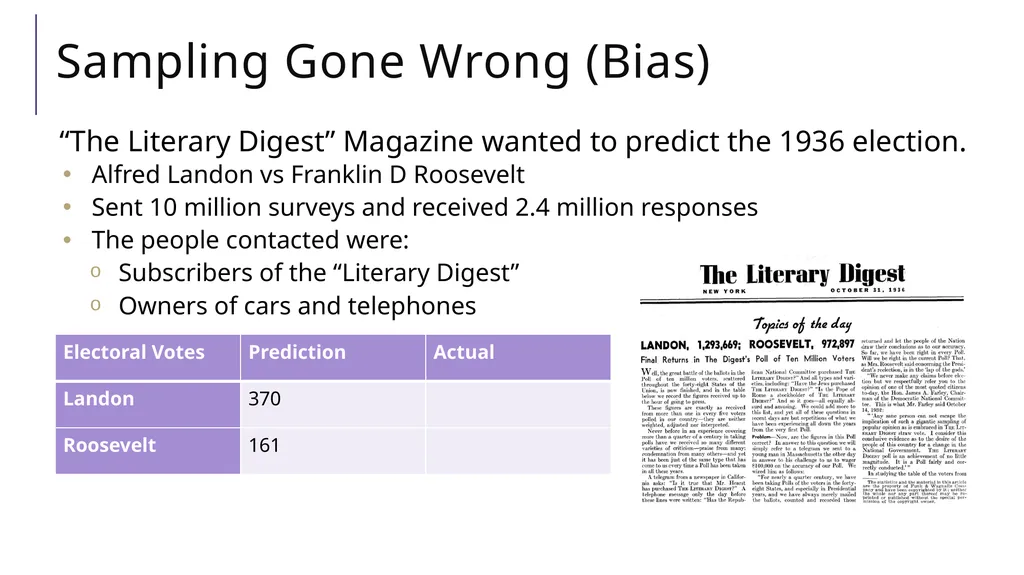
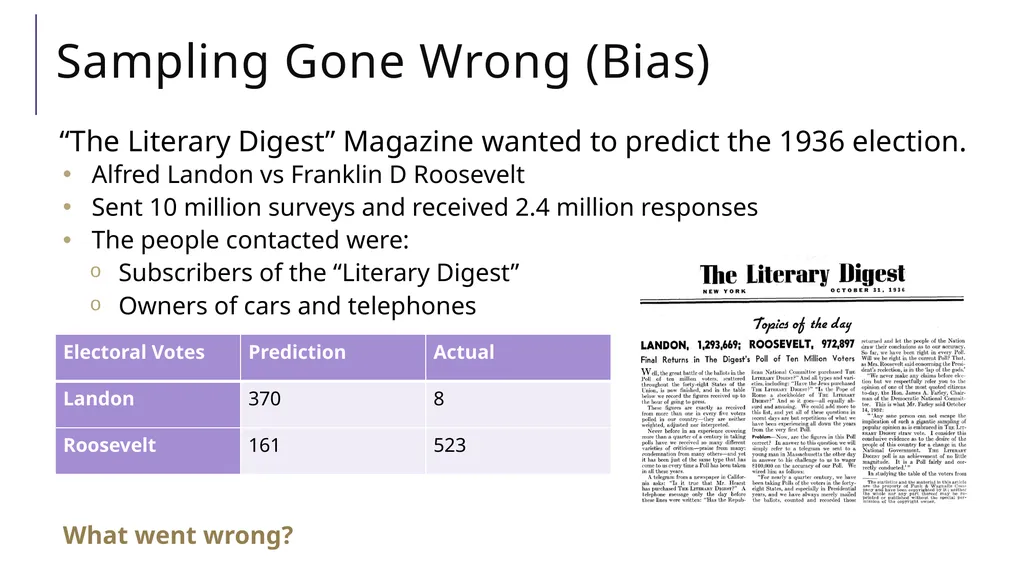
Sampling Gone Wrong (Bias) “The Literary Digest” Magazine wanted to predict the 1936 election.
Alfred Landon vs Franklin D Roosevelt
Sent 10 million surveys and received 2.4 million responses
The people contacted were:
Subscribers of the “Literary Digest”
Owners of cars and telephones<br>
09
Sampling Gone Wrong (Bias) “The Literary Digest” Magazine wanted to predict the 1936 election.
Alfred Landon vs Franklin D Roosevelt
Sent 10 million surveys and received 2.4 million responses
The people contacted were:
Subscribers of the “Literary Digest”
Owners of cars and telephones
What went wrong?<br>
10
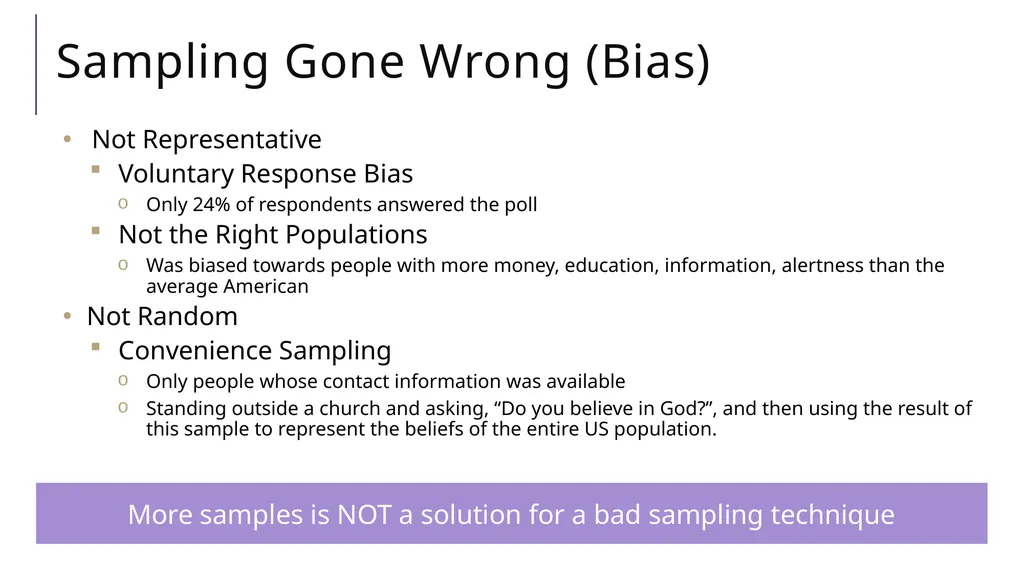
Sampling Gone Wrong (Bias) Not Representative
Voluntary Response Bias
Only 24% of respondents answered the poll
Not the Right Populations
Was biased towards people with more money, education, information, alertness than the average American
Not Random
Convenience Sampling
Only people whose contact information was available
Standing outside a church and asking, “Do you believe in God?”, and then using the result of this sample to represent the beliefs of the entire US population. More samples is NOT a solution for a bad sampling technique<br>
11
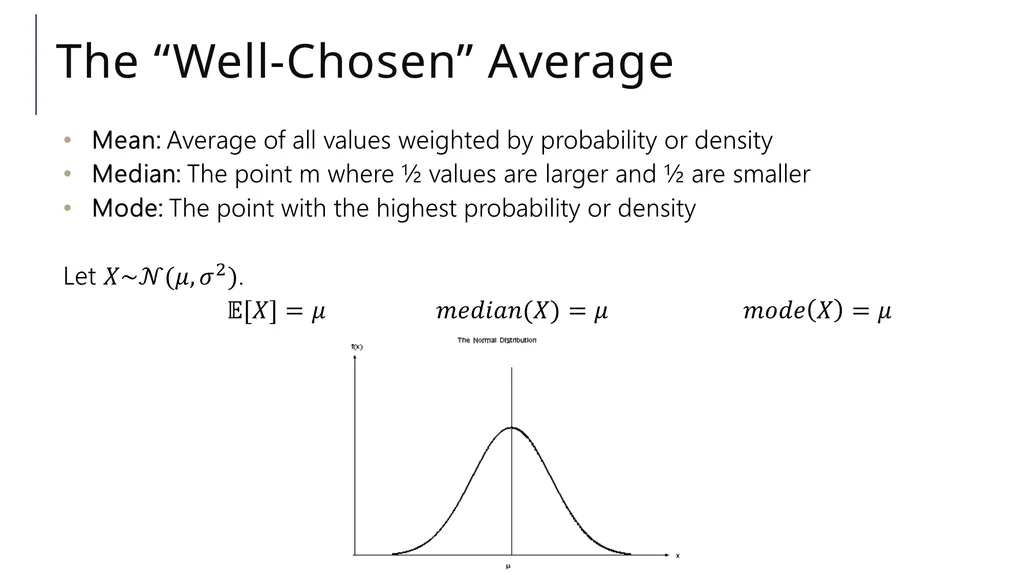
The “Well-Chosen” Average<br>
12
The “Well-Chosen” Average<br>
13
The “Well-Chosen” Average<br>
14
Are haircuts more expensive in Vancouver or Toronto? What do you think?<br>
15
Are haircuts more expensive in Vancouver or Toronto? What do you think now?<br>
16
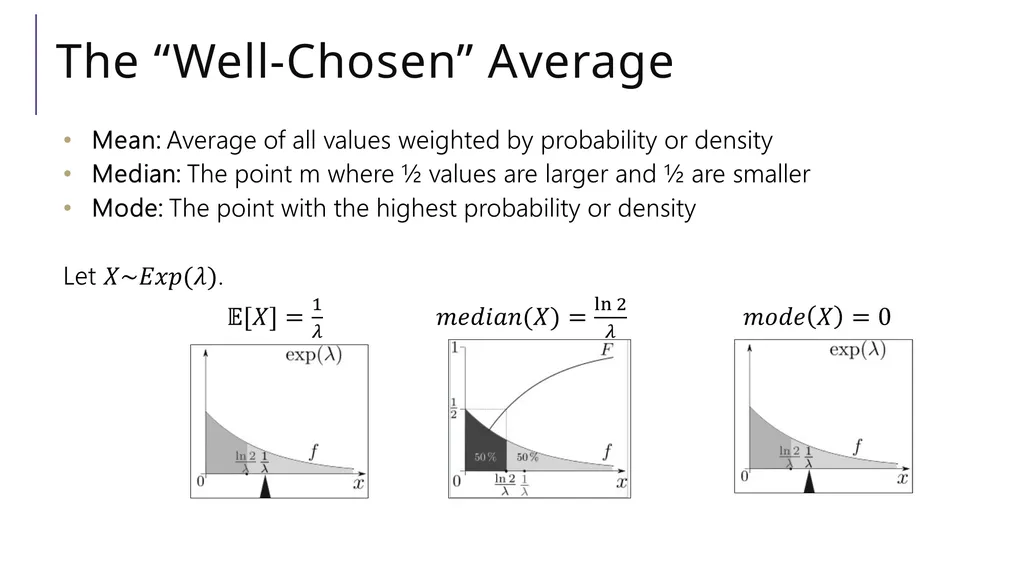
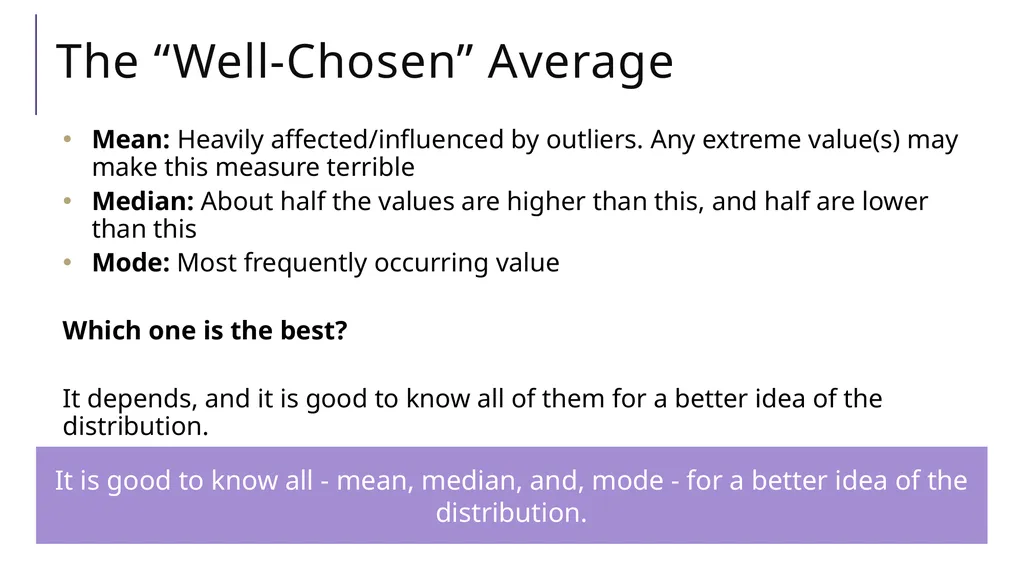
The “Well-Chosen” Average Mean: Heavily affected/influenced by outliers. Any extreme value(s) may make this measure terrible
Median: About half the values are higher than this, and half are lower than this
Mode: Most frequently occurring value
Which one is the best?
It depends, and it is good to know all of them for a better idea of the distribution. It is good to know all - mean, median, and, mode - for a better idea of the distribution.<br>
18
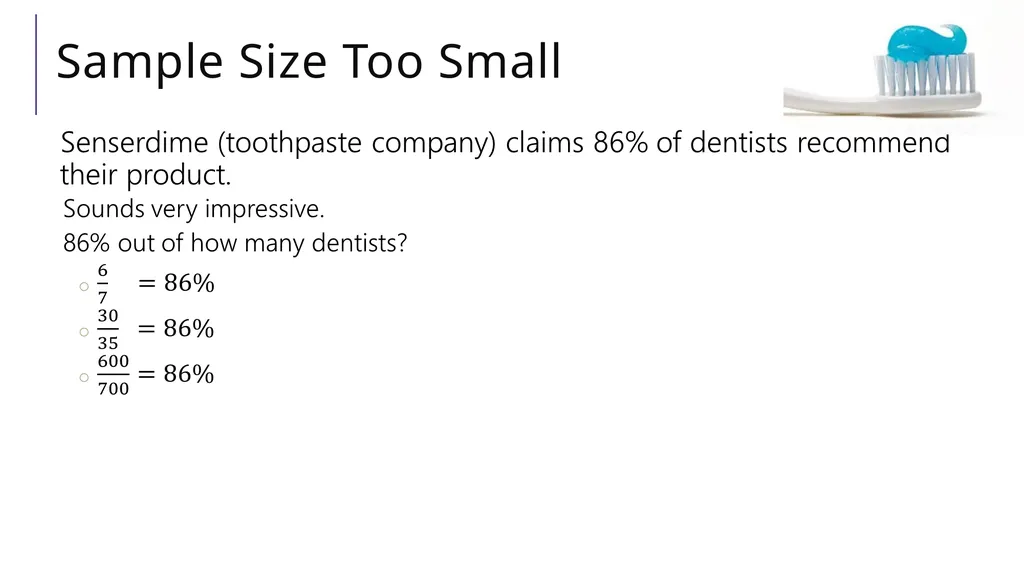
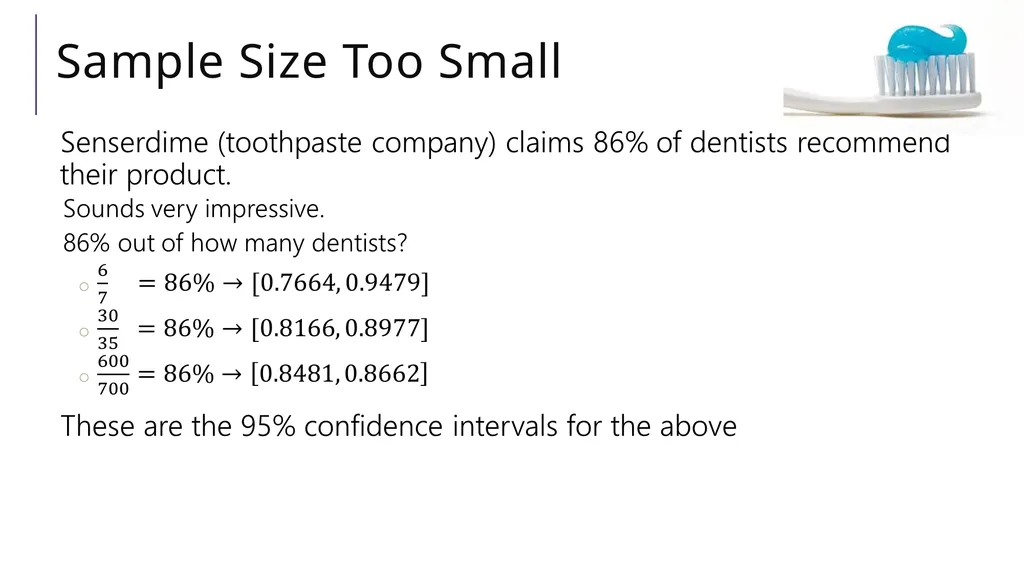
Sample Size Too Small Senserdime (toothpaste company) claims 86% of dentists recommend their product.
Sounds very impressive.
Would you buy a Senserdime toothpaste?<br>
19
Sample Size Too Small<br>
20
Sample Size Too Small<br>
21
Misleading results<br>
22
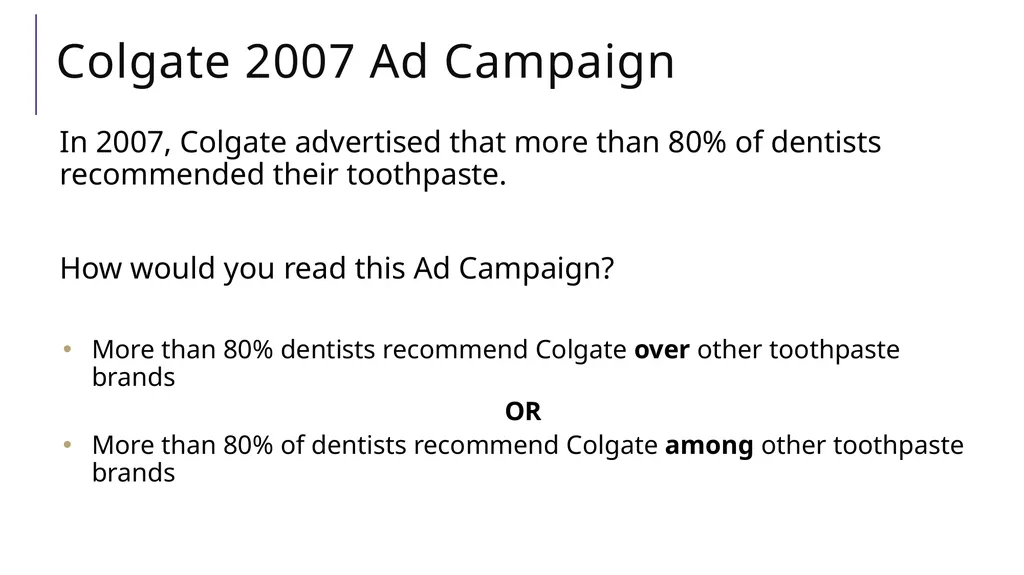
Colgate 2007 Ad Campaign In 2007, Colgate advertised that more than 80% of dentists recommended their toothpaste.
How would you read this Ad Campaign?
More than 80% dentists recommend Colgate over other toothpaste brands
OR
More than 80% of dentists recommend Colgate among other toothpaste brands<br>
23
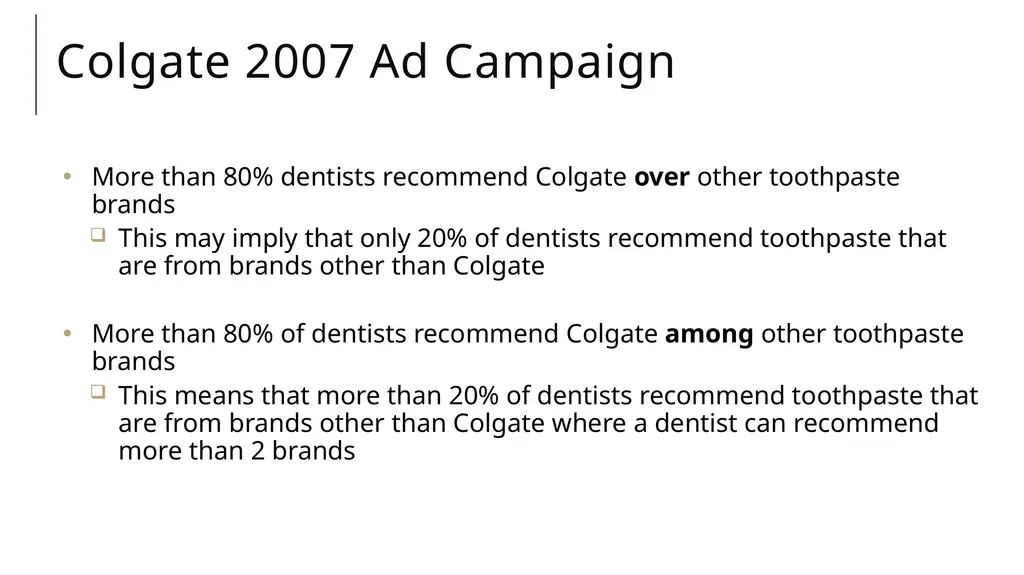
Colgate 2007 Ad Campaign More than 80% dentists recommend Colgate over other toothpaste brands
This may imply that only 20% of dentists recommend toothpaste that are from brands other than Colgate
More than 80% of dentists recommend Colgate among other toothpaste brands
This means that more than 20% of dentists recommend toothpaste that are from brands other than Colgate where a dentist can recommend more than 2 brands<br>
24
People who use Senserdime generally have less cavities than those who use generic brands
Can we say “Senserdime prevents cavities”?<br>
25
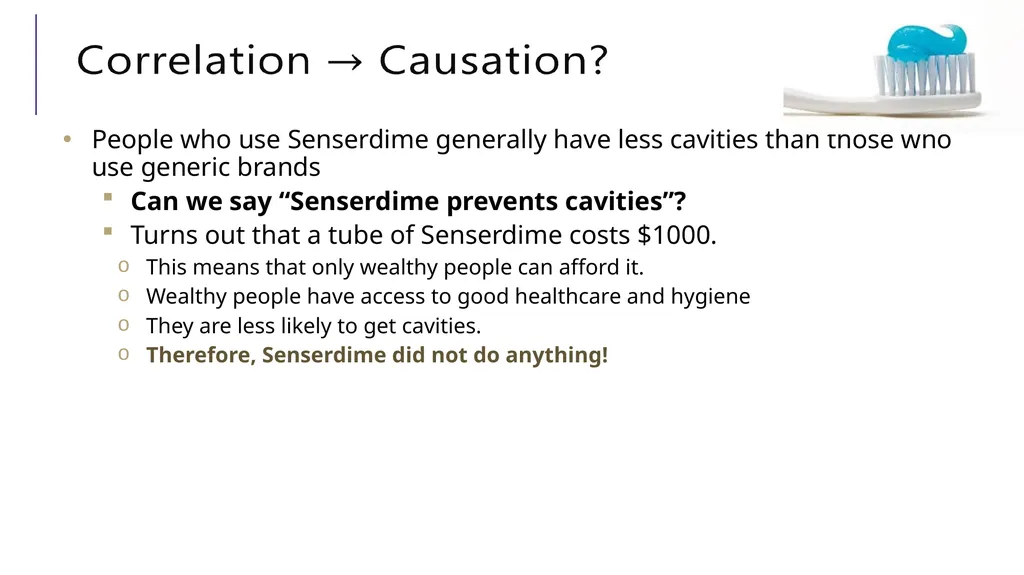
People who use Senserdime generally have less cavities than those who use generic brands
Can we say “Senserdime prevents cavities”?
Turns out that a tube of Senserdime costs $1000.
This means that only wealthy people can afford it.
Wealthy people have access to good healthcare and hygiene
They are less likely to get cavities.
Therefore, Senserdime did not do anything!<br>
26
“When ice cream sales go up, umbrella sales go down”<br>
27
“When ice cream sales go up, umbrella sales go down”
Both generally happen in the summer
An increase in ice cream sales did not CAUSE umbrella sales to go down.
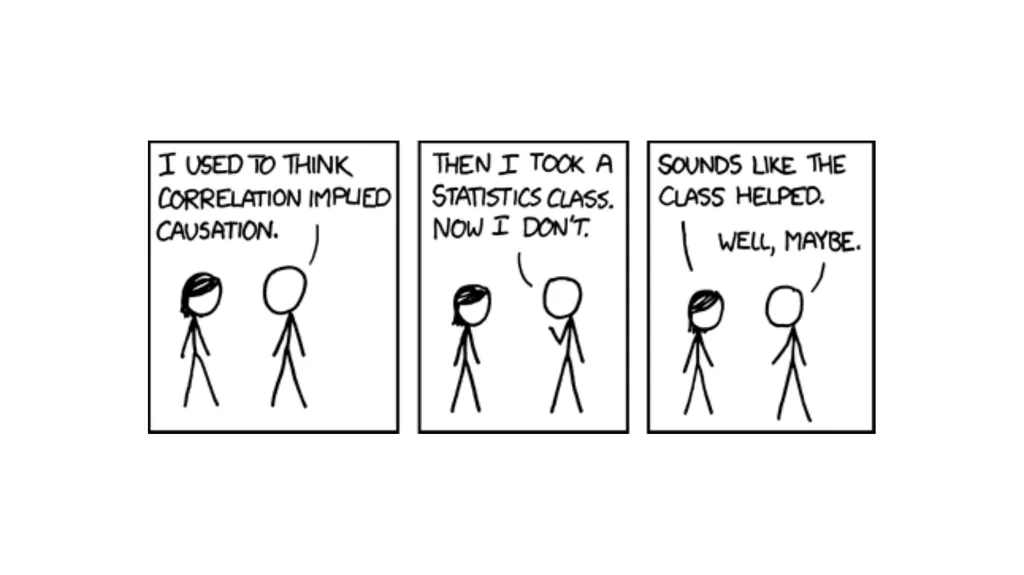
The weather CAUSED both of these things to happen Correlation DOES NOT imply Causation!<br>
28
Conditional Probability<br>
29
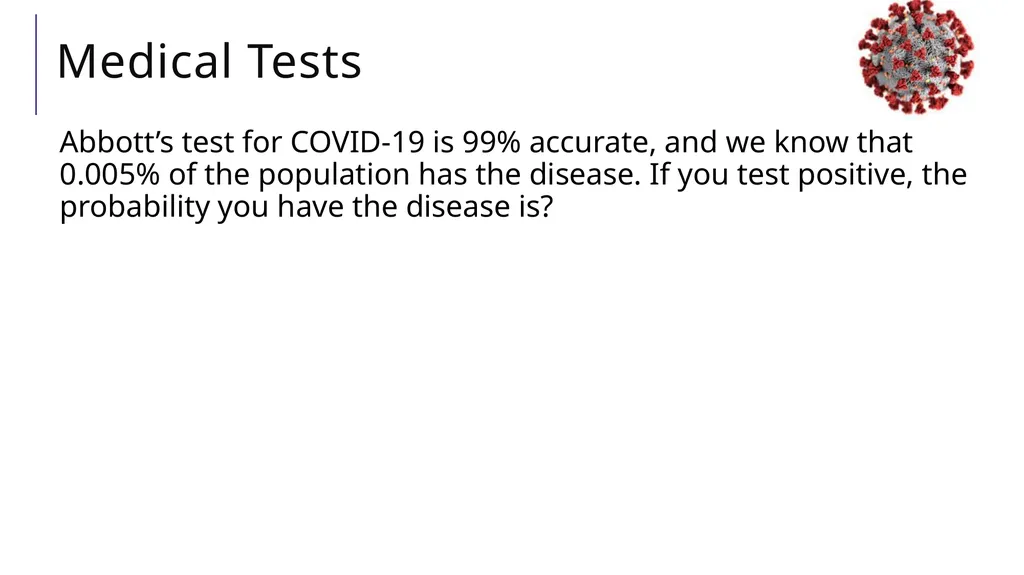
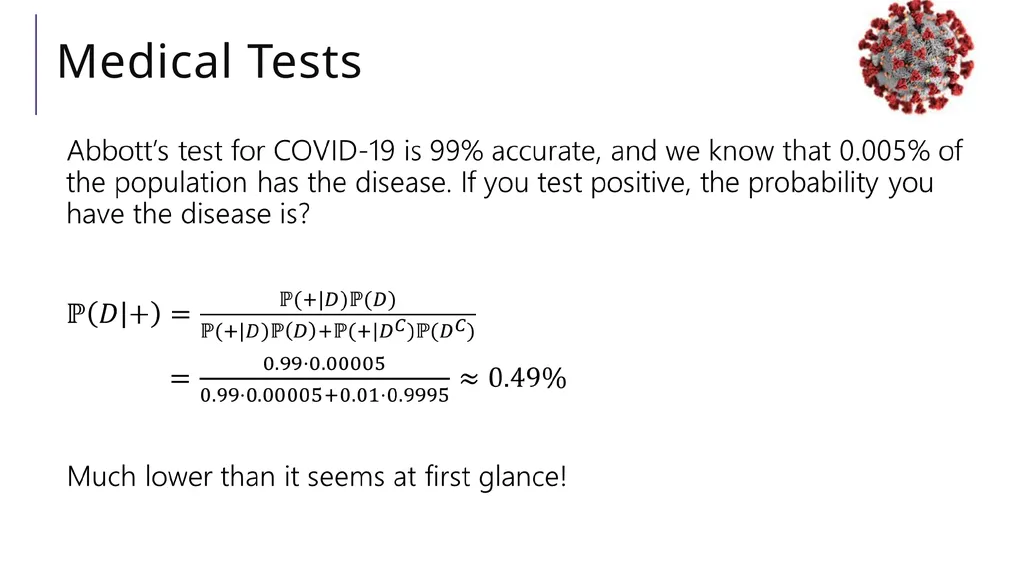
Medical Tests Abbott’s test for COVID-19 is 99% accurate, and we know that 0.005% of the population has the disease. If you test positive, the probability you have the disease is?<br>
31
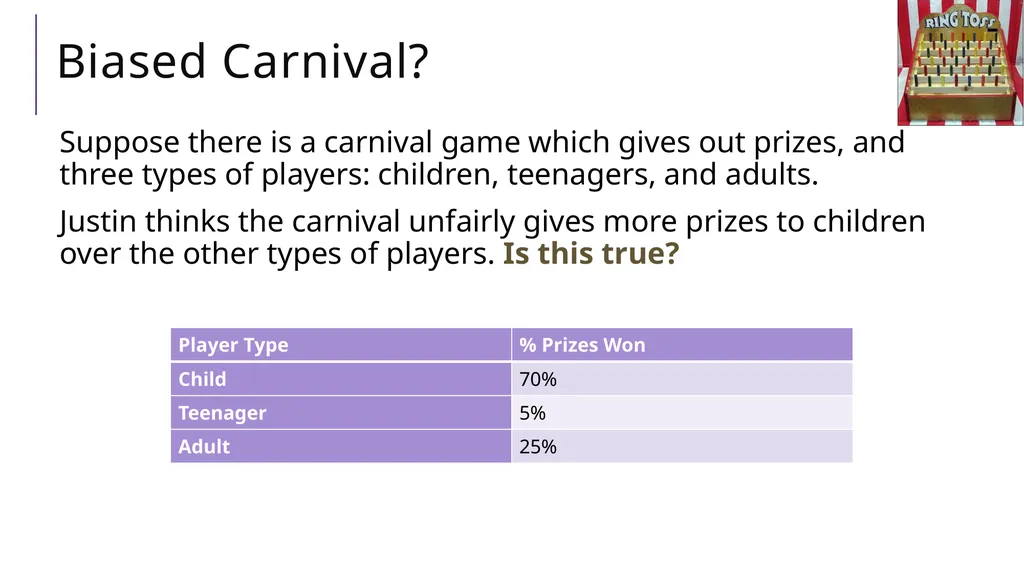
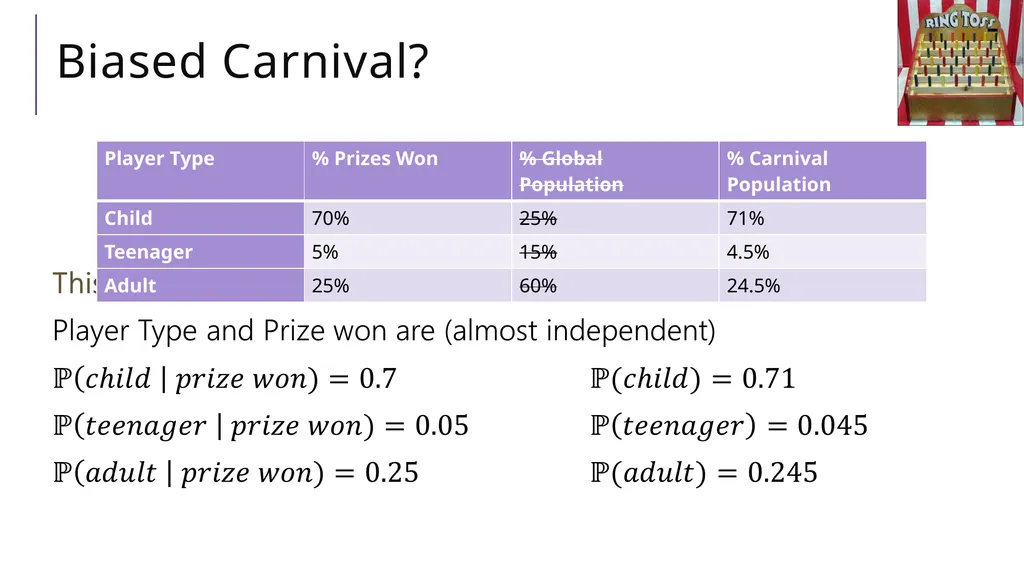
Biased Carnival? Suppose there is a carnival game which gives out prizes, and three types of players: children, teenagers, and adults.
Justin thinks the carnival unfairly gives more prizes to children over the other types of players. Is this true?<br>
32
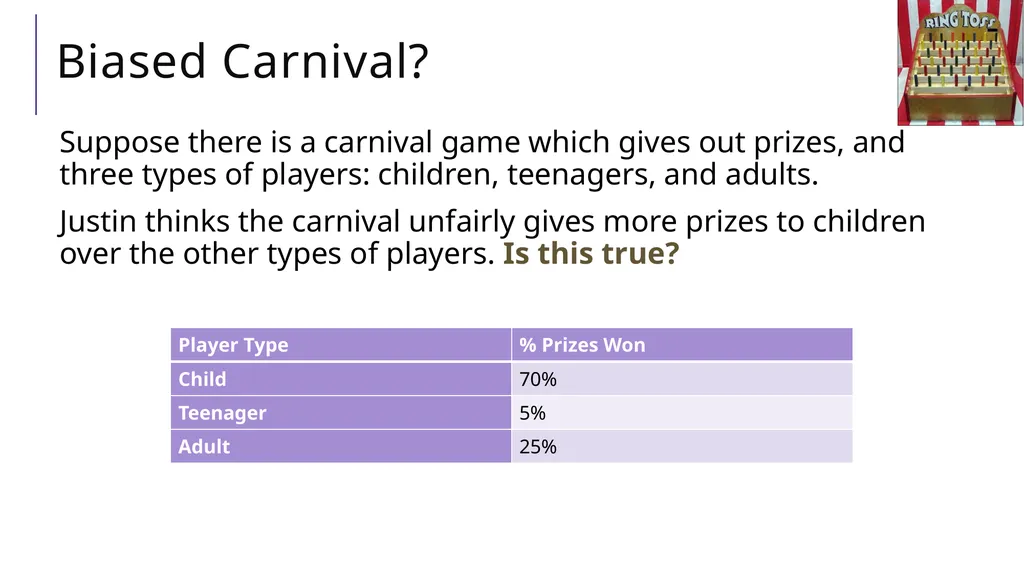
Biased Carnival? Suppose there is a carnival game which gives out prizes, and three types of players: children, teenagers, and adults.
Justin thinks the carnival unfairly gives more prizes to children over the other types of players. Is this true?<br>
33
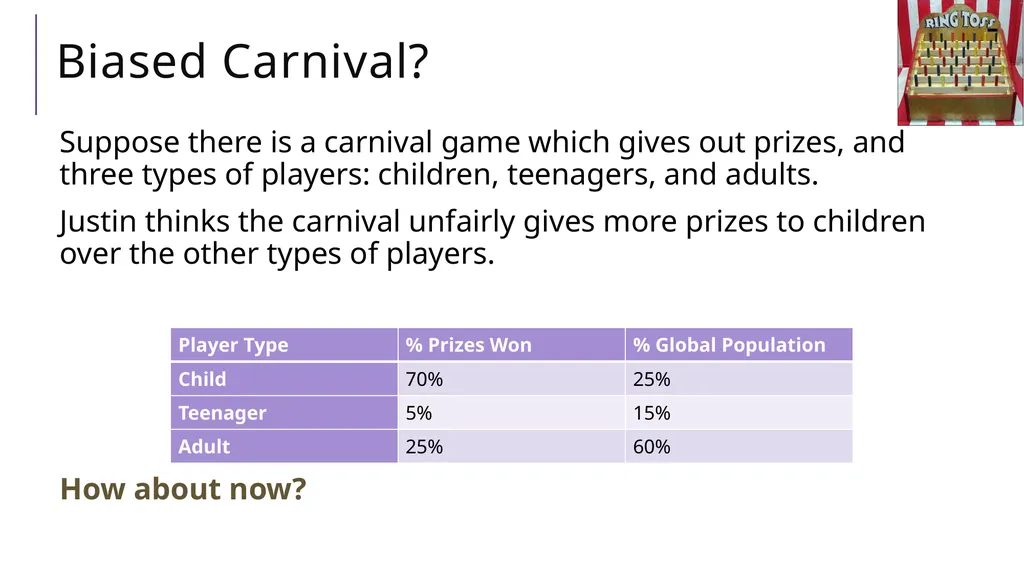
Biased Carnival? Suppose there is a carnival game which gives out prizes, and three types of players: children, teenagers, and adults.
Justin thinks the carnival unfairly gives more prizes to children over the other types of players.
How about now?<br>
34
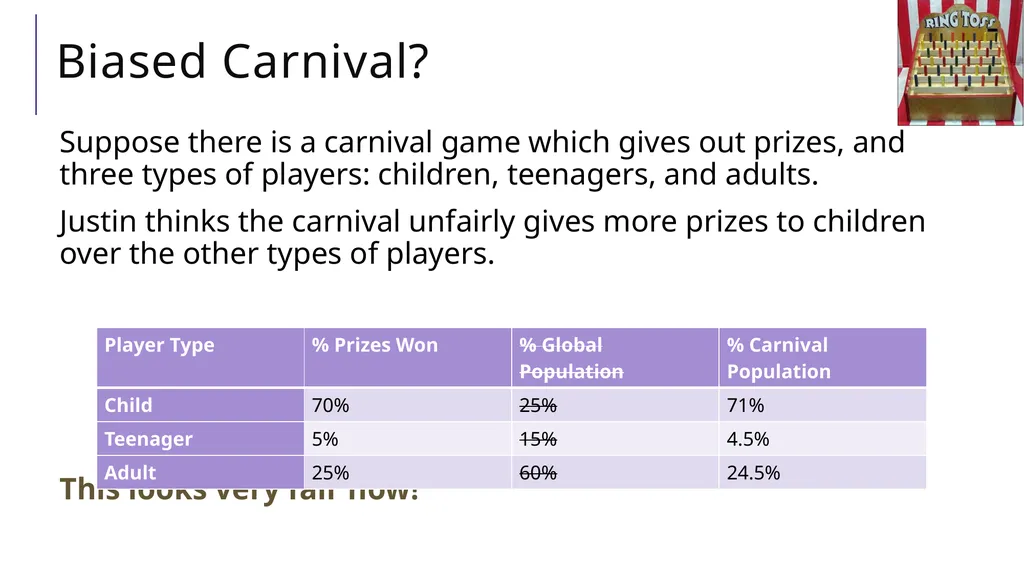
Biased Carnival? Suppose there is a carnival game which gives out prizes, and three types of players: children, teenagers, and adults.
Justin thinks the carnival unfairly gives more prizes to children over the other types of players.
This looks very fair now!<br>
37
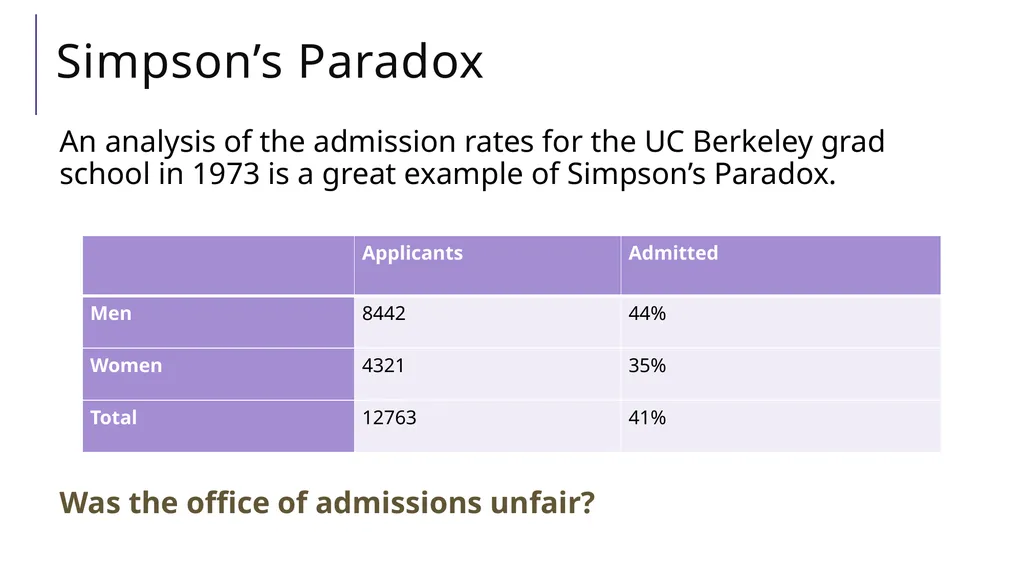
Simpson’s Paradox An analysis of the admission rates for the UC Berkeley grad school in 1973 is a great example of Simpson’s Paradox.
Was the office of admissions unfair?<br>
38
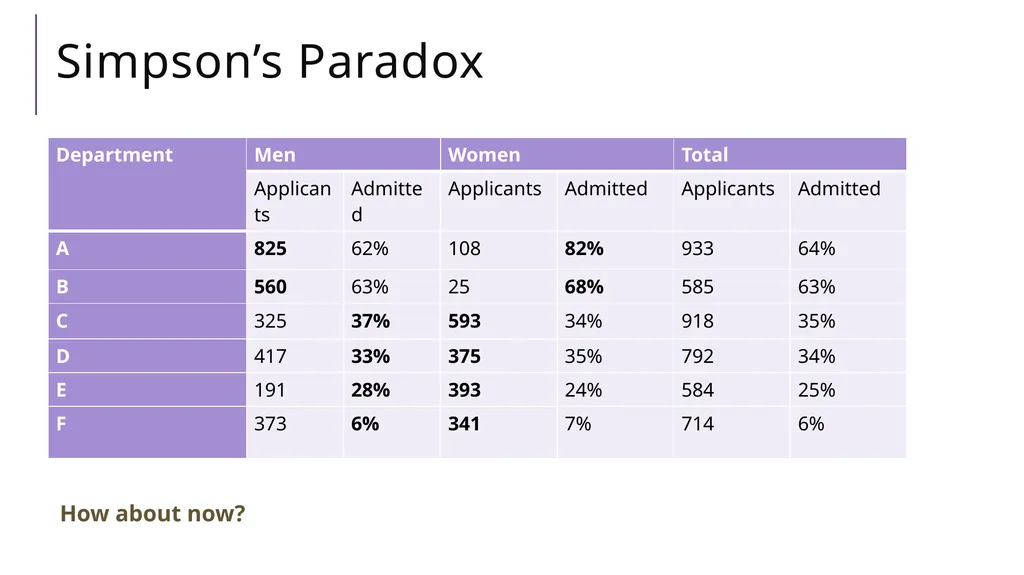
Simpson’s Paradox How about now?<br>
39
Simpson’s Paradox Simpson's paradox is a phenomenon in probability and statistics in which a trend appears in several groups of data but disappears or reverses when the groups are combined.<br>
42
How to better understand Statistics? Who says so?
How do they know this is true?
What’s missing?
Did somebody change the subject?
Does it make sense?<br>
43
Conclusions Determine if the samples are random and representative.
Ask if the statistic represents the mean, median, or mode.
Inquire about the size of the sample relative to the population, and/or ask for a confidence interval.
Correlation does not imply causation.
Check the distribution of the samples (are they uniform, or not)?
Interpret conditional probabilities properly. Intuition sometimes doesn’t work here!
Does the data give you the full picture? If there are subcategories, enquire into them!
Independent events! Don’t gamble, ever.<br>
44
“95.73% of all statistics are made up!”
- Kushal Jhunjhunwalla This Photo by Unknown Author is licensed under CC BY-SA-NC<br>