
Human Capital Estimates in China: New Panel Data






Description: Human Capital Estimates in China: New Panel Data on China by Provinces 1985-2010 Haizheng Li School of Economics Georgia Institute of Technology Email: haizheng.liecon.gatech.edu Qinyi Liu School of Economics and Trade Hunan University Bo
Related Topics
Download Presentation
"Human Capital Estimates in China: New Panel Data" is the property of its rightful owner. Permission is granted to download and print the materials on this website for personal, non-commercial use only, and to display it on your personal computer provided you do not modify the materials and that you retain all copyright notices contained in the materials. By downloading content from our website, you accept the terms of this agreement.
Presentation Transcript
slide1. Human Capital Estimates in China: New Panel Data on China by Provinces 1985-2010 Haizheng Li
School of Economics
Georgia Institute of Technology
Email: haizheng.li@econ.gatech.edu
Qinyi Liu
School of Economics and Trade
Hunan University
Bo Li
China Center for Human Capital and Labor Market Research
Central University of Finance and Economics
Barbara Fraumeni
Muskie School of Public Service
University of Southern Maine
Xiaobei Zhang
School of Economics
Zhejiang University of Finance and Economics 中国人力资本与劳动经济研究中心
China Center for Human Capital and Labor Market Research<br>
slide2. Human capital “The knowledge, skills, competencies and attributes embodied in individuals that facilitate the creation of personal, social and economic well-being”
--OECD, 2001
Importance of Human Capital
A central determinant of economic growth
Significant contributions to 30 years’ economic growth in China
Enhances the ability in
Developing technological innovations
Adapting and implementing technologies developed
Reduce poverty and inequality 2 中国人力资本与劳动经济研究中心
China Center for Human Capital and Labor Market Research<br>
slide3. Human capital Importance of Human Capital Measurement
Trace the distribution and dynamics of human capital
Aid empirical studies and policy analysis
Promote the creation of human capital satellite account 3 中国人力资本与劳动经济研究中心
China Center for Human Capital and Labor Market Research<br>
slide4. Human capital measurement Challenges
The unique characteristics make it difficult to estimate its value
Partial measurements like education are commonly used
Lack of data existing method cannot be applied to China
Arduous work for data collection, processing and calculation, especially at provincial level
Empirical researches desire panel data of human capital
Panel data of comprehensive measures of human capital at a state or province level are lacking for most countries including China 4 中国人力资本与劳动经济研究中心
China Center for Human Capital and Labor Market Research<br>
slide5. Research team and sponsors Research Team (starting in 2008)
China Center for Human Capital and Labor Market Research (CHLR) special-term faculty, full-time faculty, doctoral and Master’s student, and staff
Sponsors
National Natural Science Foundation of China
Central University of Finance and Economics 5 中国人力资本与劳动经济研究中心
China Center for Human Capital and Labor Market Research<br>
slide6. Methodology Jorgenson-Fraumeni Lifetime Income-based Approach
Include all aspects of human capital services measured by market value
Widely used in measuring a nation’s total human capital stock
Argentina (Coremberg, 2010), Australia (Wei, 2007, 2008), Canada (Gu and Wong, 2009), India (Gundimeda et al., 2007), New Zealand (Le, Gibson, and Oxley, 2005), Norway (Liu and Greaker, 2009), Sweden (Ahlroth, Bjorkland, and Forslund, 1997), United Kingdom (O’Mahony and Stevens, 2004 and Jones and Chirpanhura, 2010), and the United States (Christian, 2010)
The OECD human capital consortium
OECD, 2010; Mira and Liu, 2010; Liu, 2011
China’s national level human capital
Li et al., 2010; Li, Liang et al., 2013 6 中国人力资本与劳动经济研究中心
China Center for Human Capital and Labor Market Research<br>
slide7. Methodology Jorgenson-Fraumeni lifetime income-based approach
Calculate human capital stock for each individual as the estimated present value of expected future lifetime earnings
Backward recursive estimation beginning with the oldest covered age
Divide life cycle into five stages
Retirement, Work-only, Work-school, School-only, Pre-school
Modifications
Incorporate the Mincer model (National level)
Expand Mincer model to include macro-variables (Provincial level)
Derive total human capital stock separated by urban and rural in estimation
Adjustment for cross-province comparison with a living cost adjustment index 7 中国人力资本与劳动经济研究中心
China Center for Human Capital and Labor Market Research<br>
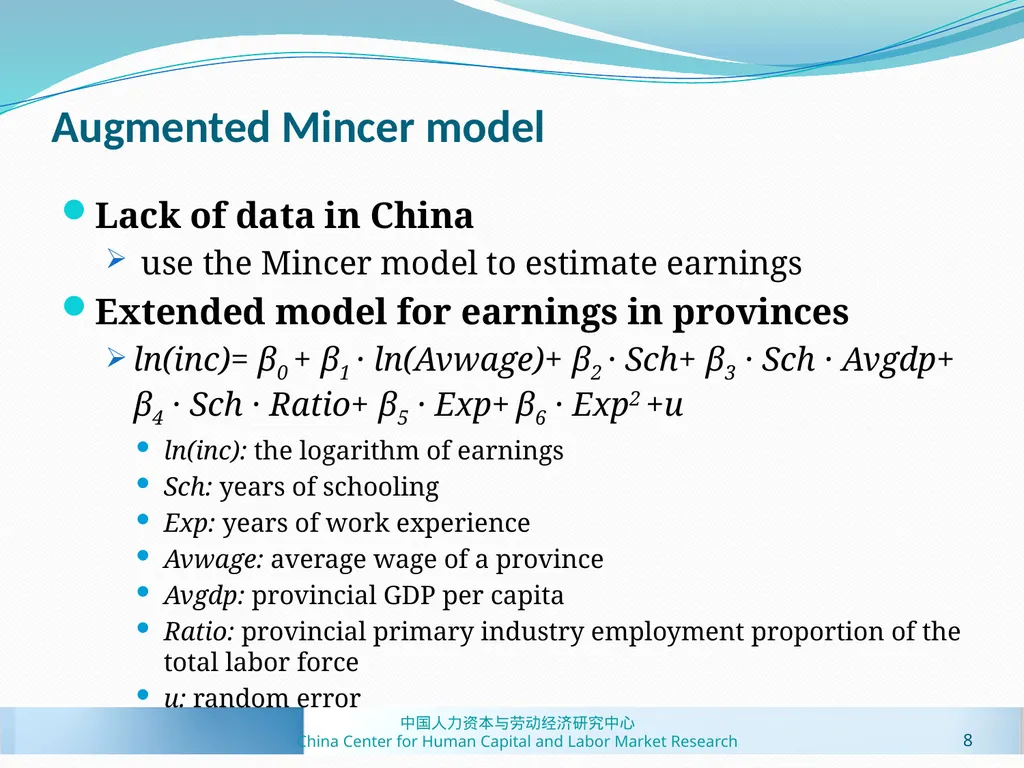
slide8. Augmented Mincer model Lack of data in China
use the Mincer model to estimate earnings
Extended model for earnings in provinces
ln(inc)= β0 + β1 · ln(Avwage)+ β2 · Sch+ β3 · Sch · Avgdp+ β4 · Sch · Ratio+ β5 · Exp+ β6 · Exp2 +u
ln(inc): the logarithm of earnings
Sch: years of schooling
Exp: years of work experience
Avwage: average wage of a province
Avgdp: provincial GDP per capita
Ratio: provincial primary industry employment proportion of the total labor force
u: random error 8 中国人力资本与劳动经济研究中心
China Center for Human Capital and Labor Market Research<br>
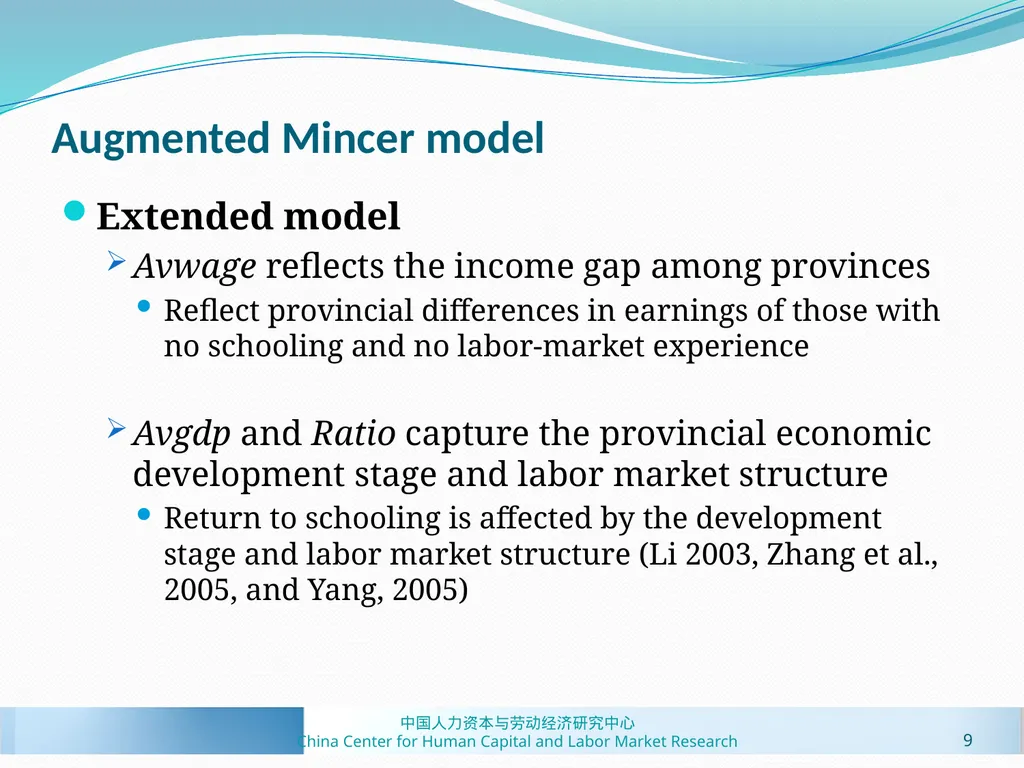
slide9. Augmented Mincer model Extended model
Avwage reflects the income gap among provinces
Reflect provincial differences in earnings of those with no schooling and no labor-market experience
Avgdp and Ratio capture the provincial economic development stage and labor market structure
Return to schooling is affected by the development stage and labor market structure (Li 2003, Zhang et al., 2005, and Yang, 2005) 9 中国人力资本与劳动经济研究中心
China Center for Human Capital and Labor Market Research<br>
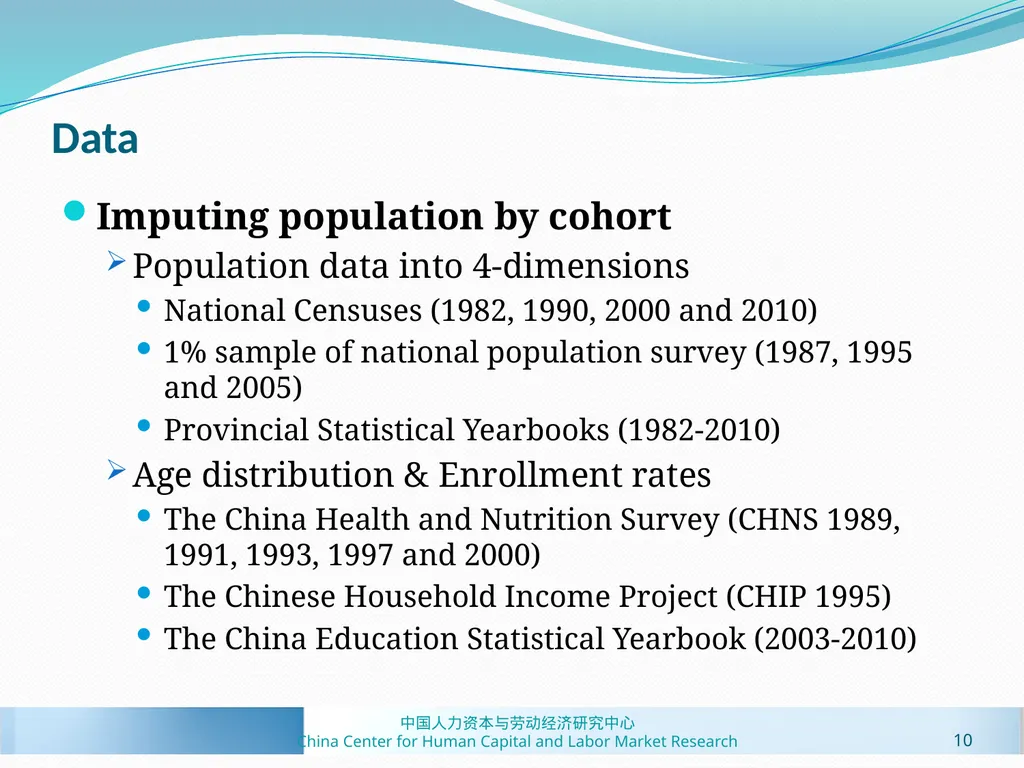
slide10. Data Imputing population by cohort
Population data into 4-dimensions
National Censuses (1982, 1990, 2000 and 2010)
1% sample of national population survey (1987, 1995 and 2005)
Provincial Statistical Yearbooks (1982-2010)
Age distribution & Enrollment rates
The China Health and Nutrition Survey (CHNS 1989, 1991, 1993, 1997 and 2000)
The Chinese Household Income Project (CHIP 1995)
The China Education Statistical Yearbook (2003-2010) 10 中国人力资本与劳动经济研究中心
China Center for Human Capital and Labor Market Research<br>
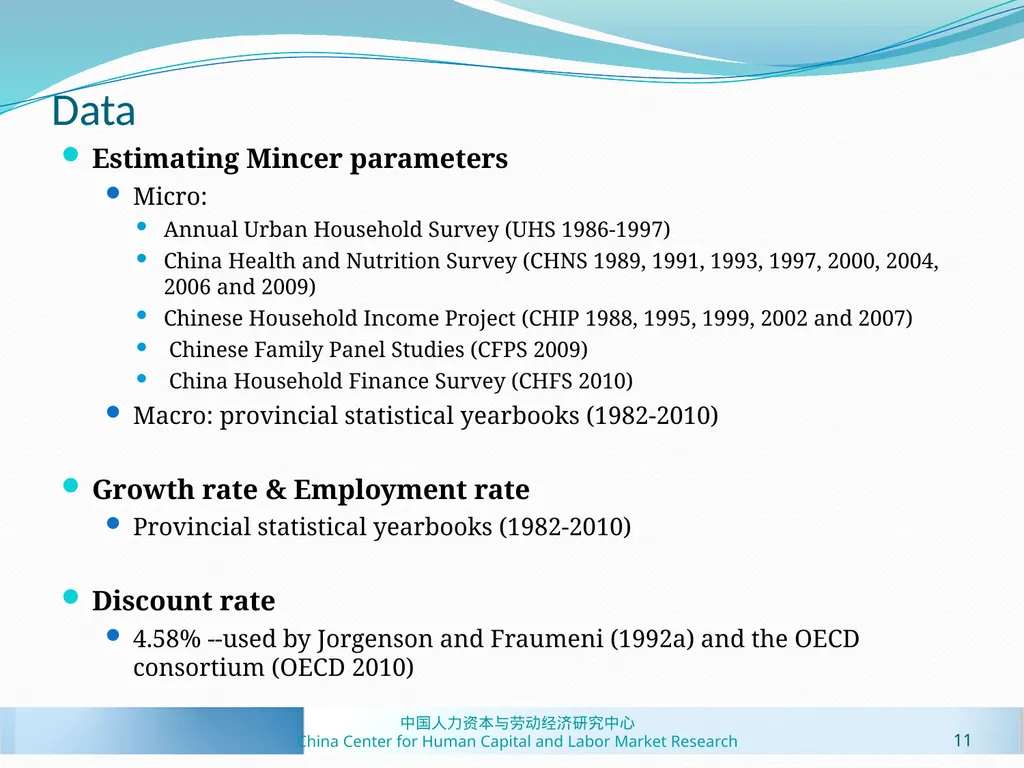
slide11. Data Estimating Mincer parameters
Micro:
Annual Urban Household Survey (UHS 1986-1997)
China Health and Nutrition Survey (CHNS 1989, 1991, 1993, 1997, 2000, 2004, 2006 and 2009)
Chinese Household Income Project (CHIP 1988, 1995, 1999, 2002 and 2007)
Chinese Family Panel Studies (CFPS 2009)
China Household Finance Survey (CHFS 2010)
Macro: provincial statistical yearbooks (1982-2010)
Growth rate & Employment rate
Provincial statistical yearbooks (1982-2010)
Discount rate
4.58% --used by Jorgenson and Fraumeni (1992a) and the OECD consortium (OECD 2010) 11 中国人力资本与劳动经济研究中心
China Center for Human Capital and Labor Market Research<br>
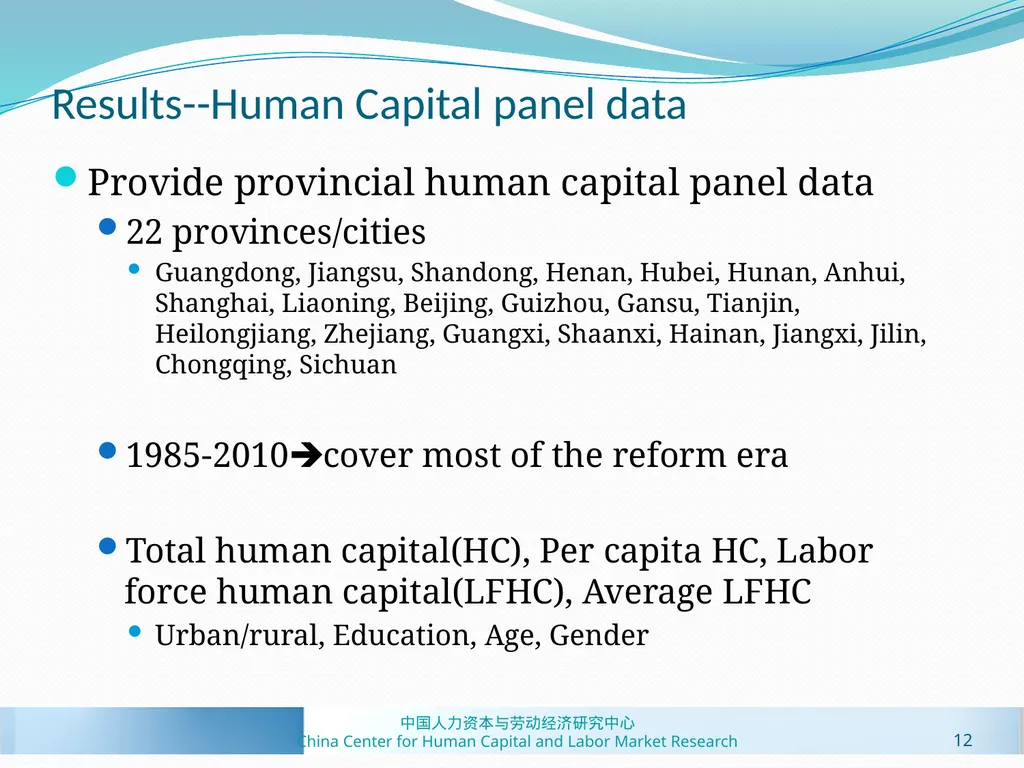
slide12. Results--Human Capital panel data Provide provincial human capital panel data
22 provinces/cities
Guangdong, Jiangsu, Shandong, Henan, Hubei, Hunan, Anhui, Shanghai, Liaoning, Beijing, Guizhou, Gansu, Tianjin, Heilongjiang, Zhejiang, Guangxi, Shaanxi, Hainan, Jiangxi, Jilin, Chongqing, Sichuan
1985-2010cover most of the reform era
Total human capital(HC), Per capita HC, Labor force human capital(LFHC), Average LFHC
Urban/rural, Education, Age, Gender 12 中国人力资本与劳动经济研究中心
China Center for Human Capital and Labor Market Research<br>
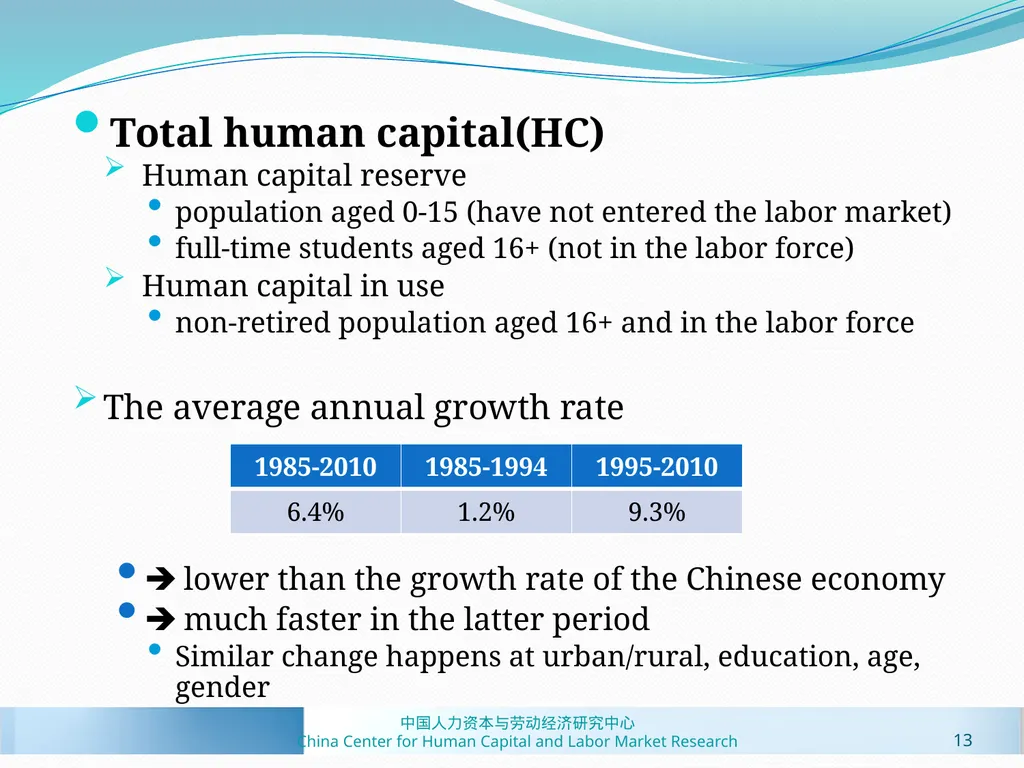
slide13. Total human capital(HC)
Human capital reserve
population aged 0-15 (have not entered the labor market)
full-time students aged 16+ (not in the labor force)
Human capital in use
non-retired population aged 16+ and in the labor force
The average annual growth rate
lower than the growth rate of the Chinese economy
much faster in the latter period
Similar change happens at urban/rural, education, age, gender 13 中国人力资本与劳动经济研究中心
China Center for Human Capital and Labor Market Research<br>
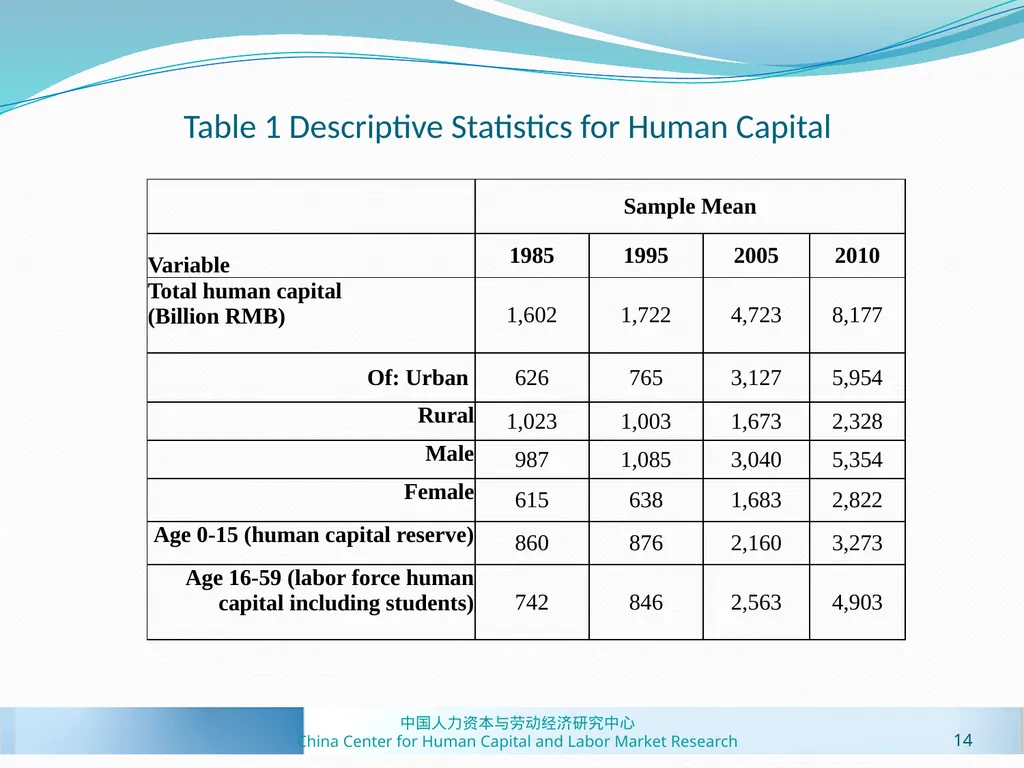
slide14. Table 1 Descriptive Statistics for Human Capital 14 中国人力资本与劳动经济研究中心
China Center for Human Capital and Labor Market Research<br>
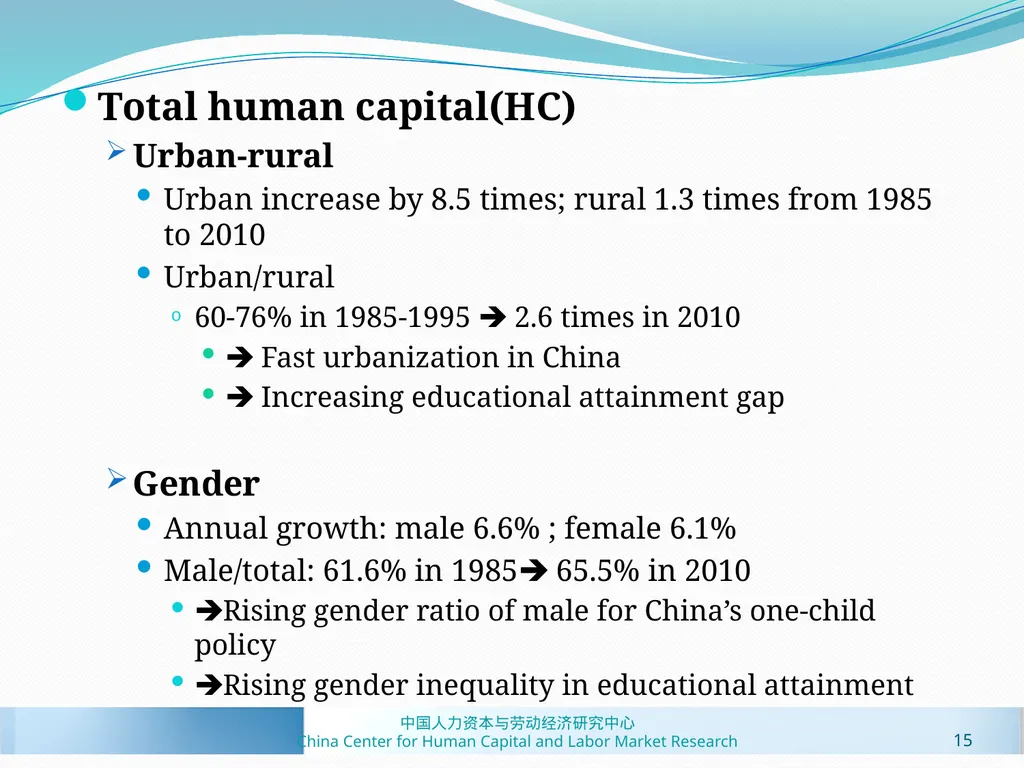
slide15. Total human capital(HC)
Urban-rural
Urban increase by 8.5 times; rural 1.3 times from 1985 to 2010
Urban/rural
60-76% in 1985-1995 2.6 times in 2010
Fast urbanization in China
Increasing educational attainment gap
Gender
Annual growth: male 6.6% ; female 6.1%
Male/total: 61.6% in 1985 65.5% in 2010
Rising gender ratio of male for China’s one-child policy
Rising gender inequality in educational attainment 15 中国人力资本与劳动经济研究中心
China Center for Human Capital and Labor Market Research<br>
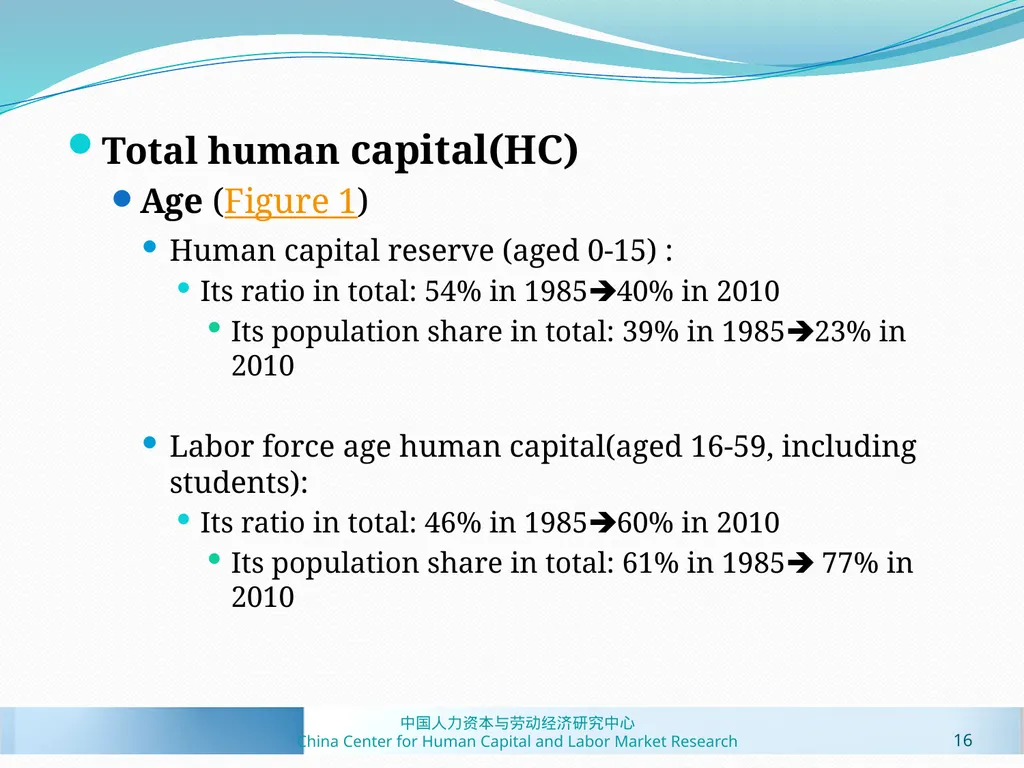
slide16. Total human capital(HC)
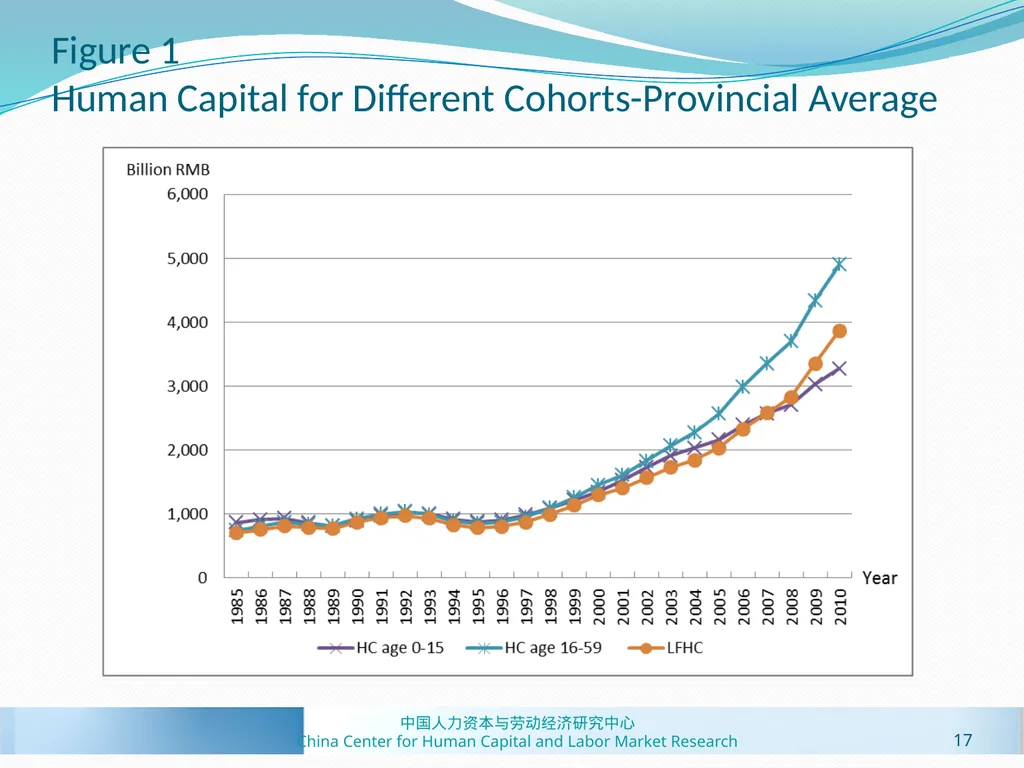
Age (Figure 1)
Human capital reserve (aged 0-15) :
Its ratio in total: 54% in 198540% in 2010
Its population share in total: 39% in 198523% in 2010
Labor force age human capital(aged 16-59, including students):
Its ratio in total: 46% in 198560% in 2010
Its population share in total: 61% in 1985 77% in 2010 16 中国人力资本与劳动经济研究中心
China Center for Human Capital and Labor Market Research<br>
slide17. Figure 1 Human Capital for Different Cohorts-Provincial Average 17 中国人力资本与劳动经济研究中心
China Center for Human Capital and Labor Market Research<br>
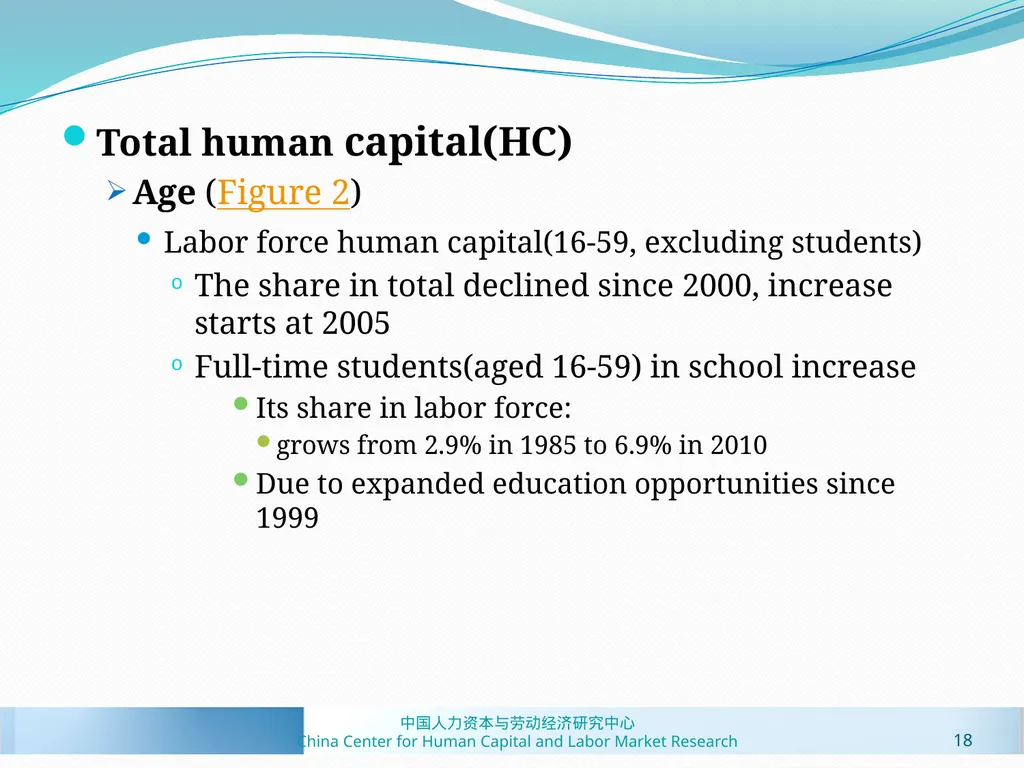
slide18. Total human capital(HC)
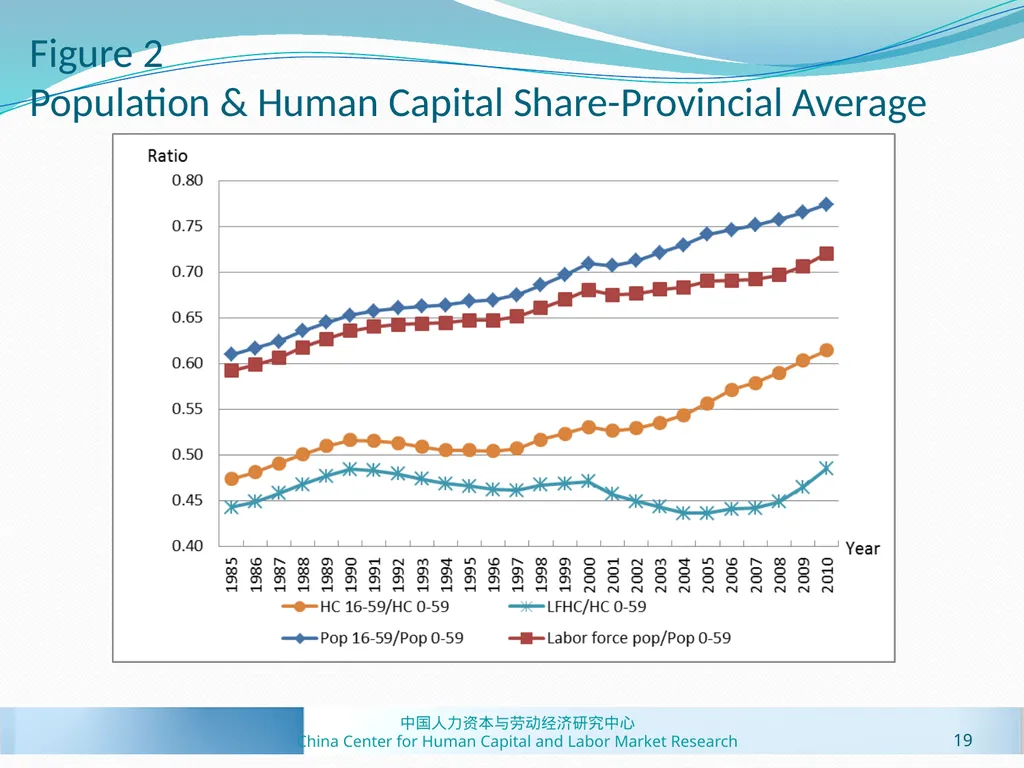
Age (Figure 2)
Labor force human capital(16-59, excluding students)
The share in total declined since 2000, increase starts at 2005
Full-time students(aged 16-59) in school increase
Its share in labor force:
grows from 2.9% in 1985 to 6.9% in 2010
Due to expanded education opportunities since 1999 18 中国人力资本与劳动经济研究中心
China Center for Human Capital and Labor Market Research<br>
slide19. Figure 2 Population & Human Capital Share-Provincial Average 19 中国人力资本与劳动经济研究中心
China Center for Human Capital and Labor Market Research<br>
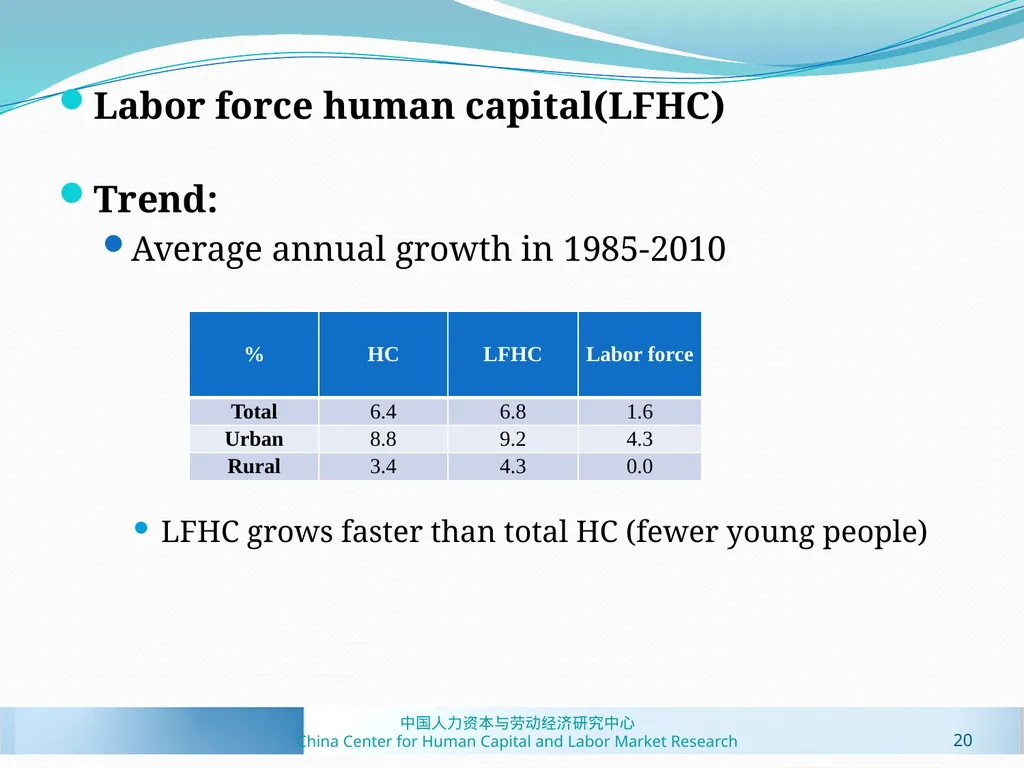
slide20. Labor force human capital(LFHC)
Trend:
Average annual growth in 1985-2010
LFHC grows faster than total HC (fewer young people) 20 中国人力资本与劳动经济研究中心
China Center for Human Capital and Labor Market Research<br>
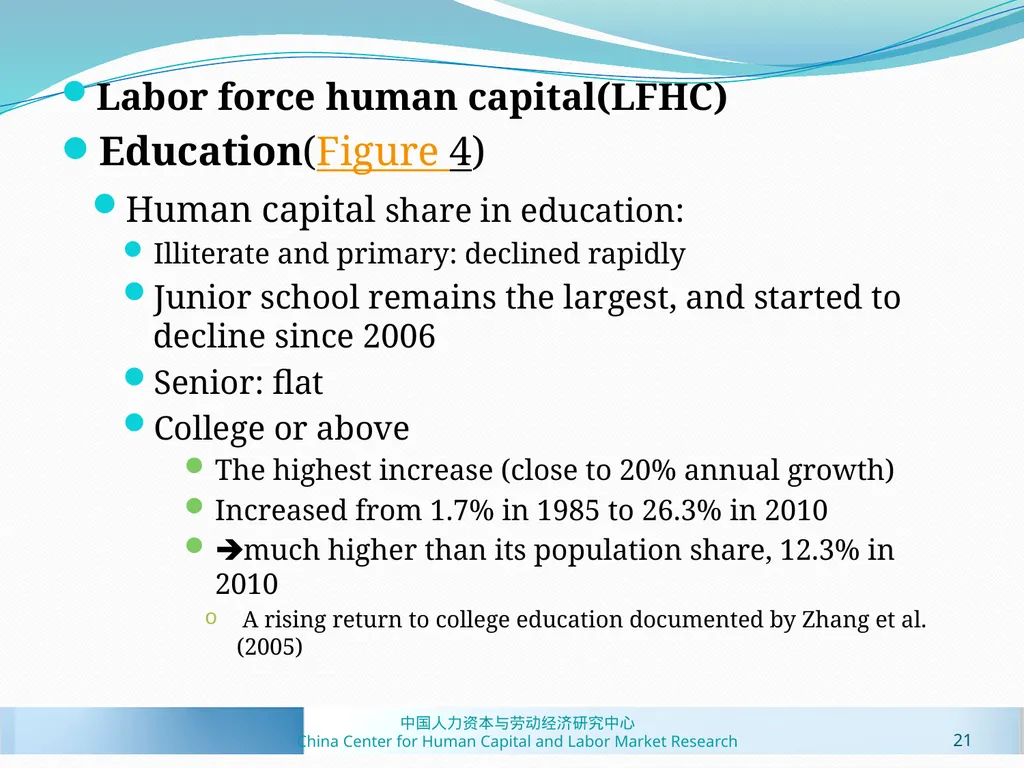
slide21. Labor force human capital(LFHC)
Education(Figure 4)
Human capital share in education:
Illiterate and primary: declined rapidly
Junior school remains the largest, and started to decline since 2006
Senior: flat
College or above
The highest increase (close to 20% annual growth)
Increased from 1.7% in 1985 to 26.3% in 2010
much higher than its population share, 12.3% in 2010
A rising return to college education documented by Zhang et al. (2005) 21 中国人力资本与劳动经济研究中心
China Center for Human Capital and Labor Market Research<br>
slide22. Figure 4 Education Share in Labor Force Human Capital (LFHC) 22 中国人力资本与劳动经济研究中心
China Center for Human Capital and Labor Market Research<br>
slide23. Per capita human capital (PCHC)
Measure of the intensity of human capital
Compare the annual average growth rates
Since 1995 they grew at a similar annual growth rate
Average annual growth rates of population
1.2% in 1985-1994; 0.6% in 1995-2010
much slower than the growth of HC
HC growth is not driven solely by population growth 23 中国人力资本与劳动经济研究中心
China Center for Human Capital and Labor Market Research<br>
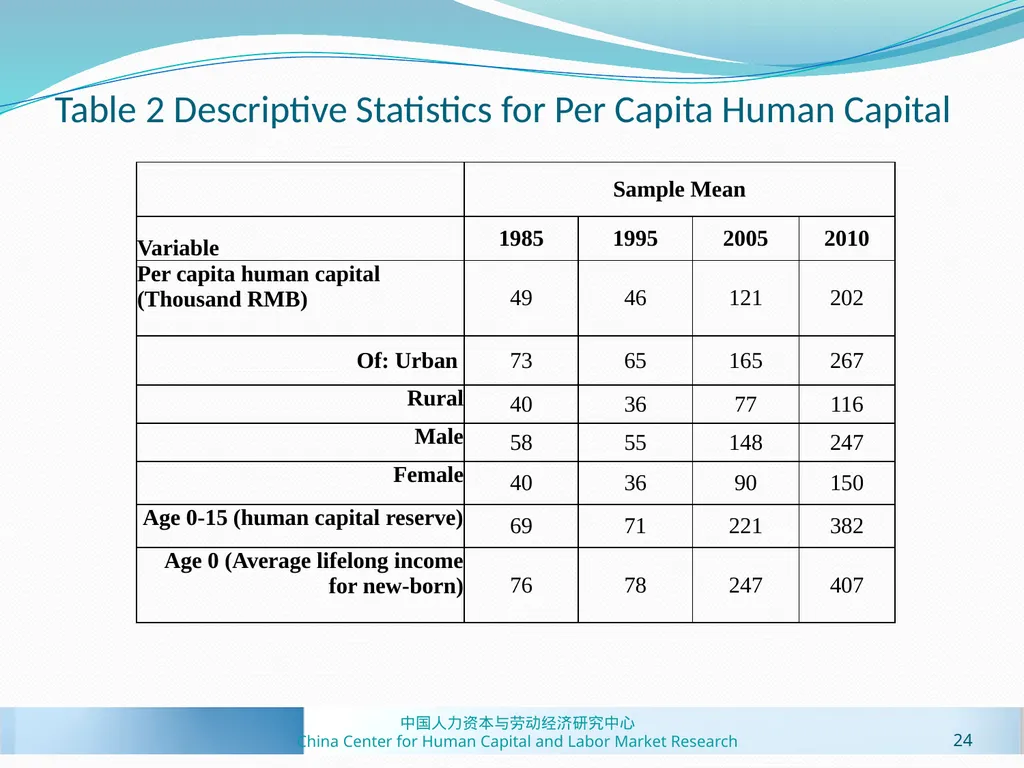
slide24. Table 2 Descriptive Statistics for Per Capita Human Capital 24 中国人力资本与劳动经济研究中心
China Center for Human Capital and Labor Market Research<br>
slide25. Per capita human capital (PCHC) (Table 2)
Urban/rural
Gap enlarged
Rural/Urban: 54% in 198543% in 2010
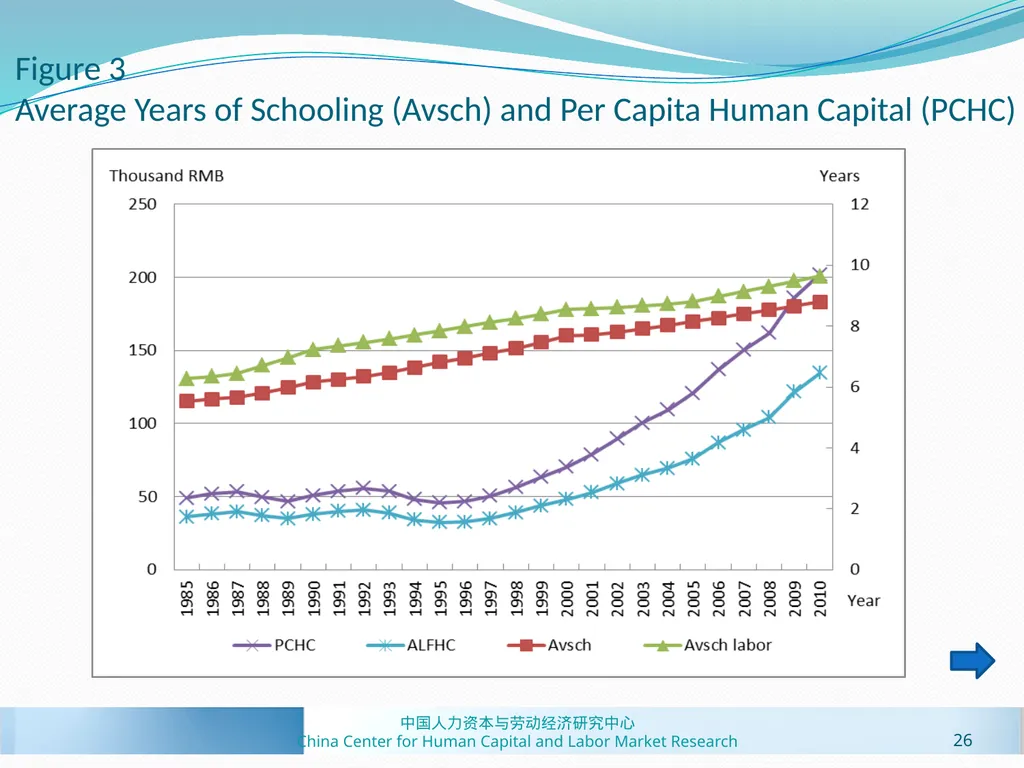
Education (Figure 3)
Average years of schooling
5.5 years in 1985 8.8 years in 2010
Gender
Female/male: 69% in 1985 61% in 2010
Age 0-15
Average annual growth
PCHC: 6.6%; Population: -1.5% 25 中国人力资本与劳动经济研究中心
China Center for Human Capital and Labor Market Research<br>
slide26. Figure 3 Average Years of Schooling (Avsch) and Per Capita Human Capital (PCHC) 26 中国人力资本与劳动经济研究中心
China Center for Human Capital and Labor Market Research<br>
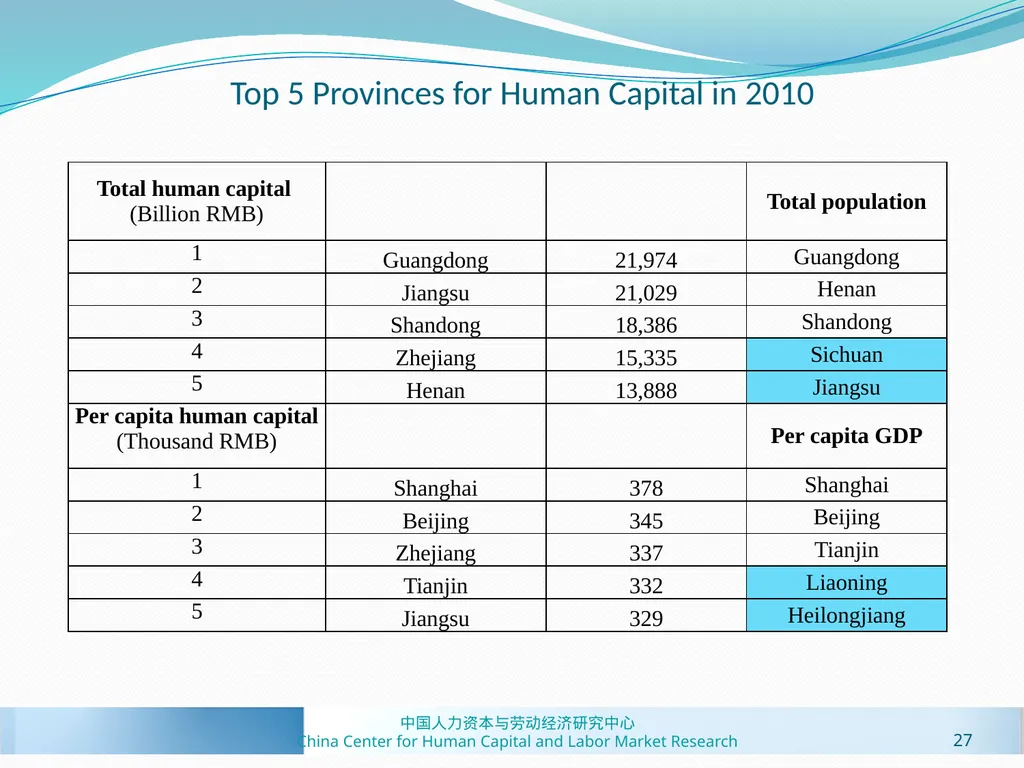
slide27. Top 5 Provinces for Human Capital in 2010 27 中国人力资本与劳动经济研究中心
China Center for Human Capital and Labor Market Research<br>
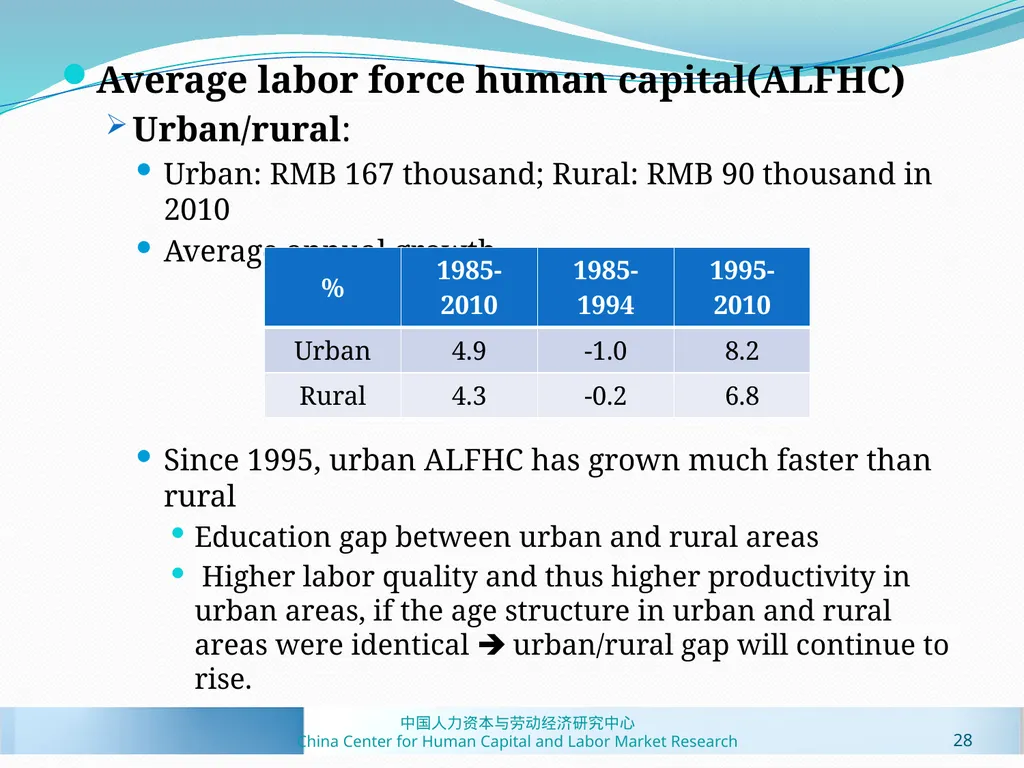
slide28. Average labor force human capital(ALFHC)
Urban/rural:
Urban: RMB 167 thousand; Rural: RMB 90 thousand in 2010
Average annual growth
Since 1995, urban ALFHC has grown much faster than rural
Education gap between urban and rural areas
Higher labor quality and thus higher productivity in urban areas, if the age structure in urban and rural areas were identical urban/rural gap will continue to rise. 28 中国人力资本与劳动经济研究中心
China Center for Human Capital and Labor Market Research<br>
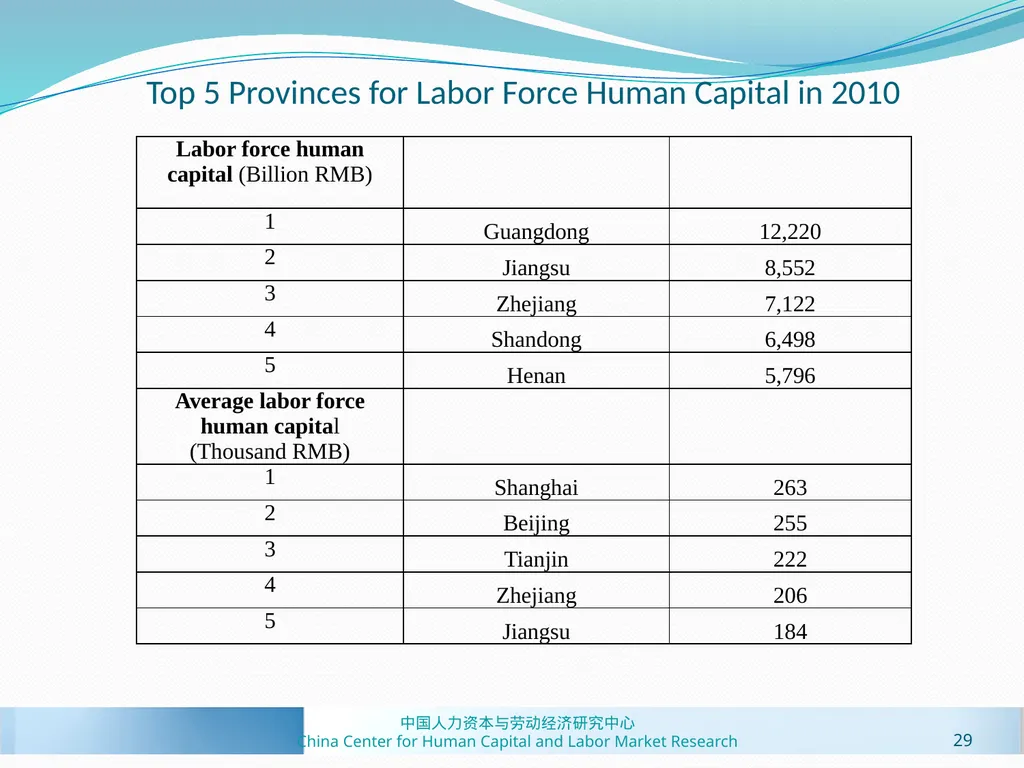
slide29. Top 5 Provinces for Labor Force Human Capital in 2010 29 中国人力资本与劳动经济研究中心
China Center for Human Capital and Labor Market Research<br>
slide30. Human capital as a measure of social development--beyond GDP measures “…beyond Gross Domestic Product…” measure of economic and social progress --Stiglitz Commission report
Expected average lifetime income for newborns rises rapidly
It Annual growth rate of 6.7% faster than PCHC (5.6%)
Provincial difference: 30 中国人力资本与劳动经济研究中心
China Center for Human Capital and Labor Market Research<br>
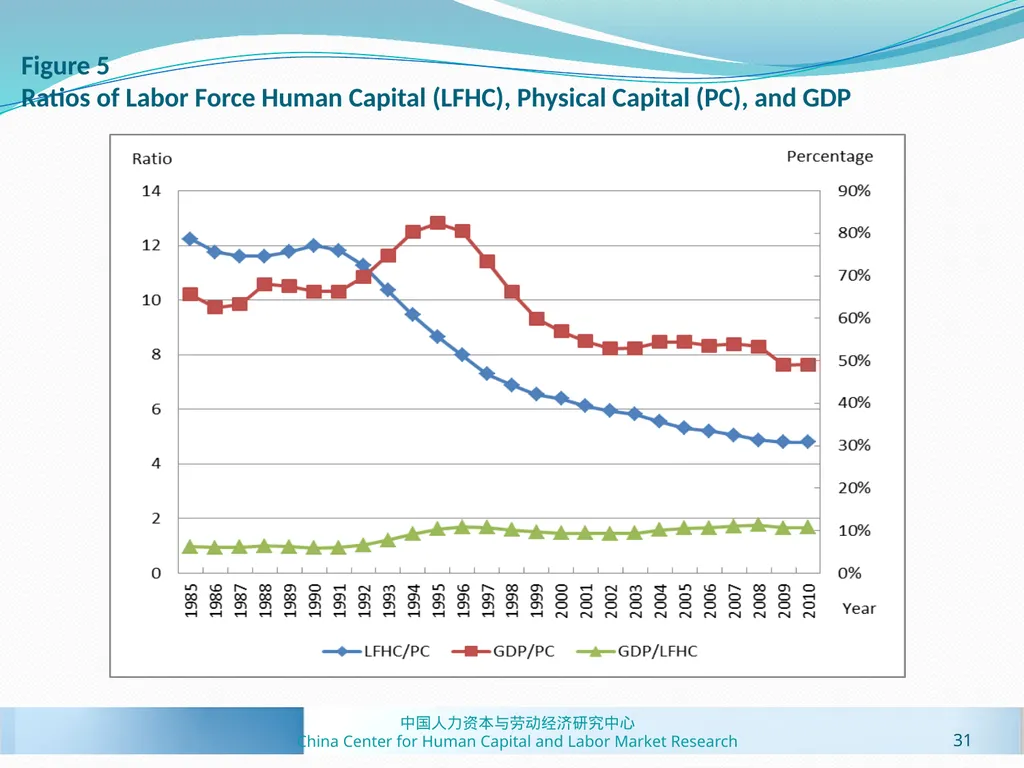
slide31. Figure 5 Ratios of Labor Force Human Capital (LFHC), Physical Capital (PC), and GDP 31 中国人力资本与劳动经济研究中心
China Center for Human Capital and Labor Market Research<br>
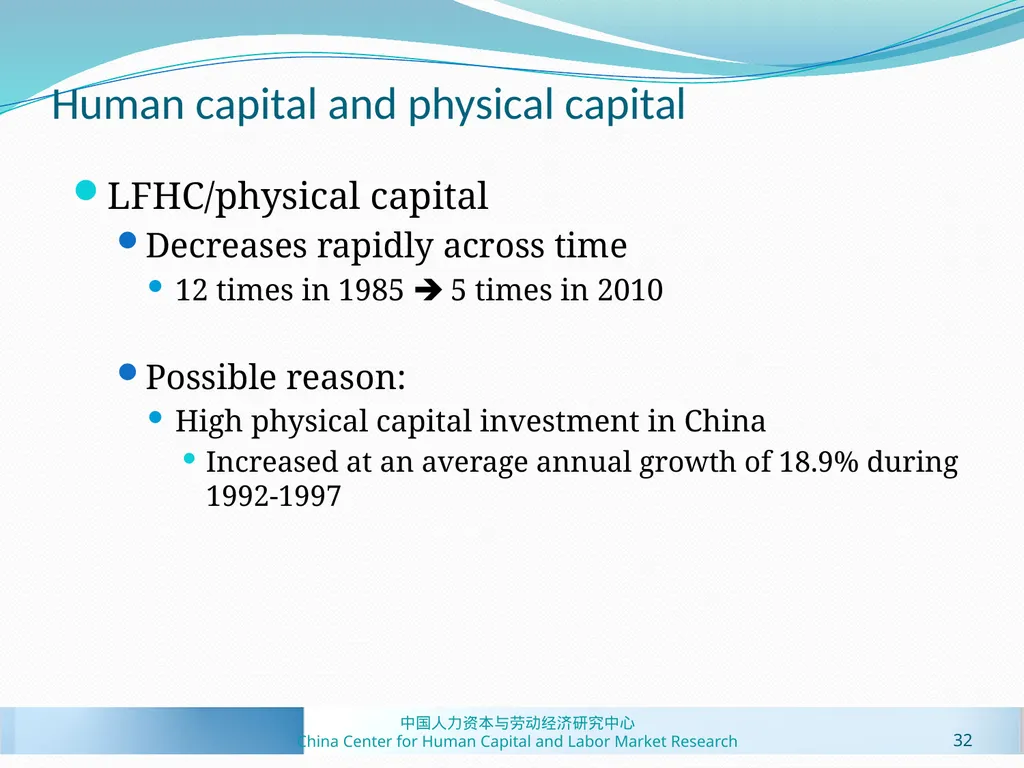
slide32. Human capital and physical capital LFHC/physical capital
Decreases rapidly across time
12 times in 1985 5 times in 2010
Possible reason:
High physical capital investment in China
Increased at an average annual growth of 18.9% during 1992-1997 32 中国人力资本与劳动经济研究中心
China Center for Human Capital and Labor Market Research<br>
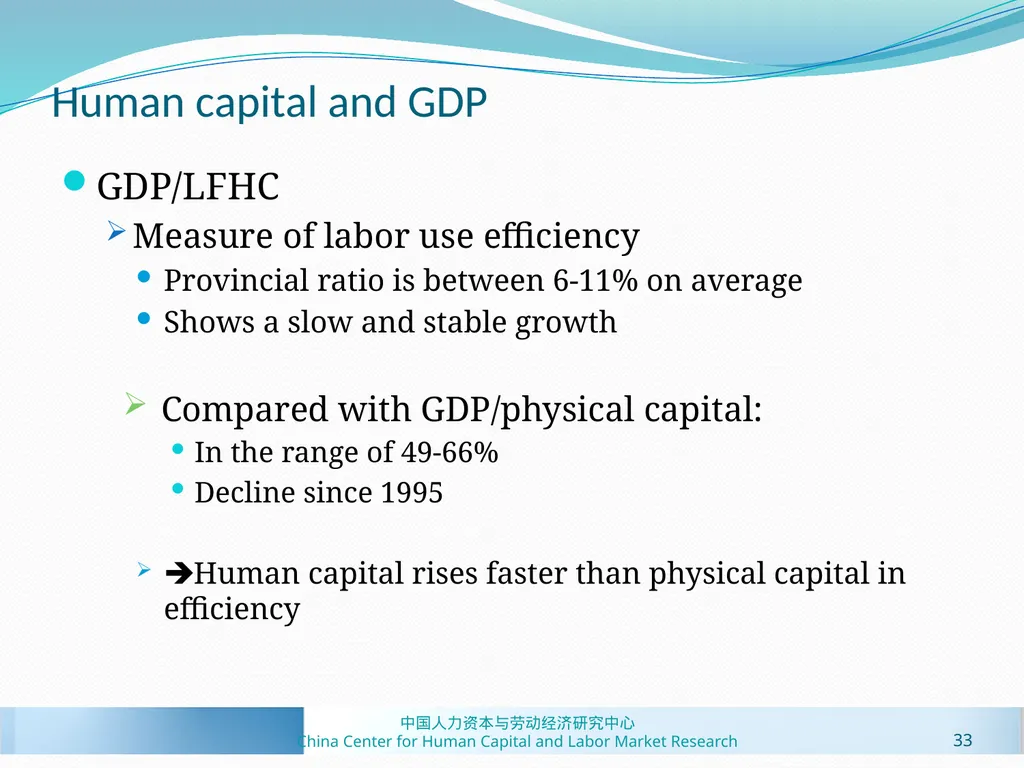
slide33. Human capital and GDP GDP/LFHC
Measure of labor use efficiency
Provincial ratio is between 6-11% on average
Shows a slow and stable growth
Compared with GDP/physical capital:
In the range of 49-66%
Decline since 1995
Human capital rises faster than physical capital in efficiency 33 中国人力资本与劳动经济研究中心
China Center for Human Capital and Labor Market Research<br>
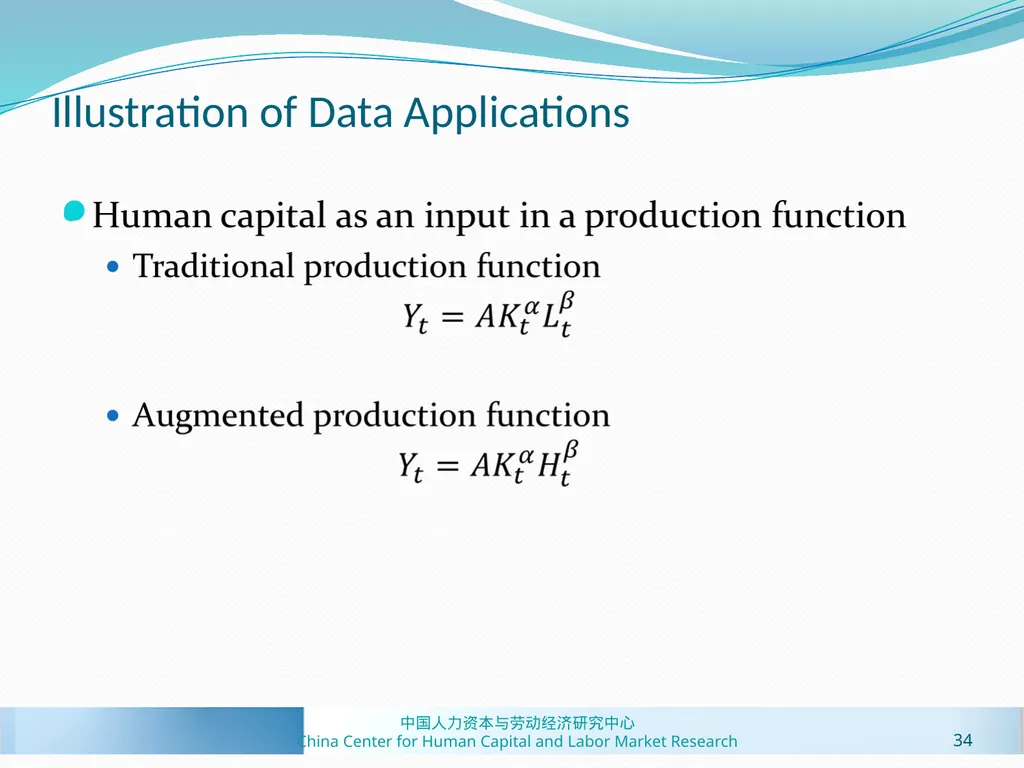
slide34. Illustration of Data Applications 34 中国人力资本与劳动经济研究中心
China Center for Human Capital and Labor Market Research<br>
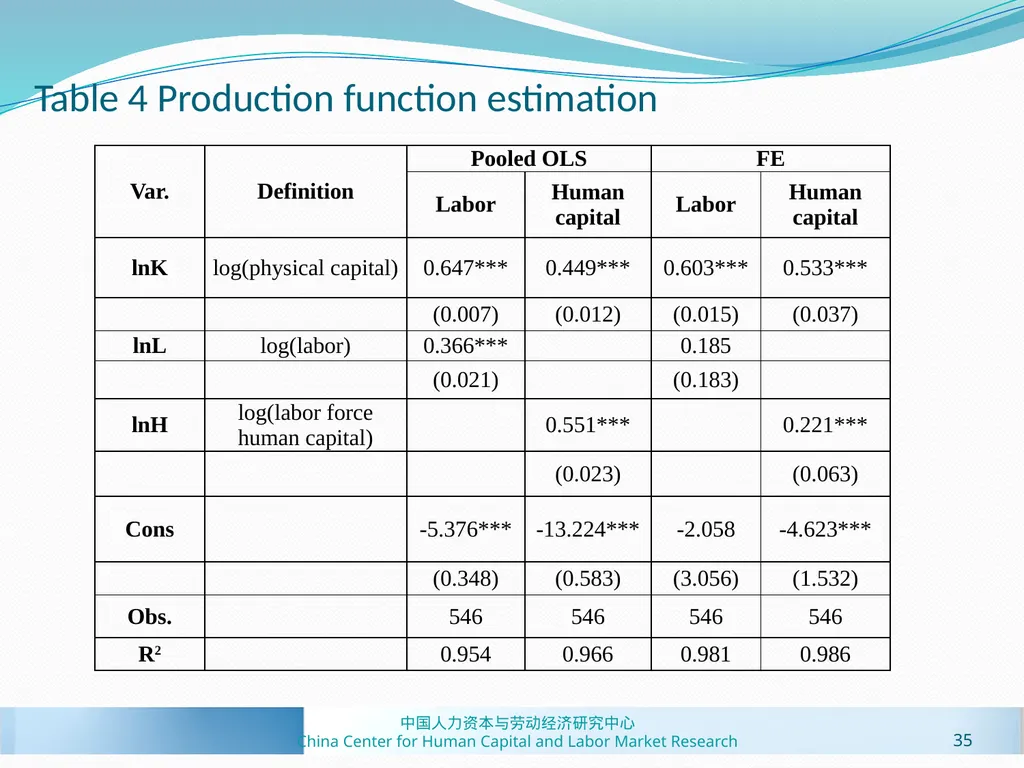
slide35. Table 4 Production function estimation 35 中国人力资本与劳动经济研究中心
China Center for Human Capital and Labor Market Research<br>
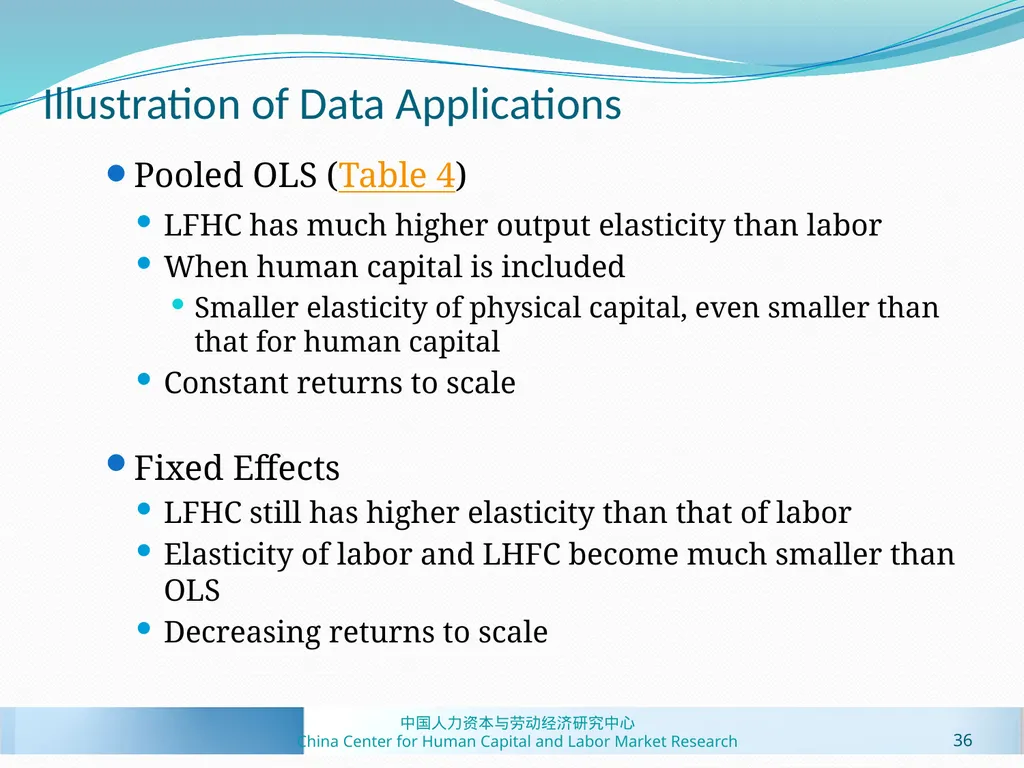
slide36. Illustration of Data Applications Pooled OLS (Table 4)
LFHC has much higher output elasticity than labor
When human capital is included
Smaller elasticity of physical capital, even smaller than that for human capital
Constant returns to scale
Fixed Effects
LFHC still has higher elasticity than that of labor
Elasticity of labor and LHFC become much smaller than OLS
Decreasing returns to scale 36 中国人力资本与劳动经济研究中心
China Center for Human Capital and Labor Market Research<br>
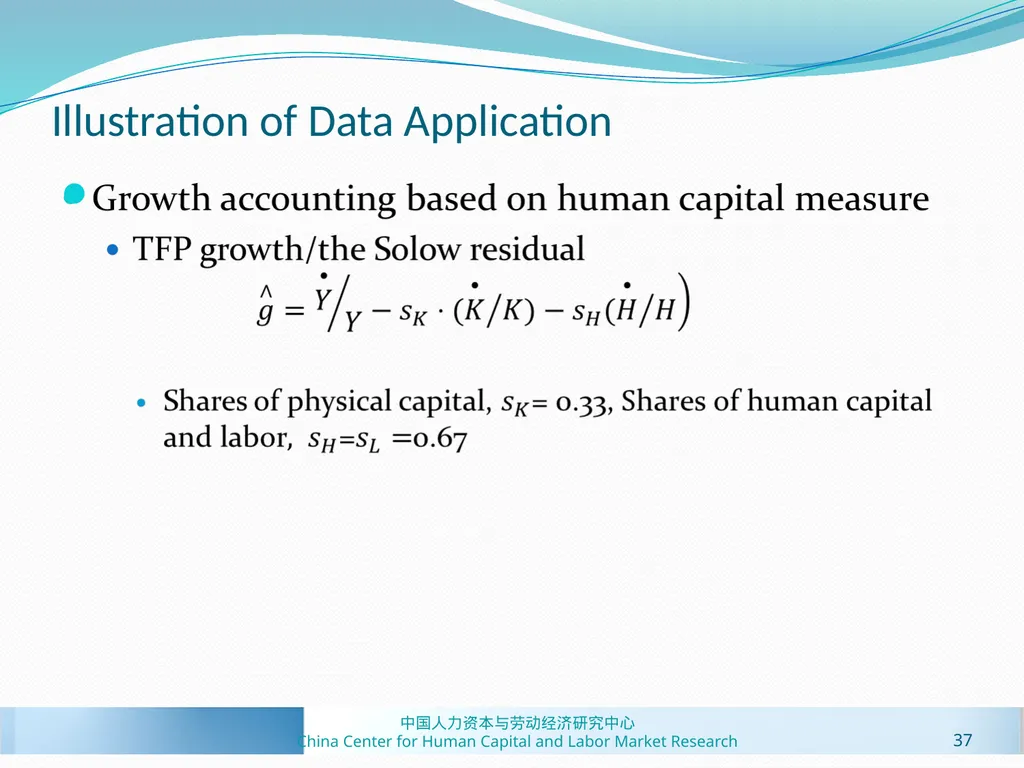
slide37. Illustration of Data Application 37 中国人力资本与劳动经济研究中心
China Center for Human Capital and Labor Market Research<br>
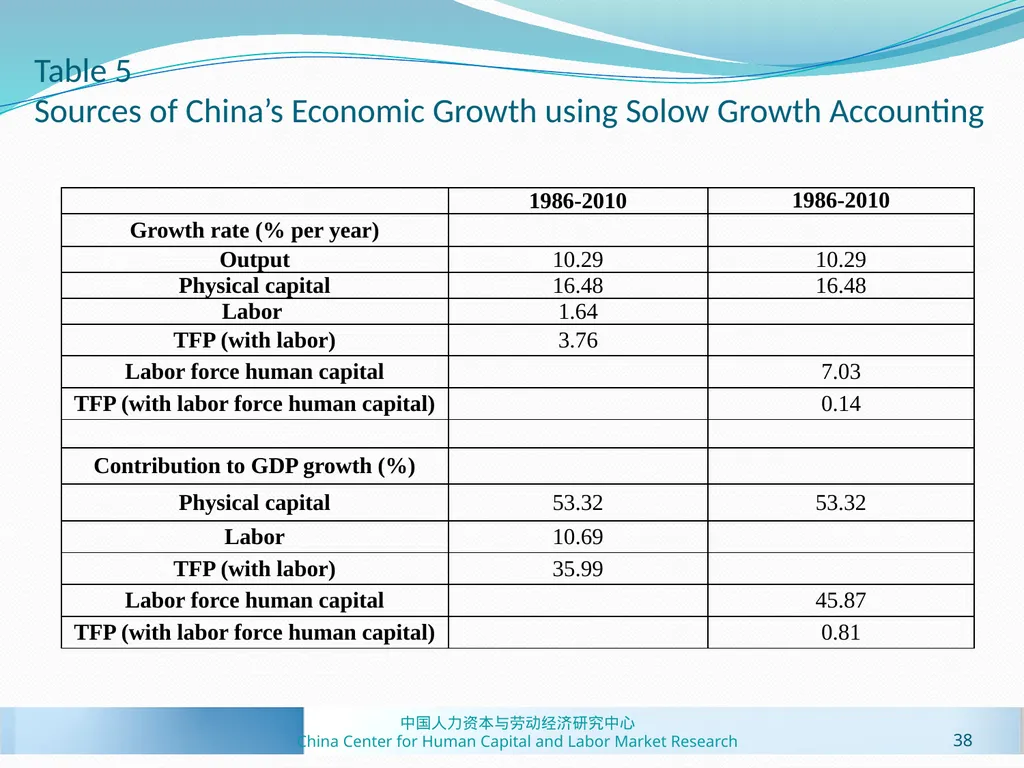
slide38. Table 5 Sources of China’s Economic Growth using Solow Growth Accounting 38 中国人力资本与劳动经济研究中心
China Center for Human Capital and Labor Market Research<br>
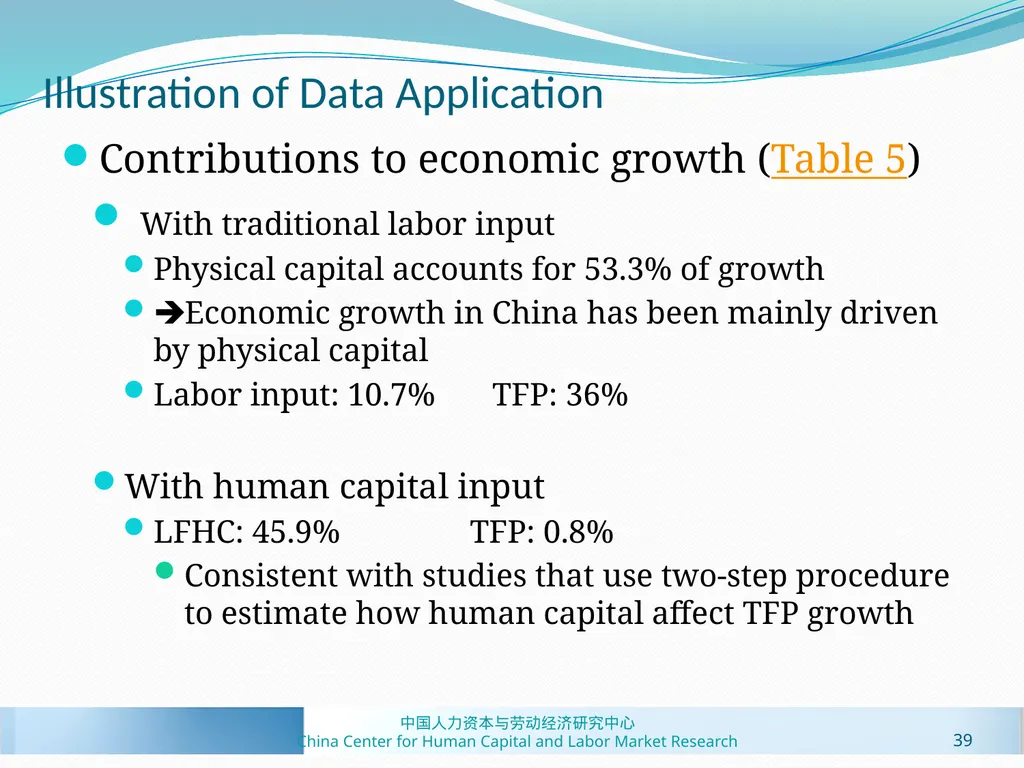
slide39. Illustration of Data Application Contributions to economic growth (Table 5)
With traditional labor input
Physical capital accounts for 53.3% of growth
Economic growth in China has been mainly driven by physical capital
Labor input: 10.7% TFP: 36%
With human capital input
LFHC: 45.9% TFP: 0.8%
Consistent with studies that use two-step procedure to estimate how human capital affect TFP growth 39 中国人力资本与劳动经济研究中心
China Center for Human Capital and Labor Market Research<br>
slide40. Summary The data provide very rich information in studying China’s human capital
A comprehensive picture of China’s human capital distribution and dynamics
Demonstrations of applications of the new data
Estimating a production function
Conducting the growth decomposition exercise using the data
Compared the results with the traditional estimation based on labor inputs
The new panel data on China’s provincial human capital are quite reliable; and should be a valuable new resource for related studies and policy analysis 40 中国人力资本与劳动经济研究中心
China Center for Human Capital and Labor Market Research<br>
slide41. Questions? 41<br>
School of Economics
Georgia Institute of Technology
Email: haizheng.li@econ.gatech.edu
Qinyi Liu
School of Economics and Trade
Hunan University
Bo Li
China Center for Human Capital and Labor Market Research
Central University of Finance and Economics
Barbara Fraumeni
Muskie School of Public Service
University of Southern Maine
Xiaobei Zhang
School of Economics
Zhejiang University of Finance and Economics 中国人力资本与劳动经济研究中心
China Center for Human Capital and Labor Market Research<br>
slide2. Human capital “The knowledge, skills, competencies and attributes embodied in individuals that facilitate the creation of personal, social and economic well-being”
--OECD, 2001
Importance of Human Capital
A central determinant of economic growth
Significant contributions to 30 years’ economic growth in China
Enhances the ability in
Developing technological innovations
Adapting and implementing technologies developed
Reduce poverty and inequality 2 中国人力资本与劳动经济研究中心
China Center for Human Capital and Labor Market Research<br>
slide3. Human capital Importance of Human Capital Measurement
Trace the distribution and dynamics of human capital
Aid empirical studies and policy analysis
Promote the creation of human capital satellite account 3 中国人力资本与劳动经济研究中心
China Center for Human Capital and Labor Market Research<br>
slide4. Human capital measurement Challenges
The unique characteristics make it difficult to estimate its value
Partial measurements like education are commonly used
Lack of data existing method cannot be applied to China
Arduous work for data collection, processing and calculation, especially at provincial level
Empirical researches desire panel data of human capital
Panel data of comprehensive measures of human capital at a state or province level are lacking for most countries including China 4 中国人力资本与劳动经济研究中心
China Center for Human Capital and Labor Market Research<br>
slide5. Research team and sponsors Research Team (starting in 2008)
China Center for Human Capital and Labor Market Research (CHLR) special-term faculty, full-time faculty, doctoral and Master’s student, and staff
Sponsors
National Natural Science Foundation of China
Central University of Finance and Economics 5 中国人力资本与劳动经济研究中心
China Center for Human Capital and Labor Market Research<br>
slide6. Methodology Jorgenson-Fraumeni Lifetime Income-based Approach
Include all aspects of human capital services measured by market value
Widely used in measuring a nation’s total human capital stock
Argentina (Coremberg, 2010), Australia (Wei, 2007, 2008), Canada (Gu and Wong, 2009), India (Gundimeda et al., 2007), New Zealand (Le, Gibson, and Oxley, 2005), Norway (Liu and Greaker, 2009), Sweden (Ahlroth, Bjorkland, and Forslund, 1997), United Kingdom (O’Mahony and Stevens, 2004 and Jones and Chirpanhura, 2010), and the United States (Christian, 2010)
The OECD human capital consortium
OECD, 2010; Mira and Liu, 2010; Liu, 2011
China’s national level human capital
Li et al., 2010; Li, Liang et al., 2013 6 中国人力资本与劳动经济研究中心
China Center for Human Capital and Labor Market Research<br>
slide7. Methodology Jorgenson-Fraumeni lifetime income-based approach
Calculate human capital stock for each individual as the estimated present value of expected future lifetime earnings
Backward recursive estimation beginning with the oldest covered age
Divide life cycle into five stages
Retirement, Work-only, Work-school, School-only, Pre-school
Modifications
Incorporate the Mincer model (National level)
Expand Mincer model to include macro-variables (Provincial level)
Derive total human capital stock separated by urban and rural in estimation
Adjustment for cross-province comparison with a living cost adjustment index 7 中国人力资本与劳动经济研究中心
China Center for Human Capital and Labor Market Research<br>
slide8. Augmented Mincer model Lack of data in China
use the Mincer model to estimate earnings
Extended model for earnings in provinces
ln(inc)= β0 + β1 · ln(Avwage)+ β2 · Sch+ β3 · Sch · Avgdp+ β4 · Sch · Ratio+ β5 · Exp+ β6 · Exp2 +u
ln(inc): the logarithm of earnings
Sch: years of schooling
Exp: years of work experience
Avwage: average wage of a province
Avgdp: provincial GDP per capita
Ratio: provincial primary industry employment proportion of the total labor force
u: random error 8 中国人力资本与劳动经济研究中心
China Center for Human Capital and Labor Market Research<br>
slide9. Augmented Mincer model Extended model
Avwage reflects the income gap among provinces
Reflect provincial differences in earnings of those with no schooling and no labor-market experience
Avgdp and Ratio capture the provincial economic development stage and labor market structure
Return to schooling is affected by the development stage and labor market structure (Li 2003, Zhang et al., 2005, and Yang, 2005) 9 中国人力资本与劳动经济研究中心
China Center for Human Capital and Labor Market Research<br>
slide10. Data Imputing population by cohort
Population data into 4-dimensions
National Censuses (1982, 1990, 2000 and 2010)
1% sample of national population survey (1987, 1995 and 2005)
Provincial Statistical Yearbooks (1982-2010)
Age distribution & Enrollment rates
The China Health and Nutrition Survey (CHNS 1989, 1991, 1993, 1997 and 2000)
The Chinese Household Income Project (CHIP 1995)
The China Education Statistical Yearbook (2003-2010) 10 中国人力资本与劳动经济研究中心
China Center for Human Capital and Labor Market Research<br>
slide11. Data Estimating Mincer parameters
Micro:
Annual Urban Household Survey (UHS 1986-1997)
China Health and Nutrition Survey (CHNS 1989, 1991, 1993, 1997, 2000, 2004, 2006 and 2009)
Chinese Household Income Project (CHIP 1988, 1995, 1999, 2002 and 2007)
Chinese Family Panel Studies (CFPS 2009)
China Household Finance Survey (CHFS 2010)
Macro: provincial statistical yearbooks (1982-2010)
Growth rate & Employment rate
Provincial statistical yearbooks (1982-2010)
Discount rate
4.58% --used by Jorgenson and Fraumeni (1992a) and the OECD consortium (OECD 2010) 11 中国人力资本与劳动经济研究中心
China Center for Human Capital and Labor Market Research<br>
slide12. Results--Human Capital panel data Provide provincial human capital panel data
22 provinces/cities
Guangdong, Jiangsu, Shandong, Henan, Hubei, Hunan, Anhui, Shanghai, Liaoning, Beijing, Guizhou, Gansu, Tianjin, Heilongjiang, Zhejiang, Guangxi, Shaanxi, Hainan, Jiangxi, Jilin, Chongqing, Sichuan
1985-2010cover most of the reform era
Total human capital(HC), Per capita HC, Labor force human capital(LFHC), Average LFHC
Urban/rural, Education, Age, Gender 12 中国人力资本与劳动经济研究中心
China Center for Human Capital and Labor Market Research<br>
slide13. Total human capital(HC)
Human capital reserve
population aged 0-15 (have not entered the labor market)
full-time students aged 16+ (not in the labor force)
Human capital in use
non-retired population aged 16+ and in the labor force
The average annual growth rate
lower than the growth rate of the Chinese economy
much faster in the latter period
Similar change happens at urban/rural, education, age, gender 13 中国人力资本与劳动经济研究中心
China Center for Human Capital and Labor Market Research<br>
slide14. Table 1 Descriptive Statistics for Human Capital 14 中国人力资本与劳动经济研究中心
China Center for Human Capital and Labor Market Research<br>
slide15. Total human capital(HC)
Urban-rural
Urban increase by 8.5 times; rural 1.3 times from 1985 to 2010
Urban/rural
60-76% in 1985-1995 2.6 times in 2010
Fast urbanization in China
Increasing educational attainment gap
Gender
Annual growth: male 6.6% ; female 6.1%
Male/total: 61.6% in 1985 65.5% in 2010
Rising gender ratio of male for China’s one-child policy
Rising gender inequality in educational attainment 15 中国人力资本与劳动经济研究中心
China Center for Human Capital and Labor Market Research<br>
slide16. Total human capital(HC)
Age (Figure 1)
Human capital reserve (aged 0-15) :
Its ratio in total: 54% in 198540% in 2010
Its population share in total: 39% in 198523% in 2010
Labor force age human capital(aged 16-59, including students):
Its ratio in total: 46% in 198560% in 2010
Its population share in total: 61% in 1985 77% in 2010 16 中国人力资本与劳动经济研究中心
China Center for Human Capital and Labor Market Research<br>
slide17. Figure 1 Human Capital for Different Cohorts-Provincial Average 17 中国人力资本与劳动经济研究中心
China Center for Human Capital and Labor Market Research<br>
slide18. Total human capital(HC)
Age (Figure 2)
Labor force human capital(16-59, excluding students)
The share in total declined since 2000, increase starts at 2005
Full-time students(aged 16-59) in school increase
Its share in labor force:
grows from 2.9% in 1985 to 6.9% in 2010
Due to expanded education opportunities since 1999 18 中国人力资本与劳动经济研究中心
China Center for Human Capital and Labor Market Research<br>
slide19. Figure 2 Population & Human Capital Share-Provincial Average 19 中国人力资本与劳动经济研究中心
China Center for Human Capital and Labor Market Research<br>
slide20. Labor force human capital(LFHC)
Trend:
Average annual growth in 1985-2010
LFHC grows faster than total HC (fewer young people) 20 中国人力资本与劳动经济研究中心
China Center for Human Capital and Labor Market Research<br>
slide21. Labor force human capital(LFHC)
Education(Figure 4)
Human capital share in education:
Illiterate and primary: declined rapidly
Junior school remains the largest, and started to decline since 2006
Senior: flat
College or above
The highest increase (close to 20% annual growth)
Increased from 1.7% in 1985 to 26.3% in 2010
much higher than its population share, 12.3% in 2010
A rising return to college education documented by Zhang et al. (2005) 21 中国人力资本与劳动经济研究中心
China Center for Human Capital and Labor Market Research<br>
slide22. Figure 4 Education Share in Labor Force Human Capital (LFHC) 22 中国人力资本与劳动经济研究中心
China Center for Human Capital and Labor Market Research<br>
slide23. Per capita human capital (PCHC)
Measure of the intensity of human capital
Compare the annual average growth rates
Since 1995 they grew at a similar annual growth rate
Average annual growth rates of population
1.2% in 1985-1994; 0.6% in 1995-2010
much slower than the growth of HC
HC growth is not driven solely by population growth 23 中国人力资本与劳动经济研究中心
China Center for Human Capital and Labor Market Research<br>
slide24. Table 2 Descriptive Statistics for Per Capita Human Capital 24 中国人力资本与劳动经济研究中心
China Center for Human Capital and Labor Market Research<br>
slide25. Per capita human capital (PCHC) (Table 2)
Urban/rural
Gap enlarged
Rural/Urban: 54% in 198543% in 2010
Education (Figure 3)
Average years of schooling
5.5 years in 1985 8.8 years in 2010
Gender
Female/male: 69% in 1985 61% in 2010
Age 0-15
Average annual growth
PCHC: 6.6%; Population: -1.5% 25 中国人力资本与劳动经济研究中心
China Center for Human Capital and Labor Market Research<br>
slide26. Figure 3 Average Years of Schooling (Avsch) and Per Capita Human Capital (PCHC) 26 中国人力资本与劳动经济研究中心
China Center for Human Capital and Labor Market Research<br>
slide27. Top 5 Provinces for Human Capital in 2010 27 中国人力资本与劳动经济研究中心
China Center for Human Capital and Labor Market Research<br>
slide28. Average labor force human capital(ALFHC)
Urban/rural:
Urban: RMB 167 thousand; Rural: RMB 90 thousand in 2010
Average annual growth
Since 1995, urban ALFHC has grown much faster than rural
Education gap between urban and rural areas
Higher labor quality and thus higher productivity in urban areas, if the age structure in urban and rural areas were identical urban/rural gap will continue to rise. 28 中国人力资本与劳动经济研究中心
China Center for Human Capital and Labor Market Research<br>
slide29. Top 5 Provinces for Labor Force Human Capital in 2010 29 中国人力资本与劳动经济研究中心
China Center for Human Capital and Labor Market Research<br>
slide30. Human capital as a measure of social development--beyond GDP measures “…beyond Gross Domestic Product…” measure of economic and social progress --Stiglitz Commission report
Expected average lifetime income for newborns rises rapidly
It Annual growth rate of 6.7% faster than PCHC (5.6%)
Provincial difference: 30 中国人力资本与劳动经济研究中心
China Center for Human Capital and Labor Market Research<br>
slide31. Figure 5 Ratios of Labor Force Human Capital (LFHC), Physical Capital (PC), and GDP 31 中国人力资本与劳动经济研究中心
China Center for Human Capital and Labor Market Research<br>
slide32. Human capital and physical capital LFHC/physical capital
Decreases rapidly across time
12 times in 1985 5 times in 2010
Possible reason:
High physical capital investment in China
Increased at an average annual growth of 18.9% during 1992-1997 32 中国人力资本与劳动经济研究中心
China Center for Human Capital and Labor Market Research<br>
slide33. Human capital and GDP GDP/LFHC
Measure of labor use efficiency
Provincial ratio is between 6-11% on average
Shows a slow and stable growth
Compared with GDP/physical capital:
In the range of 49-66%
Decline since 1995
Human capital rises faster than physical capital in efficiency 33 中国人力资本与劳动经济研究中心
China Center for Human Capital and Labor Market Research<br>
slide34. Illustration of Data Applications 34 中国人力资本与劳动经济研究中心
China Center for Human Capital and Labor Market Research<br>
slide35. Table 4 Production function estimation 35 中国人力资本与劳动经济研究中心
China Center for Human Capital and Labor Market Research<br>
slide36. Illustration of Data Applications Pooled OLS (Table 4)
LFHC has much higher output elasticity than labor
When human capital is included
Smaller elasticity of physical capital, even smaller than that for human capital
Constant returns to scale
Fixed Effects
LFHC still has higher elasticity than that of labor
Elasticity of labor and LHFC become much smaller than OLS
Decreasing returns to scale 36 中国人力资本与劳动经济研究中心
China Center for Human Capital and Labor Market Research<br>
slide37. Illustration of Data Application 37 中国人力资本与劳动经济研究中心
China Center for Human Capital and Labor Market Research<br>
slide38. Table 5 Sources of China’s Economic Growth using Solow Growth Accounting 38 中国人力资本与劳动经济研究中心
China Center for Human Capital and Labor Market Research<br>
slide39. Illustration of Data Application Contributions to economic growth (Table 5)
With traditional labor input
Physical capital accounts for 53.3% of growth
Economic growth in China has been mainly driven by physical capital
Labor input: 10.7% TFP: 36%
With human capital input
LFHC: 45.9% TFP: 0.8%
Consistent with studies that use two-step procedure to estimate how human capital affect TFP growth 39 中国人力资本与劳动经济研究中心
China Center for Human Capital and Labor Market Research<br>
slide40. Summary The data provide very rich information in studying China’s human capital
A comprehensive picture of China’s human capital distribution and dynamics
Demonstrations of applications of the new data
Estimating a production function
Conducting the growth decomposition exercise using the data
Compared the results with the traditional estimation based on labor inputs
The new panel data on China’s provincial human capital are quite reliable; and should be a valuable new resource for related studies and policy analysis 40 中国人力资本与劳动经济研究中心
China Center for Human Capital and Labor Market Research<br>
slide41. Questions? 41<br>