
Human Resource Accounting for Training &
LS
Published · 61 slides · 0 views
1 / 1






Description
Human Resource Accounting for Training Development Shital Jhunjhunwala Institute of Public Enterprise Dr. Shital Jhunjhunwala 2 The Importance of Human Capital 3 most important assets of my company walk out of the door every night. Bill
Related Topics
Share
Embed code
Download this presentation From Below
"Human Resource Accounting for Training &" is the property of its rightful owner. Permission is granted to download and print the materials on this website for personal, non-commercial use only, and to display it on your personal computer provided you do not modify the materials and that you retain all copyright notices contained in the materials. By downloading content from our website, you accept the terms of this agreement.
Presentation Transcript
01
Human Resource Accounting for
Training & Development Shital Jhunjhunwala
Institute of Public Enterprise<br>
Training & Development Shital Jhunjhunwala
Institute of Public Enterprise<br>
02
Dr. Shital Jhunjhunwala 2 The Importance of Human Capital<br>
03
3 “most important assets of my company walk out of the door every night”.
Bill Gates, Microsoft<br>
Bill Gates, Microsoft<br>
04
Dr. Shital Jhunjhunwala 5 The unquestionable Importance of HR …….<br>
05
Myth
“ROI from human capital cannot be
measured! I am just going to treat it as a
short term cost, not a long term
investment”
True
there is an objective need to build a credible case for the objective measurement of human capital
But
there is a stronger case to build human capital as an asset and expenditures relating to improved human capital as a long term investment<br>
“ROI from human capital cannot be
measured! I am just going to treat it as a
short term cost, not a long term
investment”
True
there is an objective need to build a credible case for the objective measurement of human capital
But
there is a stronger case to build human capital as an asset and expenditures relating to improved human capital as a long term investment<br>
06
Why HRA HRA communicates the worth of human resources to the organization and to the public
Depicting the true value of the organization
ESTABLISHING INVESTOR CONFIDENCE how efficient their personnel is to deliver returns on investments<br>
Depicting the true value of the organization
ESTABLISHING INVESTOR CONFIDENCE how efficient their personnel is to deliver returns on investments<br>
07
The case for HR Valuation Monitor effective utilization
Deciding about transfers, promotion, training and retrenchment
Evaluating the expenditure incurred for imparting further education and training in employees in terms of the benefits derived by the firm.<br>
Deciding about transfers, promotion, training and retrenchment
Evaluating the expenditure incurred for imparting further education and training in employees in terms of the benefits derived by the firm.<br>
08
It is important to be aware of the fact that HRA is not only about putting figures on human capital;
It is also about supporting human resource development / management.
It is about treating employees as assets and knowing whether the asset is appreciated, depleted or conserved;
It is about acquiring and retaining (good) employees<br>
It is also about supporting human resource development / management.
It is about treating employees as assets and knowing whether the asset is appreciated, depleted or conserved;
It is about acquiring and retaining (good) employees<br>
09
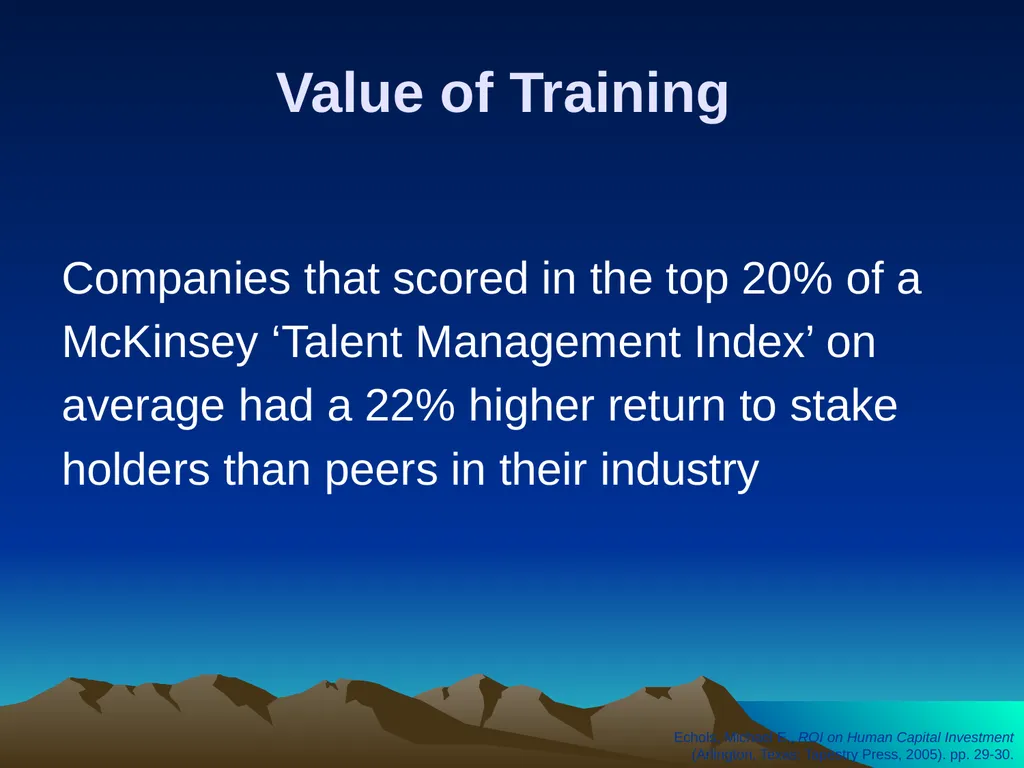
Value of Training Companies that scored in the top 20% of a
McKinsey ‘Talent Management Index’ on
average had a 22% higher return to stake
holders than peers in their industry Echols, Michael E., ROI on Human Capital Investment
(Arlington, Texas: Tapestry Press, 2005). pp. 29-30.<br>
McKinsey ‘Talent Management Index’ on
average had a 22% higher return to stake
holders than peers in their industry Echols, Michael E., ROI on Human Capital Investment
(Arlington, Texas: Tapestry Press, 2005). pp. 29-30.<br>
10
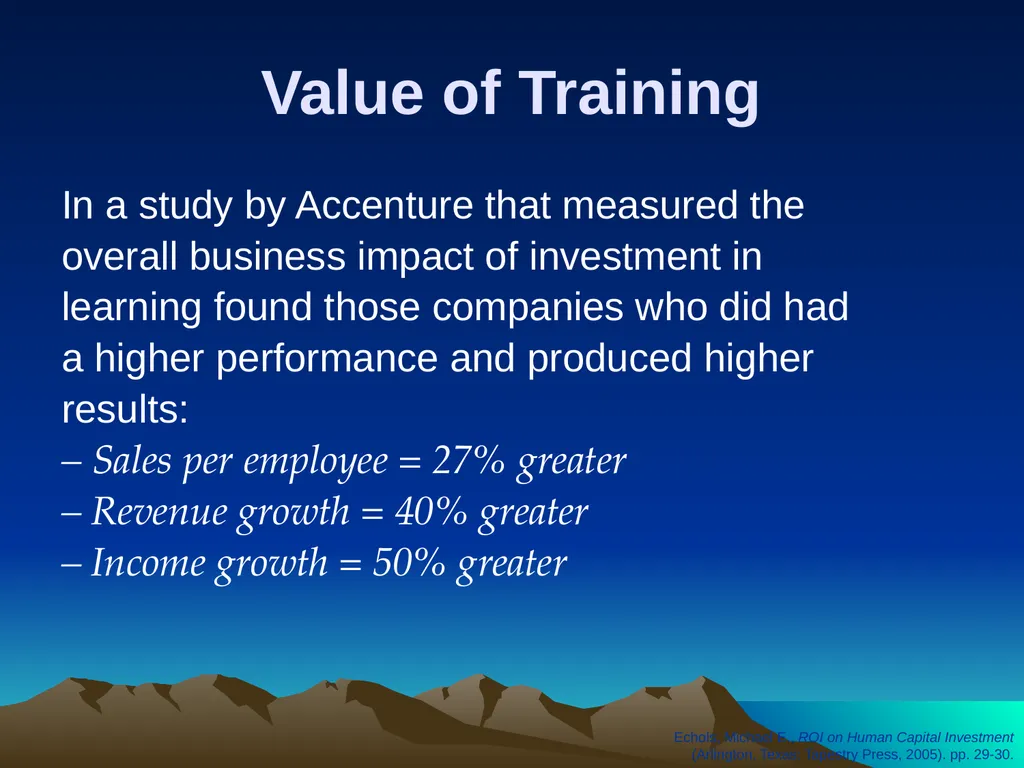
Value of Training In a study by Accenture that measured the
overall business impact of investment in
learning found those companies who did had
a higher performance and produced higher
results:
– Sales per employee = 27% greater
– Revenue growth = 40% greater
– Income growth = 50% greater Echols, Michael E., ROI on Human Capital Investment
(Arlington, Texas: Tapestry Press, 2005). pp. 29-30.<br>
overall business impact of investment in
learning found those companies who did had
a higher performance and produced higher
results:
– Sales per employee = 27% greater
– Revenue growth = 40% greater
– Income growth = 50% greater Echols, Michael E., ROI on Human Capital Investment
(Arlington, Texas: Tapestry Press, 2005). pp. 29-30.<br>
11
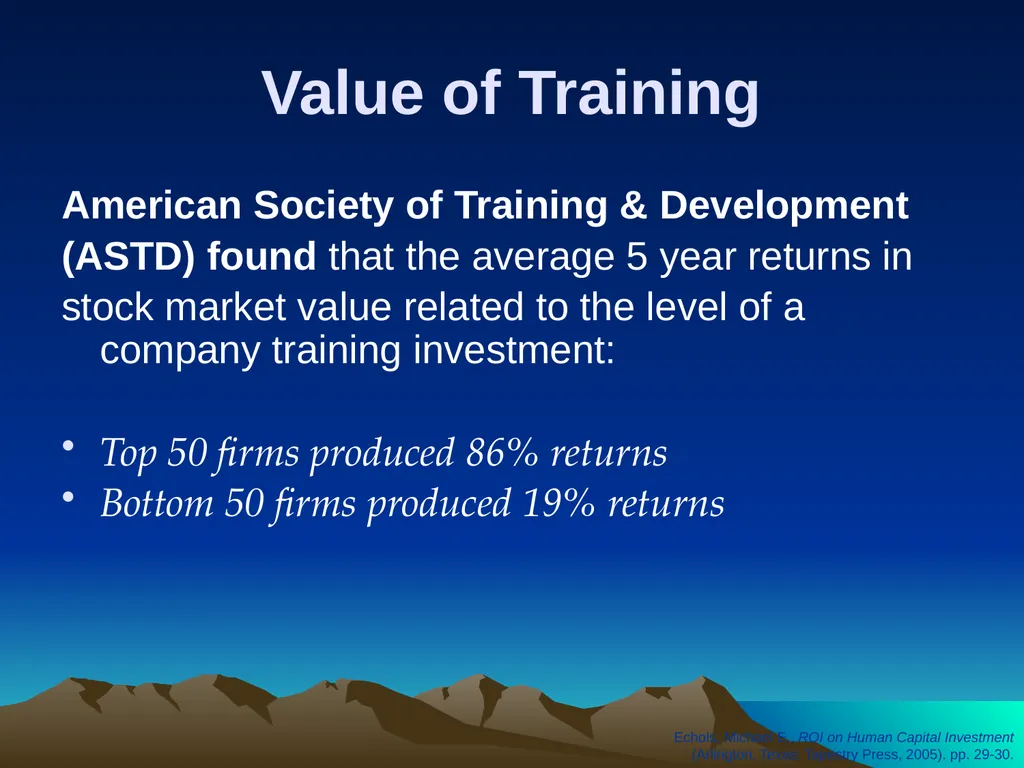
Value of Training American Society of Training & Development
(ASTD) found that the average 5 year returns in
stock market value related to the level of a company training investment:
Top 50 firms produced 86% returns
Bottom 50 firms produced 19% returns Echols, Michael E., ROI on Human Capital Investment
(Arlington, Texas: Tapestry Press, 2005). pp. 29-30.<br>
(ASTD) found that the average 5 year returns in
stock market value related to the level of a company training investment:
Top 50 firms produced 86% returns
Bottom 50 firms produced 19% returns Echols, Michael E., ROI on Human Capital Investment
(Arlington, Texas: Tapestry Press, 2005). pp. 29-30.<br>
12
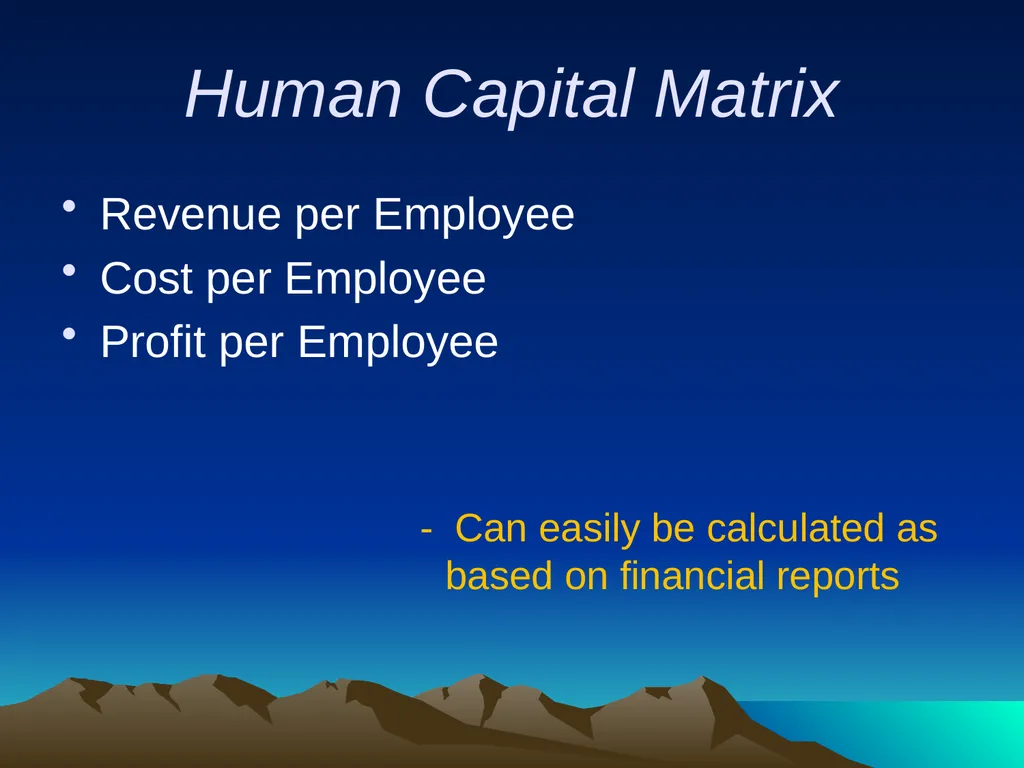
Human Capital Matrix Revenue per Employee
Cost per Employee
Profit per Employee
- Can easily be calculated as based on financial reports<br>
Cost per Employee
Profit per Employee
- Can easily be calculated as based on financial reports<br>
13
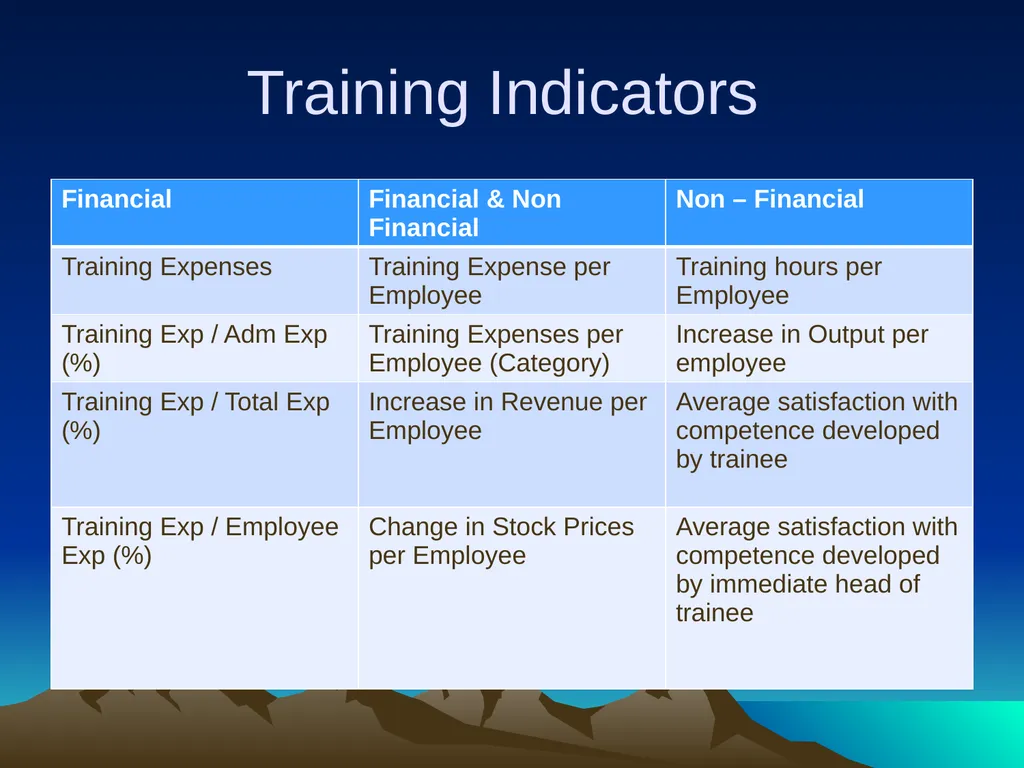
Training Indicators<br>
14
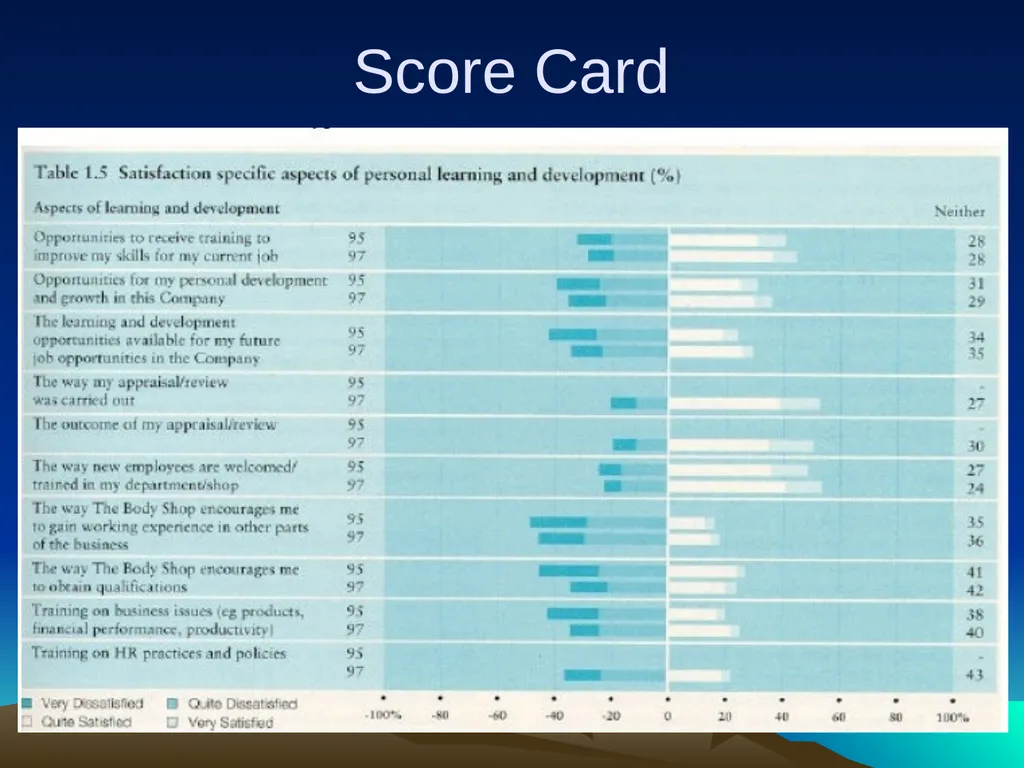
Score Card<br>
15
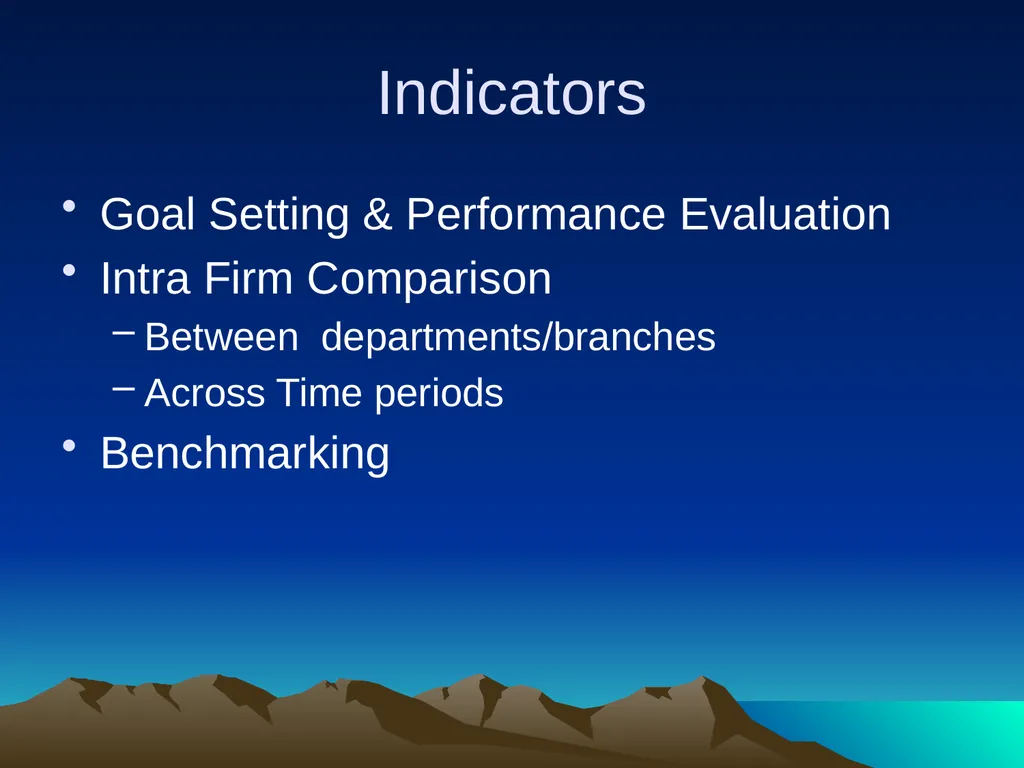
Indicators Goal Setting & Performance Evaluation
Intra Firm Comparison
Between departments/branches
Across Time periods
Benchmarking<br>
Intra Firm Comparison
Between departments/branches
Across Time periods
Benchmarking<br>
16
Can I Determine the Benefit derived from Training ?<br>
17
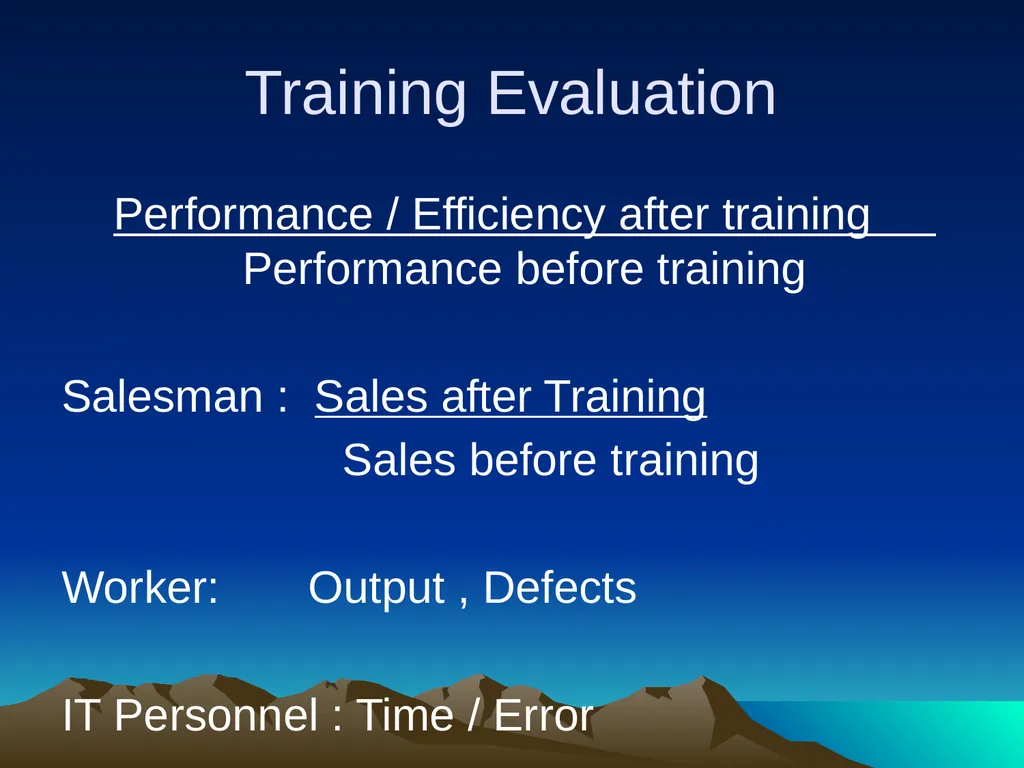
Training Evaluation Performance / Efficiency after training Performance before training
Salesman : Sales after Training
Sales before training
Worker: Output , Defects
IT Personnel : Time / Error<br>
Salesman : Sales after Training
Sales before training
Worker: Output , Defects
IT Personnel : Time / Error<br>
18
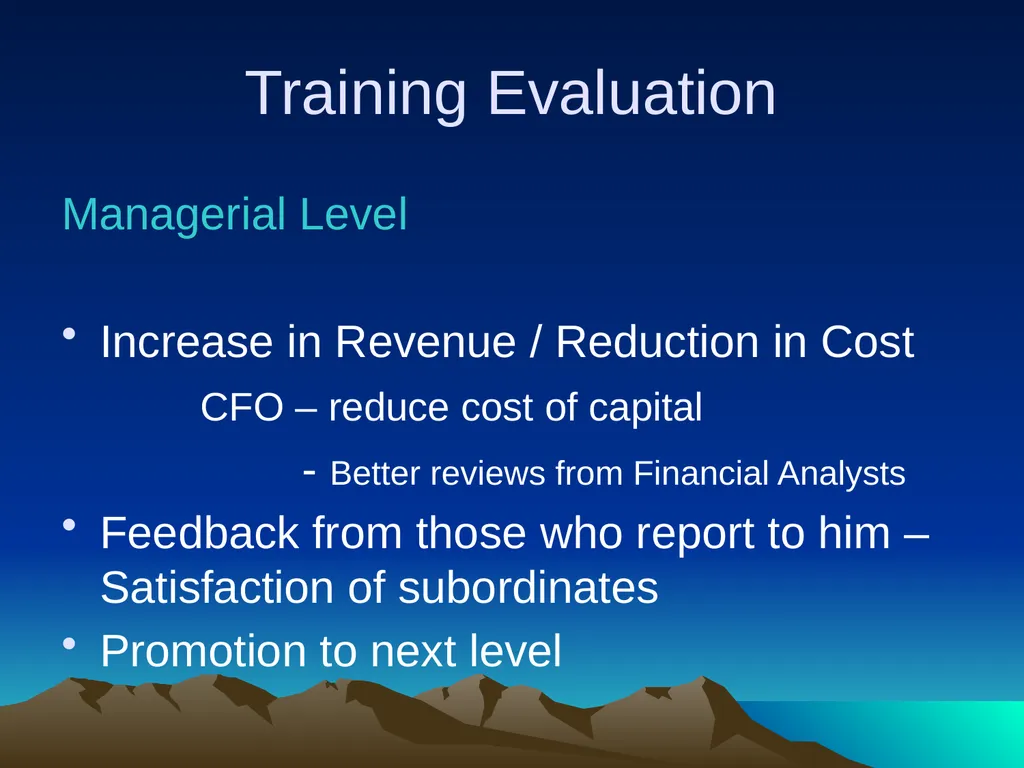
Training Evaluation Managerial Level
Increase in Revenue / Reduction in Cost
CFO – reduce cost of capital
- Better reviews from Financial Analysts
Feedback from those who report to him – Satisfaction of subordinates
Promotion to next level<br>
Increase in Revenue / Reduction in Cost
CFO – reduce cost of capital
- Better reviews from Financial Analysts
Feedback from those who report to him – Satisfaction of subordinates
Promotion to next level<br>
19
Investment not Cost As human resource is considered as an asset, any expenditure incurred in the acquisition and accumulation of human resource is treated as an investment.
Cost of training and development represents sacrifice that will have to be incurred today to acquire and develop people in future<br>
Cost of training and development represents sacrifice that will have to be incurred today to acquire and develop people in future<br>
20
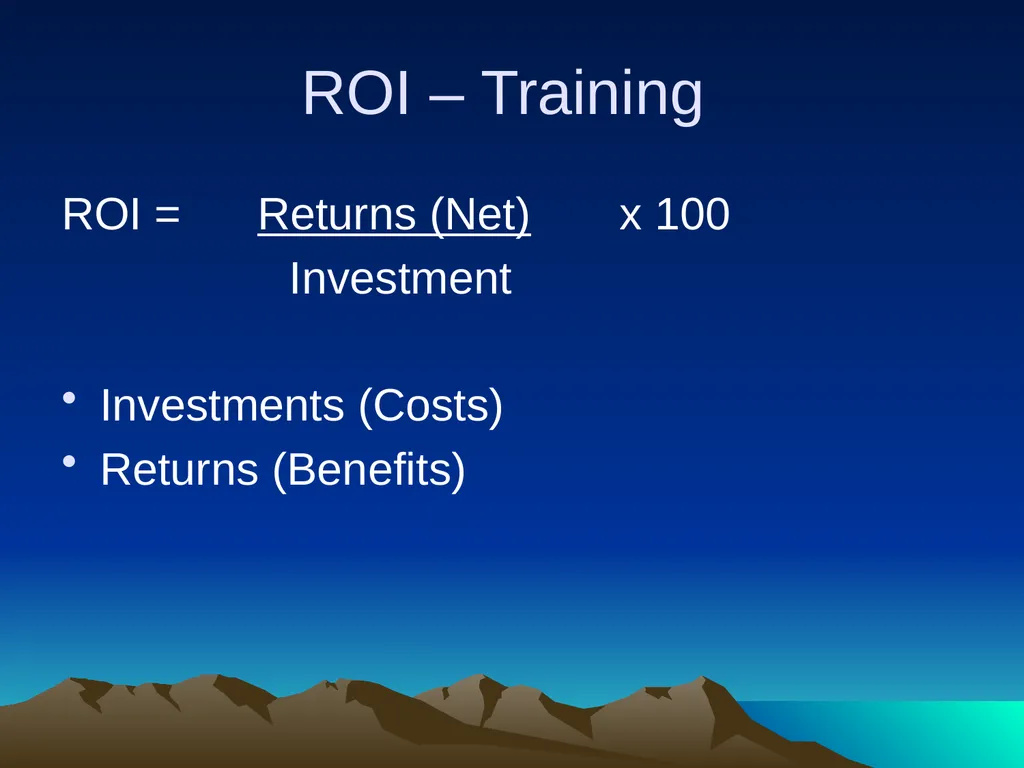
ROI – Training ROI = Returns (Net) x 100
Investment
Investments (Costs)
Returns (Benefits)<br>
Investment
Investments (Costs)
Returns (Benefits)<br>
21
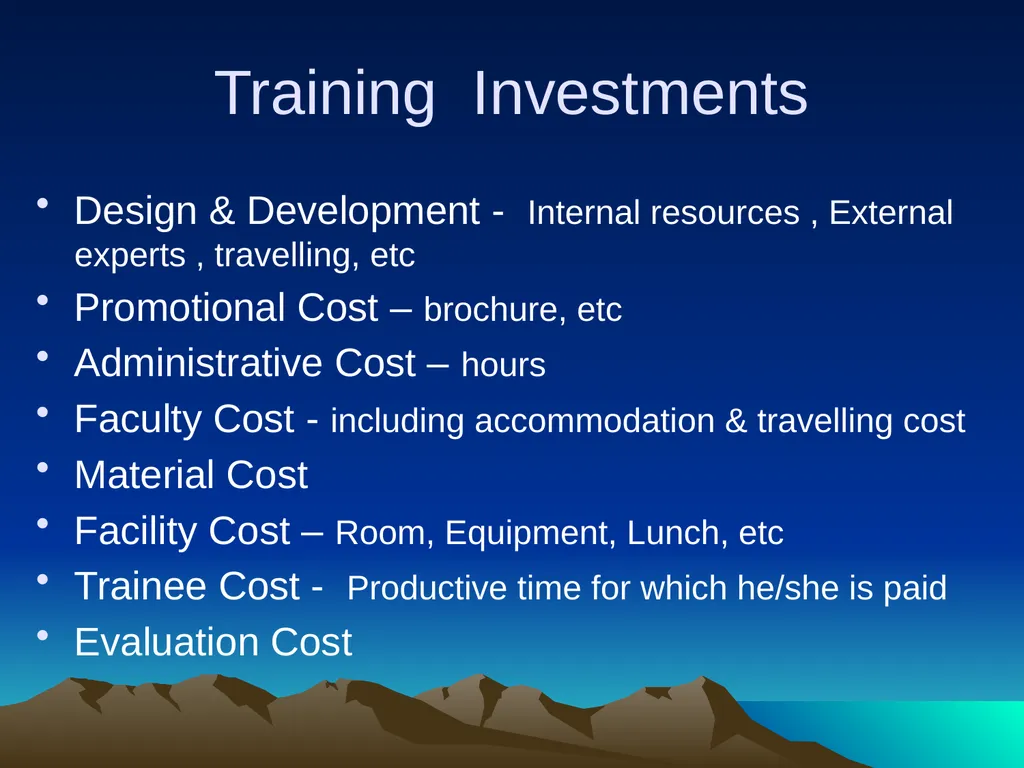
Training Investments Design & Development - Internal resources , External experts , travelling, etc
Promotional Cost – brochure, etc
Administrative Cost – hours
Faculty Cost - including accommodation & travelling cost
Material Cost
Facility Cost – Room, Equipment, Lunch, etc
Trainee Cost - Productive time for which he/she is paid
Evaluation Cost<br>
Promotional Cost – brochure, etc
Administrative Cost – hours
Faculty Cost - including accommodation & travelling cost
Material Cost
Facility Cost – Room, Equipment, Lunch, etc
Trainee Cost - Productive time for which he/she is paid
Evaluation Cost<br>
22
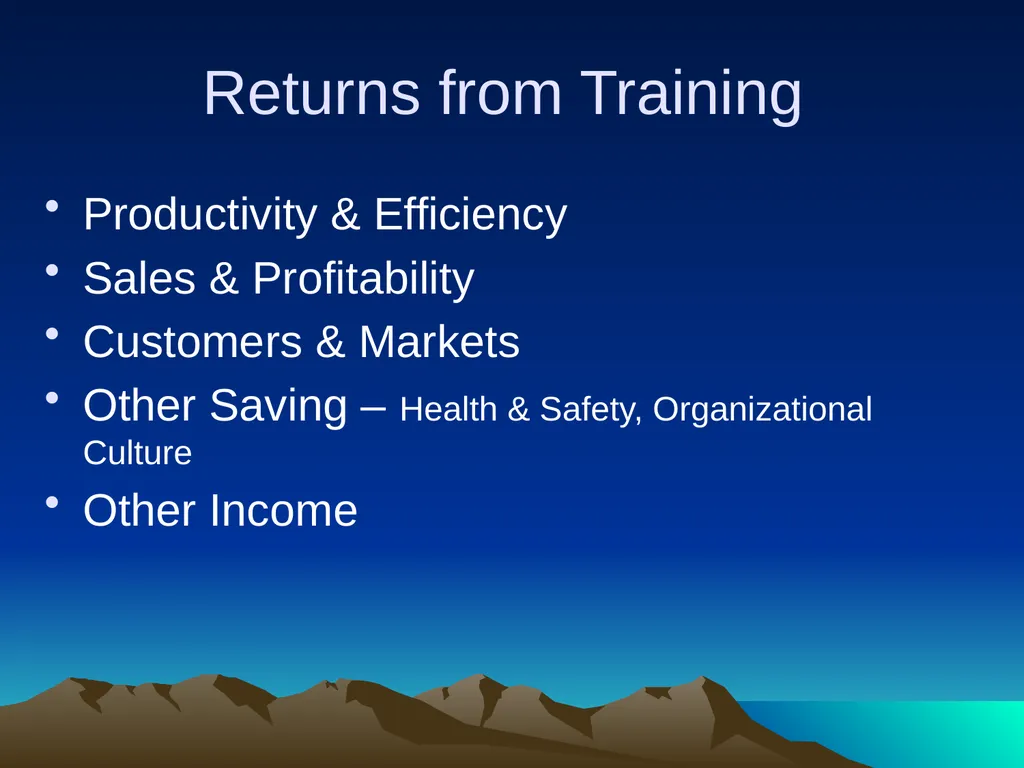
Returns from Training Productivity & Efficiency
Sales & Profitability
Customers & Markets
Other Saving – Health & Safety, Organizational Culture
Other Income<br>
Sales & Profitability
Customers & Markets
Other Saving – Health & Safety, Organizational Culture
Other Income<br>
23
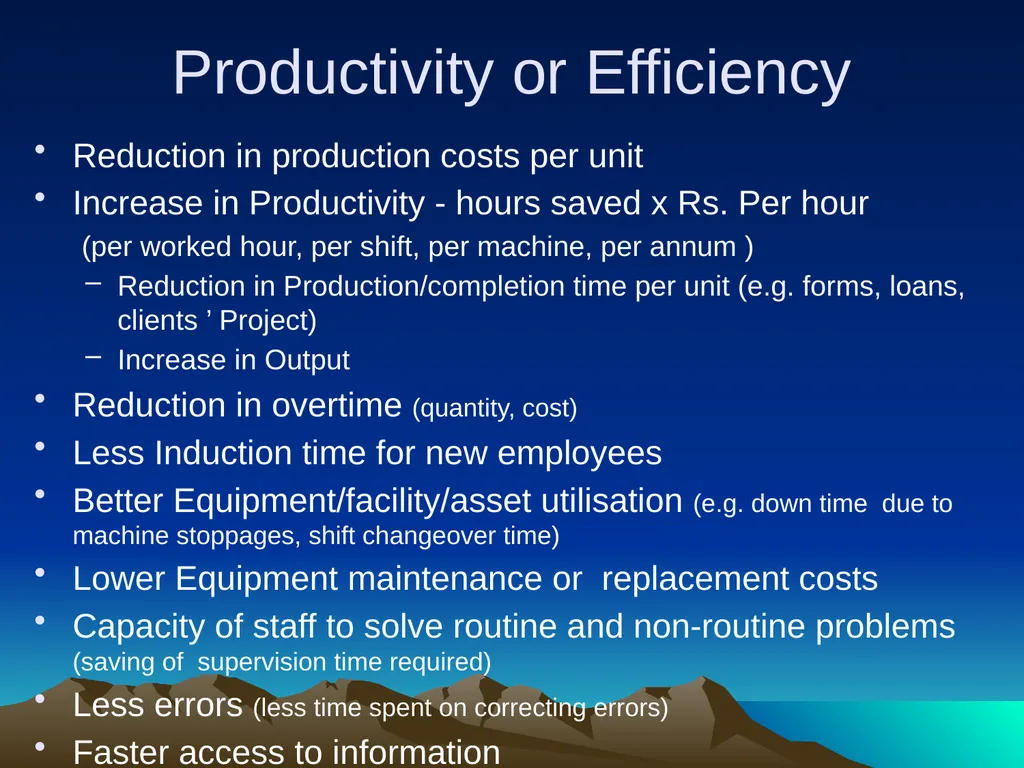
Productivity or Efficiency Reduction in production costs per unit
Increase in Productivity - hours saved x Rs. Per hour
(per worked hour, per shift, per machine, per annum )
Reduction in Production/completion time per unit (e.g. forms, loans, clients ’ Project)
Increase in Output
Reduction in overtime (quantity, cost)
Less Induction time for new employees
Better Equipment/facility/asset utilisation (e.g. down time due to machine stoppages, shift changeover time)
Lower Equipment maintenance or replacement costs
Capacity of staff to solve routine and non-routine problems (saving of supervision time required)
Less errors (less time spent on correcting errors)
Faster access to information<br>
Increase in Productivity - hours saved x Rs. Per hour
(per worked hour, per shift, per machine, per annum )
Reduction in Production/completion time per unit (e.g. forms, loans, clients ’ Project)
Increase in Output
Reduction in overtime (quantity, cost)
Less Induction time for new employees
Better Equipment/facility/asset utilisation (e.g. down time due to machine stoppages, shift changeover time)
Lower Equipment maintenance or replacement costs
Capacity of staff to solve routine and non-routine problems (saving of supervision time required)
Less errors (less time spent on correcting errors)
Faster access to information<br>
24
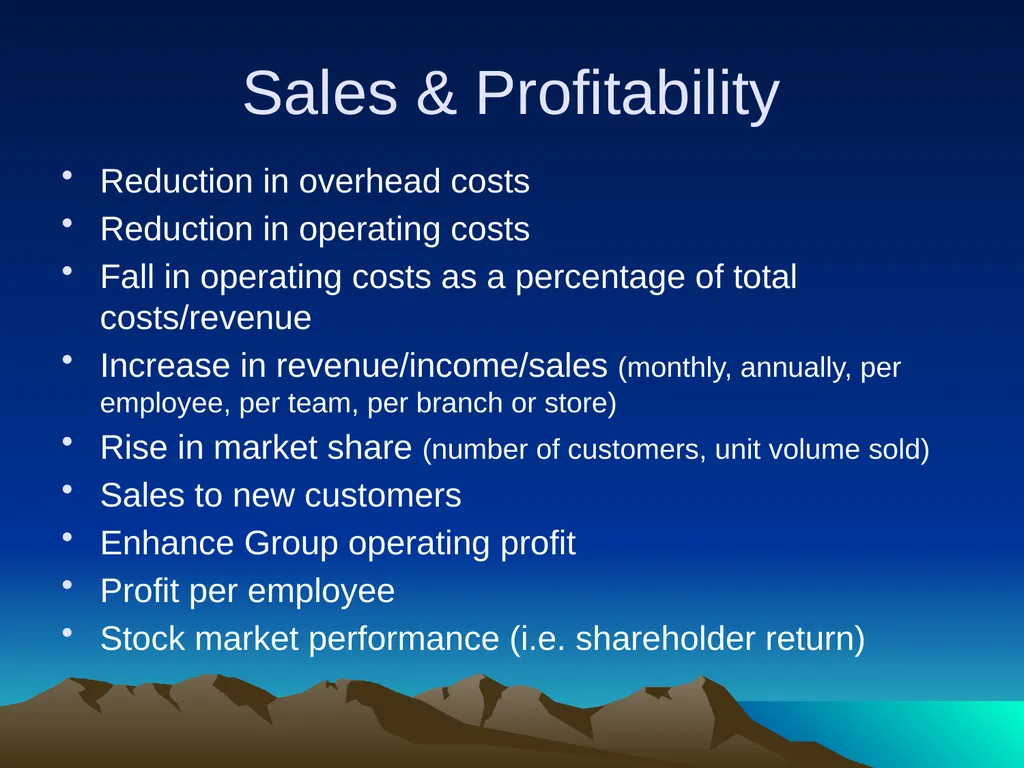
Sales & Profitability Reduction in overhead costs
Reduction in operating costs
Fall in operating costs as a percentage of total costs/revenue
Increase in revenue/income/sales (monthly, annually, per employee, per team, per branch or store)
Rise in market share (number of customers, unit volume sold)
Sales to new customers
Enhance Group operating profit
Profit per employee
Stock market performance (i.e. shareholder return)<br>
Reduction in operating costs
Fall in operating costs as a percentage of total costs/revenue
Increase in revenue/income/sales (monthly, annually, per employee, per team, per branch or store)
Rise in market share (number of customers, unit volume sold)
Sales to new customers
Enhance Group operating profit
Profit per employee
Stock market performance (i.e. shareholder return)<br>
25
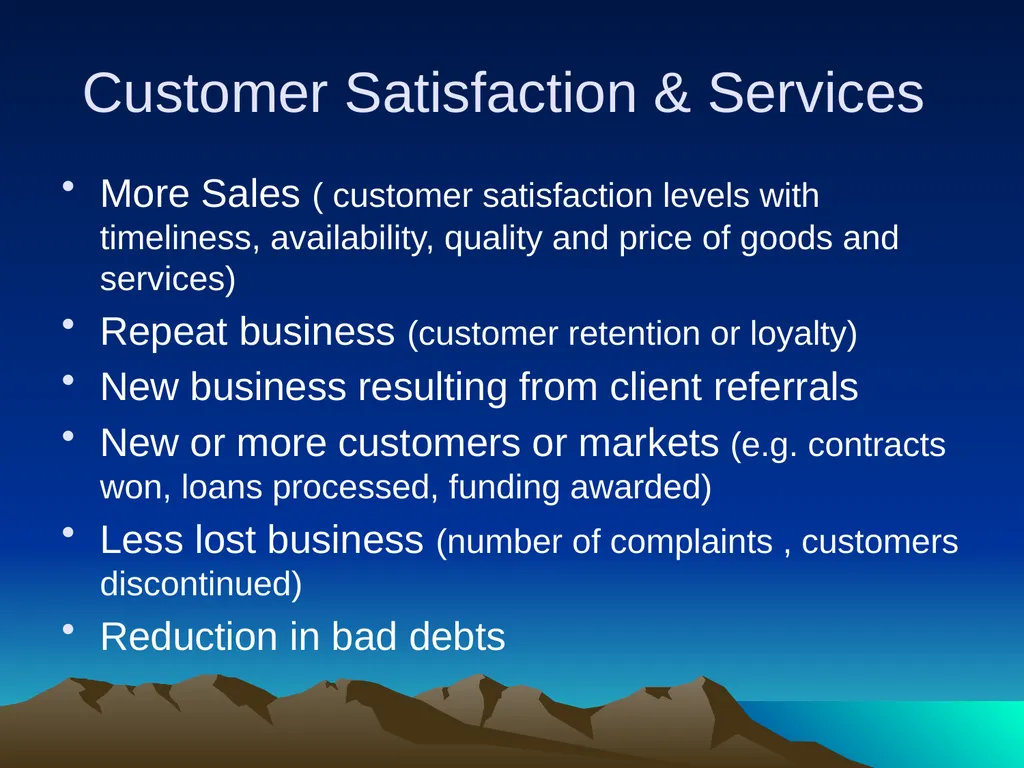
Customer Satisfaction & Services More Sales ( customer satisfaction levels with timeliness, availability, quality and price of goods and services)
Repeat business (customer retention or loyalty)
New business resulting from client referrals
New or more customers or markets (e.g. contracts won, loans processed, funding awarded)
Less lost business (number of complaints , customers discontinued)
Reduction in bad debts<br>
Repeat business (customer retention or loyalty)
New business resulting from client referrals
New or more customers or markets (e.g. contracts won, loans processed, funding awarded)
Less lost business (number of complaints , customers discontinued)
Reduction in bad debts<br>
26
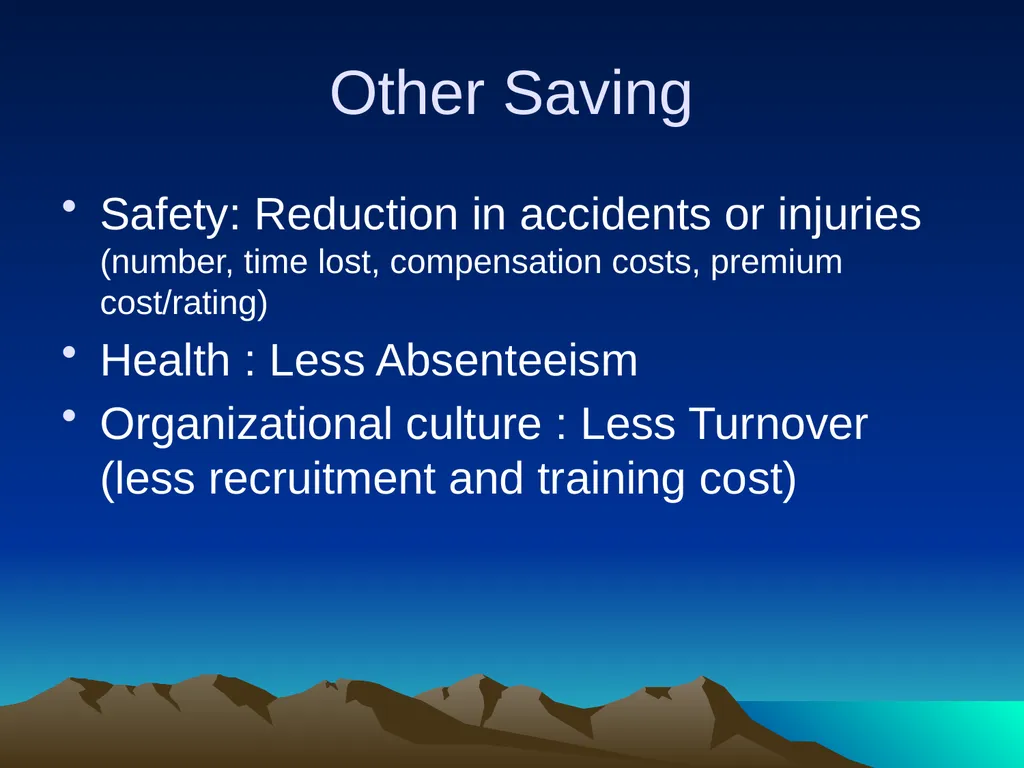
Other Saving Safety: Reduction in accidents or injuries (number, time lost, compensation costs, premium cost/rating)
Health : Less Absenteeism
Organizational culture : Less Turnover (less recruitment and training cost)<br>
Health : Less Absenteeism
Organizational culture : Less Turnover (less recruitment and training cost)<br>
27
Other Income Sales from referral of non-sales employee
New Product ideas leading to new product launches<br>
New Product ideas leading to new product launches<br>
28
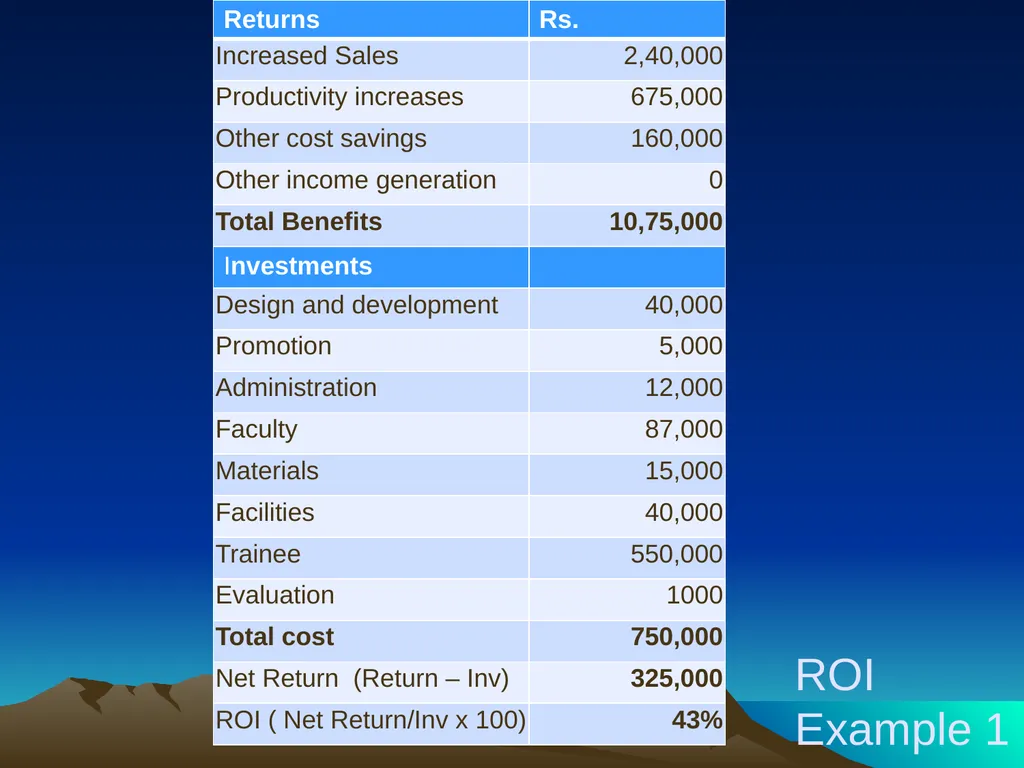
ROI Example 1<br>
29
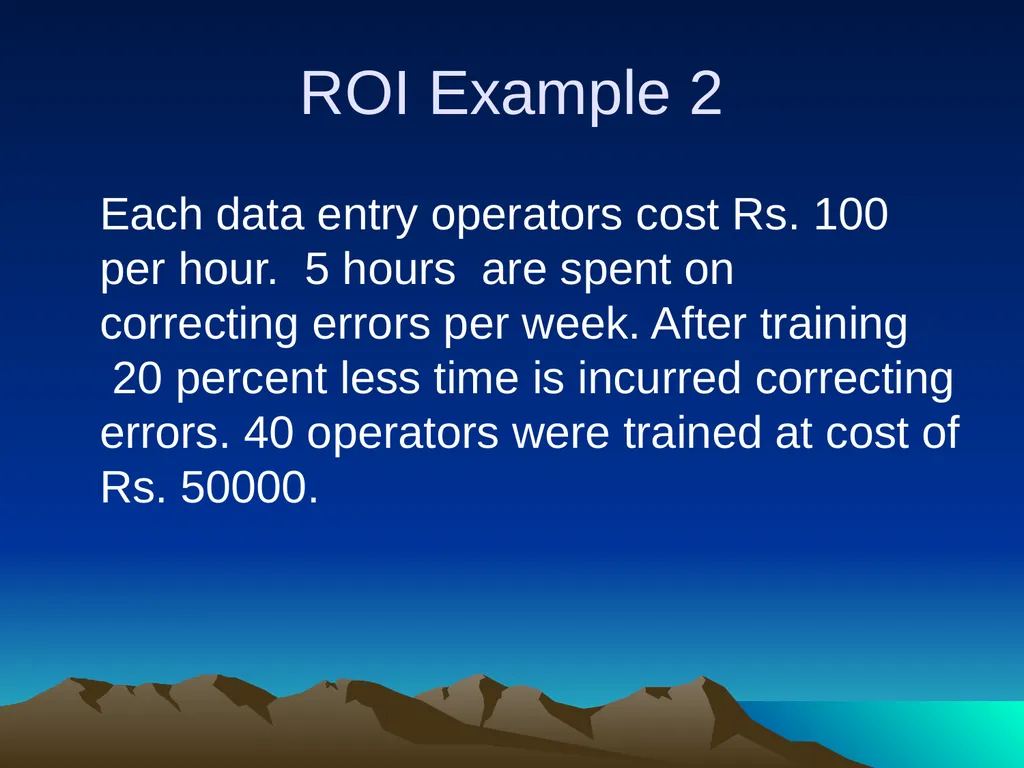
ROI Example 2 Each data entry operators cost Rs. 100 per hour. 5 hours are spent on correcting errors per week. After training 20 percent less time is incurred correcting errors. 40 operators were trained at cost of Rs. 50000.<br>
30
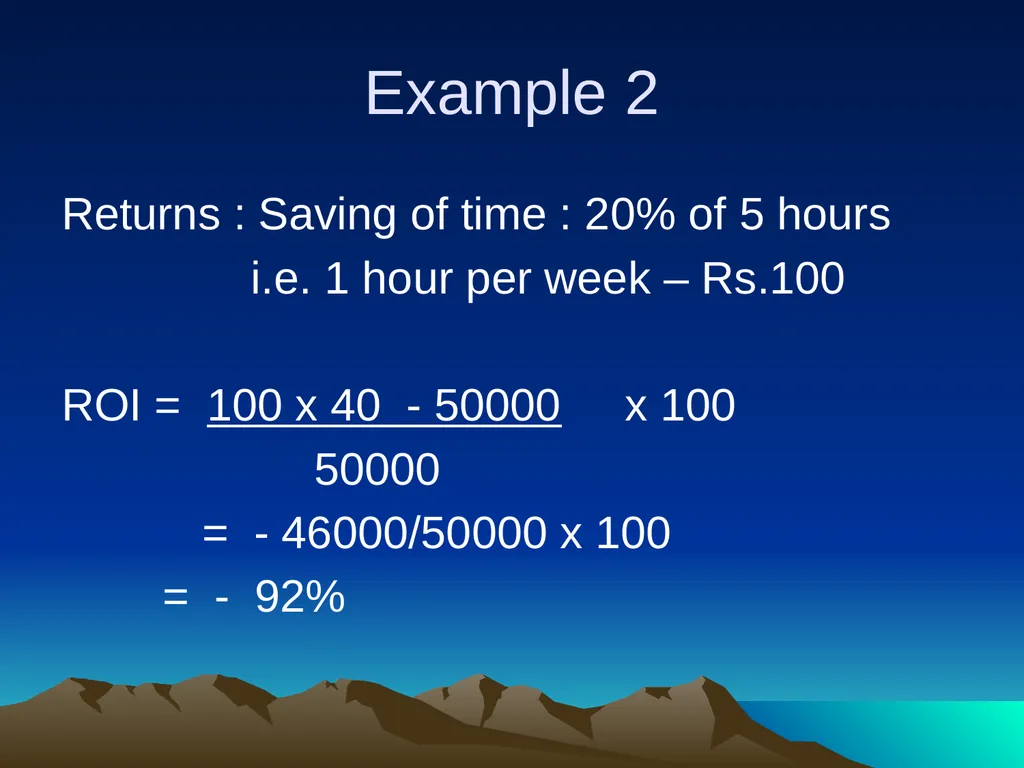
Example 2 Returns : Saving of time : 20% of 5 hours
i.e. 1 hour per week – Rs.100
ROI = 100 x 40 - 50000 x 100
50000
= - 46000/50000 x 100
= - 92%<br>
i.e. 1 hour per week – Rs.100
ROI = 100 x 40 - 50000 x 100
50000
= - 46000/50000 x 100
= - 92%<br>
31
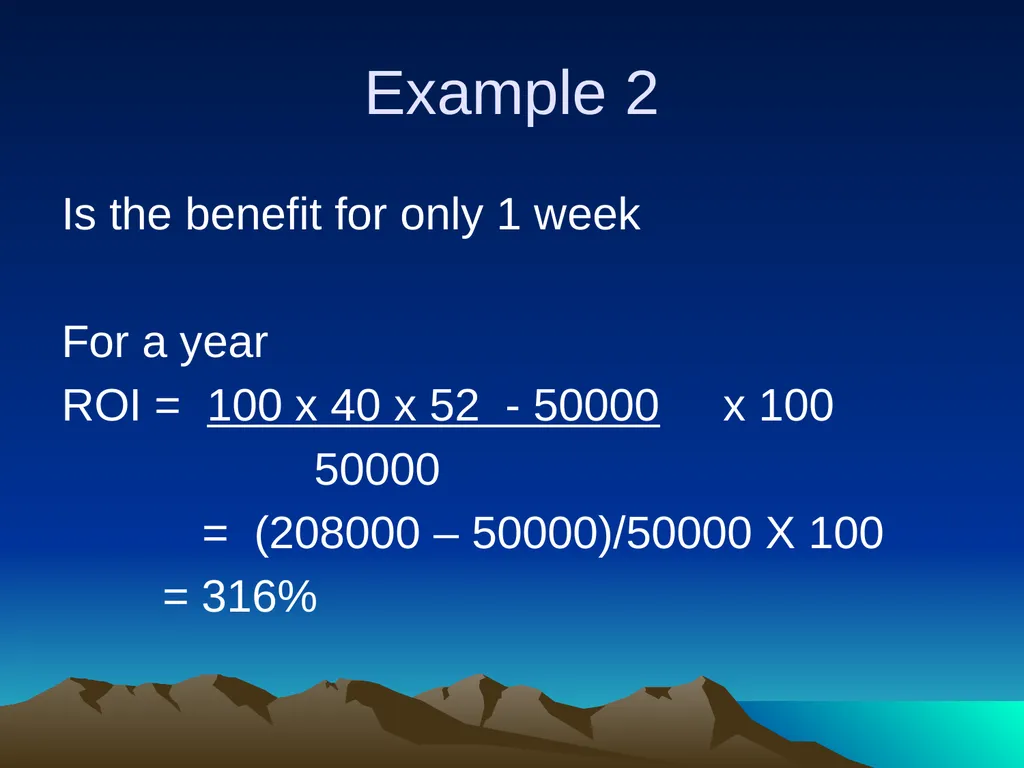
Example 2 Is the benefit for only 1 week
For a year
ROI = 100 x 40 x 52 - 50000 x 100
50000
= (208000 – 50000)/50000 X 100
= 316%<br>
For a year
ROI = 100 x 40 x 52 - 50000 x 100
50000
= (208000 – 50000)/50000 X 100
= 316%<br>
32
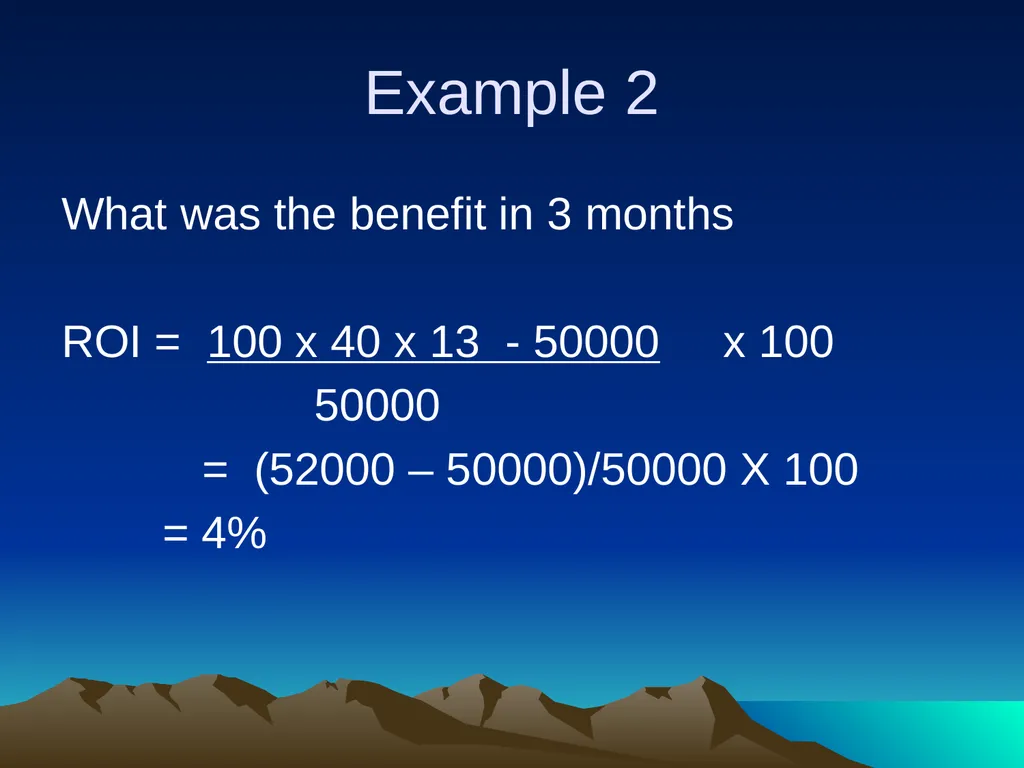
Example 2 What was the benefit in 3 months
ROI = 100 x 40 x 13 - 50000 x 100
50000
= (52000 – 50000)/50000 X 100
= 4%<br>
ROI = 100 x 40 x 13 - 50000 x 100
50000
= (52000 – 50000)/50000 X 100
= 4%<br>
33
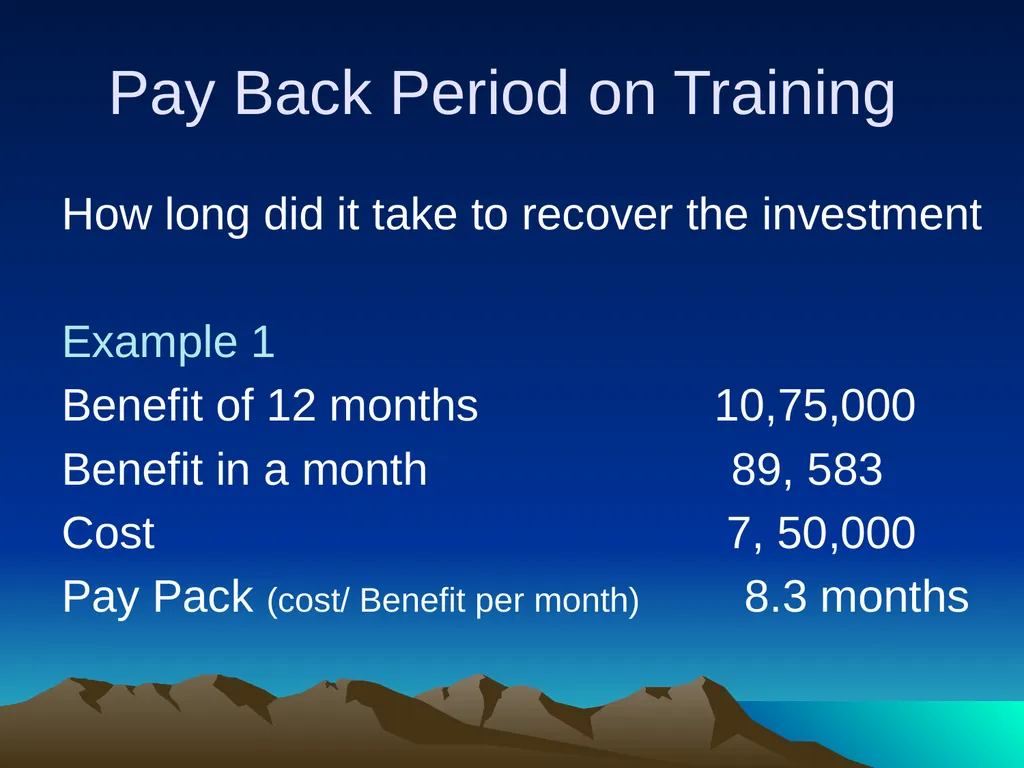
Pay Back Period on Training How long did it take to recover the investment
Example 1
Benefit of 12 months 10,75,000
Benefit in a month 89, 583
Cost 7, 50,000
Pay Pack (cost/ Benefit per month) 8.3 months<br>
Example 1
Benefit of 12 months 10,75,000
Benefit in a month 89, 583
Cost 7, 50,000
Pay Pack (cost/ Benefit per month) 8.3 months<br>
34
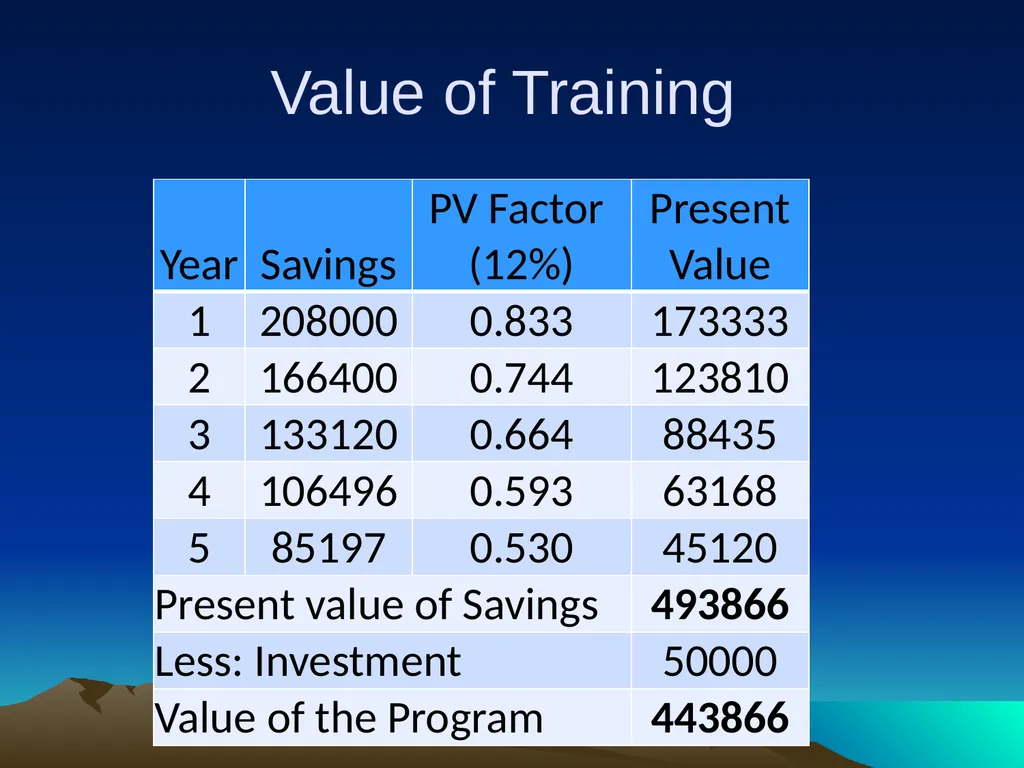
Value of Training<br>
35
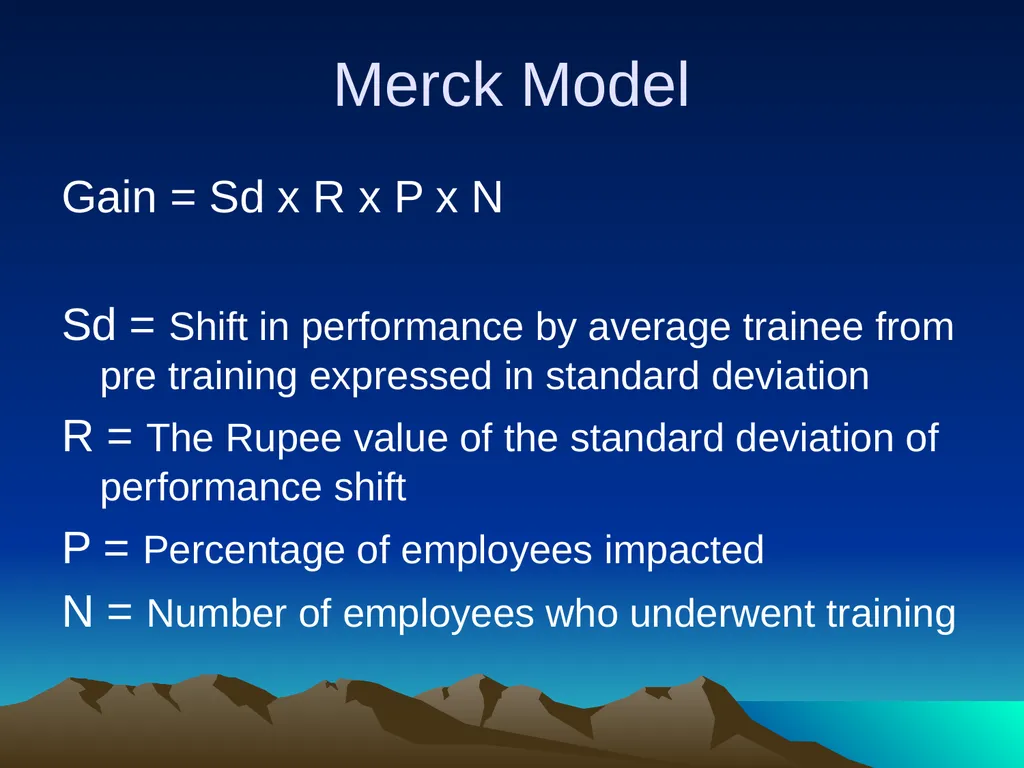
Merck Model Gain = Sd x R x P x N
Sd = Shift in performance by average trainee from pre training expressed in standard deviation
R = The Rupee value of the standard deviation of performance shift
P = Percentage of employees impacted
N = Number of employees who underwent training<br>
Sd = Shift in performance by average trainee from pre training expressed in standard deviation
R = The Rupee value of the standard deviation of performance shift
P = Percentage of employees impacted
N = Number of employees who underwent training<br>
36
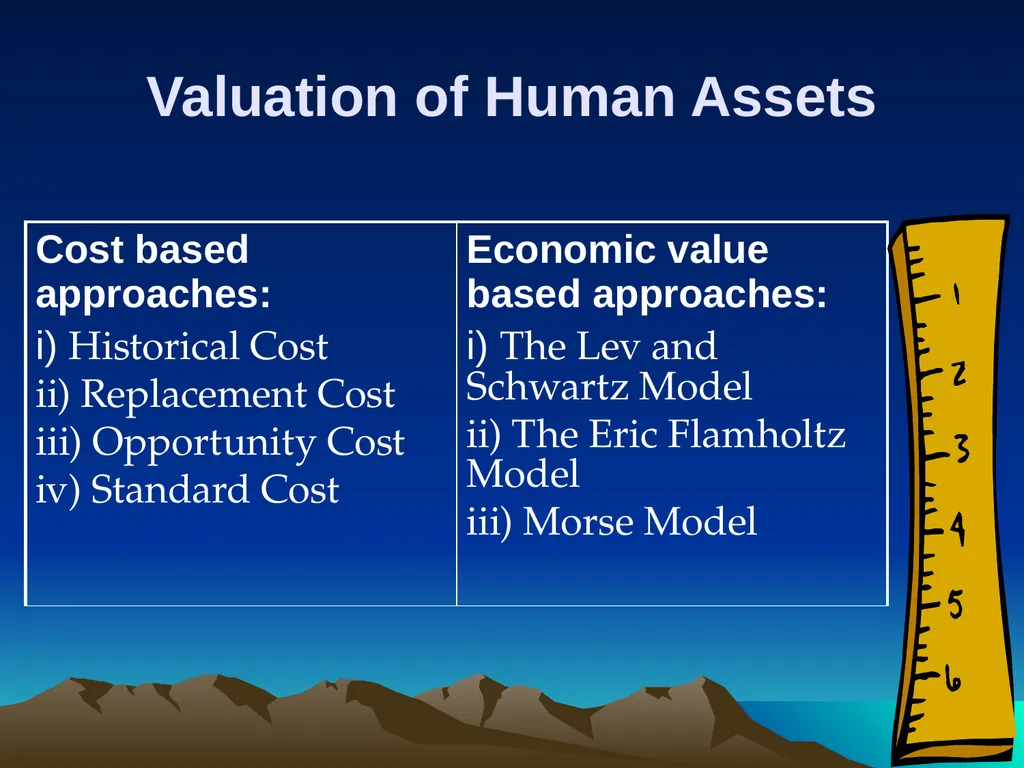
Valuation of Human Assets<br>
37
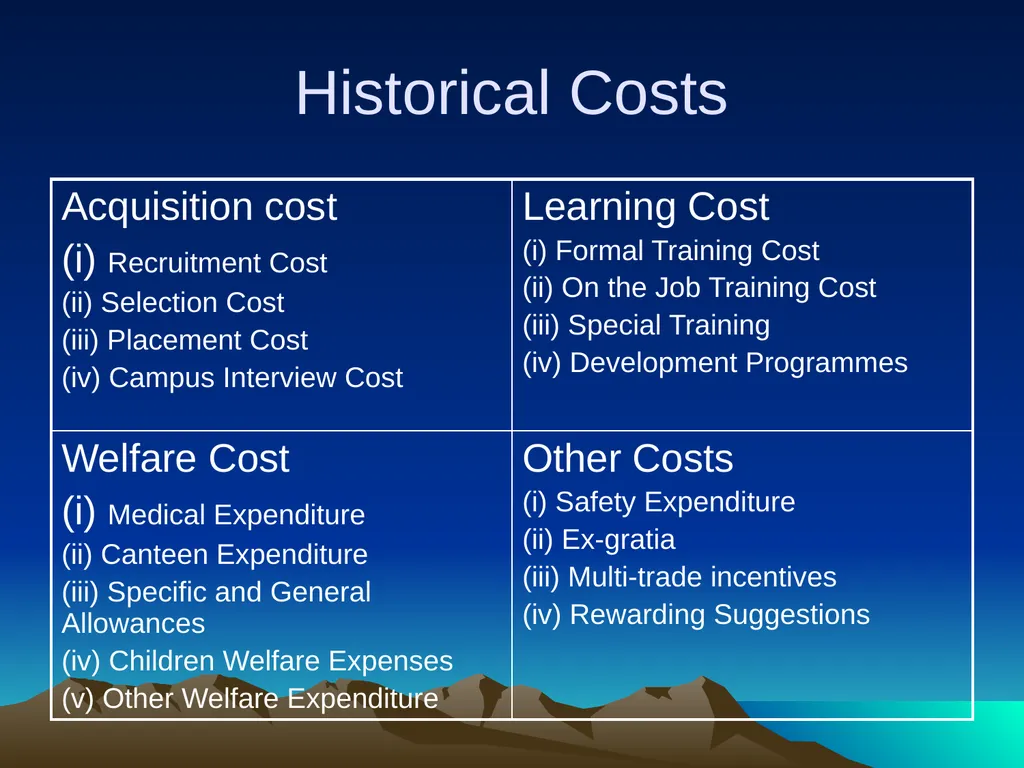
Historical Costs<br>
38
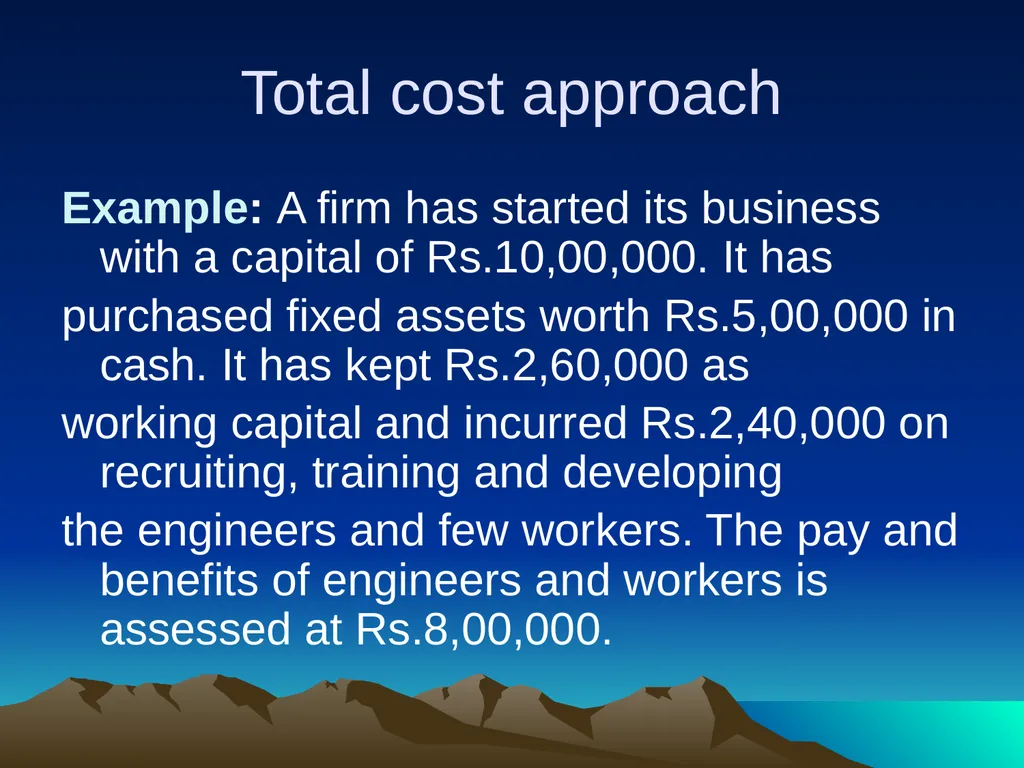
Total cost approach Example: A firm has started its business with a capital of Rs.10,00,000. It has
purchased fixed assets worth Rs.5,00,000 in cash. It has kept Rs.2,60,000 as
working capital and incurred Rs.2,40,000 on recruiting, training and developing
the engineers and few workers. The pay and benefits of engineers and workers is assessed at Rs.8,00,000.<br>
purchased fixed assets worth Rs.5,00,000 in cash. It has kept Rs.2,60,000 as
working capital and incurred Rs.2,40,000 on recruiting, training and developing
the engineers and few workers. The pay and benefits of engineers and workers is assessed at Rs.8,00,000.<br>
39
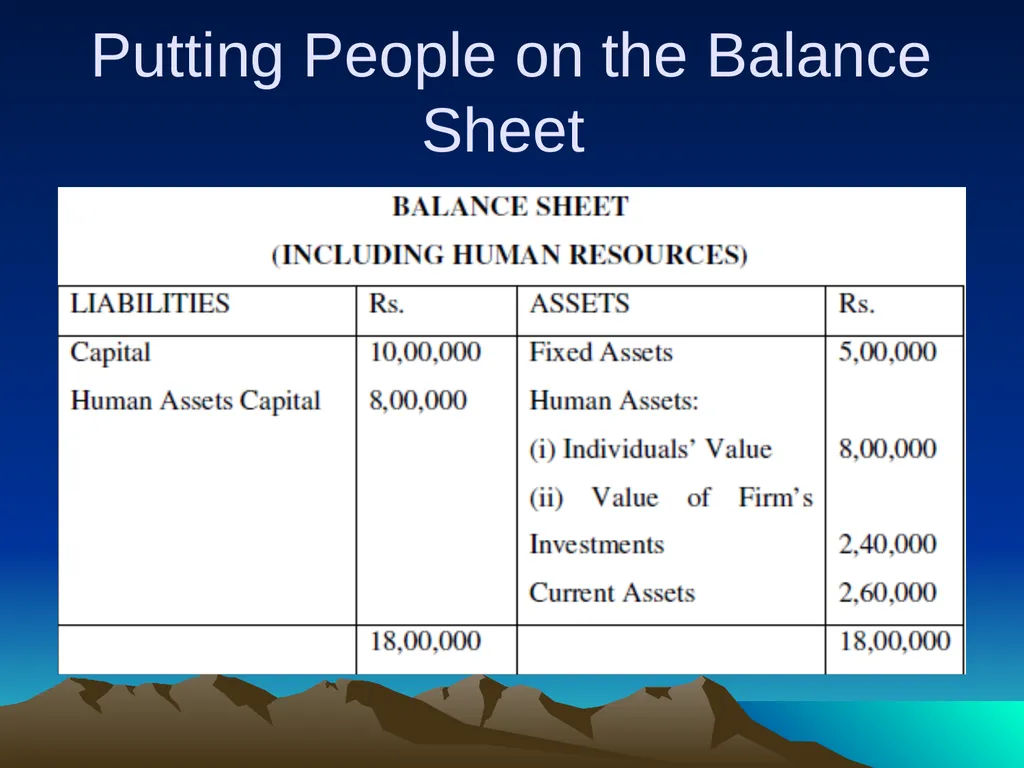
Putting People on the Balance Sheet<br>
40
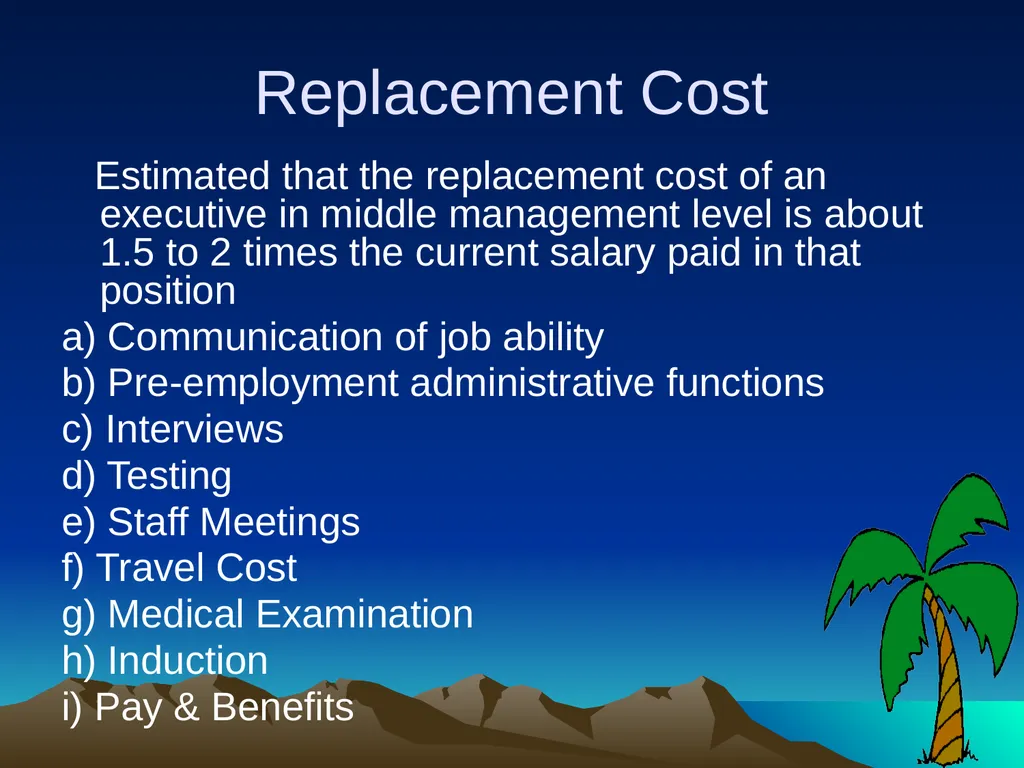
Replacement Cost Estimated that the replacement cost of an executive in middle management level is about 1.5 to 2 times the current salary paid in that position
a) Communication of job ability
b) Pre-employment administrative functions
c) Interviews
d) Testing
e) Staff Meetings
f) Travel Cost
g) Medical Examination
h) Induction
i) Pay & Benefits<br>
a) Communication of job ability
b) Pre-employment administrative functions
c) Interviews
d) Testing
e) Staff Meetings
f) Travel Cost
g) Medical Examination
h) Induction
i) Pay & Benefits<br>
41
Opportunity Cost Method This model envisages computation of monetary value and allocation of people to the most promising activity and thereby to assess the opportunity cost of key employees through competitive bidding among investment centres.<br>
42
Present Value Of Future Earnings Method It recognizes an individual’s expected economic value to the enterprise during his remaining service period. An estimate about the future earning is made, for his entire service period till the date of retirement of the employees. Such earnings are discounted by an appropriate range to get the present value.<br>
43
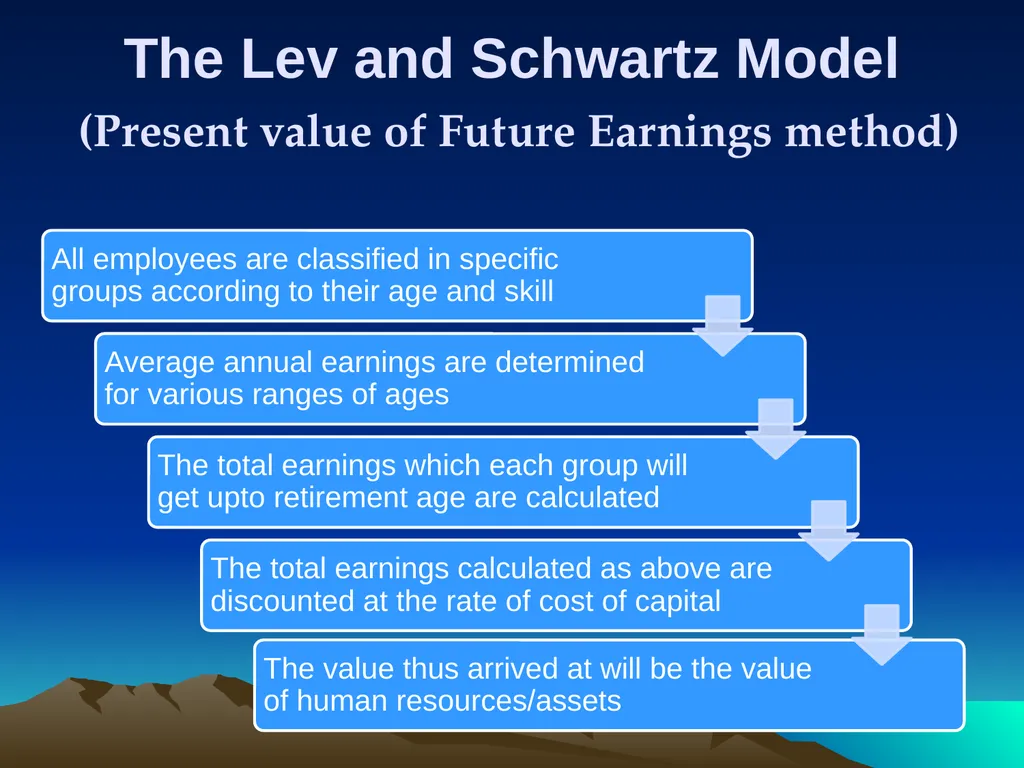
The Lev and Schwartz Model
(Present value of Future Earnings method)<br>
44
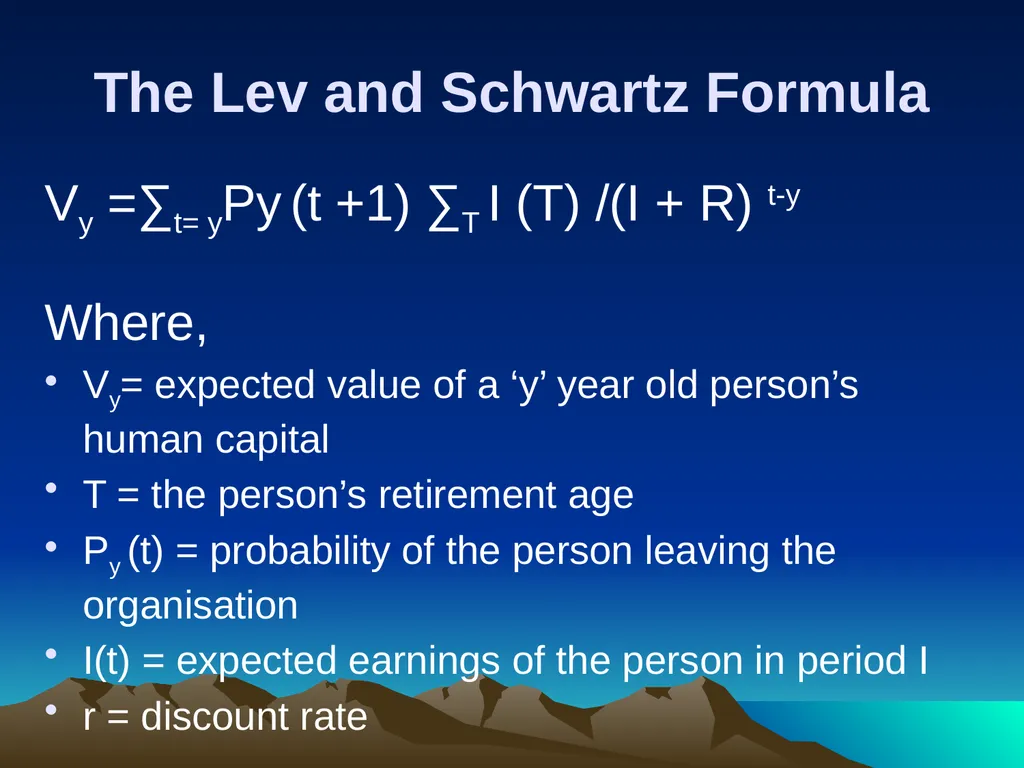
The Lev and Schwartz Formula Vy =∑t= yPy (t +1) ∑T I (T) /(I + R) t-y
Where,
Vy= expected value of a ‘y’ year old person’s human capital
T = the person’s retirement age
Py (t) = probability of the person leaving the organisation
I(t) = expected earnings of the person in period I
r = discount rate<br>
Where,
Vy= expected value of a ‘y’ year old person’s human capital
T = the person’s retirement age
Py (t) = probability of the person leaving the organisation
I(t) = expected earnings of the person in period I
r = discount rate<br>
45
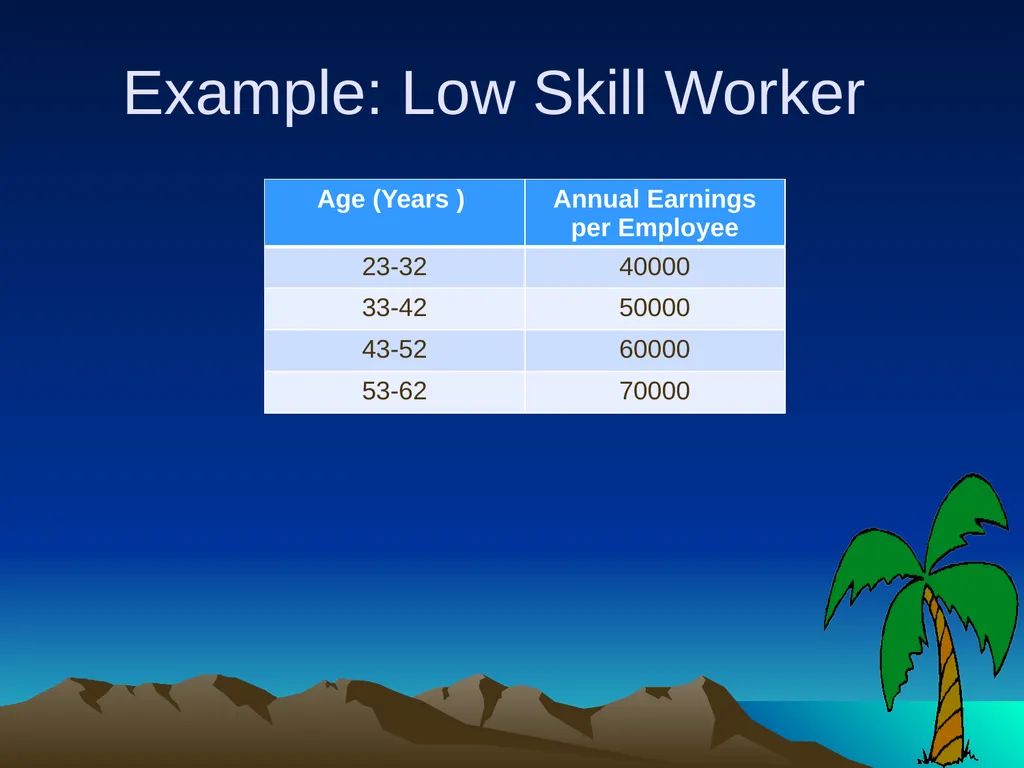
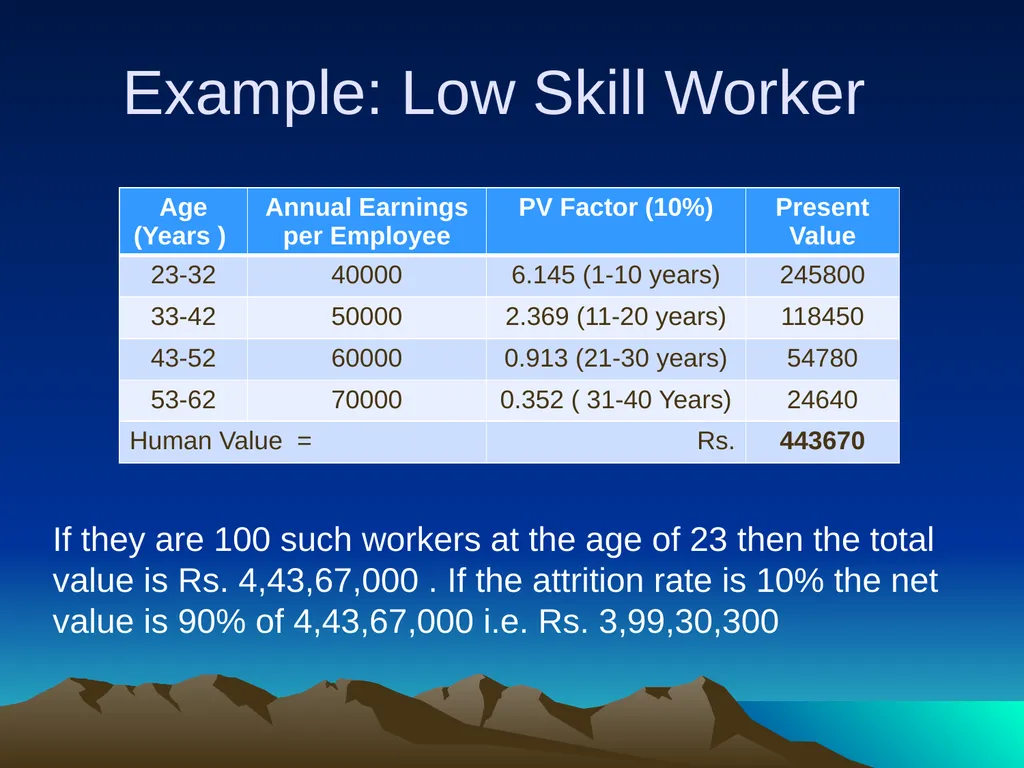
Example: Low Skill Worker<br>
46
Example: Low Skill Worker If they are 100 such workers at the age of 23 then the total value is Rs. 4,43,67,000 . If the attrition rate is 10% the net value is 90% of 4,43,67,000 i.e. Rs. 3,99,30,300<br>
47
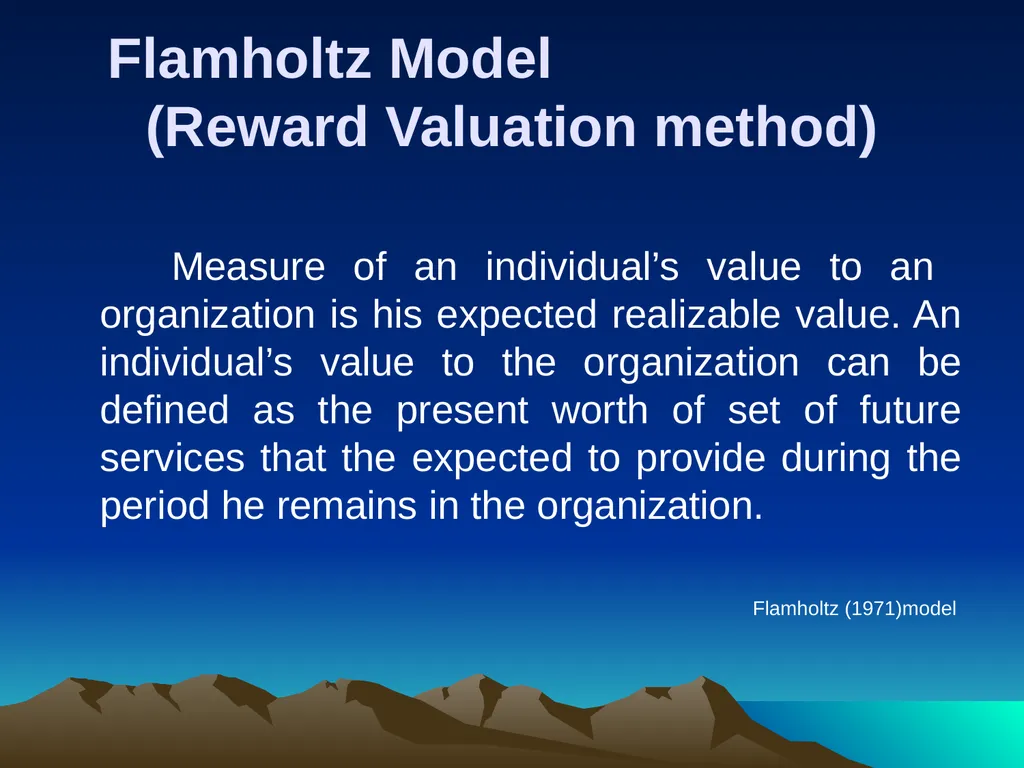
Flamholtz Model (Reward Valuation method) Measure of an individual’s value to an organization is his expected realizable value. An individual’s value to the organization can be defined as the present worth of set of future services that the expected to provide during the period he remains in the organization.
Flamholtz (1971)model<br>
Flamholtz (1971)model<br>
48
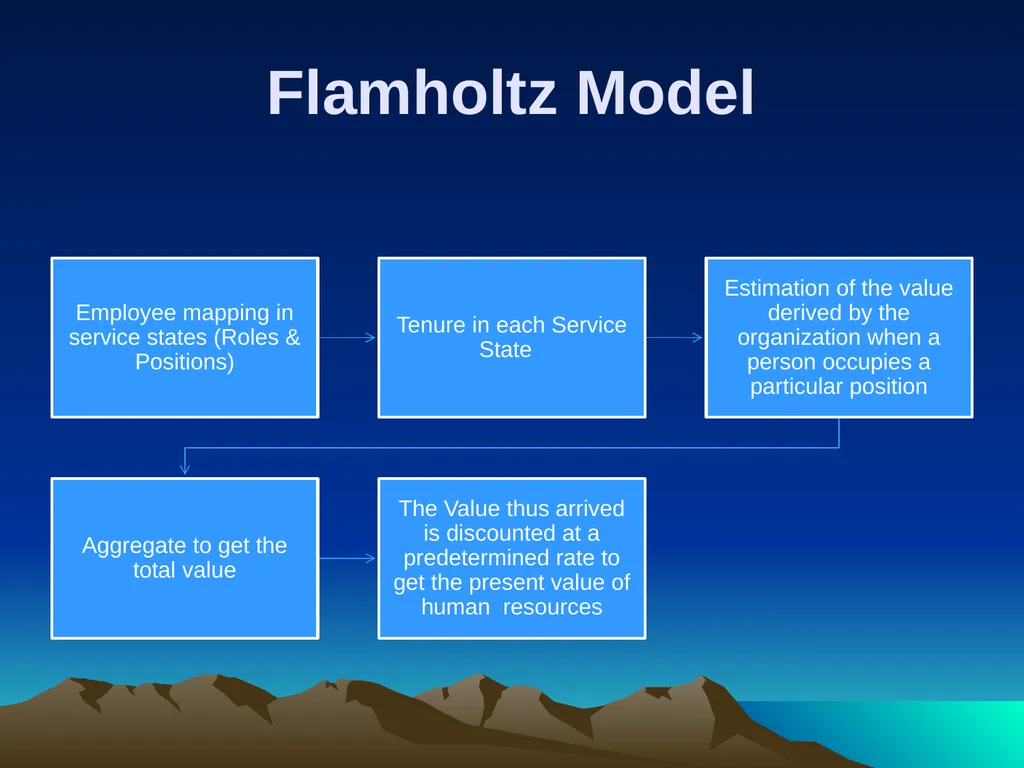
Flamholtz Model<br>
49
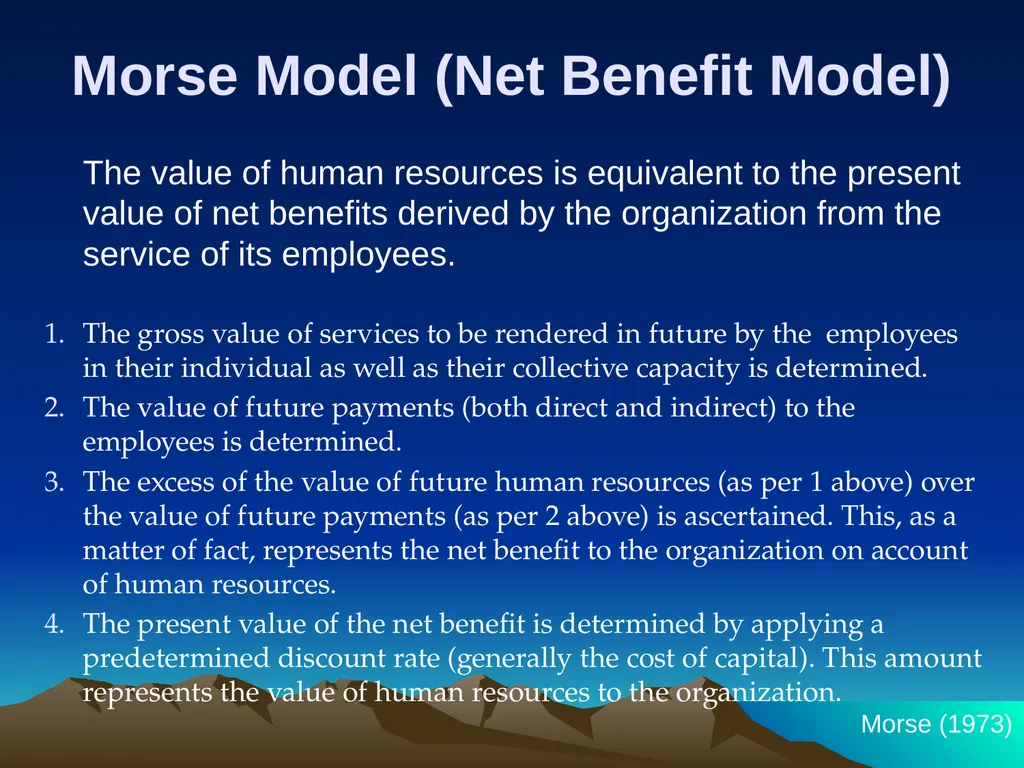
Morse Model (Net Benefit Model) The value of human resources is equivalent to the present value of net benefits derived by the organization from the service of its employees.
The gross value of services to be rendered in future by the employees in their individual as well as their collective capacity is determined.
The value of future payments (both direct and indirect) to the employees is determined.
The excess of the value of future human resources (as per 1 above) over the value of future payments (as per 2 above) is ascertained. This, as a matter of fact, represents the net benefit to the organization on account of human resources.
The present value of the net benefit is determined by applying a predetermined discount rate (generally the cost of capital). This amount represents the value of human resources to the organization. Morse (1973)<br>
The gross value of services to be rendered in future by the employees in their individual as well as their collective capacity is determined.
The value of future payments (both direct and indirect) to the employees is determined.
The excess of the value of future human resources (as per 1 above) over the value of future payments (as per 2 above) is ascertained. This, as a matter of fact, represents the net benefit to the organization on account of human resources.
The present value of the net benefit is determined by applying a predetermined discount rate (generally the cost of capital). This amount represents the value of human resources to the organization. Morse (1973)<br>
50
Human Capital Measures
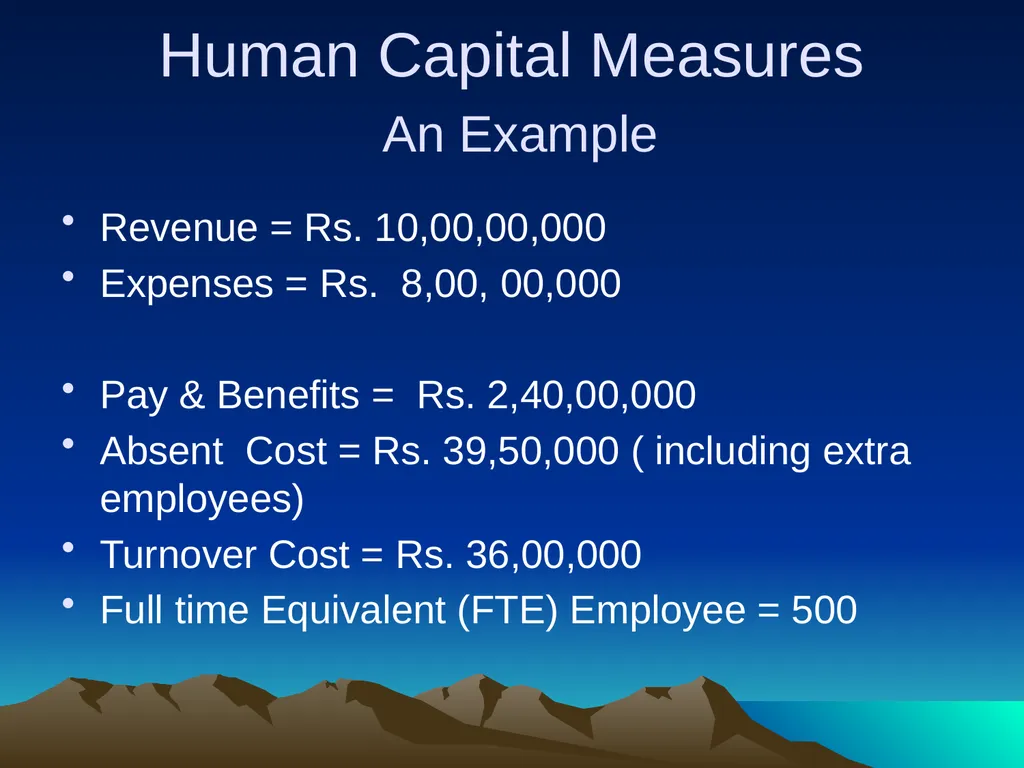
An Example Revenue = Rs. 10,00,00,000
Expenses = Rs. 8,00, 00,000
Pay & Benefits = Rs. 2,40,00,000
Absent Cost = Rs. 39,50,000 ( including extra employees)
Turnover Cost = Rs. 36,00,000
Full time Equivalent (FTE) Employee = 500<br>
Expenses = Rs. 8,00, 00,000
Pay & Benefits = Rs. 2,40,00,000
Absent Cost = Rs. 39,50,000 ( including extra employees)
Turnover Cost = Rs. 36,00,000
Full time Equivalent (FTE) Employee = 500<br>
51
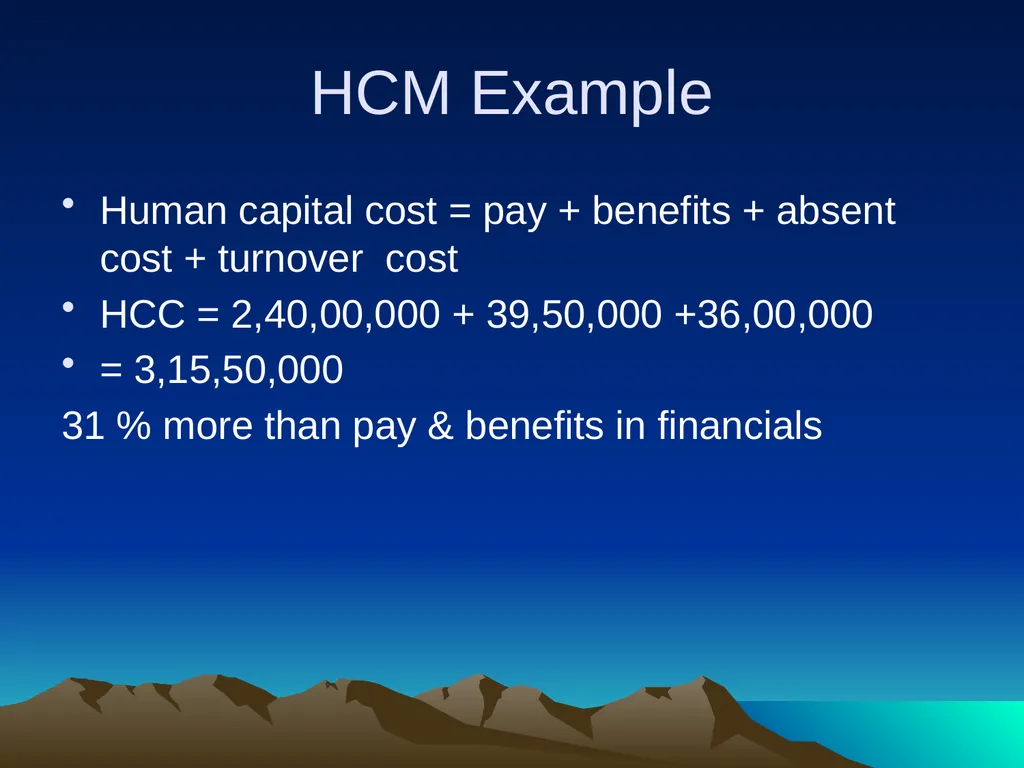
HCM Example Human capital cost = pay + benefits + absent cost + turnover cost
HCC = 2,40,00,000 + 39,50,000 +36,00,000
= 3,15,50,000
31 % more than pay & benefits in financials<br>
HCC = 2,40,00,000 + 39,50,000 +36,00,000
= 3,15,50,000
31 % more than pay & benefits in financials<br>
52
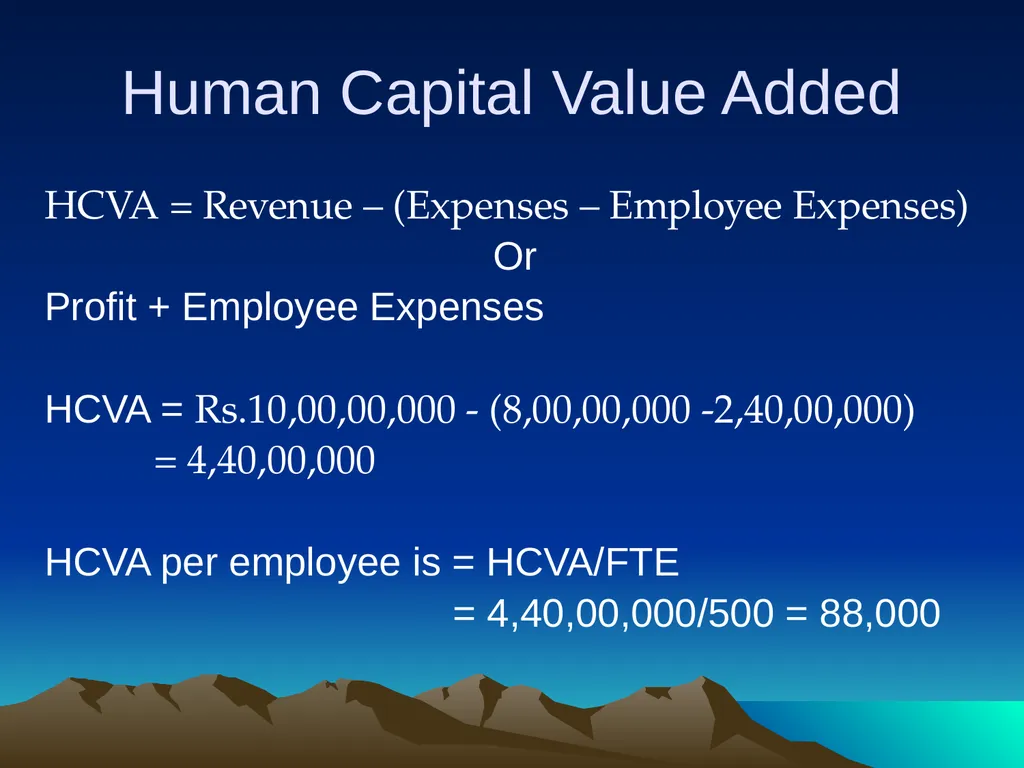
Human Capital Value Added HCVA = Revenue – (Expenses – Employee Expenses)
Or
Profit + Employee Expenses
HCVA = Rs.10,00,00,000 - (8,00,00,000 -2,40,00,000)
= 4,40,00,000
HCVA per employee is = HCVA/FTE
= 4,40,00,000/500 = 88,000<br>
Or
Profit + Employee Expenses
HCVA = Rs.10,00,00,000 - (8,00,00,000 -2,40,00,000)
= 4,40,00,000
HCVA per employee is = HCVA/FTE
= 4,40,00,000/500 = 88,000<br>
53
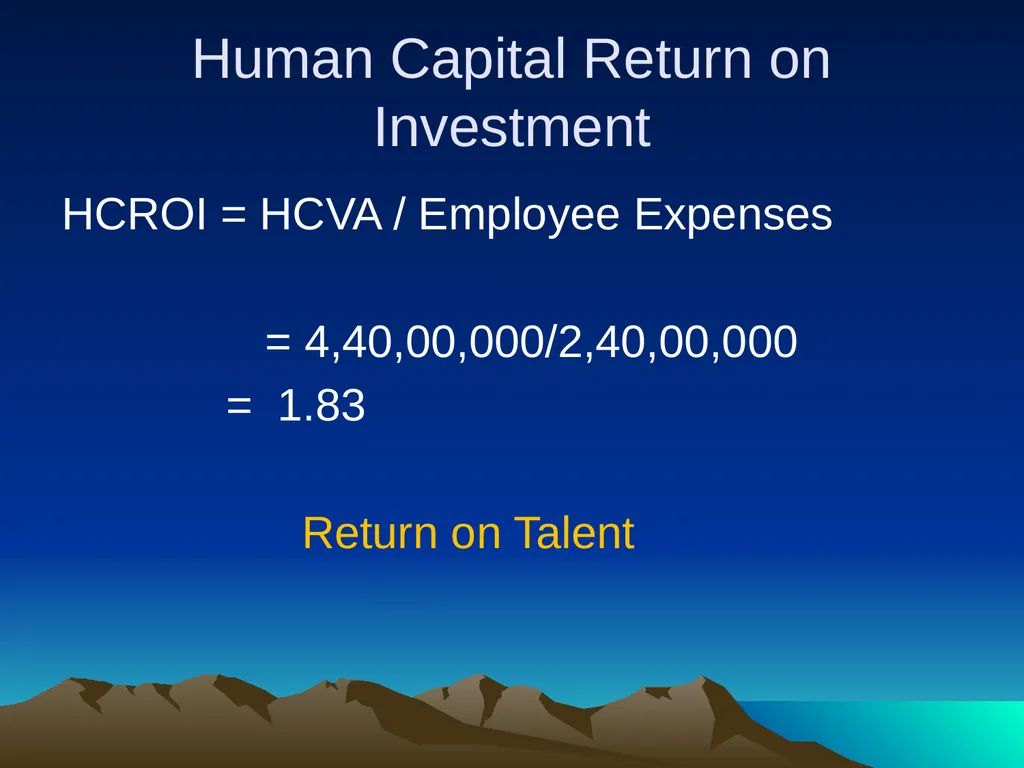
Human Capital Return on Investment HCROI = HCVA / Employee Expenses
= 4,40,00,000/2,40,00,000
= 1.83
Return on Talent<br>
= 4,40,00,000/2,40,00,000
= 1.83
Return on Talent<br>
54
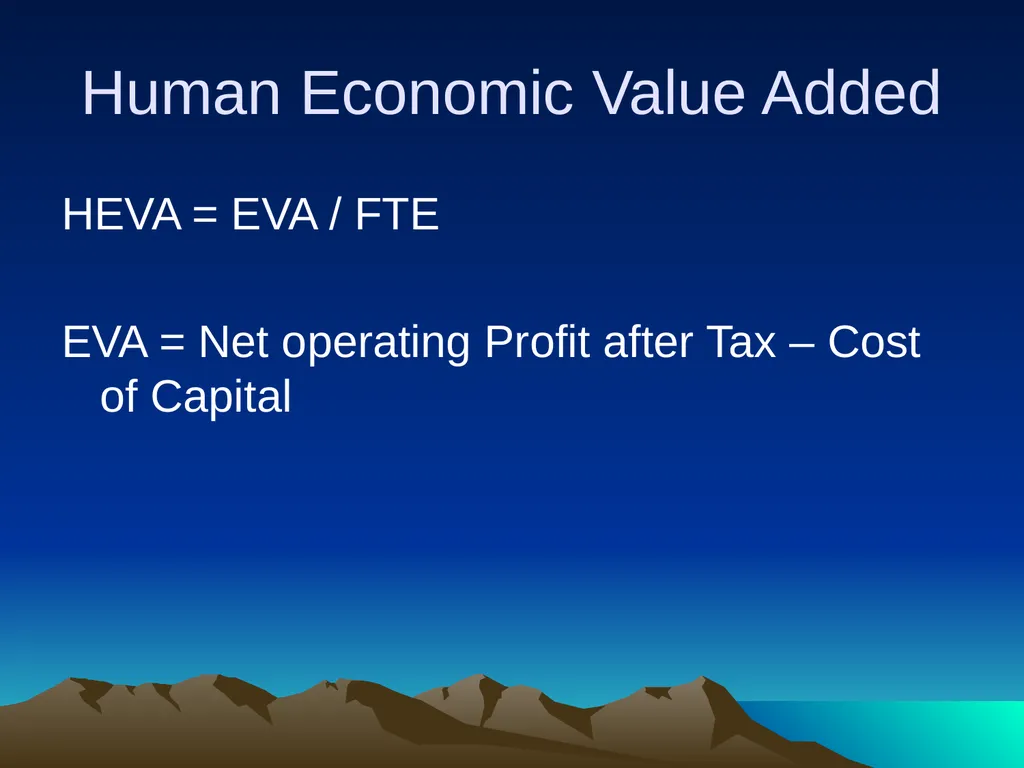
Human Economic Value Added HEVA = EVA / FTE
EVA = Net operating Profit after Tax – Cost of Capital<br>
EVA = Net operating Profit after Tax – Cost of Capital<br>
55
Dr. Shital Jhunjhunwala 57 How do we measure it ?
Who should focus on Intangibles?<br>
56
Thank You<br>
57
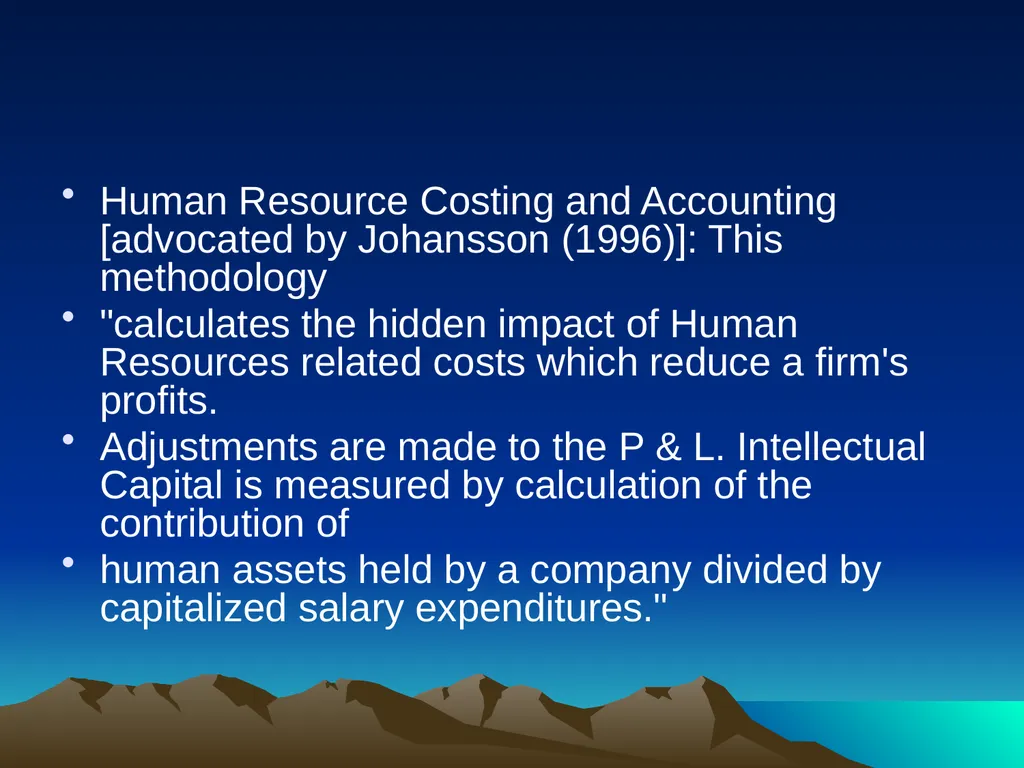
Human Resource Costing and Accounting [advocated by Johansson (1996)]: This methodology
"calculates the hidden impact of Human Resources related costs which reduce a firm's profits.
Adjustments are made to the P & L. Intellectual Capital is measured by calculation of the contribution of
human assets held by a company divided by capitalized salary expenditures."<br>
"calculates the hidden impact of Human Resources related costs which reduce a firm's profits.
Adjustments are made to the P & L. Intellectual Capital is measured by calculation of the contribution of
human assets held by a company divided by capitalized salary expenditures."<br>
58
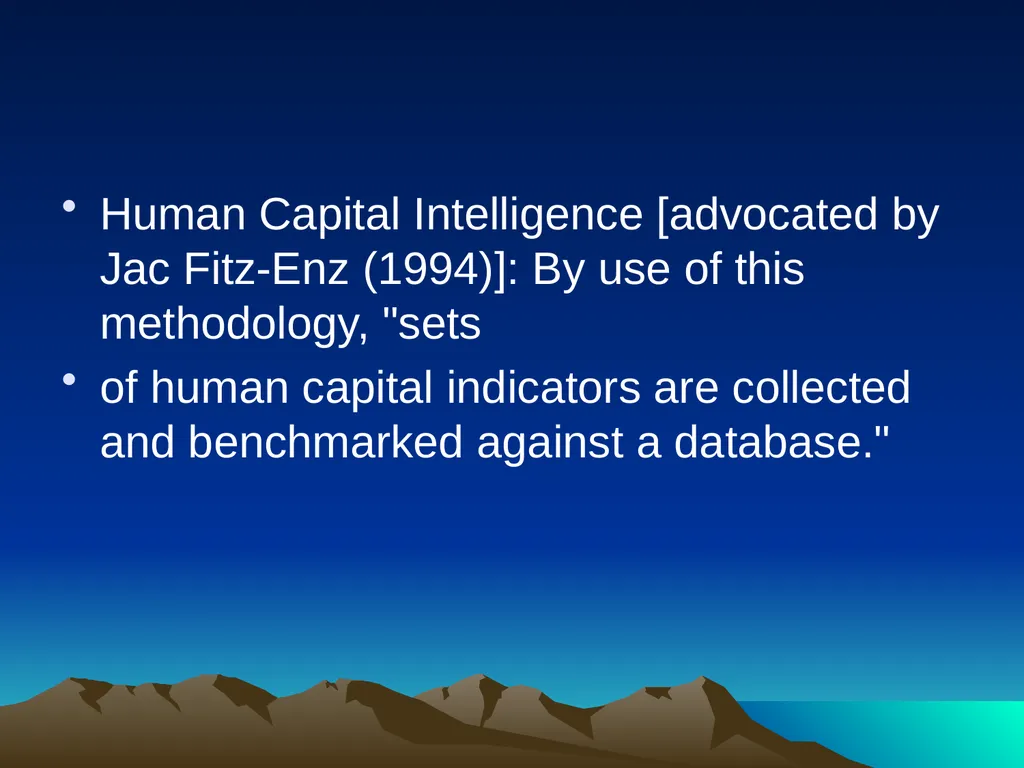
Human Capital Intelligence [advocated by Jac Fitz‐Enz (1994)]: By use of this methodology, "sets
of human capital indicators are collected and benchmarked against a database."<br>
of human capital indicators are collected and benchmarked against a database."<br>
59
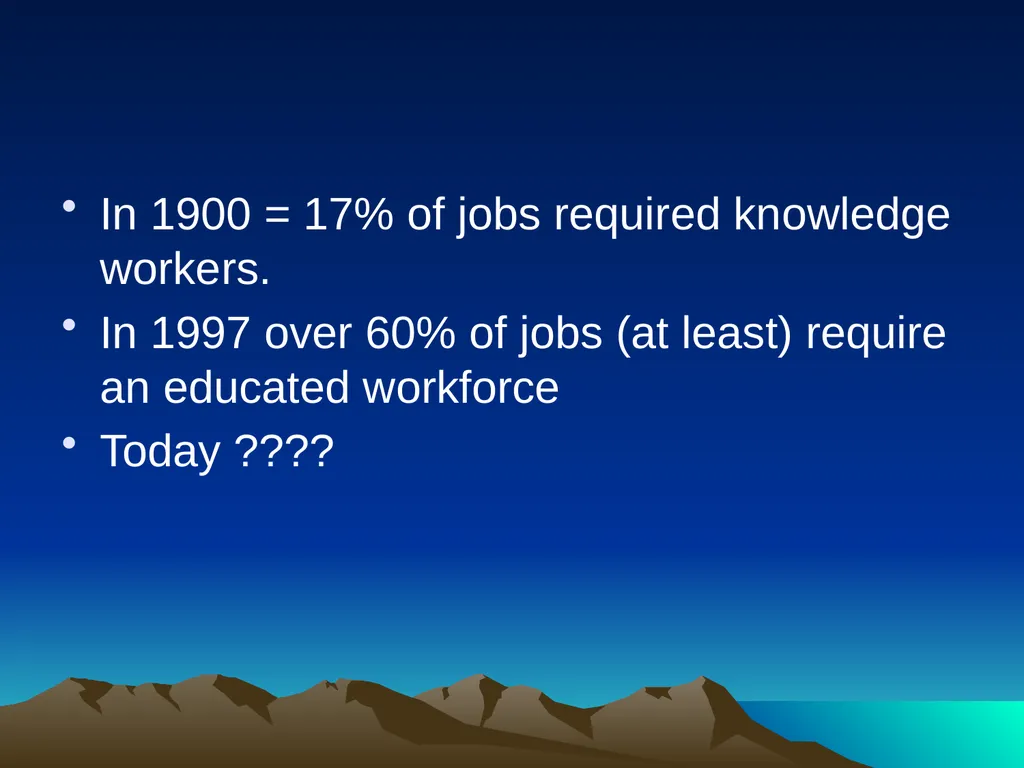
In 1900 = 17% of jobs required knowledge workers.
In 1997 over 60% of jobs (at least) require an educated workforce
Today ????<br>
In 1997 over 60% of jobs (at least) require an educated workforce
Today ????<br>