04
Null Hypothesis What is the Null Hypothesis?<br>
05
Null Hypothesis The case when the two groups are equal; population means are the same
Null Hypothesis = H0
This is the hypothesis actually being tested
H0 is assumed to be true<br>
06
Alternative Hypothesis What is the Alternative Hypothesis?<br>
07
Alternative Hypothesis The case when the two groups are not equal; when there is some treatment difference; when other possibilities exist
Alternative Hypothesis = H1 Or Ha
H1 is assumed to be true when the H0 is false.<br>
08
Statistical Hypotheses The H0 and H1 must be mutually exclusive
The H0 and H1 must be exhaustive; that is, no other possibilities can exist
The H1 contains our research hypotheses<br>
09
Statistical Hypotheses Can you give an example of a Null and Alternative Hypothesis?<br>
10
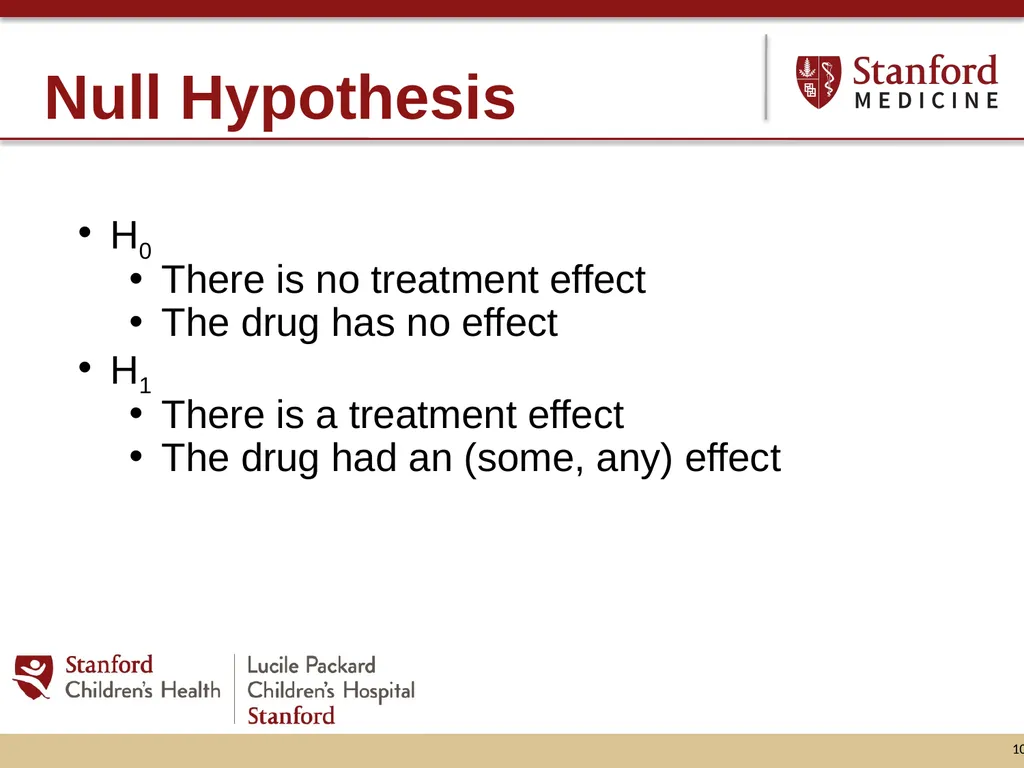
Null Hypothesis H0
There is no treatment effect
The drug has no effect
H1
There is a treatment effect
The drug had an (some, any) effect<br>
11
Evaluation of the Null In order to gain support for our research hypothesis, we must reject the Null Hypothesis
Thereby concluding that the alternative hypothesis (likely) reflects what is going on in the population.
You can never “prove” the Alternative Hypothesis!<br>
12
Significance Level Need to decide on a Significance Level:
The probability that the test statistic will reject the null hypothesis when the null hypothesis is true
Significance is a property of the distribution of a test statistic, not of any particular draw of the statistic
Determines the Region of Rejection
Generally 5% or 1%<br>
13
Alpha Level The value of alpha (α) is associated with the confidence level of our test; significance level.
For results with a 90% level of confidence, the value of α is 1 - 0.90 = 0.10.
For results with a 95% level of confidence, the value of alpha is 1 - 0.95 = 0.05.
Typically set at 5% (.05) or 1% (.01)<br>
14
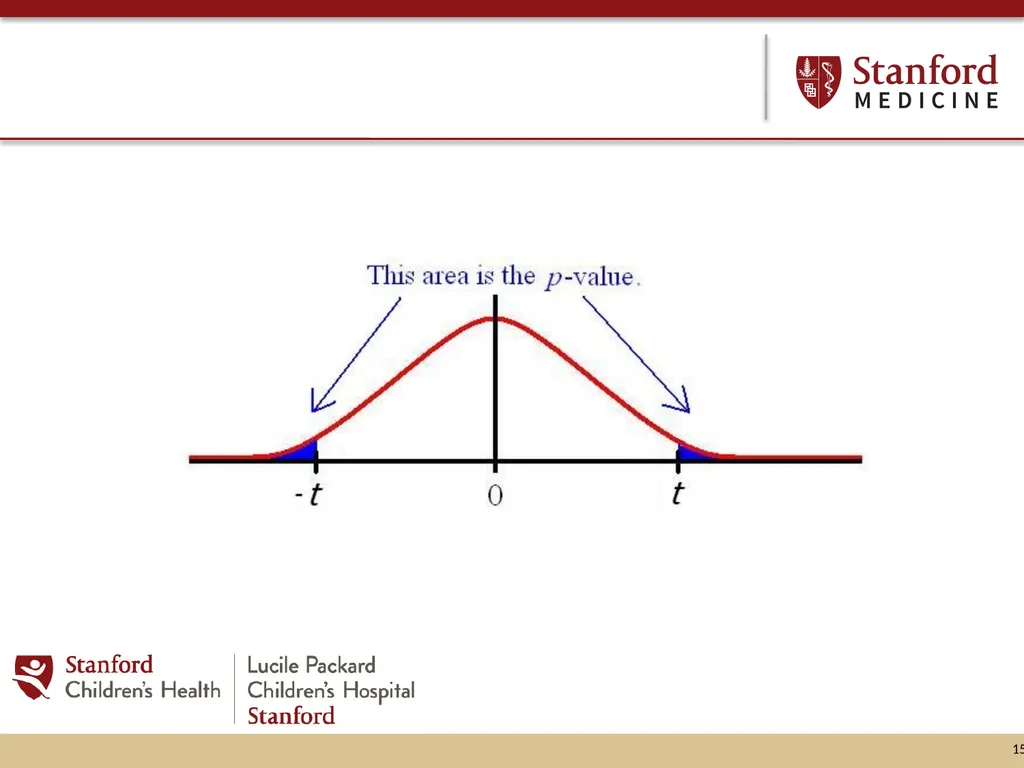
p-value The p-value, or calculated probability, is the estimated probability of rejecting the null hypothesis (H0) of a study question when that hypothesis is true
Probability that the observed statistic occurred by chance alone<br>
15
Obtaining Significance Compare the values of alpha and the p-value. There are two possibilities that emerge:
The p-value is less than or equal to alpha (e.g., p < .05). In this case we reject the null hypothesis. When this happens we say that the result is statistically significant. In other words, we are reasonably sure that there is something besides chance alone that gave us an observed sample.
The p-value is greater than alpha (e.g., p > .05). In this case we fail to reject the H0. Therefore, not statistically significant. Observed data are likely due to chance alone.<br>
16
Error In an ideal world we would always reject the null hypothesis when it is false, and we would not reject the null hypothesis when it is indeed true. But there are two other scenarios that are possible, each of which will result in an error
Type I and Type II Errors<br>
17
Type I Error Rejection of the null hypothesis that is actually true
Same as a “false positive”
The alpha value gives us the probability of a Type I error.
For example, α = .05 = 5% chance of rejecting a true null hypothesis<br>
18
Type I Error Example:
H0 = drug has no effect
H1 = drug has an effect
Reject H0 and instead claim H1 is correct, so claim that the drug has an effect when indeed it does not.
Therefore the drug is falsely claimed to have an effect.<br>
19
Controlling Type I Error Alpha is the maximum probability of having a Type I error.
E.g., 95% CI, chance of having a Type I is 5%
Therefore, a 5% chance of rejecting H0 when H0 is true
That is, 1 out of 20 hypotheses tested will result in Type I error
We can control Type I error by setting a different α level.<br>
20
Controlling Type I Error Particularly important to change α level to be more conservative if calculating several statistical tests and comparisons.
We have a 5% chance of getting a significant result just by chance. So, if running 10 comparisons, should set a more conservative α level to control for Type I error
Bonferroni correction: .05/10 = .005 α<br>
21
Type II Error We do not reject a null hypothesis that is false.
Like a false negative
E.g., thought the drug had no effect, when it actually did
The probability of a Type II error is given by the Greek letter beta (β). This number is related to the power or sensitivity of the hypothesis test, denoted by 1 – β<br>
22
Controlling Type II Error: Power Power: The power of a test sometimes, less formally, refers to the probability of rejecting the null when it is not correct.
Power = P(reject H0|H1 is true) = P(accept H1|H1 is true)
As the power increases, the chances of a Type II error (false negative; β) decreases.
Power = 1-β
Power increases with sample size<br>
23
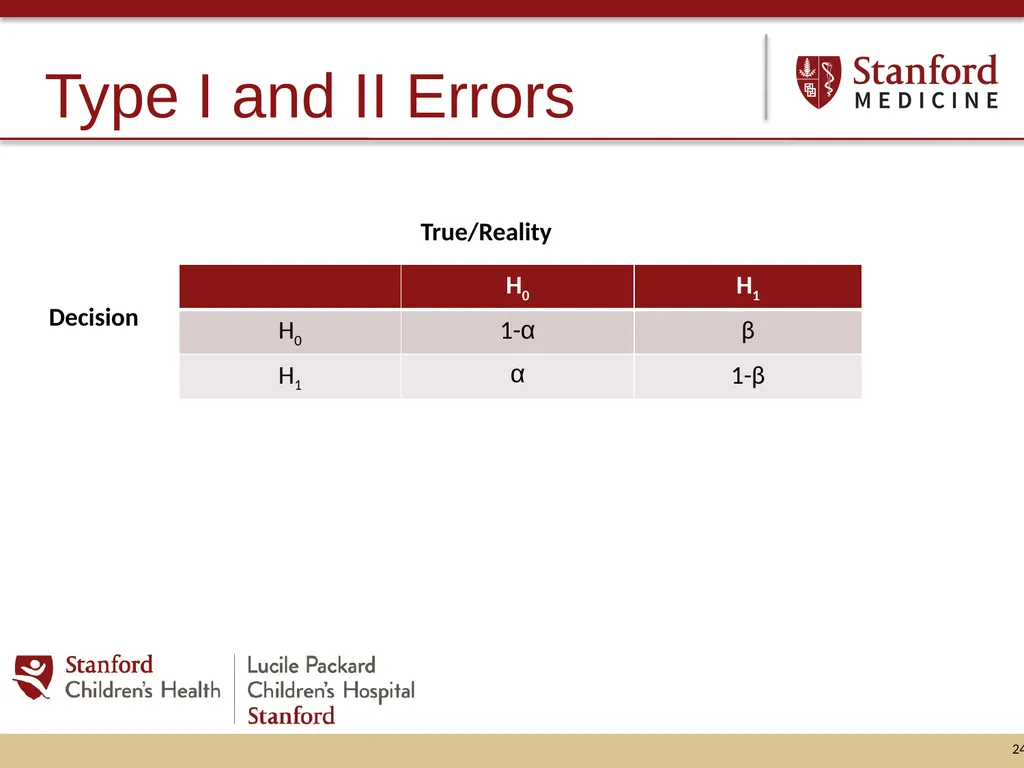
Type I and II Errors True/Reality Decision<br>
24
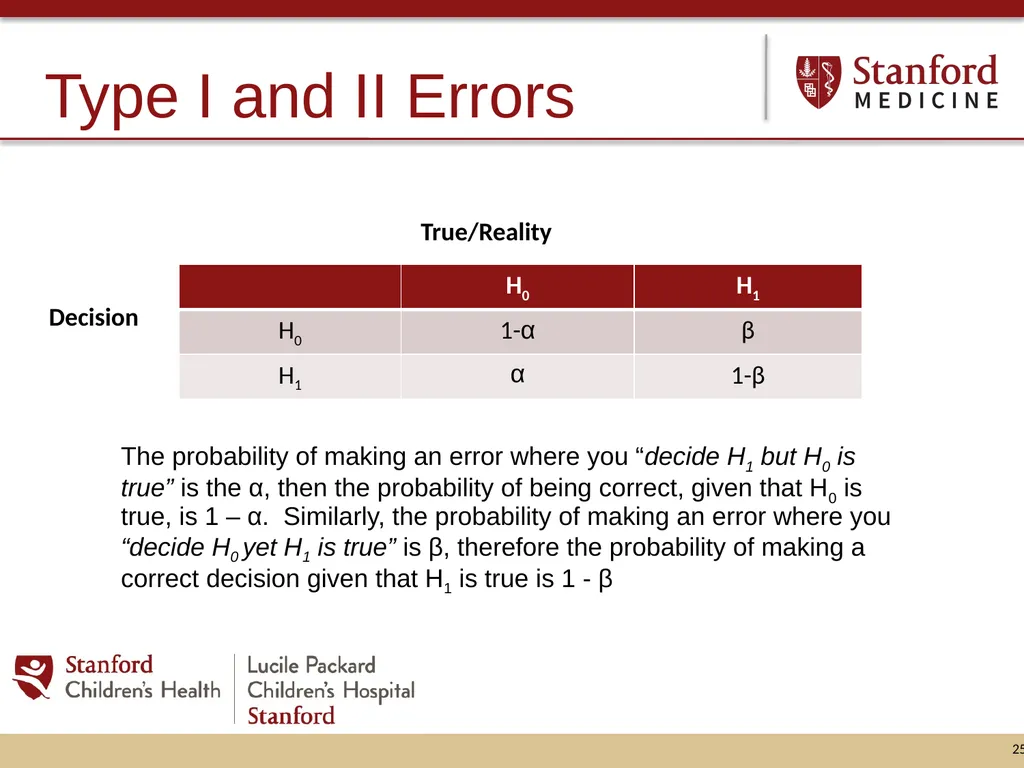
Type I and II Errors True/Reality Decision The probability of making an error where you “decide H1 but H0 is true” is the α, then the probability of being correct, given that H0 is true, is 1 – α. Similarly, the probability of making an error where you “decide H0 yet H1 is true” is β, therefore the probability of making a correct decision given that H1 is true is 1 - β<br>