
ICH M10: Bioanalytical Method Validation and Study
T
Published · 76 slides · 0 views
1 / 1









Description
ICH M10: Bioanalytical Method Validation and Study Sample Analysis ICH M10 Expert Working Group 27 January 2024 International Council for Harmonisation of Technical Requirements for Pharmaceuticals for Human Use Training Material Legal
Related Topics
Share
Embed code
Download this presentation From Below
"ICH M10: Bioanalytical Method Validation and Study" is the property of its rightful owner. Permission is granted to download and print the materials on this website for personal, non-commercial use only, and to display it on your personal computer provided you do not modify the materials and that you retain all copyright notices contained in the materials. By downloading content from our website, you accept the terms of this agreement.
Presentation Transcript
01
ICH M10:
Bioanalytical Method Validation and Study Sample Analysis ICH M10 Expert Working Group
27 January 2024 International Council for Harmonisation of Technical Requirements
for Pharmaceuticals for Human Use Training Material<br>
Bioanalytical Method Validation and Study Sample Analysis ICH M10 Expert Working Group
27 January 2024 International Council for Harmonisation of Technical Requirements
for Pharmaceuticals for Human Use Training Material<br>
02
Legal Notice This presentation is protected by copyright and may, with the exception of the ICH logo, be used, reproduced, incorporated into other works, adapted, modified, translated or distributed under a public license provided that ICH's copyright in the presentation is acknowledged at all times. In case of any adaption, modification or translation of the presentation, reasonable steps must be taken to clearly label, demarcate or otherwise identify that changes were made to or based on the original presentation. Any impression that the adaption, modification or translation of the original presentation is endorsed or sponsored by the ICH must be avoided.
The presentation is provided "as is" without warranty of any kind. In no event shall the ICH or the authors of the original presentation be liable for any claim, damages or other liability arising from the use of the presentation.
The above-mentioned permissions do not apply to content supplied by third parties. Therefore, for documents where the copyright vests in a third party, permission for reproduction must be obtained from this copyright holder. ICH M10: Bioanalytical Method Validation and Study Sample Analysis - Training Material<br>
The presentation is provided "as is" without warranty of any kind. In no event shall the ICH or the authors of the original presentation be liable for any claim, damages or other liability arising from the use of the presentation.
The above-mentioned permissions do not apply to content supplied by third parties. Therefore, for documents where the copyright vests in a third party, permission for reproduction must be obtained from this copyright holder. ICH M10: Bioanalytical Method Validation and Study Sample Analysis - Training Material<br>
03
Background These slides contain examples to illustrate certain aspects of ICH M10 Guideline or to provide answers to questions about specific aspects of the Guideline.
The examples provide one way of responding to an issue. However, other approaches or solutions may also be possible.
For a detailed description of method validation, refer to ICH M10 for details. ICH M10: Bioanalytical Method Validation and Study Sample Analysis - Training Material<br>
The examples provide one way of responding to an issue. However, other approaches or solutions may also be possible.
For a detailed description of method validation, refer to ICH M10 for details. ICH M10: Bioanalytical Method Validation and Study Sample Analysis - Training Material<br>
04
Section 1:
Scope: Examples ICH M10: Bioanalytical Method Validation and Study Sample Analysis - Training Material<br>
Scope: Examples ICH M10: Bioanalytical Method Validation and Study Sample Analysis - Training Material<br>
05
Section 1 Example 1:
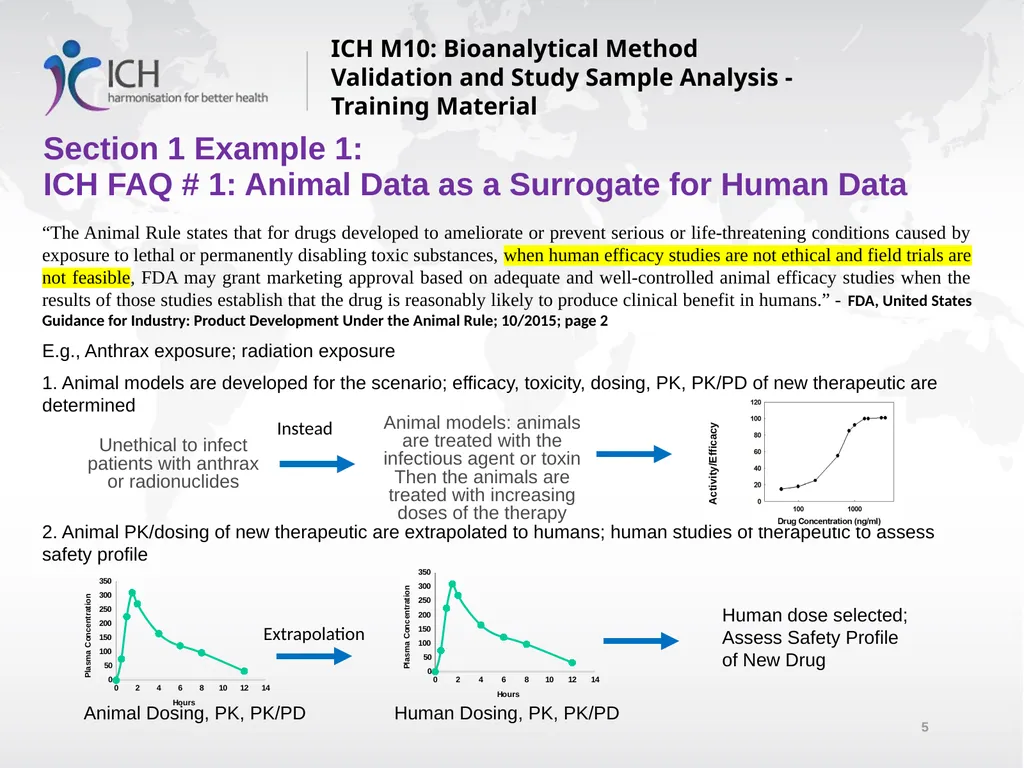
ICH FAQ # 1: Animal Data as a Surrogate for Human Data “The Animal Rule states that for drugs developed to ameliorate or prevent serious or life-threatening conditions caused by exposure to lethal or permanently disabling toxic substances, when human efficacy studies are not ethical and field trials are not feasible, FDA may grant marketing approval based on adequate and well-controlled animal efficacy studies when the results of those studies establish that the drug is reasonably likely to produce clinical benefit in humans.” - FDA, United States Guidance for Industry: Product Development Under the Animal Rule; 10/2015; page 2
E.g., Anthrax exposure; radiation exposure
1. Animal models are developed for the scenario; efficacy, toxicity, dosing, PK, PK/PD of new therapeutic are determined
2. Animal PK/dosing of new therapeutic are extrapolated to humans; human studies of therapeutic to assess safety profile
Animal Dosing, PK, PK/PD Human Dosing, PK, PK/PD ICH M10: Bioanalytical Method Validation and Study Sample Analysis - Training Material Instead Extrapolation Human dose selected; Assess Safety Profile of New Drug Unethical to infect patients with anthrax or radionuclides Animal models: animals are treated with the infectious agent or toxin
Then the animals are treated with increasing doses of the therapy Activity/Efficacy<br>
E.g., Anthrax exposure; radiation exposure
1. Animal models are developed for the scenario; efficacy, toxicity, dosing, PK, PK/PD of new therapeutic are determined
2. Animal PK/dosing of new therapeutic are extrapolated to humans; human studies of therapeutic to assess safety profile
Animal Dosing, PK, PK/PD Human Dosing, PK, PK/PD ICH M10: Bioanalytical Method Validation and Study Sample Analysis - Training Material Instead Extrapolation Human dose selected; Assess Safety Profile of New Drug Unethical to infect patients with anthrax or radionuclides Animal models: animals are treated with the infectious agent or toxin
Then the animals are treated with increasing doses of the therapy Activity/Efficacy<br>
06
Section 2
General Principles: Examples ICH M10: Bioanalytical Method Validation and Study Sample Analysis - Training Material<br>
General Principles: Examples ICH M10: Bioanalytical Method Validation and Study Sample Analysis - Training Material<br>
07
Section 2 Example 1 Method Development:
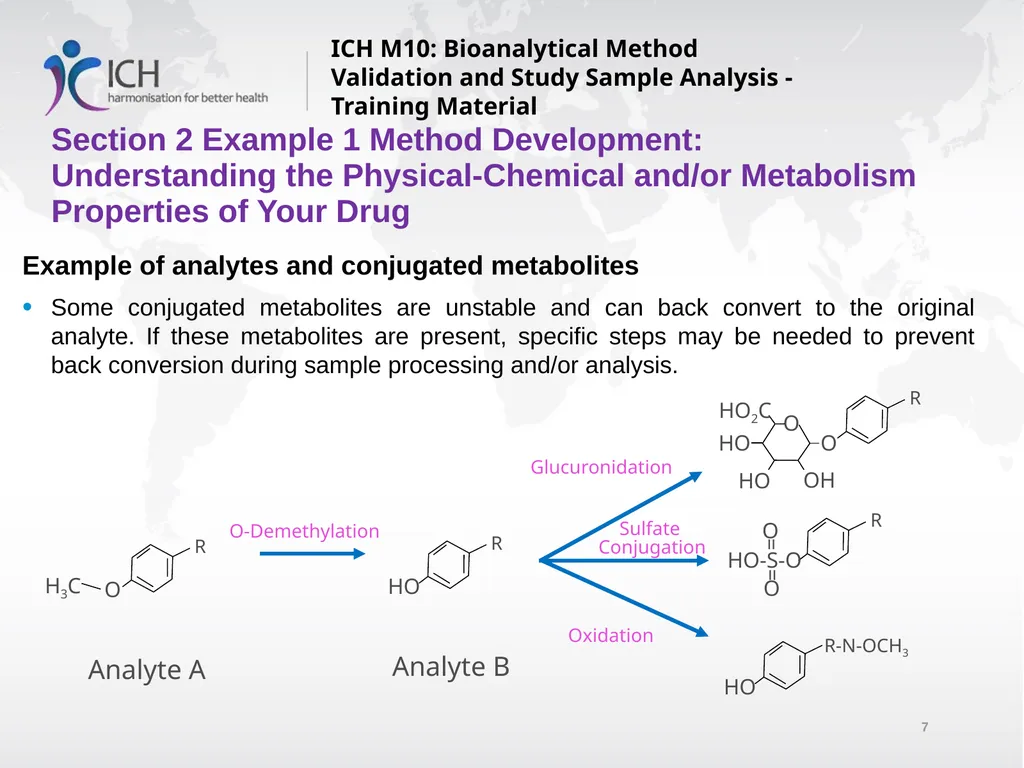
Understanding the Physical-Chemical and/or Metabolism Properties of Your Drug Example of analytes and conjugated metabolites
Some conjugated metabolites are unstable and can back convert to the original analyte. If these metabolites are present, specific steps may be needed to prevent back conversion during sample processing and/or analysis. ICH M10: Bioanalytical Method Validation and Study Sample Analysis - Training Material O-Demethylation Glucuronidation Sulfate
Conjugation Oxidation Analyte A Analyte B<br>
Some conjugated metabolites are unstable and can back convert to the original analyte. If these metabolites are present, specific steps may be needed to prevent back conversion during sample processing and/or analysis. ICH M10: Bioanalytical Method Validation and Study Sample Analysis - Training Material O-Demethylation Glucuronidation Sulfate
Conjugation Oxidation Analyte A Analyte B<br>
08
Section 2 Example 2:
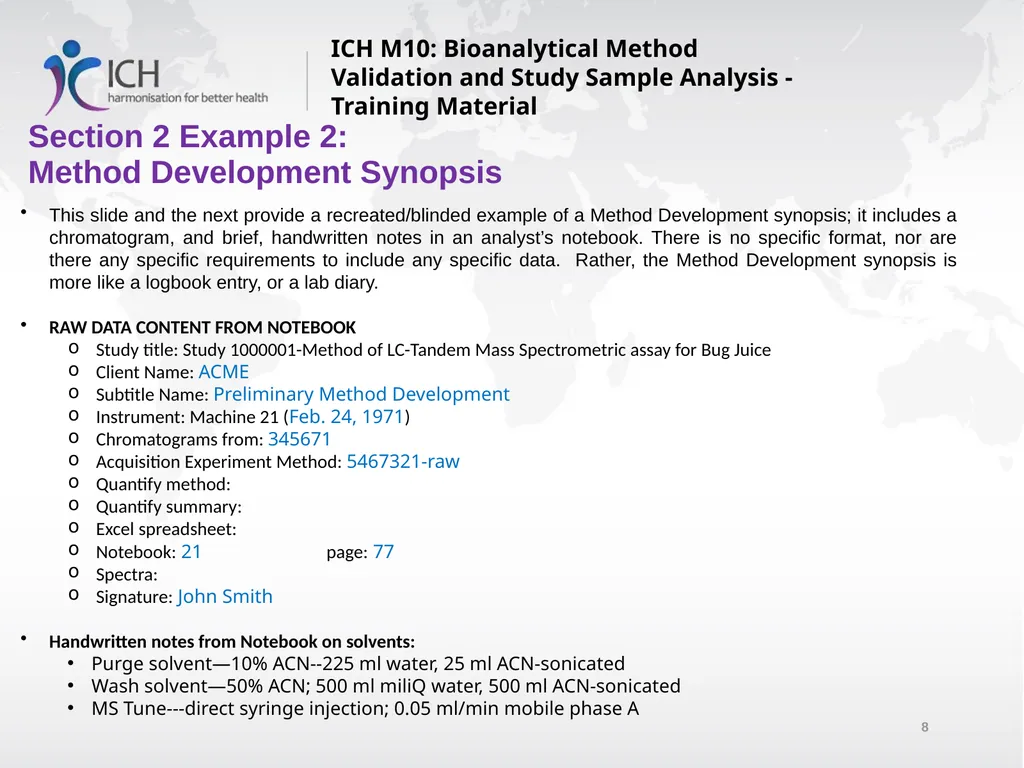
Method Development Synopsis This slide and the next provide a recreated/blinded example of a Method Development synopsis; it includes a chromatogram, and brief, handwritten notes in an analyst’s notebook. There is no specific format, nor are there any specific requirements to include any specific data. Rather, the Method Development synopsis is more like a logbook entry, or a lab diary.
RAW DATA CONTENT FROM NOTEBOOK
Study title: Study 1000001-Method of LC-Tandem Mass Spectrometric assay for Bug Juice
Client Name: ACME
Subtitle Name: Preliminary Method Development
Instrument: Machine 21 (Feb. 24, 1971)
Chromatograms from: 345671
Acquisition Experiment Method: 5467321-raw
Quantify method:
Quantify summary:
Excel spreadsheet:
Notebook: 21 page: 77
Spectra:
Signature: John Smith
Handwritten notes from Notebook on solvents:
Purge solvent—10% ACN--225 ml water, 25 ml ACN-sonicated
Wash solvent—50% ACN; 500 ml miliQ water, 500 ml ACN-sonicated
MS Tune---direct syringe injection; 0.05 ml/min mobile phase A ICH M10: Bioanalytical Method Validation and Study Sample Analysis - Training Material<br>
RAW DATA CONTENT FROM NOTEBOOK
Study title: Study 1000001-Method of LC-Tandem Mass Spectrometric assay for Bug Juice
Client Name: ACME
Subtitle Name: Preliminary Method Development
Instrument: Machine 21 (Feb. 24, 1971)
Chromatograms from: 345671
Acquisition Experiment Method: 5467321-raw
Quantify method:
Quantify summary:
Excel spreadsheet:
Notebook: 21 page: 77
Spectra:
Signature: John Smith
Handwritten notes from Notebook on solvents:
Purge solvent—10% ACN--225 ml water, 25 ml ACN-sonicated
Wash solvent—50% ACN; 500 ml miliQ water, 500 ml ACN-sonicated
MS Tune---direct syringe injection; 0.05 ml/min mobile phase A ICH M10: Bioanalytical Method Validation and Study Sample Analysis - Training Material<br>
09
Section 3:
Chromatography Examples ICH M10: Bioanalytical Method Validation and Study Sample Analysis - Training Material<br>
Chromatography Examples ICH M10: Bioanalytical Method Validation and Study Sample Analysis - Training Material<br>
10
Section 3 Example 1:
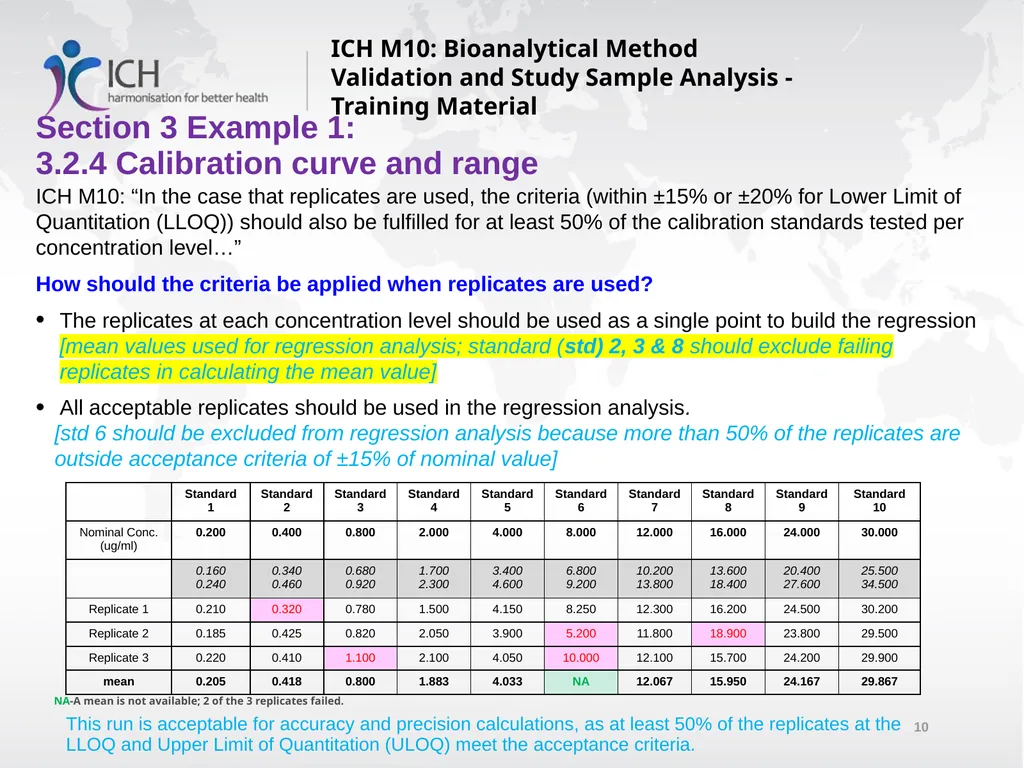
3.2.4 Calibration curve and range ICH M10: “In the case that replicates are used, the criteria (within ±15% or ±20% for Lower Limit of Quantitation (LLOQ)) should also be fulfilled for at least 50% of the calibration standards tested per concentration level…”
How should the criteria be applied when replicates are used?
The replicates at each concentration level should be used as a single point to build the regression [mean values used for regression analysis; standard (std) 2, 3 & 8 should exclude failing replicates in calculating the mean value]
All acceptable replicates should be used in the regression analysis.
[std 6 should be excluded from regression analysis because more than 50% of the replicates are outside acceptance criteria of ±15% of nominal value] ICH M10: Bioanalytical Method Validation and Study Sample Analysis - Training Material This run is acceptable for accuracy and precision calculations, as at least 50% of the replicates at the LLOQ and Upper Limit of Quantitation (ULOQ) meet the acceptance criteria. NA-A mean is not available; 2 of the 3 replicates failed.<br>
How should the criteria be applied when replicates are used?
The replicates at each concentration level should be used as a single point to build the regression [mean values used for regression analysis; standard (std) 2, 3 & 8 should exclude failing replicates in calculating the mean value]
All acceptable replicates should be used in the regression analysis.
[std 6 should be excluded from regression analysis because more than 50% of the replicates are outside acceptance criteria of ±15% of nominal value] ICH M10: Bioanalytical Method Validation and Study Sample Analysis - Training Material This run is acceptable for accuracy and precision calculations, as at least 50% of the replicates at the LLOQ and Upper Limit of Quantitation (ULOQ) meet the acceptance criteria. NA-A mean is not available; 2 of the 3 replicates failed.<br>
11
Section 3 Example 2:
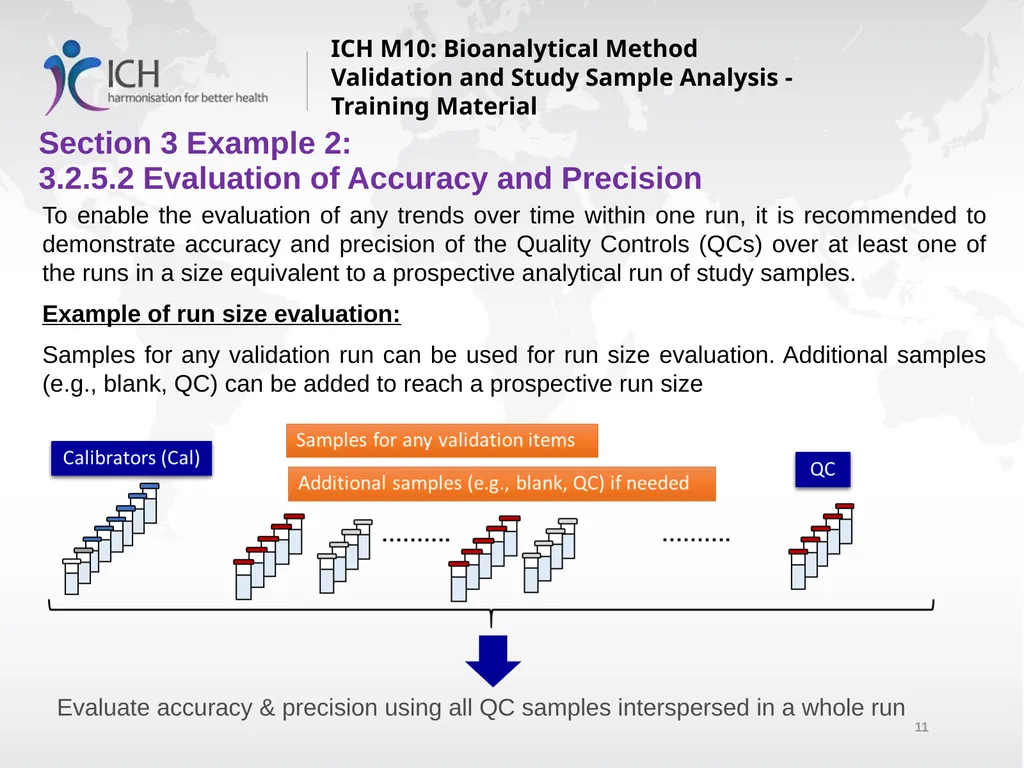
3.2.5.2 Evaluation of Accuracy and Precision To enable the evaluation of any trends over time within one run, it is recommended to demonstrate accuracy and precision of the Quality Controls (QCs) over at least one of the runs in a size equivalent to a prospective analytical run of study samples.
Example of run size evaluation:
Samples for any validation run can be used for run size evaluation. Additional samples (e.g., blank, QC) can be added to reach a prospective run size ICH M10: Bioanalytical Method Validation and Study Sample Analysis - Training Material Evaluate accuracy & precision using all QC samples interspersed in a whole run<br>
Example of run size evaluation:
Samples for any validation run can be used for run size evaluation. Additional samples (e.g., blank, QC) can be added to reach a prospective run size ICH M10: Bioanalytical Method Validation and Study Sample Analysis - Training Material Evaluate accuracy & precision using all QC samples interspersed in a whole run<br>
12
Section 3 Example 3:
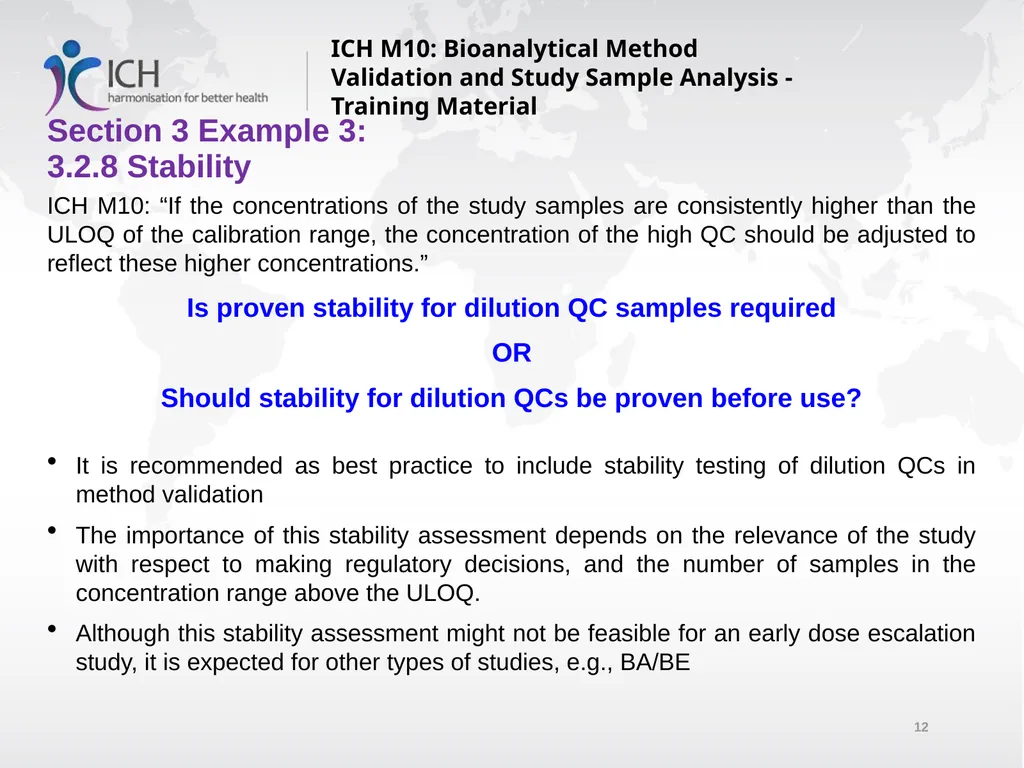
3.2.8 Stability ICH M10: Bioanalytical Method Validation and Study Sample Analysis - Training Material ICH M10: “If the concentrations of the study samples are consistently higher than the ULOQ of the calibration range, the concentration of the high QC should be adjusted to reflect these higher concentrations.”
Is proven stability for dilution QC samples required
OR
Should stability for dilution QCs be proven before use?
It is recommended as best practice to include stability testing of dilution QCs in method validation
The importance of this stability assessment depends on the relevance of the study with respect to making regulatory decisions, and the number of samples in the concentration range above the ULOQ.
Although this stability assessment might not be feasible for an early dose escalation study, it is expected for other types of studies, e.g., BA/BE<br>
Is proven stability for dilution QC samples required
OR
Should stability for dilution QCs be proven before use?
It is recommended as best practice to include stability testing of dilution QCs in method validation
The importance of this stability assessment depends on the relevance of the study with respect to making regulatory decisions, and the number of samples in the concentration range above the ULOQ.
Although this stability assessment might not be feasible for an early dose escalation study, it is expected for other types of studies, e.g., BA/BE<br>
13
Section 3 Example 4:
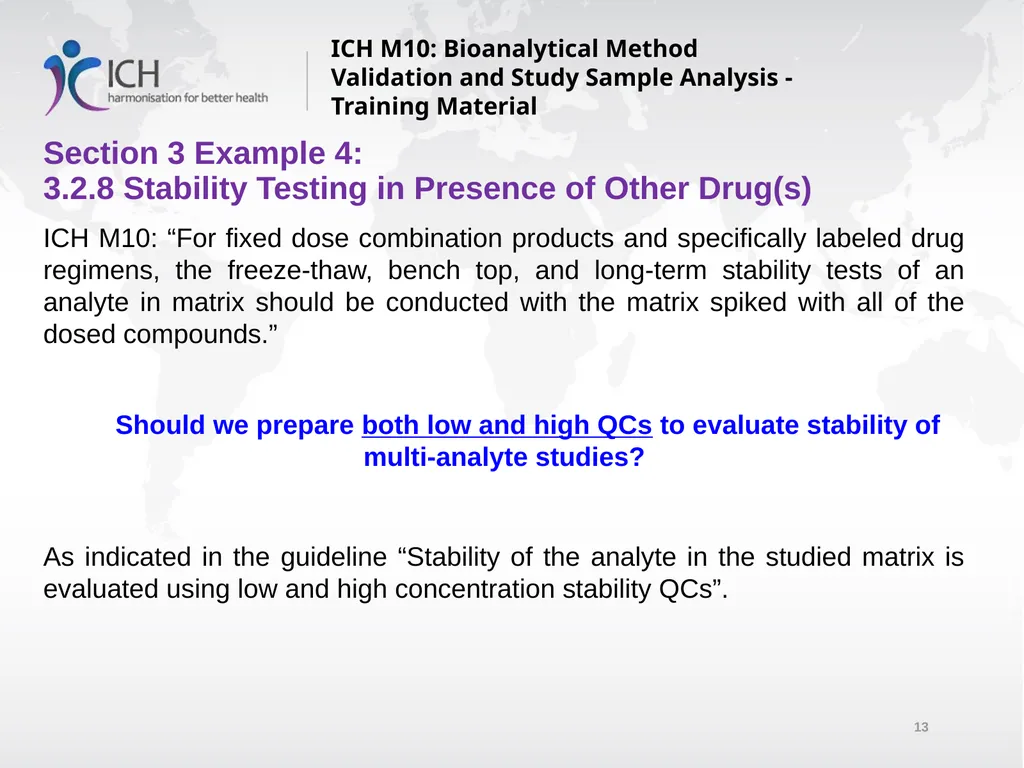
3.2.8 Stability Testing in Presence of Other Drug(s) ICH M10: Bioanalytical Method Validation and Study Sample Analysis - Training Material ICH M10: “For fixed dose combination products and specifically labeled drug regimens, the freeze-thaw, bench top, and long-term stability tests of an analyte in matrix should be conducted with the matrix spiked with all of the dosed compounds.”
Should we prepare both low and high QCs to evaluate stability of multi-analyte studies?
As indicated in the guideline “Stability of the analyte in the studied matrix is evaluated using low and high concentration stability QCs”.<br>
Should we prepare both low and high QCs to evaluate stability of multi-analyte studies?
As indicated in the guideline “Stability of the analyte in the studied matrix is evaluated using low and high concentration stability QCs”.<br>
14
Section 3 Example 5:
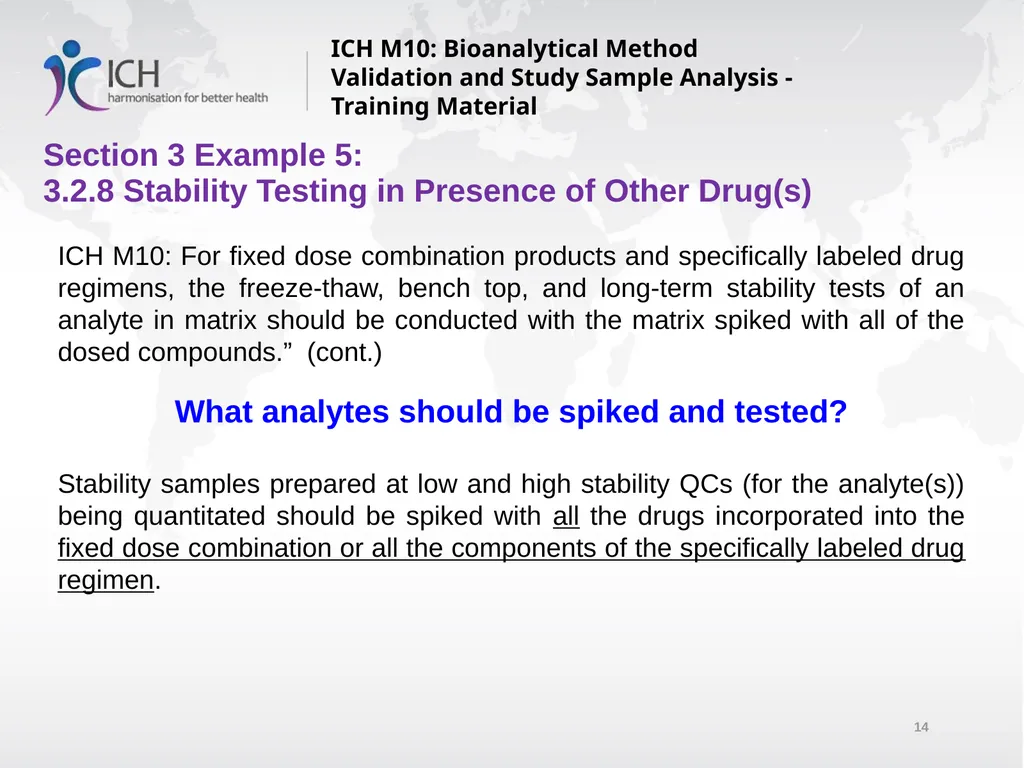
3.2.8 Stability Testing in Presence of Other Drug(s) ICH M10: Bioanalytical Method Validation and Study Sample Analysis - Training Material ICH M10: For fixed dose combination products and specifically labeled drug regimens, the freeze-thaw, bench top, and long-term stability tests of an analyte in matrix should be conducted with the matrix spiked with all of the dosed compounds.” (cont.)
What analytes should be spiked and tested?
Stability samples prepared at low and high stability QCs (for the analyte(s)) being quantitated should be spiked with all the drugs incorporated into the fixed dose combination or all the components of the specifically labeled drug regimen.<br>
What analytes should be spiked and tested?
Stability samples prepared at low and high stability QCs (for the analyte(s)) being quantitated should be spiked with all the drugs incorporated into the fixed dose combination or all the components of the specifically labeled drug regimen.<br>
15
Section 3 Example 6:
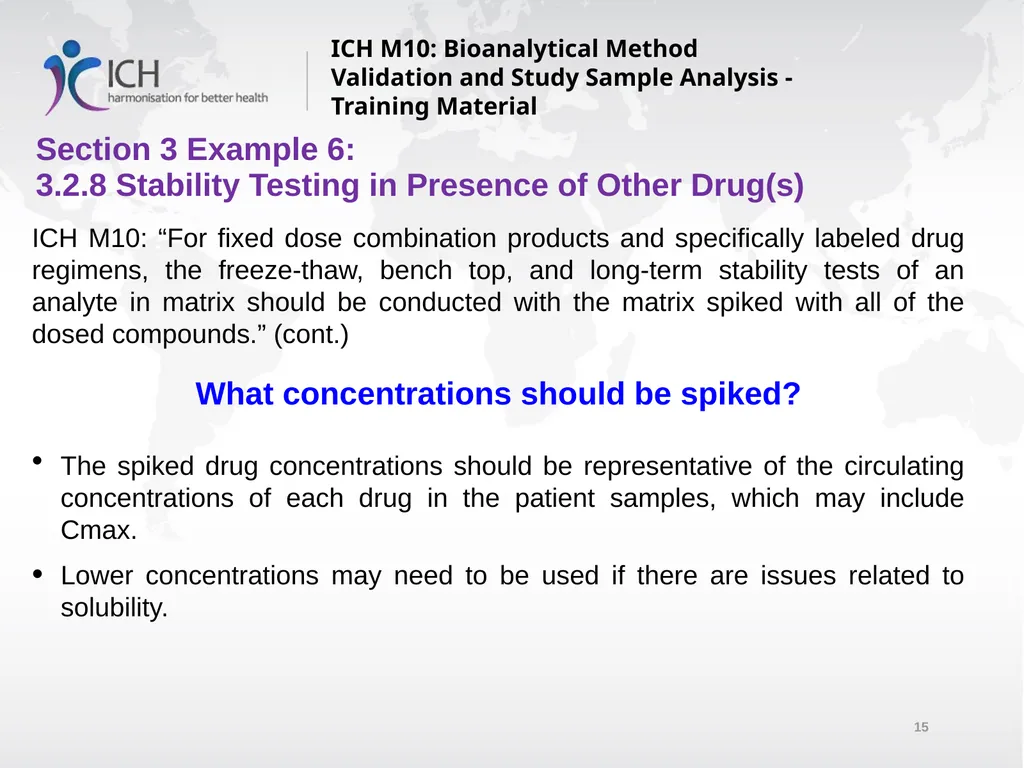
3.2.8 Stability Testing in Presence of Other Drug(s) ICH M10: Bioanalytical Method Validation and Study Sample Analysis - Training Material ICH M10: “For fixed dose combination products and specifically labeled drug regimens, the freeze-thaw, bench top, and long-term stability tests of an analyte in matrix should be conducted with the matrix spiked with all of the dosed compounds.” (cont.)
What concentrations should be spiked?
The spiked drug concentrations should be representative of the circulating concentrations of each drug in the patient samples, which may include Cmax.
Lower concentrations may need to be used if there are issues related to solubility.<br>
What concentrations should be spiked?
The spiked drug concentrations should be representative of the circulating concentrations of each drug in the patient samples, which may include Cmax.
Lower concentrations may need to be used if there are issues related to solubility.<br>
16
Section 3 Example 7:
3.2.8 Stability Testing in Presence of Other Drug(s) ICH M10: Bioanalytical Method Validation and Study Sample Analysis - Training Material ICH M10: “For fixed dose combination products and specifically labeled drug regimens, the freeze-thaw, bench top, and long-term stability tests of an analyte in matrix should be conducted with the matrix spiked with all of the dosed compounds.” (cont.)
When do I conduct stability testing for combinations?
For fixed dose combination products, stability testing should be conducted during validation or a partial validation, like it would be done for a single drug assay.
The selection of a drug regimen is typically decided following the testing of several drug combinations during early-phase clinical trials. Therefore, conducting the combination stability experiment to support the approved drug regimen may not be possible until later in clinical development (until the registration regimen has been identified).<br>
When do I conduct stability testing for combinations?
For fixed dose combination products, stability testing should be conducted during validation or a partial validation, like it would be done for a single drug assay.
The selection of a drug regimen is typically decided following the testing of several drug combinations during early-phase clinical trials. Therefore, conducting the combination stability experiment to support the approved drug regimen may not be possible until later in clinical development (until the registration regimen has been identified).<br>
17
Section 3 Example 8:
3.2.8 Stability Testing in Presence of Other Drug(s) ICH M10: Bioanalytical Method Validation and Study Sample Analysis - Training Material ICH M10: “For fixed dose combination products and specifically labeled drug regimens, the freeze-thaw, bench top, and long-term stability tests of an analyte in matrix should be conducted with the matrix spiked with all of the dosed compounds.” (cont.)
Does stability need to be assessed for all drug combinations?
Some combination regimens could involve multiple types of drugs such as small molecule drugs and large molecule drugs (e.g., therapeutic proteins). In such situations, there may be scientific rationale to support the exclusion of some analytes (drugs) from testing.
Examples:
A new small molecule oncology drug is being administered as a labeled drug regimen in combination with an antibody drug and a platinum drug. When conducting combination stability for the small molecule drug (quantified by LC-MS/MS) the platinum drug and the antibody drug might be excluded since there may not be an interaction between the two molecules. The bioanalyst would need to provide data and rationale to support his/her conclusion.<br>
Does stability need to be assessed for all drug combinations?
Some combination regimens could involve multiple types of drugs such as small molecule drugs and large molecule drugs (e.g., therapeutic proteins). In such situations, there may be scientific rationale to support the exclusion of some analytes (drugs) from testing.
Examples:
A new small molecule oncology drug is being administered as a labeled drug regimen in combination with an antibody drug and a platinum drug. When conducting combination stability for the small molecule drug (quantified by LC-MS/MS) the platinum drug and the antibody drug might be excluded since there may not be an interaction between the two molecules. The bioanalyst would need to provide data and rationale to support his/her conclusion.<br>
18
Section 3 Example 9:
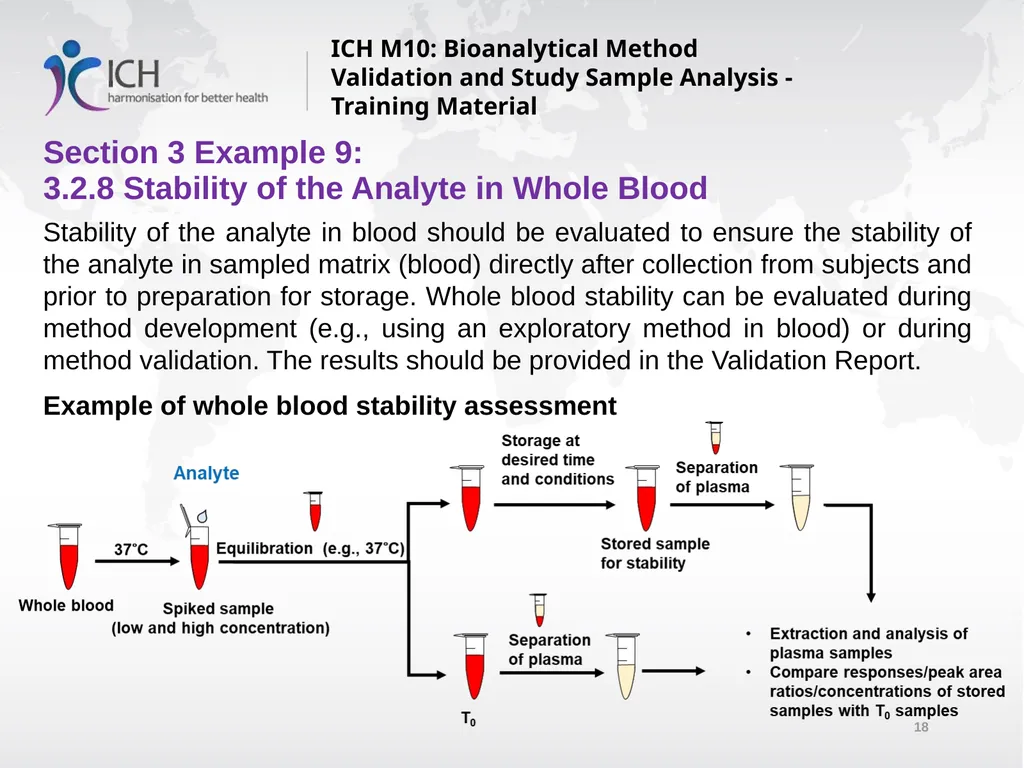
3.2.8 Stability of the Analyte in Whole Blood ICH M10: Bioanalytical Method Validation and Study Sample Analysis - Training Material Stability of the analyte in blood should be evaluated to ensure the stability of the analyte in sampled matrix (blood) directly after collection from subjects and prior to preparation for storage. Whole blood stability can be evaluated during method development (e.g., using an exploratory method in blood) or during method validation. The results should be provided in the Validation Report.
Example of whole blood stability assessment<br>
Example of whole blood stability assessment<br>
19
Section 3 Example 10:
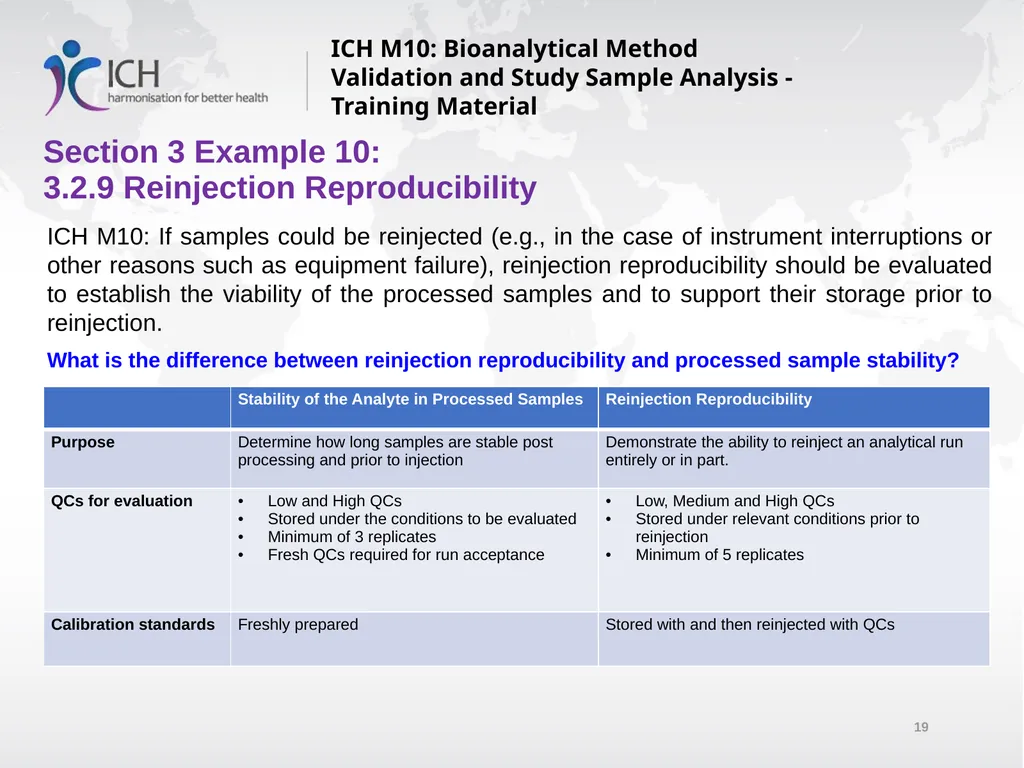
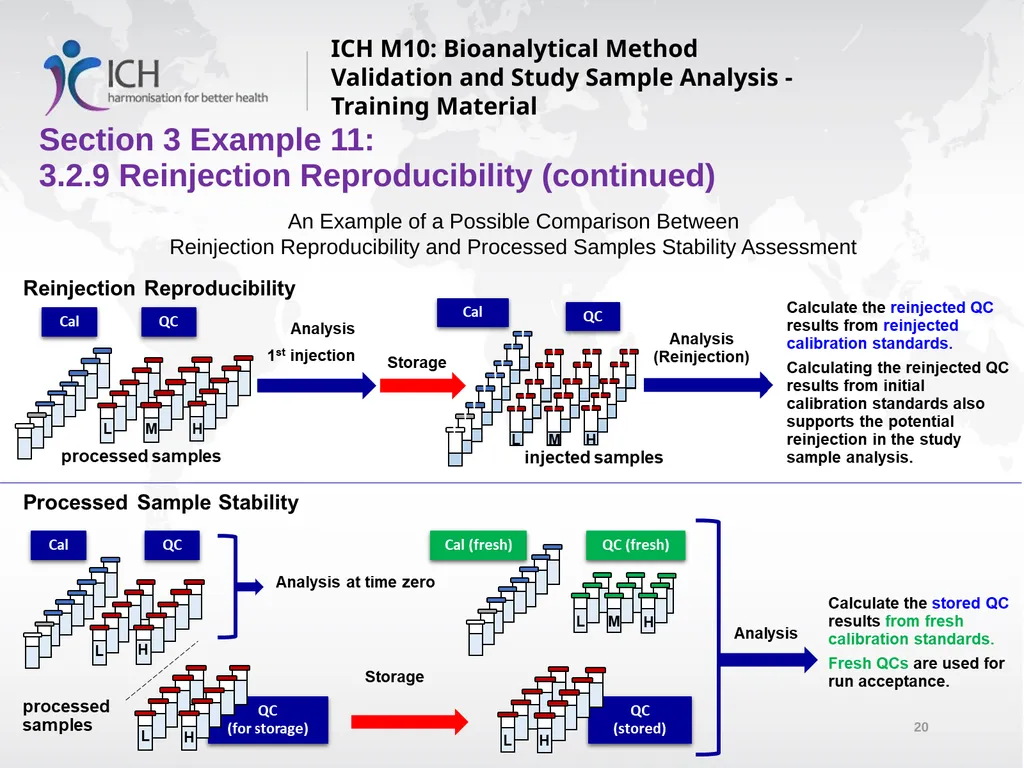
3.2.9 Reinjection Reproducibility ICH M10: Bioanalytical Method Validation and Study Sample Analysis - Training Material ICH M10: If samples could be reinjected (e.g., in the case of instrument interruptions or other reasons such as equipment failure), reinjection reproducibility should be evaluated to establish the viability of the processed samples and to support their storage prior to reinjection.
What is the difference between reinjection reproducibility and processed sample stability?<br>
What is the difference between reinjection reproducibility and processed sample stability?<br>
20
Section 3 Example 11:
3.2.9 Reinjection Reproducibility (continued) ICH M10: Bioanalytical Method Validation and Study Sample Analysis - Training Material An Example of a Possible Comparison Between
Reinjection Reproducibility and Processed Samples Stability Assessment<br>
Reinjection Reproducibility and Processed Samples Stability Assessment<br>
21
Section 3 Example 12:
3.3 Study Sample Analysis ICH M10: Bioanalytical Method Validation and Study Sample Analysis - Training Material ICH M10: “The internal standard (IS) responses of the study samples should be monitored to determine whether there is systemic IS variability.”
How should you monitor IS variability?
IS variability may be monitored by:
Observing the IS response plots
Comparing the mean (%CV) of the IS responses of the unknown samples (Study Samples) relative to that of the known samples (Standards and QCs)
Examples on the following slides demonstrate why monitoring both the plots and the descriptive statistics are useful in determining whether there are any trends of concern.<br>
How should you monitor IS variability?
IS variability may be monitored by:
Observing the IS response plots
Comparing the mean (%CV) of the IS responses of the unknown samples (Study Samples) relative to that of the known samples (Standards and QCs)
Examples on the following slides demonstrate why monitoring both the plots and the descriptive statistics are useful in determining whether there are any trends of concern.<br>
22
Section 3 Example 12 (continued):
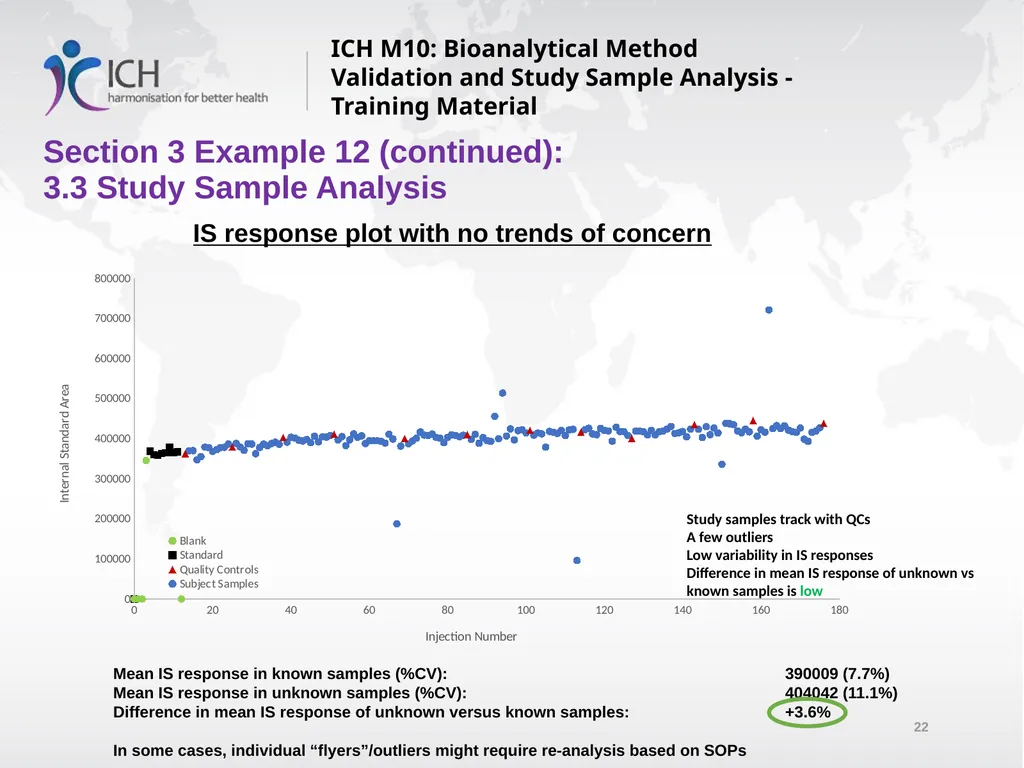
3.3 Study Sample Analysis ICH M10: Bioanalytical Method Validation and Study Sample Analysis - Training Material IS response plot with no trends of concern Mean IS response in known samples (%CV): 390009 (7.7%)
Mean IS response in unknown samples (%CV): 404042 (11.1%)
Difference in mean IS response of unknown versus known samples: +3.6%
In some cases, individual “flyers”/outliers might require re-analysis based on SOPs Study samples track with QCs
A few outliers
Low variability in IS responses
Difference in mean IS response of unknown vs known samples is low<br>
Mean IS response in unknown samples (%CV): 404042 (11.1%)
Difference in mean IS response of unknown versus known samples: +3.6%
In some cases, individual “flyers”/outliers might require re-analysis based on SOPs Study samples track with QCs
A few outliers
Low variability in IS responses
Difference in mean IS response of unknown vs known samples is low<br>
23
Section 3 Example 12 (continued):
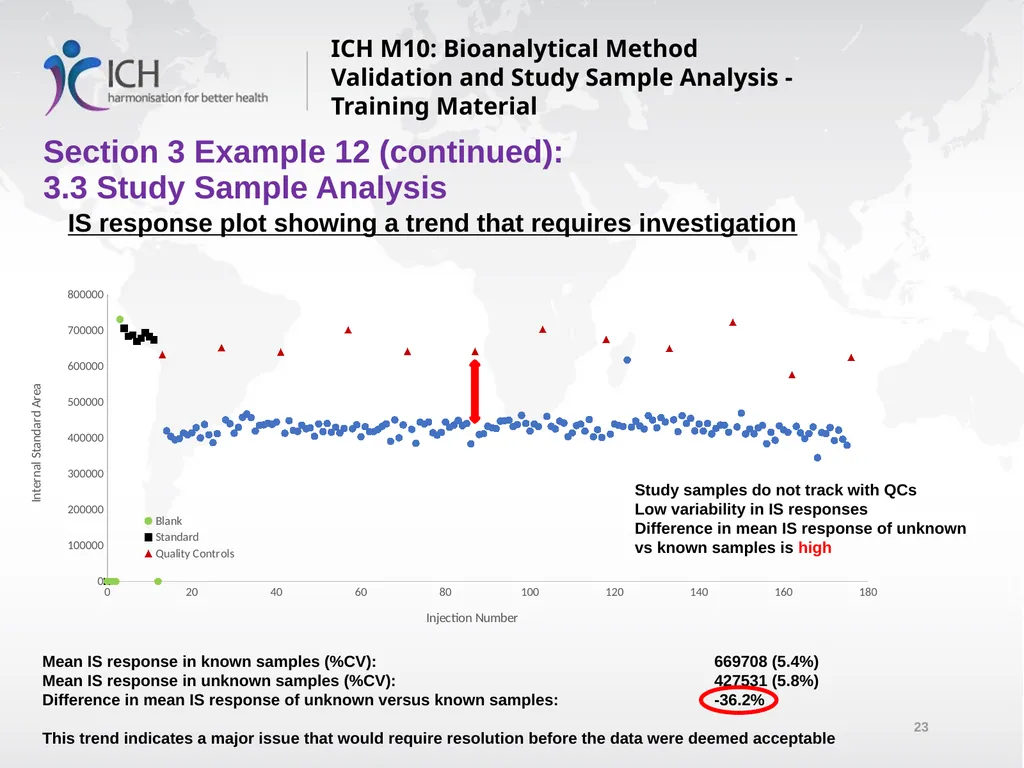
3.3 Study Sample Analysis ICH M10: Bioanalytical Method Validation and Study Sample Analysis - Training Material IS response plot showing a trend that requires investigation Study samples do not track with QCs
Low variability in IS responses
Difference in mean IS response of unknown vs known samples is high Mean IS response in known samples (%CV): 669708 (5.4%)
Mean IS response in unknown samples (%CV): 427531 (5.8%)
Difference in mean IS response of unknown versus known samples: -36.2%
This trend indicates a major issue that would require resolution before the data were deemed acceptable<br>
Low variability in IS responses
Difference in mean IS response of unknown vs known samples is high Mean IS response in known samples (%CV): 669708 (5.4%)
Mean IS response in unknown samples (%CV): 427531 (5.8%)
Difference in mean IS response of unknown versus known samples: -36.2%
This trend indicates a major issue that would require resolution before the data were deemed acceptable<br>
24
Section 3 Example 12 (continued):
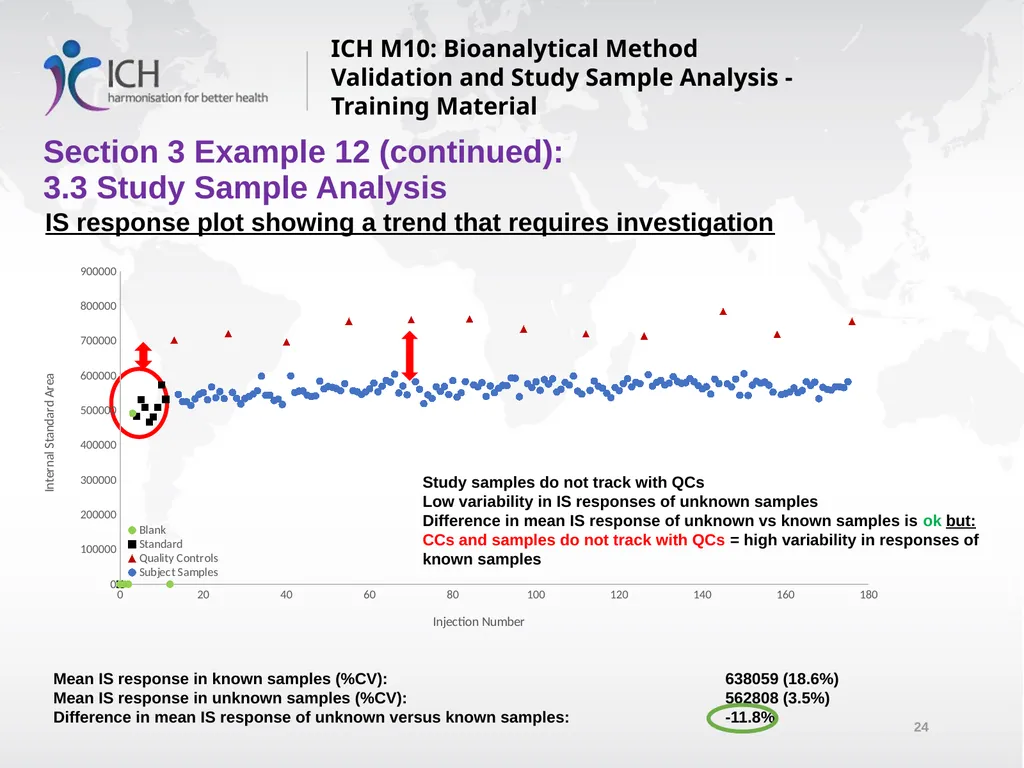
3.3 Study Sample Analysis ICH M10: Bioanalytical Method Validation and Study Sample Analysis - Training Material IS response plot showing a trend that requires investigation Study samples do not track with QCs
Low variability in IS responses of unknown samples
Difference in mean IS response of unknown vs known samples is ok but:
CCs and samples do not track with QCs = high variability in responses of known samples Mean IS response in known samples (%CV): 638059 (18.6%)
Mean IS response in unknown samples (%CV): 562808 (3.5%)
Difference in mean IS response of unknown versus known samples: -11.8%<br>
Low variability in IS responses of unknown samples
Difference in mean IS response of unknown vs known samples is ok but:
CCs and samples do not track with QCs = high variability in responses of known samples Mean IS response in known samples (%CV): 638059 (18.6%)
Mean IS response in unknown samples (%CV): 562808 (3.5%)
Difference in mean IS response of unknown versus known samples: -11.8%<br>
25
Section 3 Example 12 (continued):
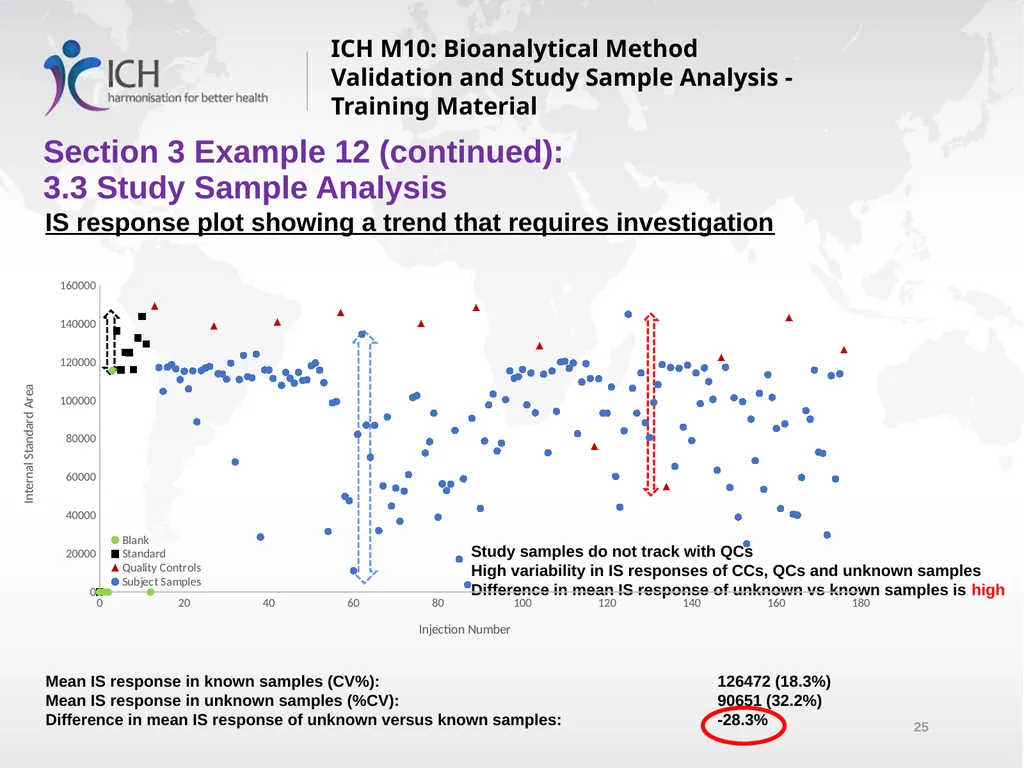
3.3 Study Sample Analysis ICH M10: Bioanalytical Method Validation and Study Sample Analysis - Training Material IS response plot showing a trend that requires investigation Study samples do not track with QCs
High variability in IS responses of CCs, QCs and unknown samples
Difference in mean IS response of unknown vs known samples is high Mean IS response in known samples (CV%): 126472 (18.3%)
Mean IS response in unknown samples (%CV): 90651 (32.2%)
Difference in mean IS response of unknown versus known samples: -28.3%<br>
High variability in IS responses of CCs, QCs and unknown samples
Difference in mean IS response of unknown vs known samples is high Mean IS response in known samples (CV%): 126472 (18.3%)
Mean IS response in unknown samples (%CV): 90651 (32.2%)
Difference in mean IS response of unknown versus known samples: -28.3%<br>
26
Section 3 Example 13
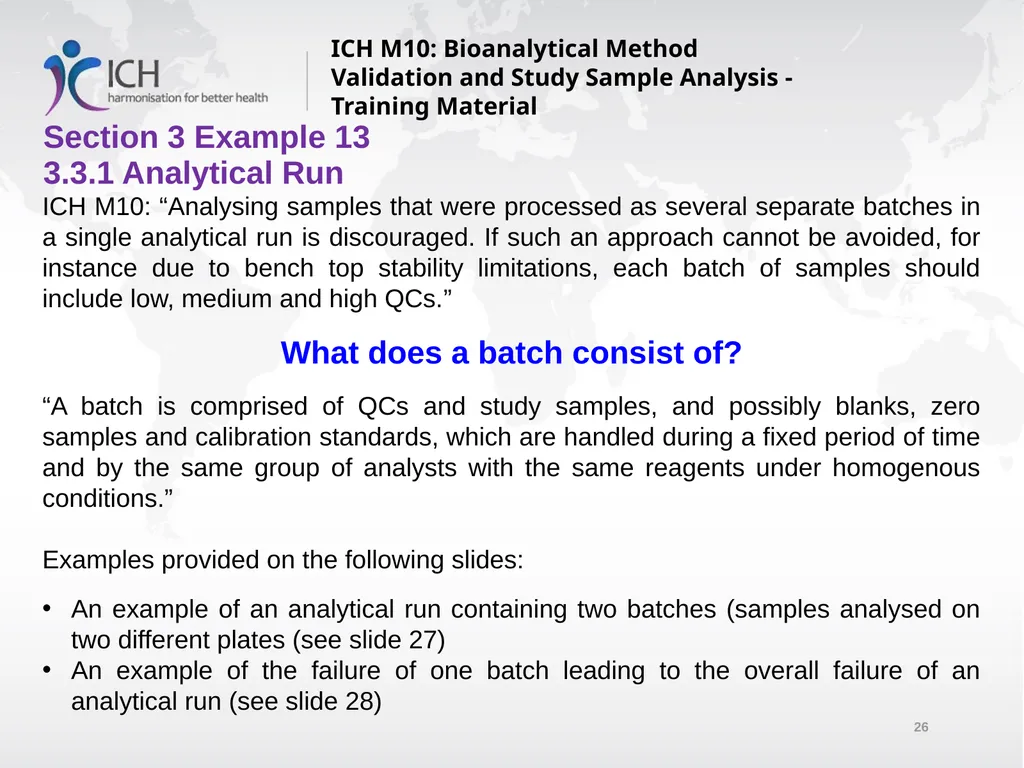
3.3.1 Analytical Run ICH M10: Bioanalytical Method Validation and Study Sample Analysis - Training Material ICH M10: “Analysing samples that were processed as several separate batches in a single analytical run is discouraged. If such an approach cannot be avoided, for instance due to bench top stability limitations, each batch of samples should include low, medium and high QCs.”
What does a batch consist of?
“A batch is comprised of QCs and study samples, and possibly blanks, zero samples and calibration standards, which are handled during a fixed period of time and by the same group of analysts with the same reagents under homogenous conditions.”
Examples provided on the following slides:
An example of an analytical run containing two batches (samples analysed on two different plates (see slide 27)
An example of the failure of one batch leading to the overall failure of an analytical run (see slide 28)<br>
What does a batch consist of?
“A batch is comprised of QCs and study samples, and possibly blanks, zero samples and calibration standards, which are handled during a fixed period of time and by the same group of analysts with the same reagents under homogenous conditions.”
Examples provided on the following slides:
An example of an analytical run containing two batches (samples analysed on two different plates (see slide 27)
An example of the failure of one batch leading to the overall failure of an analytical run (see slide 28)<br>
27
Analytical run Section 3 Example 13 (continued)
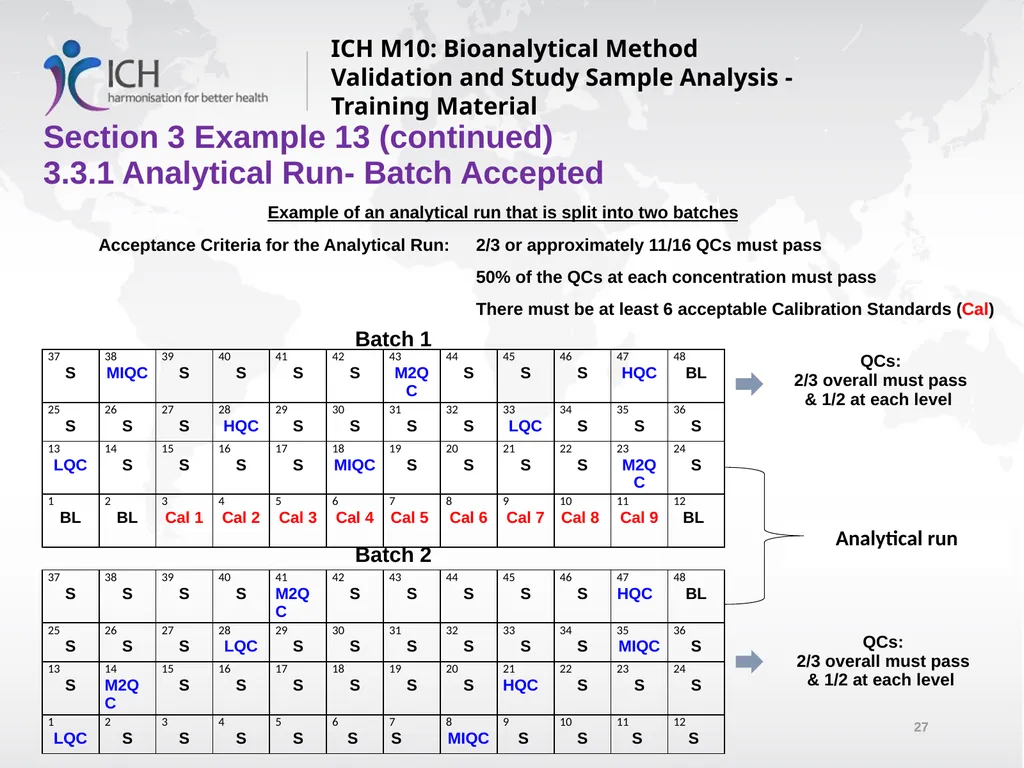
3.3.1 Analytical Run- Batch Accepted ICH M10: Bioanalytical Method Validation and Study Sample Analysis - Training Material Example of an analytical run that is split into two batches
Acceptance Criteria for the Analytical Run: 2/3 or approximately 11/16 QCs must pass
50% of the QCs at each concentration must pass
There must be at least 6 acceptable Calibration Standards (Cal) Batch 1 Batch 2 QCs:
2/3 overall must pass
& 1/2 at each level QCs:
2/3 overall must pass
& 1/2 at each level<br>
Acceptance Criteria for the Analytical Run: 2/3 or approximately 11/16 QCs must pass
50% of the QCs at each concentration must pass
There must be at least 6 acceptable Calibration Standards (Cal) Batch 1 Batch 2 QCs:
2/3 overall must pass
& 1/2 at each level QCs:
2/3 overall must pass
& 1/2 at each level<br>
28
Section 3 Example 13 (continued)
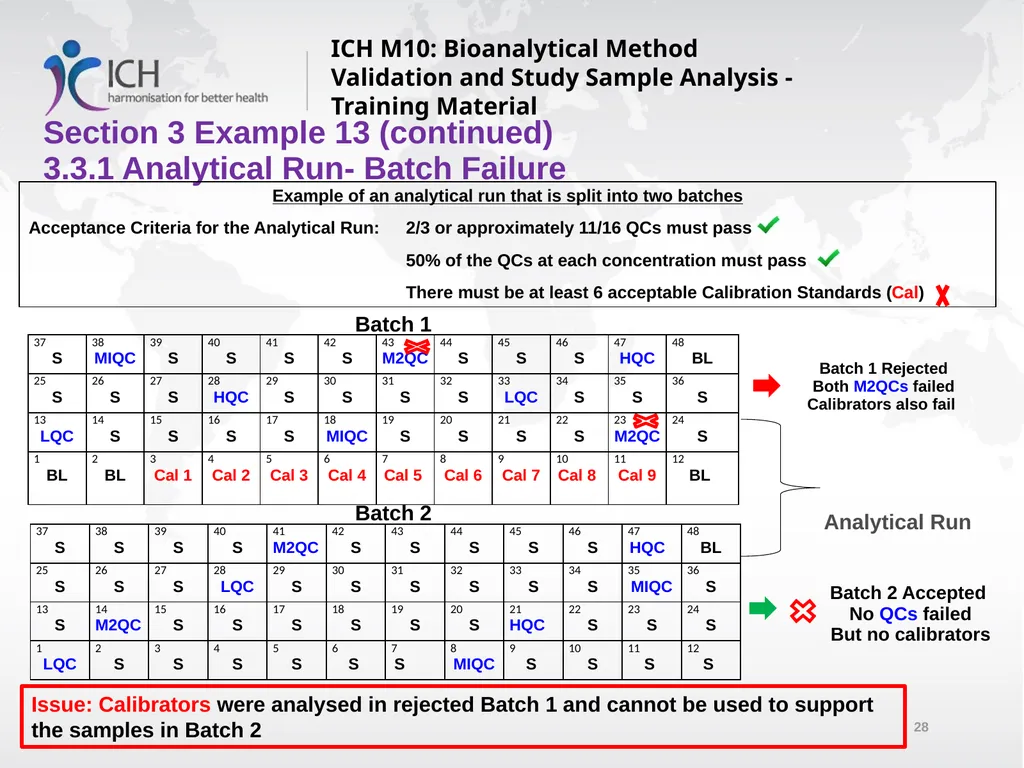
3.3.1 Analytical Run- Batch Failure ICH M10: Bioanalytical Method Validation and Study Sample Analysis - Training Material Example of an analytical run that is split into two batches
Acceptance Criteria for the Analytical Run: 2/3 or approximately 11/16 QCs must pass
50% of the QCs at each concentration must pass
There must be at least 6 acceptable Calibration Standards (Cal) Batch 1 Batch 2 Batch 1 Rejected
Both M2QCs failed
Calibrators also fail Analytical Run Batch 2 Accepted
No QCs failed
But no calibrators Issue: Calibrators were analysed in rejected Batch 1 and cannot be used to support the samples in Batch 2<br>
Acceptance Criteria for the Analytical Run: 2/3 or approximately 11/16 QCs must pass
50% of the QCs at each concentration must pass
There must be at least 6 acceptable Calibration Standards (Cal) Batch 1 Batch 2 Batch 1 Rejected
Both M2QCs failed
Calibrators also fail Analytical Run Batch 2 Accepted
No QCs failed
But no calibrators Issue: Calibrators were analysed in rejected Batch 1 and cannot be used to support the samples in Batch 2<br>
29
Section 3 Example 14
3.3.2 Calibration Range ICH M10: Bioanalytical Method Validation and Study Sample Analysis - Training Material ICH M10: “if a large number of the analyte concentrations of the study samples are above the ULOQ. The calibration curve range should be changed, if possible, and QC(s) added or their concentrations modified”
What is meant by “a large number”? Is there a certain percentage of samples?
There is no definite percentage or number of samples that has been defined in this context and this is a case-by-case assessment. Examples of points to consider:
How many samples are affected
How high above the ULOQ the samples are
How many Cmax values are above the ULOQ
What is the purpose of the study (supportive only or pivotal)<br>
What is meant by “a large number”? Is there a certain percentage of samples?
There is no definite percentage or number of samples that has been defined in this context and this is a case-by-case assessment. Examples of points to consider:
How many samples are affected
How high above the ULOQ the samples are
How many Cmax values are above the ULOQ
What is the purpose of the study (supportive only or pivotal)<br>
30
ICH M10: Bioanalytical Method Validation and Study Sample Analysis - Training Material What “concentrations” are referred to in the sentence: “The dilution factor(s) and concentrations applied during study sample analysis should be within the range of the dilution factors and concentrations evaluated during validation”?
Concentrations refers to the concentrations of the QCs. The diluted concentrations should fall within the validated calibration curve range.
Section 3 Example 16:
What is the purpose of measuring the concentration of the QC at time zero?
To confirm the QCs were correctly prepared. Stability in the matrix (e.g., bench-top, long-term, freeze-thaw) should be evaluated by comparing with the nominal value Section 3 Example 15:<br>
Concentrations refers to the concentrations of the QCs. The diluted concentrations should fall within the validated calibration curve range.
Section 3 Example 16:
What is the purpose of measuring the concentration of the QC at time zero?
To confirm the QCs were correctly prepared. Stability in the matrix (e.g., bench-top, long-term, freeze-thaw) should be evaluated by comparing with the nominal value Section 3 Example 15:<br>
31
ICH M10: Bioanalytical Method Validation and Study Sample Analysis - Training Material Section 4:
Ligand Binding Assay
Examples<br>
Ligand Binding Assay
Examples<br>
32
Section 4 Example 1
4.1.2 Critical Reagents ICH M10: Bioanalytical Method Validation and Study Sample Analysis - Training Material When changing a critical reagent what are the expectations for documentation and reporting performance?
Critical reagents should be described within the method description or validation report;
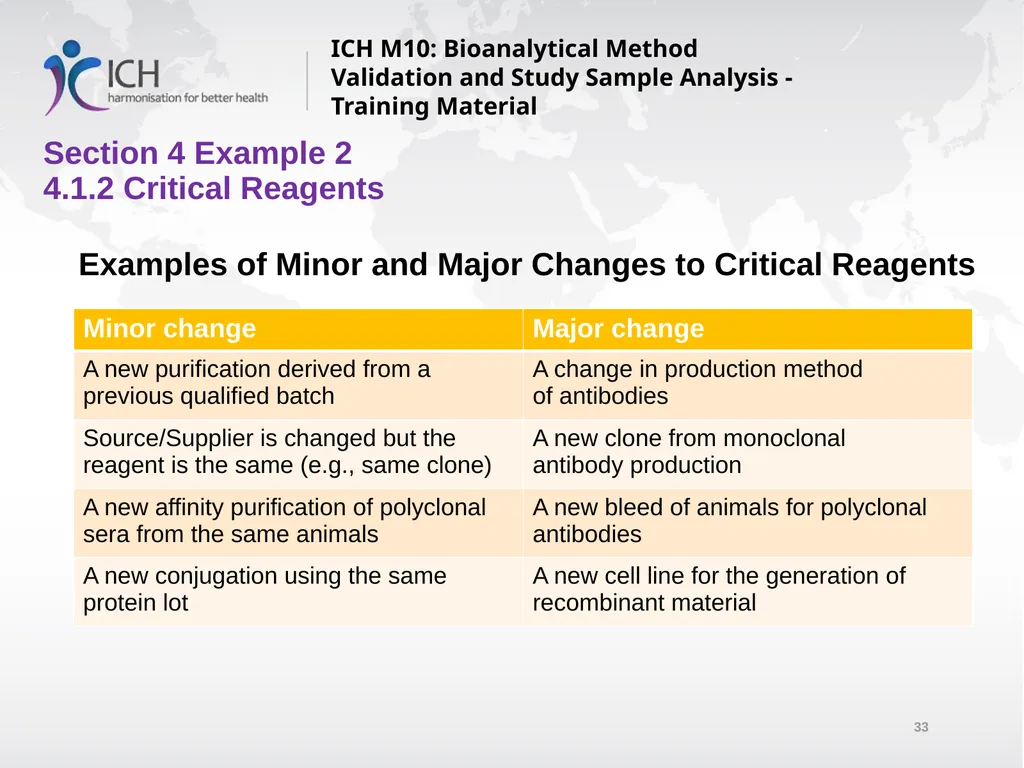
The level of assessment to ensure the performance and quality when changing a critical reagent will depend on whether the change is considered major or minor (see next slide);
A critical reagent may be re-tested to support extension of its validity period, or a new reagent may be prepared and assessed in a bridging experiment to understand functional performance within the assay. Ideally, the original material if available should be compared to the new lot.
The new reagent should meet acceptance criteria;
Documentation should be clear and ready for regulatory inspection/submission.
The procedure to document the change should be SOP driven;
Examples may include recording the performance in a lab book, preparing a note-to-file or a partial validation report.<br>
Critical reagents should be described within the method description or validation report;
The level of assessment to ensure the performance and quality when changing a critical reagent will depend on whether the change is considered major or minor (see next slide);
A critical reagent may be re-tested to support extension of its validity period, or a new reagent may be prepared and assessed in a bridging experiment to understand functional performance within the assay. Ideally, the original material if available should be compared to the new lot.
The new reagent should meet acceptance criteria;
Documentation should be clear and ready for regulatory inspection/submission.
The procedure to document the change should be SOP driven;
Examples may include recording the performance in a lab book, preparing a note-to-file or a partial validation report.<br>
33
Section 4 Example 2
4.1.2 Critical Reagents ICH M10: Bioanalytical Method Validation and Study Sample Analysis - Training Material Examples of Minor and Major Changes to Critical Reagents<br>
34
Section 4 Example 3
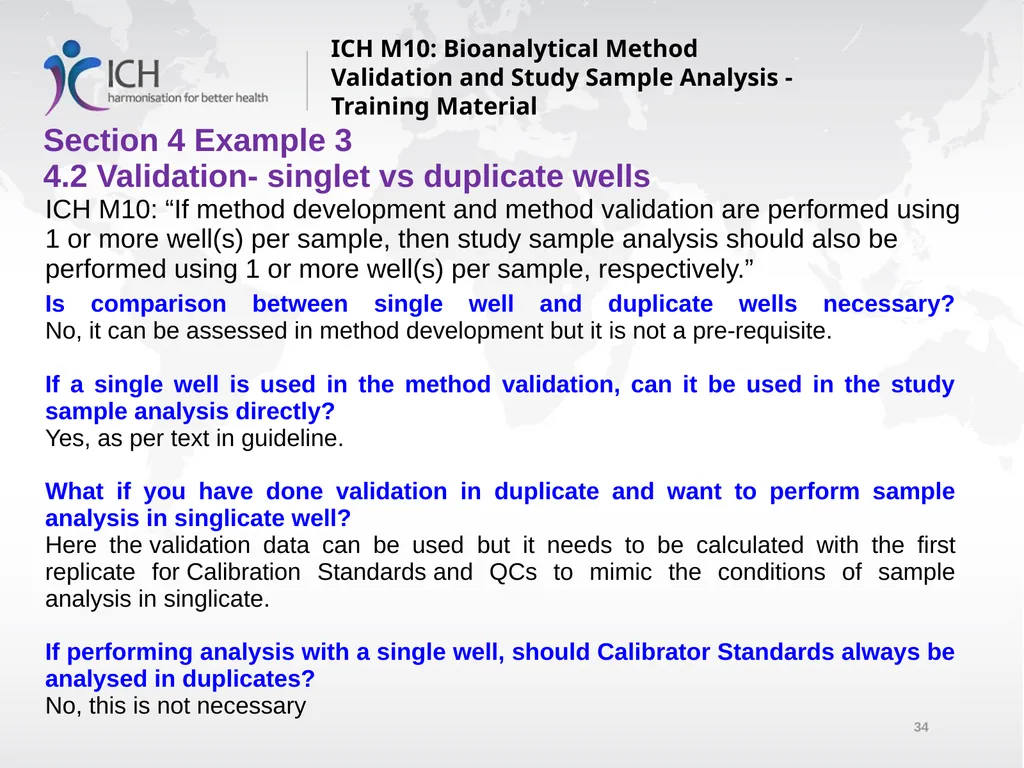
4.2 Validation- singlet vs duplicate wells ICH M10: Bioanalytical Method Validation and Study Sample Analysis - Training Material ICH M10: “If method development and method validation are performed using 1 or more well(s) per sample, then study sample analysis should also be performed using 1 or more well(s) per sample, respectively.” Is comparison between single well and duplicate wells necessary?
No, it can be assessed in method development but it is not a pre-requisite.
If a single well is used in the method validation, can it be used in the study sample analysis directly?
Yes, as per text in guideline.
What if you have done validation in duplicate and want to perform sample analysis in singlicate well?
Here the validation data can be used but it needs to be calculated with the first replicate for Calibration Standards and QCs to mimic the conditions of sample analysis in singlicate.
If performing analysis with a single well, should Calibrator Standards always be analysed in duplicates?
No, this is not necessary<br>
If a single well is used in the method validation, can it be used in the study sample analysis directly?
Yes, as per text in guideline.
What if you have done validation in duplicate and want to perform sample analysis in singlicate well?
Here the validation data can be used but it needs to be calculated with the first replicate for Calibration Standards and QCs to mimic the conditions of sample analysis in singlicate.
If performing analysis with a single well, should Calibrator Standards always be analysed in duplicates?
No, this is not necessary<br>
35
Section 4 Example 4
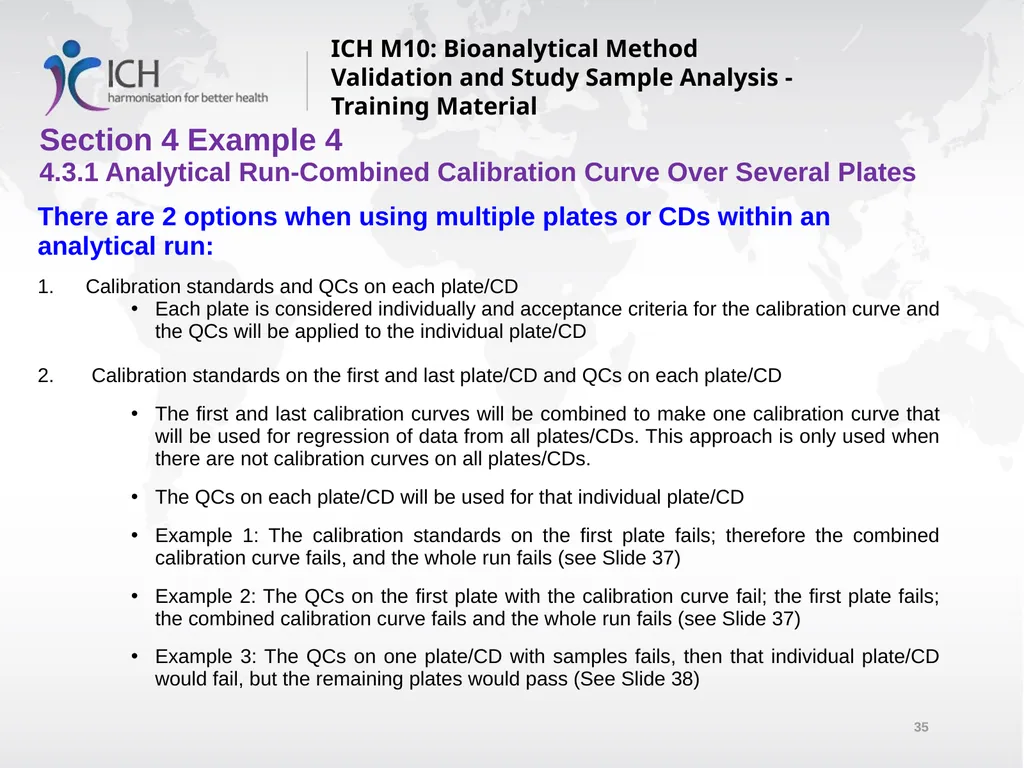
4.3.1 Analytical Run-Combined Calibration Curve Over Several Plates ICH M10: Bioanalytical Method Validation and Study Sample Analysis - Training Material There are 2 options when using multiple plates or CDs within an analytical run:
Calibration standards and QCs on each plate/CD
Each plate is considered individually and acceptance criteria for the calibration curve and the QCs will be applied to the individual plate/CD
Calibration standards on the first and last plate/CD and QCs on each plate/CD
The first and last calibration curves will be combined to make one calibration curve that will be used for regression of data from all plates/CDs. This approach is only used when there are not calibration curves on all plates/CDs.
The QCs on each plate/CD will be used for that individual plate/CD
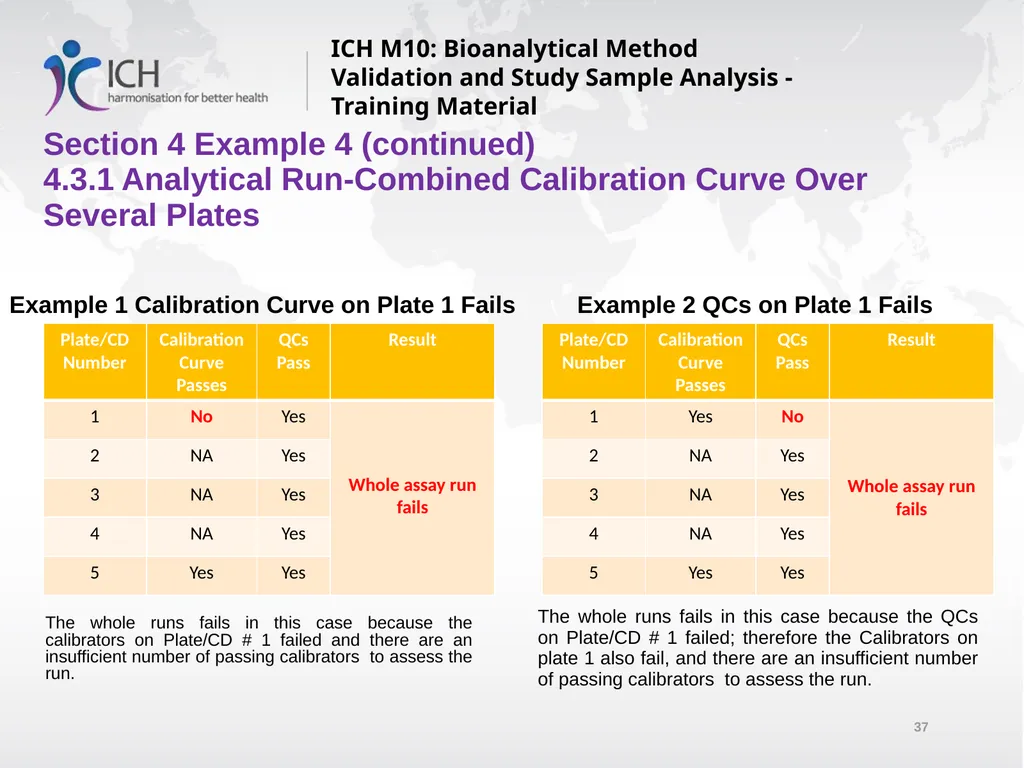
Example 1: The calibration standards on the first plate fails; therefore the combined calibration curve fails, and the whole run fails (see Slide 37)
Example 2: The QCs on the first plate with the calibration curve fail; the first plate fails; the combined calibration curve fails and the whole run fails (see Slide 37)
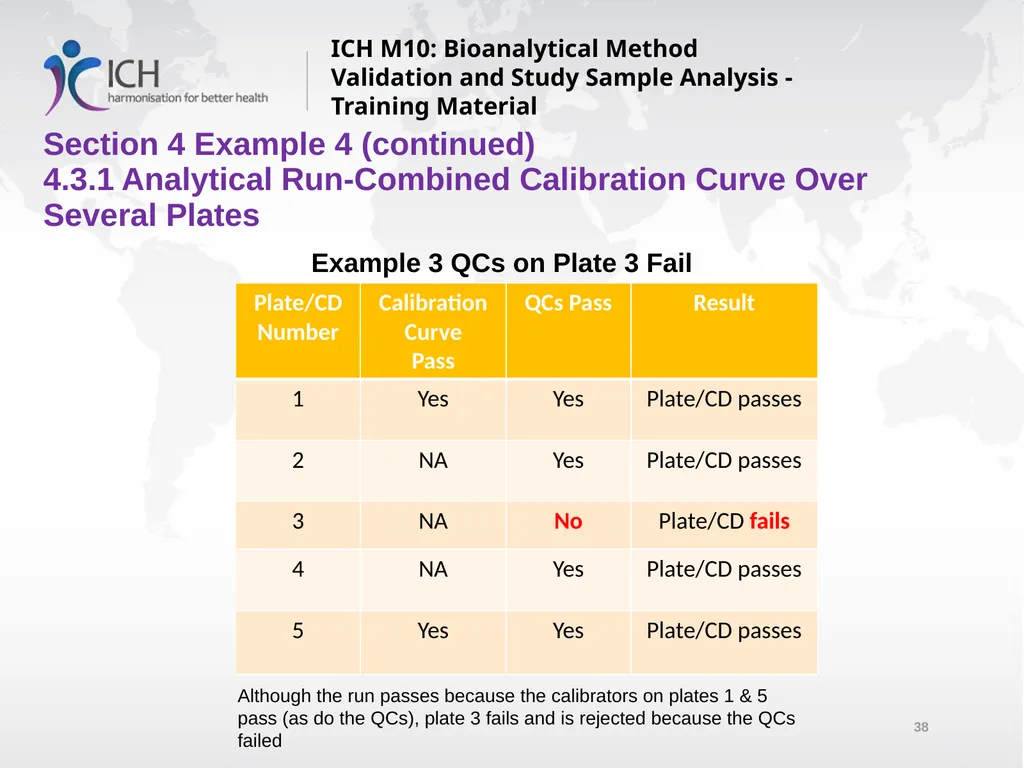
Example 3: The QCs on one plate/CD with samples fails, then that individual plate/CD would fail, but the remaining plates would pass (See Slide 38)<br>
Calibration standards and QCs on each plate/CD
Each plate is considered individually and acceptance criteria for the calibration curve and the QCs will be applied to the individual plate/CD
Calibration standards on the first and last plate/CD and QCs on each plate/CD
The first and last calibration curves will be combined to make one calibration curve that will be used for regression of data from all plates/CDs. This approach is only used when there are not calibration curves on all plates/CDs.
The QCs on each plate/CD will be used for that individual plate/CD
Example 1: The calibration standards on the first plate fails; therefore the combined calibration curve fails, and the whole run fails (see Slide 37)
Example 2: The QCs on the first plate with the calibration curve fail; the first plate fails; the combined calibration curve fails and the whole run fails (see Slide 37)
Example 3: The QCs on one plate/CD with samples fails, then that individual plate/CD would fail, but the remaining plates would pass (See Slide 38)<br>
36
Section 4 Example 4 (continued)
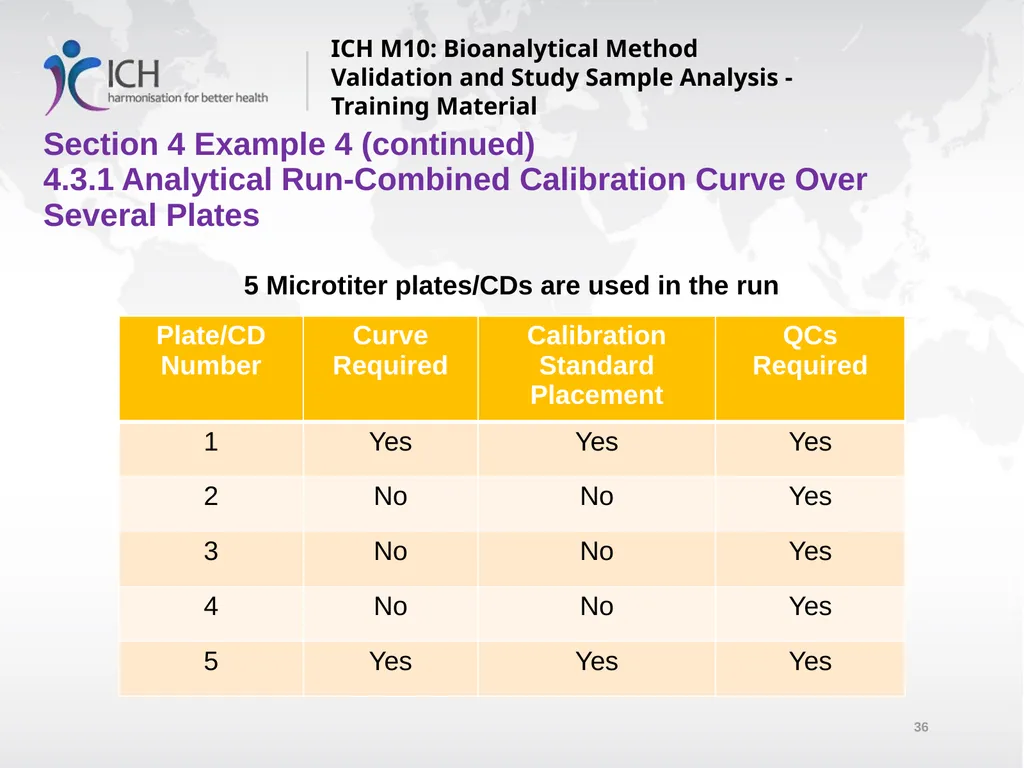
4.3.1 Analytical Run-Combined Calibration Curve Over Several Plates ICH M10: Bioanalytical Method Validation and Study Sample Analysis - Training Material 5 Microtiter plates/CDs are used in the run<br>
37
Section 4 Example 4 (continued)
4.3.1 Analytical Run-Combined Calibration Curve Over Several Plates ICH M10: Bioanalytical Method Validation and Study Sample Analysis - Training Material Example 1 Calibration Curve on Plate 1 Fails Example 2 QCs on Plate 1 Fails The whole runs fails in this case because the calibrators on Plate/CD # 1 failed and there are an insufficient number of passing calibrators to assess the run. The whole runs fails in this case because the QCs on Plate/CD # 1 failed; therefore the Calibrators on plate 1 also fail, and there are an insufficient number of passing calibrators to assess the run.<br>
38
Section 4 Example 4 (continued)
4.3.1 Analytical Run-Combined Calibration Curve Over Several Plates ICH M10: Bioanalytical Method Validation and Study Sample Analysis - Training Material Example 3 QCs on Plate 3 Fail Although the run passes because the calibrators on plates 1 & 5 pass (as do the QCs), plate 3 fails and is rejected because the QCs failed<br>
39
Section 4 Example 5
4.3.2 Acceptance Criteria for an Analytical Run ICH M10: Bioanalytical Method Validation and Study Sample Analysis - Training Material Can an analytical run still be acceptable if LLOQ or ULOQ fails?
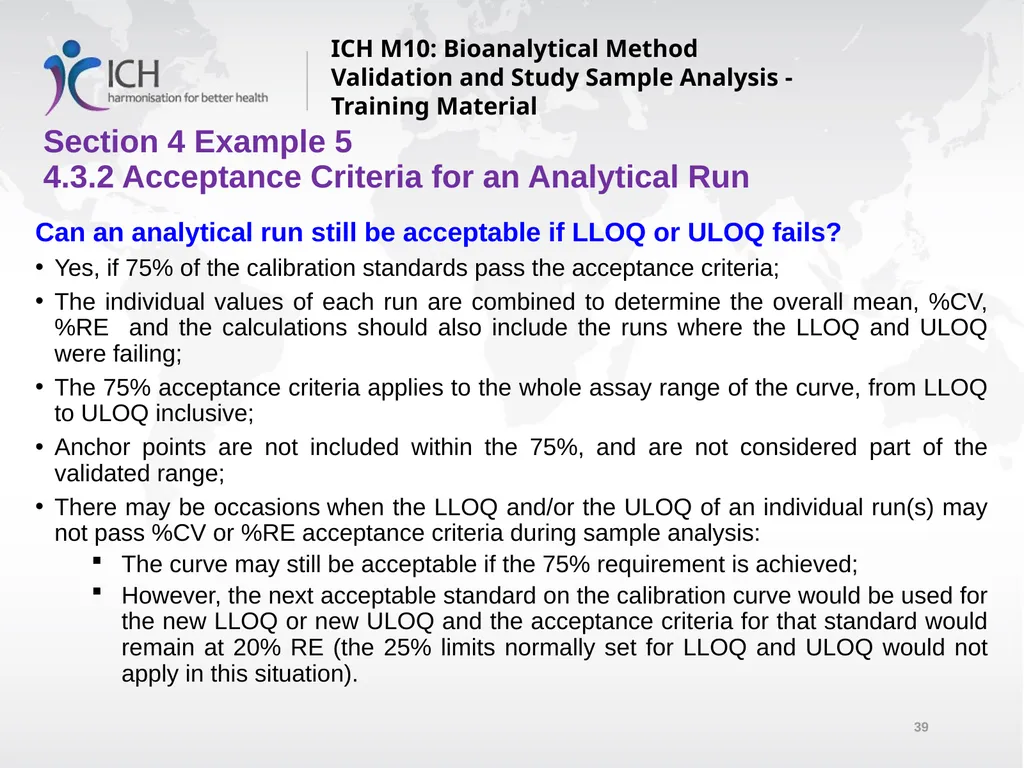
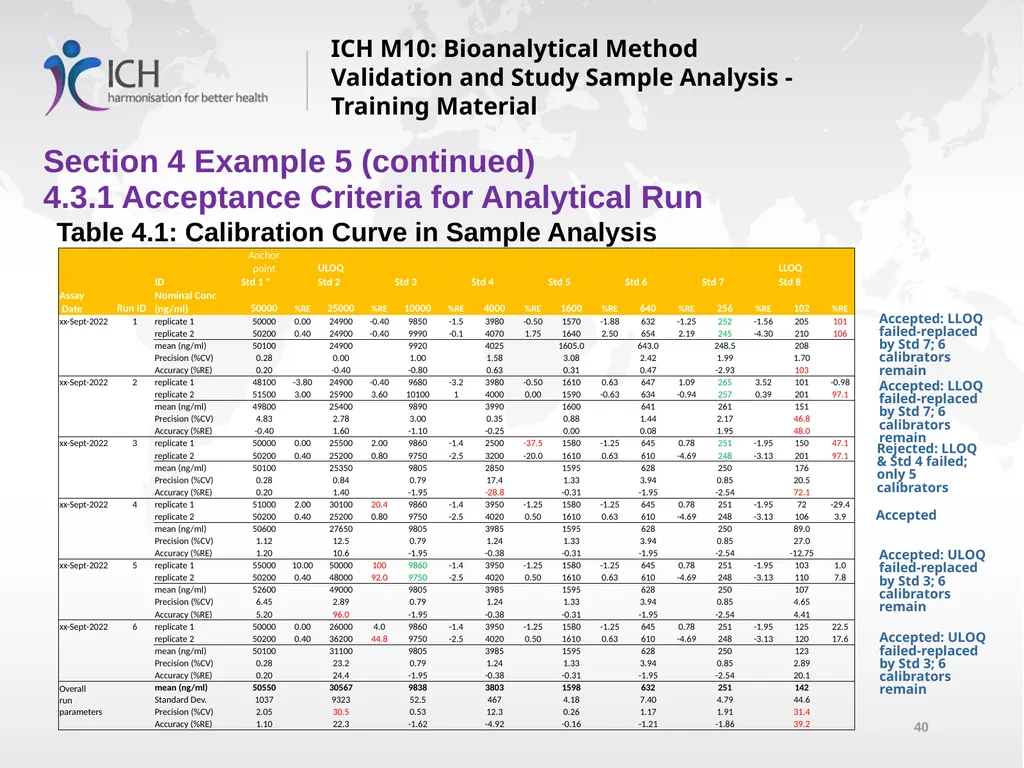
Yes, if 75% of the calibration standards pass the acceptance criteria;
The individual values of each run are combined to determine the overall mean, %CV, %RE and the calculations should also include the runs where the LLOQ and ULOQ were failing;
The 75% acceptance criteria applies to the whole assay range of the curve, from LLOQ to ULOQ inclusive;
Anchor points are not included within the 75%, and are not considered part of the validated range;
There may be occasions when the LLOQ and/or the ULOQ of an individual run(s) may not pass %CV or %RE acceptance criteria during sample analysis:
The curve may still be acceptable if the 75% requirement is achieved;
However, the next acceptable standard on the calibration curve would be used for the new LLOQ or new ULOQ and the acceptance criteria for that standard would remain at 20% RE (the 25% limits normally set for LLOQ and ULOQ would not apply in this situation).<br>
Yes, if 75% of the calibration standards pass the acceptance criteria;
The individual values of each run are combined to determine the overall mean, %CV, %RE and the calculations should also include the runs where the LLOQ and ULOQ were failing;
The 75% acceptance criteria applies to the whole assay range of the curve, from LLOQ to ULOQ inclusive;
Anchor points are not included within the 75%, and are not considered part of the validated range;
There may be occasions when the LLOQ and/or the ULOQ of an individual run(s) may not pass %CV or %RE acceptance criteria during sample analysis:
The curve may still be acceptable if the 75% requirement is achieved;
However, the next acceptable standard on the calibration curve would be used for the new LLOQ or new ULOQ and the acceptance criteria for that standard would remain at 20% RE (the 25% limits normally set for LLOQ and ULOQ would not apply in this situation).<br>
40
Section 4 Example 5 (continued)
4.3.1 Acceptance Criteria for Analytical Run ICH M10: Bioanalytical Method Validation and Study Sample Analysis - Training Material Table 4.1: Calibration Curve in Sample Analysis Accepted: LLOQ failed-replaced by Std 7; 6 calibrators remain Accepted: LLOQ failed-replaced by Std 7; 6 calibrators remain Rejected: LLOQ & Std 4 failed; only 5 calibrators Accepted Accepted: ULOQ failed-replaced by Std 3; 6 calibrators remain Accepted: ULOQ failed-replaced by Std 3; 6 calibrators remain<br>
41
Section 4 Example 6
4.2.6 Dilution Linearity ICH M10: Bioanalytical Method Validation and Study Sample Analysis - Training Material For Ligand Binding Assays, it may be necessary to dilute samples into the calibration range in addition to the minimal required dilution (MRD) of the method;
This additional dilution should be performed with blank matrix;
The assessment of the linearity of additional dilution of samples should replicate the dilution(s) needed when a sample concentration is above the ULOQ of the calibration curve;
The assessment is performed to confirm that further dilution does not impact the measured concentration and is performed using at least three independently prepared dilution series;
The assessment may be combined with the evaluation of hook effect.<br>
This additional dilution should be performed with blank matrix;
The assessment of the linearity of additional dilution of samples should replicate the dilution(s) needed when a sample concentration is above the ULOQ of the calibration curve;
The assessment is performed to confirm that further dilution does not impact the measured concentration and is performed using at least three independently prepared dilution series;
The assessment may be combined with the evaluation of hook effect.<br>
42
Section 4 Example 6 (continued)
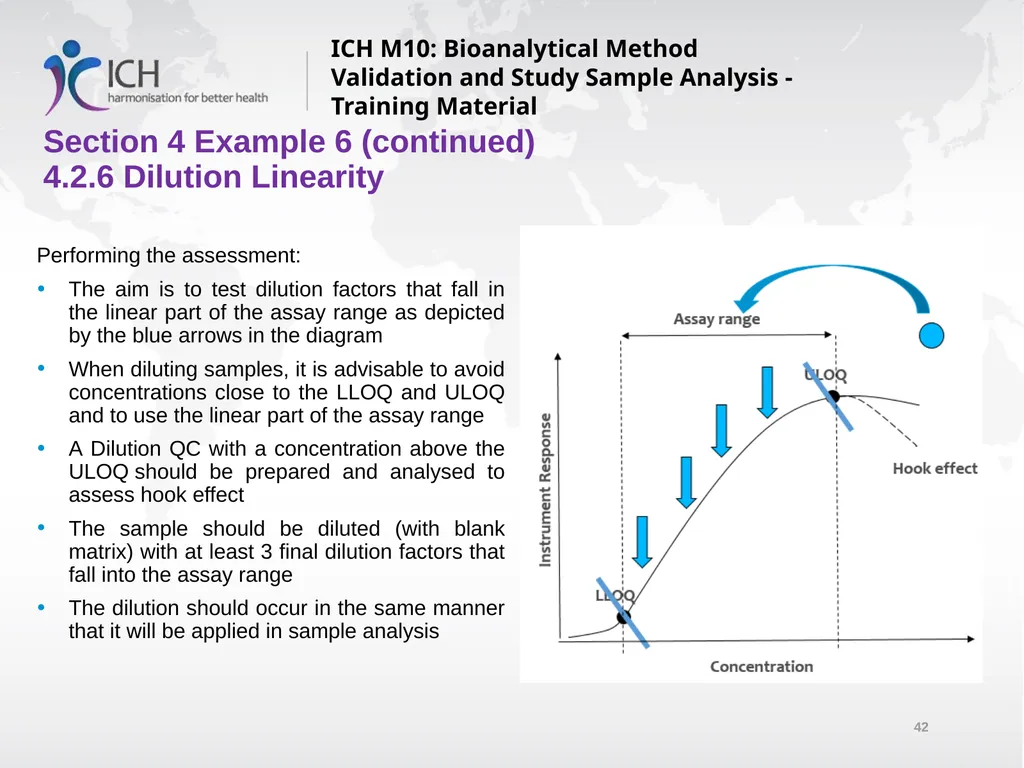
4.2.6 Dilution Linearity ICH M10: Bioanalytical Method Validation and Study Sample Analysis - Training Material Performing the assessment:
The aim is to test dilution factors that fall in the linear part of the assay range as depicted by the blue arrows in the diagram
When diluting samples, it is advisable to avoid concentrations close to the LLOQ and ULOQ and to use the linear part of the assay range
A Dilution QC with a concentration above the ULOQ should be prepared and analysed to assess hook effect
The sample should be diluted (with blank matrix) with at least 3 final dilution factors that fall into the assay range
The dilution should occur in the same manner that it will be applied in sample analysis<br>
The aim is to test dilution factors that fall in the linear part of the assay range as depicted by the blue arrows in the diagram
When diluting samples, it is advisable to avoid concentrations close to the LLOQ and ULOQ and to use the linear part of the assay range
A Dilution QC with a concentration above the ULOQ should be prepared and analysed to assess hook effect
The sample should be diluted (with blank matrix) with at least 3 final dilution factors that fall into the assay range
The dilution should occur in the same manner that it will be applied in sample analysis<br>
43
Section 4 Example 7
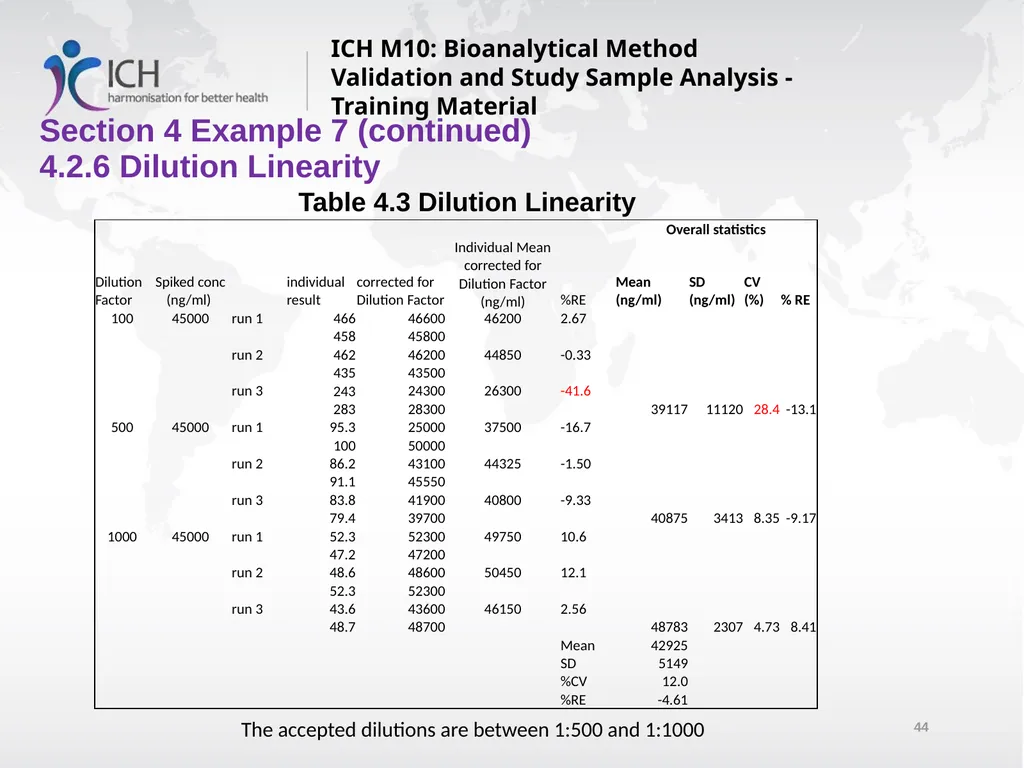
4.2.6 Dilution Linearity ICH M10: Bioanalytical Method Validation and Study Sample Analysis - Training Material For each dilution factor tested, at least 3 independently prepared dilution series per dilution factor should be performed using the number of replicates that will be used in sample analysis. If using duplicates, the mean of the duplicate is calculated. This will give 3 independent means per dilution factor, and the overall mean should be within acceptance criteria.
Can you accept the data if one individual dilution factor is not within acceptance criteria?
Yes
For Example:
Dilution Factor 1:100 has one individual datum with a high %RE. The overall mean does not have a %CV within acceptance criteria – and it fails.
Dilution Factor 1:500 has one individual datum with a high %CV. The overall mean is within acceptance criteria – and it is accepted.
Dilution Factor 1:1000 has all individual data within acceptance criteria and the overall mean is within acceptance criteria – and it is accepted.
The accepted dilutions are between 1:500 and 1:1000
See Table 4.3 on the next slide<br>
Can you accept the data if one individual dilution factor is not within acceptance criteria?
Yes
For Example:
Dilution Factor 1:100 has one individual datum with a high %RE. The overall mean does not have a %CV within acceptance criteria – and it fails.
Dilution Factor 1:500 has one individual datum with a high %CV. The overall mean is within acceptance criteria – and it is accepted.
Dilution Factor 1:1000 has all individual data within acceptance criteria and the overall mean is within acceptance criteria – and it is accepted.
The accepted dilutions are between 1:500 and 1:1000
See Table 4.3 on the next slide<br>
44
Section 4 Example 7 (continued)
4.2.6 Dilution Linearity ICH M10: Bioanalytical Method Validation and Study Sample Analysis - Training Material Table 4.3 Dilution Linearity The accepted dilutions are between 1:500 and 1:1000<br>
45
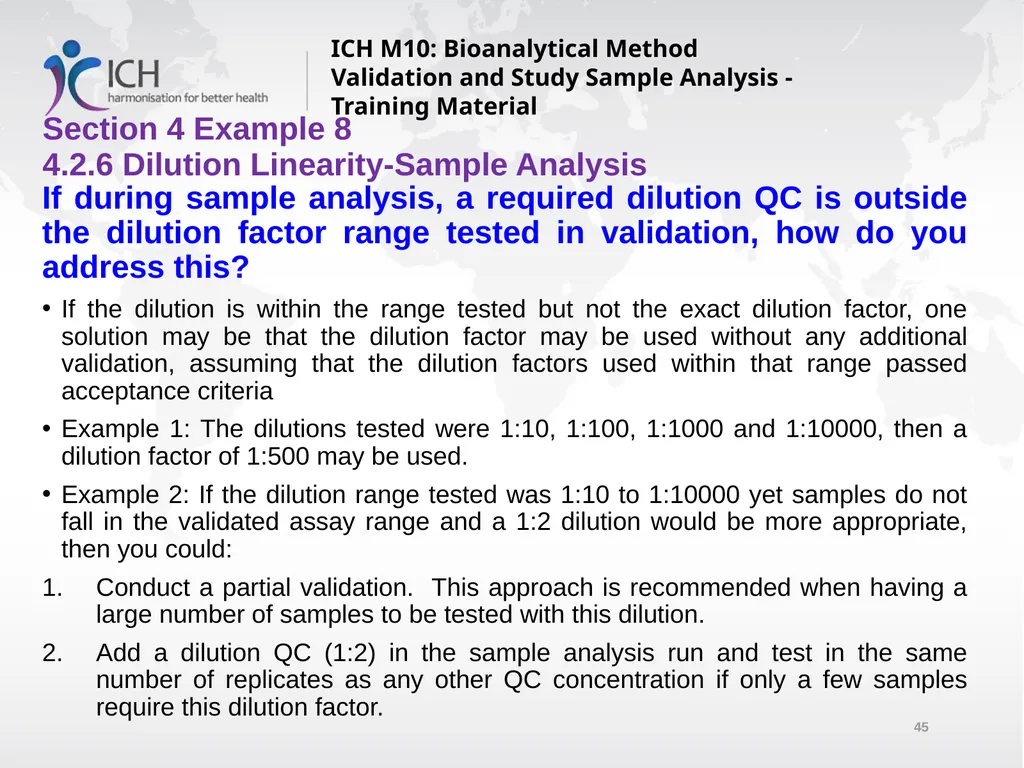
Section 4 Example 8
4.2.6 Dilution Linearity-Sample Analysis ICH M10: Bioanalytical Method Validation and Study Sample Analysis - Training Material If during sample analysis, a required dilution QC is outside the dilution factor range tested in validation, how do you address this?
If the dilution is within the range tested but not the exact dilution factor, one solution may be that the dilution factor may be used without any additional validation, assuming that the dilution factors used within that range passed acceptance criteria
Example 1: The dilutions tested were 1:10, 1:100, 1:1000 and 1:10000, then a dilution factor of 1:500 may be used.
Example 2: If the dilution range tested was 1:10 to 1:10000 yet samples do not fall in the validated assay range and a 1:2 dilution would be more appropriate, then you could:
Conduct a partial validation. This approach is recommended when having a large number of samples to be tested with this dilution.
Add a dilution QC (1:2) in the sample analysis run and test in the same number of replicates as any other QC concentration if only a few samples require this dilution factor.<br>
If the dilution is within the range tested but not the exact dilution factor, one solution may be that the dilution factor may be used without any additional validation, assuming that the dilution factors used within that range passed acceptance criteria
Example 1: The dilutions tested were 1:10, 1:100, 1:1000 and 1:10000, then a dilution factor of 1:500 may be used.
Example 2: If the dilution range tested was 1:10 to 1:10000 yet samples do not fall in the validated assay range and a 1:2 dilution would be more appropriate, then you could:
Conduct a partial validation. This approach is recommended when having a large number of samples to be tested with this dilution.
Add a dilution QC (1:2) in the sample analysis run and test in the same number of replicates as any other QC concentration if only a few samples require this dilution factor.<br>
46
ICH M10: Bioanalytical Method Validation and Study Sample Analysis - Training Material Section 5:
Incurred Sample Reanalysis Examples<br>
Incurred Sample Reanalysis Examples<br>
47
Section 5 Example 1
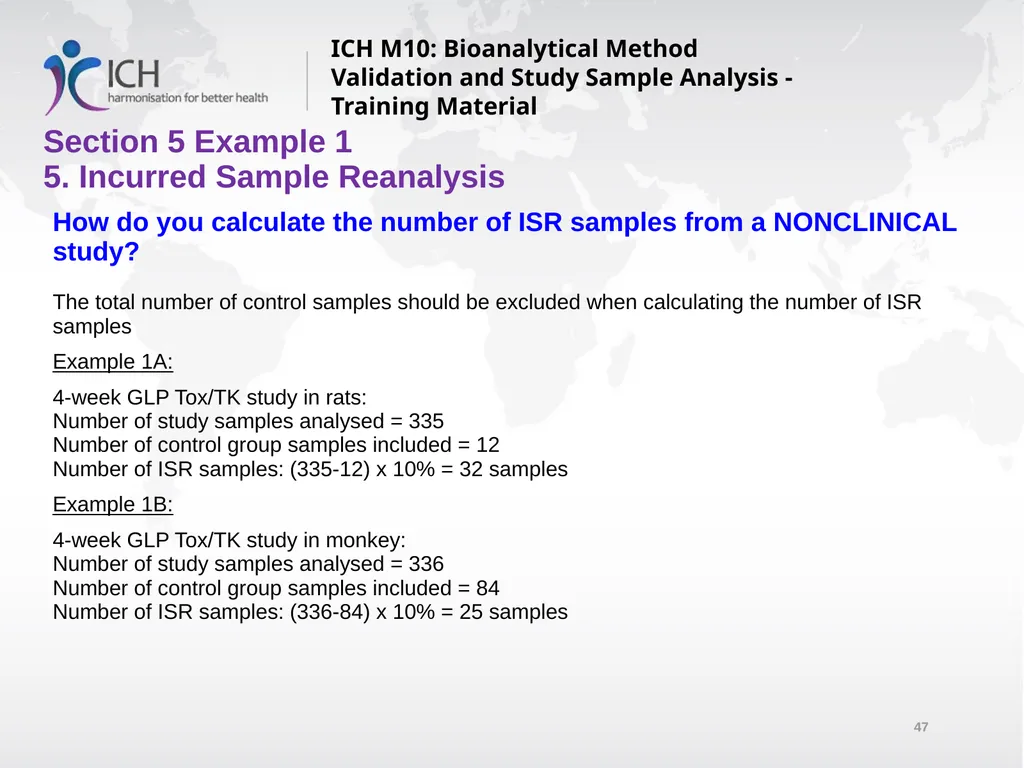
5. Incurred Sample Reanalysis ICH M10: Bioanalytical Method Validation and Study Sample Analysis - Training Material How do you calculate the number of ISR samples from a NONCLINICAL study?
The total number of control samples should be excluded when calculating the number of ISR samples
Example 1A:
4-week GLP Tox/TK study in rats:
Number of study samples analysed = 335
Number of control group samples included = 12
Number of ISR samples: (335-12) x 10% = 32 samples
Example 1B:
4-week GLP Tox/TK study in monkey:
Number of study samples analysed = 336
Number of control group samples included = 84
Number of ISR samples: (336-84) x 10% = 25 samples<br>
The total number of control samples should be excluded when calculating the number of ISR samples
Example 1A:
4-week GLP Tox/TK study in rats:
Number of study samples analysed = 335
Number of control group samples included = 12
Number of ISR samples: (335-12) x 10% = 32 samples
Example 1B:
4-week GLP Tox/TK study in monkey:
Number of study samples analysed = 336
Number of control group samples included = 84
Number of ISR samples: (336-84) x 10% = 25 samples<br>
48
Section 5 Example 1 (continued)
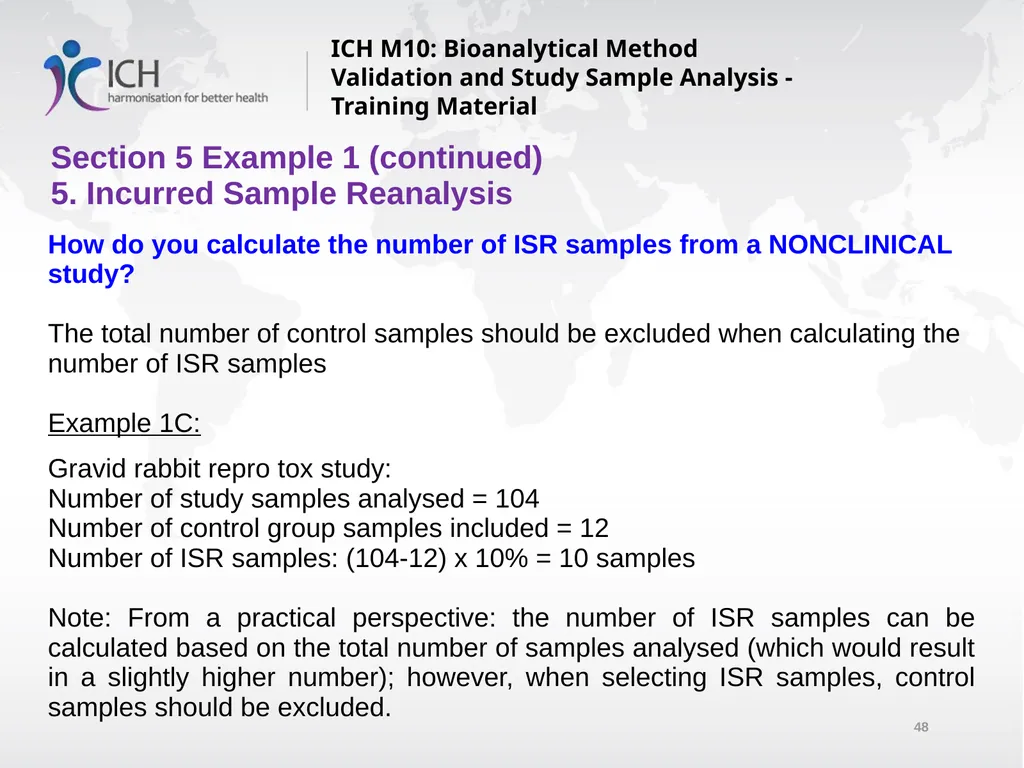
5. Incurred Sample Reanalysis ICH M10: Bioanalytical Method Validation and Study Sample Analysis - Training Material How do you calculate the number of ISR samples from a NONCLINICAL study?
The total number of control samples should be excluded when calculating the number of ISR samples
Example 1C:
Gravid rabbit repro tox study:
Number of study samples analysed = 104
Number of control group samples included = 12
Number of ISR samples: (104-12) x 10% = 10 samples
Note: From a practical perspective: the number of ISR samples can be calculated based on the total number of samples analysed (which would result in a slightly higher number); however, when selecting ISR samples, control samples should be excluded.<br>
The total number of control samples should be excluded when calculating the number of ISR samples
Example 1C:
Gravid rabbit repro tox study:
Number of study samples analysed = 104
Number of control group samples included = 12
Number of ISR samples: (104-12) x 10% = 10 samples
Note: From a practical perspective: the number of ISR samples can be calculated based on the total number of samples analysed (which would result in a slightly higher number); however, when selecting ISR samples, control samples should be excluded.<br>
49
Section 5 Example 2
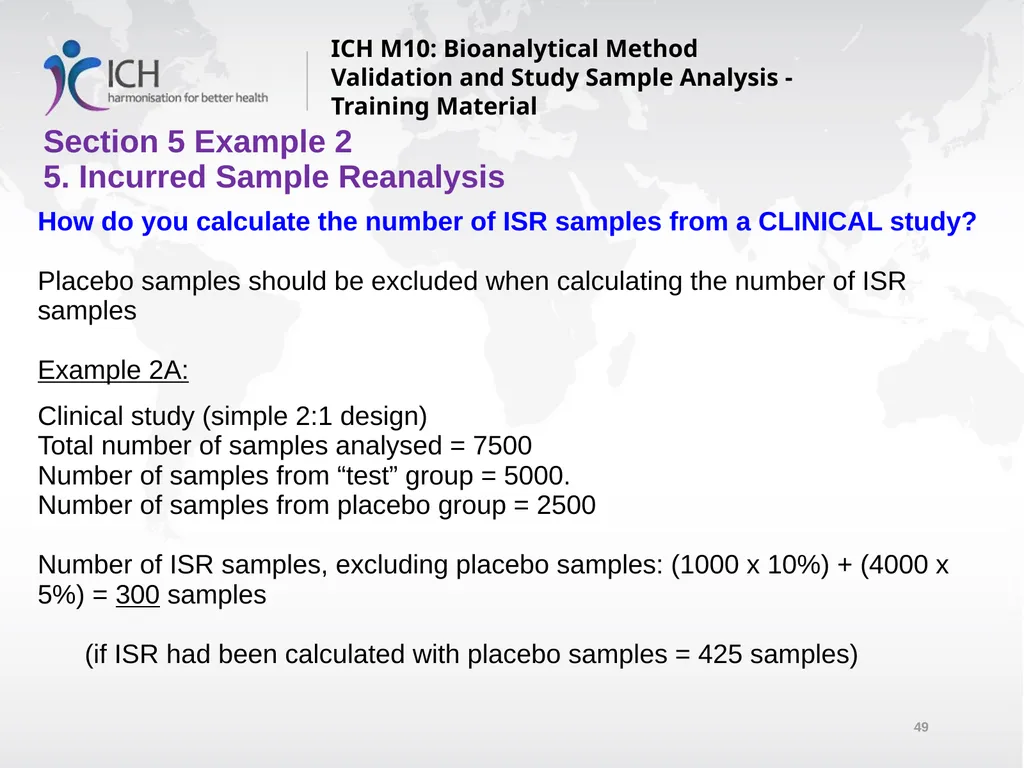
5. Incurred Sample Reanalysis ICH M10: Bioanalytical Method Validation and Study Sample Analysis - Training Material How do you calculate the number of ISR samples from a CLINICAL study?
Placebo samples should be excluded when calculating the number of ISR samples
Example 2A:
Clinical study (simple 2:1 design)
Total number of samples analysed = 7500
Number of samples from “test” group = 5000.
Number of samples from placebo group = 2500
Number of ISR samples, excluding placebo samples: (1000 x 10%) + (4000 x 5%) = 300 samples
(if ISR had been calculated with placebo samples = 425 samples)<br>
Placebo samples should be excluded when calculating the number of ISR samples
Example 2A:
Clinical study (simple 2:1 design)
Total number of samples analysed = 7500
Number of samples from “test” group = 5000.
Number of samples from placebo group = 2500
Number of ISR samples, excluding placebo samples: (1000 x 10%) + (4000 x 5%) = 300 samples
(if ISR had been calculated with placebo samples = 425 samples)<br>
50
Section 5 Example 2 (continued)
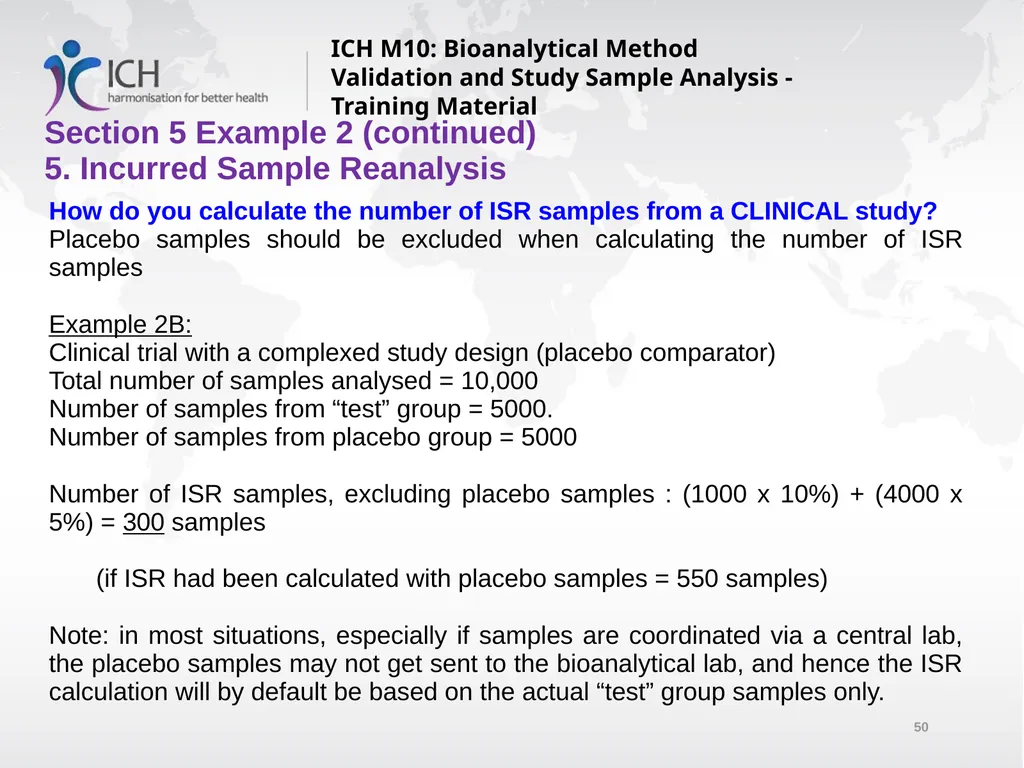
5. Incurred Sample Reanalysis ICH M10: Bioanalytical Method Validation and Study Sample Analysis - Training Material How do you calculate the number of ISR samples from a CLINICAL study?
Placebo samples should be excluded when calculating the number of ISR samples
Example 2B:
Clinical trial with a complexed study design (placebo comparator)
Total number of samples analysed = 10,000
Number of samples from “test” group = 5000.
Number of samples from placebo group = 5000
Number of ISR samples, excluding placebo samples : (1000 x 10%) + (4000 x 5%) = 300 samples
(if ISR had been calculated with placebo samples = 550 samples)
Note: in most situations, especially if samples are coordinated via a central lab, the placebo samples may not get sent to the bioanalytical lab, and hence the ISR calculation will by default be based on the actual “test” group samples only.<br>
Placebo samples should be excluded when calculating the number of ISR samples
Example 2B:
Clinical trial with a complexed study design (placebo comparator)
Total number of samples analysed = 10,000
Number of samples from “test” group = 5000.
Number of samples from placebo group = 5000
Number of ISR samples, excluding placebo samples : (1000 x 10%) + (4000 x 5%) = 300 samples
(if ISR had been calculated with placebo samples = 550 samples)
Note: in most situations, especially if samples are coordinated via a central lab, the placebo samples may not get sent to the bioanalytical lab, and hence the ISR calculation will by default be based on the actual “test” group samples only.<br>
51
ICH M10: Bioanalytical Method Validation and Study Sample Analysis - Training Material Section 6:
Partial & Cross Validation
Examples<br>
Partial & Cross Validation
Examples<br>
52
Section 6 Example 1
6.1 Partial Validation ICH M10: Bioanalytical Method Validation and Study Sample Analysis - Training Material Stability assessment Does the stability established at one facility need to be repeated at another facility?
Not necessarily. There is no need for a partial validation if:
The matrix used in the validated method is the same;
Sample storage conditions are the same as per the validated method;
Sample processing and analysis are performed within the validated conditions with the same materials.<br>
Not necessarily. There is no need for a partial validation if:
The matrix used in the validated method is the same;
Sample storage conditions are the same as per the validated method;
Sample processing and analysis are performed within the validated conditions with the same materials.<br>
53
Section 6 Example 2
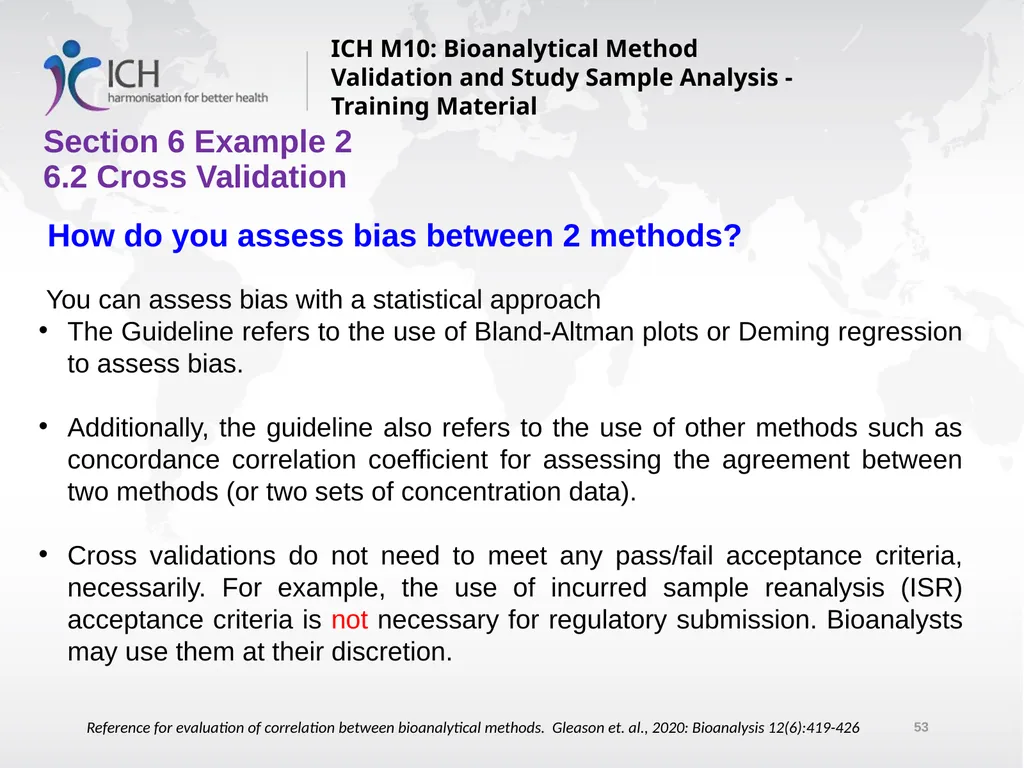
6.2 Cross Validation ICH M10: Bioanalytical Method Validation and Study Sample Analysis - Training Material How do you assess bias between 2 methods?
You can assess bias with a statistical approach
The Guideline refers to the use of Bland-Altman plots or Deming regression to assess bias.
Additionally, the guideline also refers to the use of other methods such as concordance correlation coefficient for assessing the agreement between two methods (or two sets of concentration data).
Cross validations do not need to meet any pass/fail acceptance criteria, necessarily. For example, the use of incurred sample reanalysis (ISR) acceptance criteria is not necessary for regulatory submission. Bioanalysts may use them at their discretion. Reference for evaluation of correlation between bioanalytical methods. Gleason et. al., 2020: Bioanalysis 12(6):419-426<br>
You can assess bias with a statistical approach
The Guideline refers to the use of Bland-Altman plots or Deming regression to assess bias.
Additionally, the guideline also refers to the use of other methods such as concordance correlation coefficient for assessing the agreement between two methods (or two sets of concentration data).
Cross validations do not need to meet any pass/fail acceptance criteria, necessarily. For example, the use of incurred sample reanalysis (ISR) acceptance criteria is not necessary for regulatory submission. Bioanalysts may use them at their discretion. Reference for evaluation of correlation between bioanalytical methods. Gleason et. al., 2020: Bioanalysis 12(6):419-426<br>
54
Section 6 Example 3
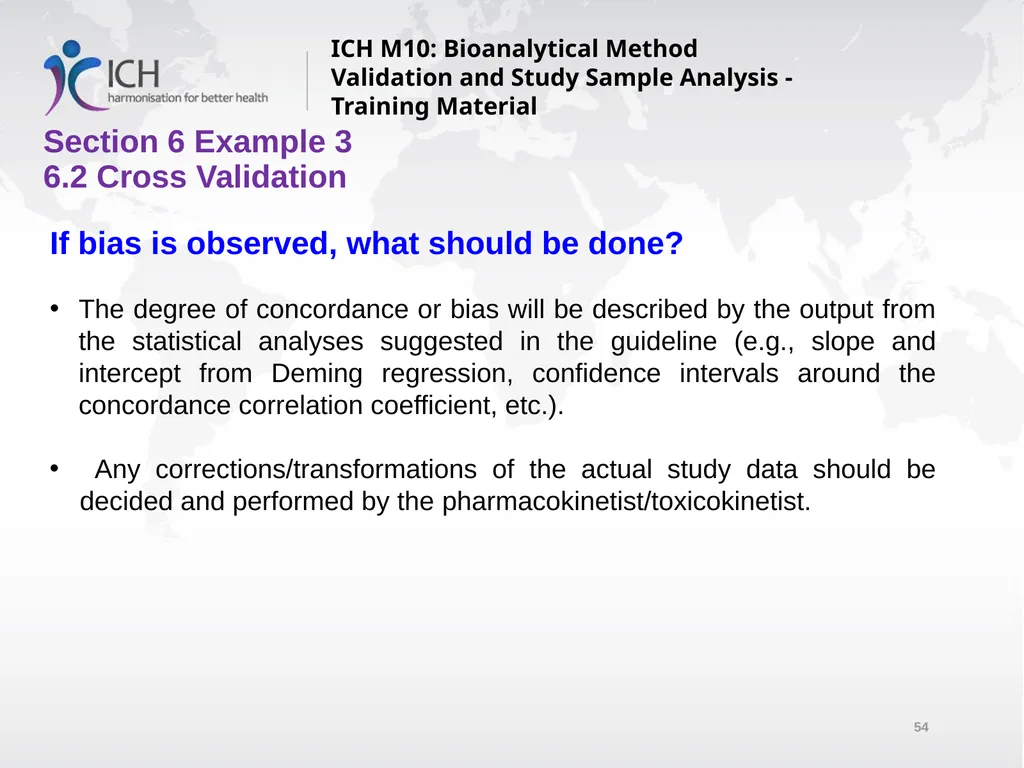
6.2 Cross Validation ICH M10: Bioanalytical Method Validation and Study Sample Analysis - Training Material If bias is observed, what should be done?
The degree of concordance or bias will be described by the output from the statistical analyses suggested in the guideline (e.g., slope and intercept from Deming regression, confidence intervals around the concordance correlation coefficient, etc.).
Any corrections/transformations of the actual study data should be decided and performed by the pharmacokinetist/toxicokinetist.<br>
The degree of concordance or bias will be described by the output from the statistical analyses suggested in the guideline (e.g., slope and intercept from Deming regression, confidence intervals around the concordance correlation coefficient, etc.).
Any corrections/transformations of the actual study data should be decided and performed by the pharmacokinetist/toxicokinetist.<br>
55
Section 6 Example 4
6.2 Cross Validation ICH M10: Bioanalytical Method Validation and Study Sample Analysis - Training Material How do you cross-validate methods with non-overlapping calibration ranges?
A situation for cross validating non-overlapping calibration ranges would be a rare exception. The use of two assays with different ranges within a study should be avoided.
When comparing two different assays with different ranges that are used in two separate studies, QCs and incurred samples from the high range can be diluted to fall within the low range assay. The dilution will need to be performed using a validated dilution factor.<br>
A situation for cross validating non-overlapping calibration ranges would be a rare exception. The use of two assays with different ranges within a study should be avoided.
When comparing two different assays with different ranges that are used in two separate studies, QCs and incurred samples from the high range can be diluted to fall within the low range assay. The dilution will need to be performed using a validated dilution factor.<br>
56
ICH M10: Bioanalytical Method Validation and Study Sample Analysis - Training Material Section 7:
Additional Considerations
Examples<br>
Additional Considerations
Examples<br>
57
Section 7 Example 1
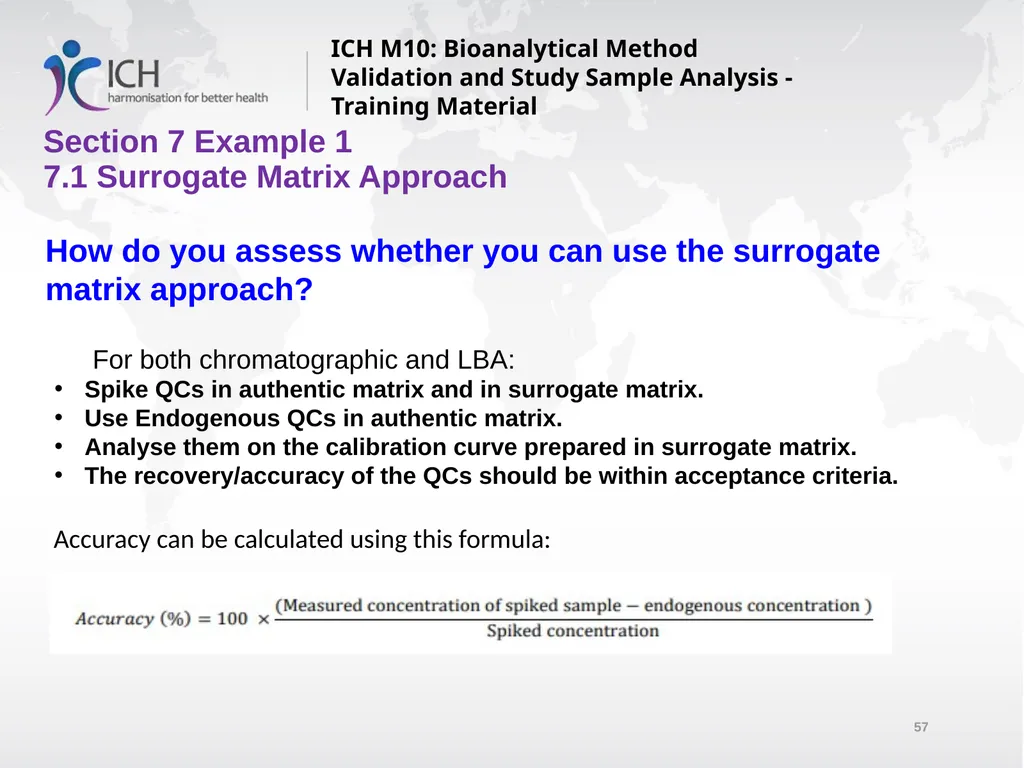
7.1 Surrogate Matrix Approach ICH M10: Bioanalytical Method Validation and Study Sample Analysis - Training Material How do you assess whether you can use the surrogate matrix approach?
For both chromatographic and LBA:
Spike QCs in authentic matrix and in surrogate matrix.
Use Endogenous QCs in authentic matrix.
Analyse them on the calibration curve prepared in surrogate matrix.
The recovery/accuracy of the QCs should be within acceptance criteria.
Accuracy can be calculated using this formula:<br>
For both chromatographic and LBA:
Spike QCs in authentic matrix and in surrogate matrix.
Use Endogenous QCs in authentic matrix.
Analyse them on the calibration curve prepared in surrogate matrix.
The recovery/accuracy of the QCs should be within acceptance criteria.
Accuracy can be calculated using this formula:<br>
58
Section 7 Example 1(continued)
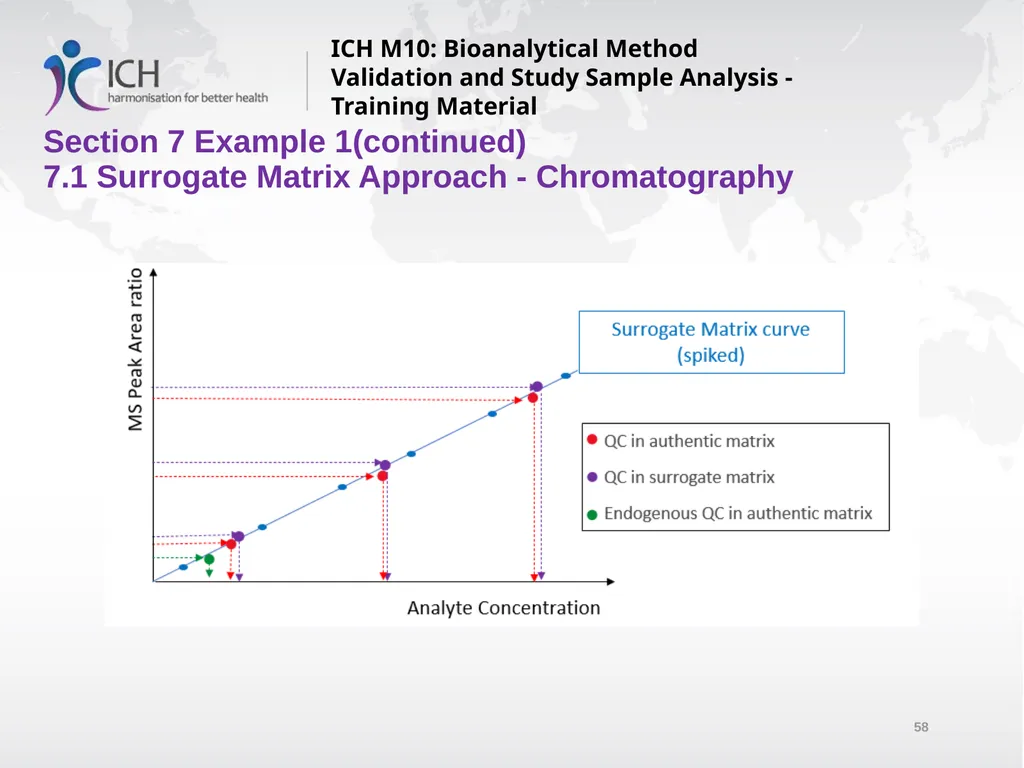
7.1 Surrogate Matrix Approach - Chromatography ICH M10: Bioanalytical Method Validation and Study Sample Analysis - Training Material<br>
59
Section 7 Example 2
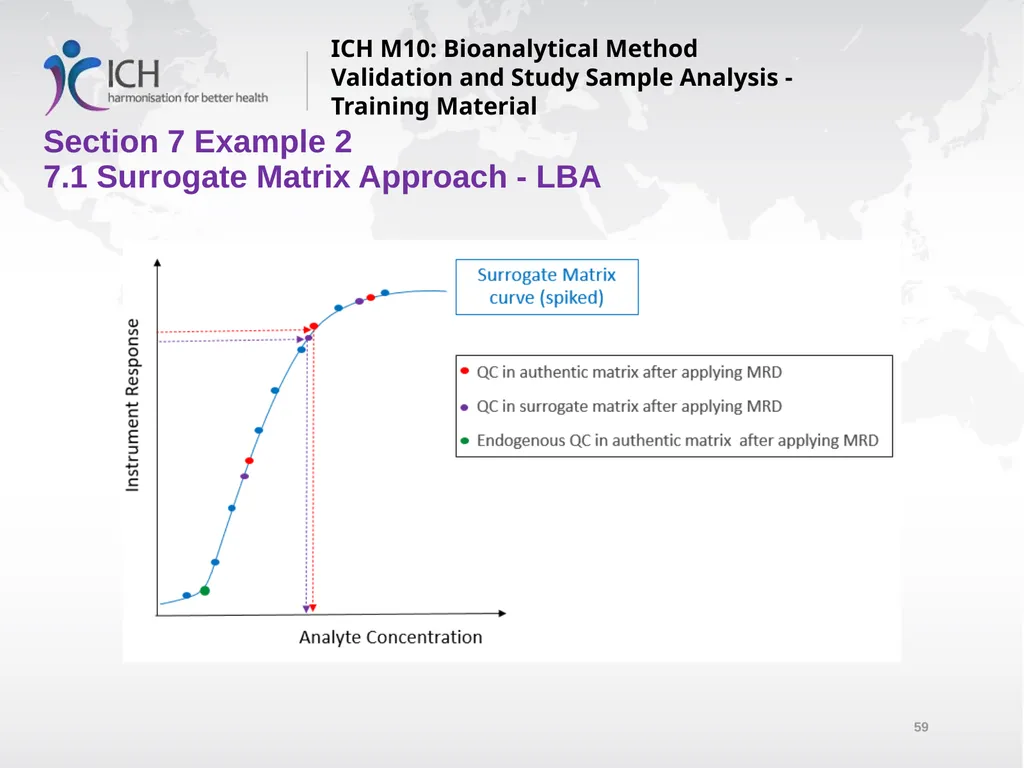
7.1 Surrogate Matrix Approach - LBA ICH M10: Bioanalytical Method Validation and Study Sample Analysis - Training Material<br>
60
Section 7 Example 3
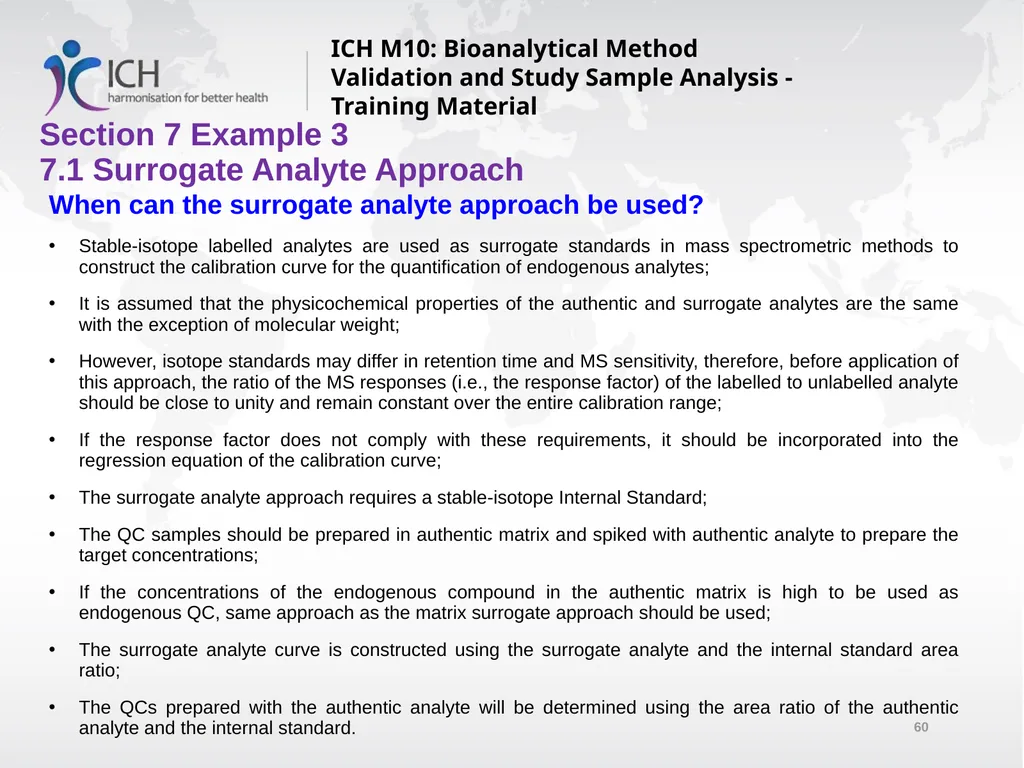
7.1 Surrogate Analyte Approach ICH M10: Bioanalytical Method Validation and Study Sample Analysis - Training Material When can the surrogate analyte approach be used?
Stable-isotope labelled analytes are used as surrogate standards in mass spectrometric methods to construct the calibration curve for the quantification of endogenous analytes;
It is assumed that the physicochemical properties of the authentic and surrogate analytes are the same with the exception of molecular weight;
However, isotope standards may differ in retention time and MS sensitivity, therefore, before application of this approach, the ratio of the MS responses (i.e., the response factor) of the labelled to unlabelled analyte should be close to unity and remain constant over the entire calibration range;
If the response factor does not comply with these requirements, it should be incorporated into the regression equation of the calibration curve;
The surrogate analyte approach requires a stable-isotope Internal Standard;
The QC samples should be prepared in authentic matrix and spiked with authentic analyte to prepare the target concentrations;
If the concentrations of the endogenous compound in the authentic matrix is high to be used as endogenous QC, same approach as the matrix surrogate approach should be used;
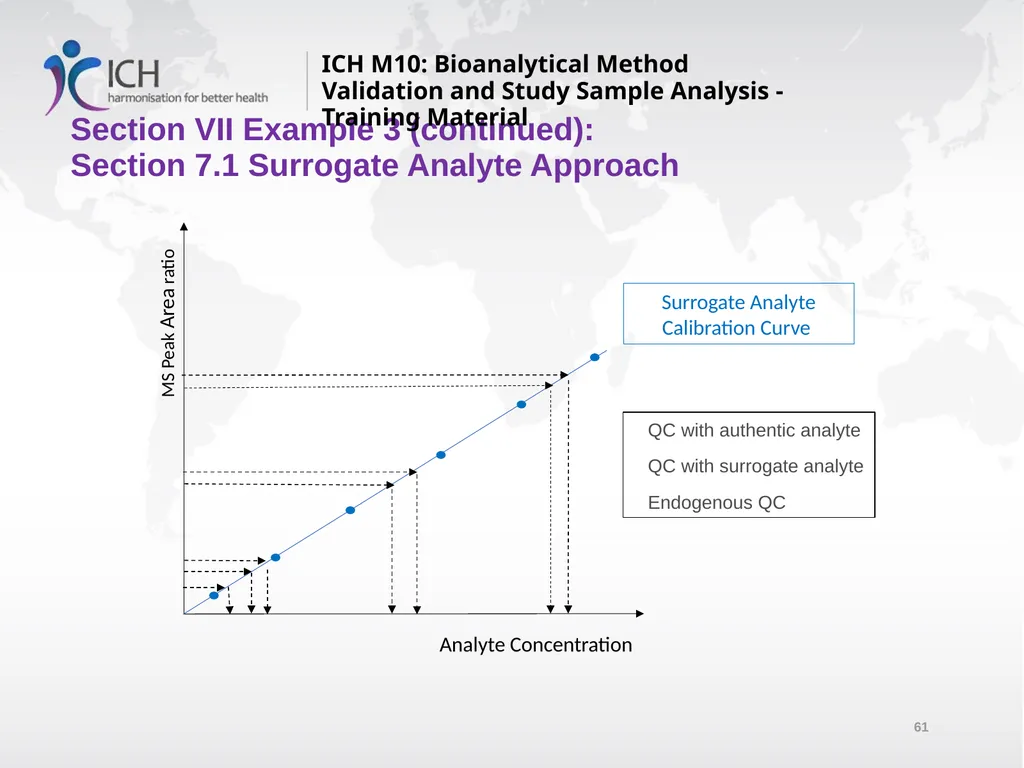
The surrogate analyte curve is constructed using the surrogate analyte and the internal standard area ratio;
The QCs prepared with the authentic analyte will be determined using the area ratio of the authentic analyte and the internal standard.<br>
Stable-isotope labelled analytes are used as surrogate standards in mass spectrometric methods to construct the calibration curve for the quantification of endogenous analytes;
It is assumed that the physicochemical properties of the authentic and surrogate analytes are the same with the exception of molecular weight;
However, isotope standards may differ in retention time and MS sensitivity, therefore, before application of this approach, the ratio of the MS responses (i.e., the response factor) of the labelled to unlabelled analyte should be close to unity and remain constant over the entire calibration range;
If the response factor does not comply with these requirements, it should be incorporated into the regression equation of the calibration curve;
The surrogate analyte approach requires a stable-isotope Internal Standard;
The QC samples should be prepared in authentic matrix and spiked with authentic analyte to prepare the target concentrations;
If the concentrations of the endogenous compound in the authentic matrix is high to be used as endogenous QC, same approach as the matrix surrogate approach should be used;
The surrogate analyte curve is constructed using the surrogate analyte and the internal standard area ratio;
The QCs prepared with the authentic analyte will be determined using the area ratio of the authentic analyte and the internal standard.<br>
61
MS Peak Area ratio Surrogate Analyte Calibration Curve Analyte Concentration Section VII Example 3 (continued):
Section 7.1 Surrogate Analyte Approach QC with authentic analyte
QC with surrogate analyte
Endogenous QC ICH M10: Bioanalytical Method Validation and Study Sample Analysis - Training Material<br>
Section 7.1 Surrogate Analyte Approach QC with authentic analyte
QC with surrogate analyte
Endogenous QC ICH M10: Bioanalytical Method Validation and Study Sample Analysis - Training Material<br>
62
Section 7 Example 4
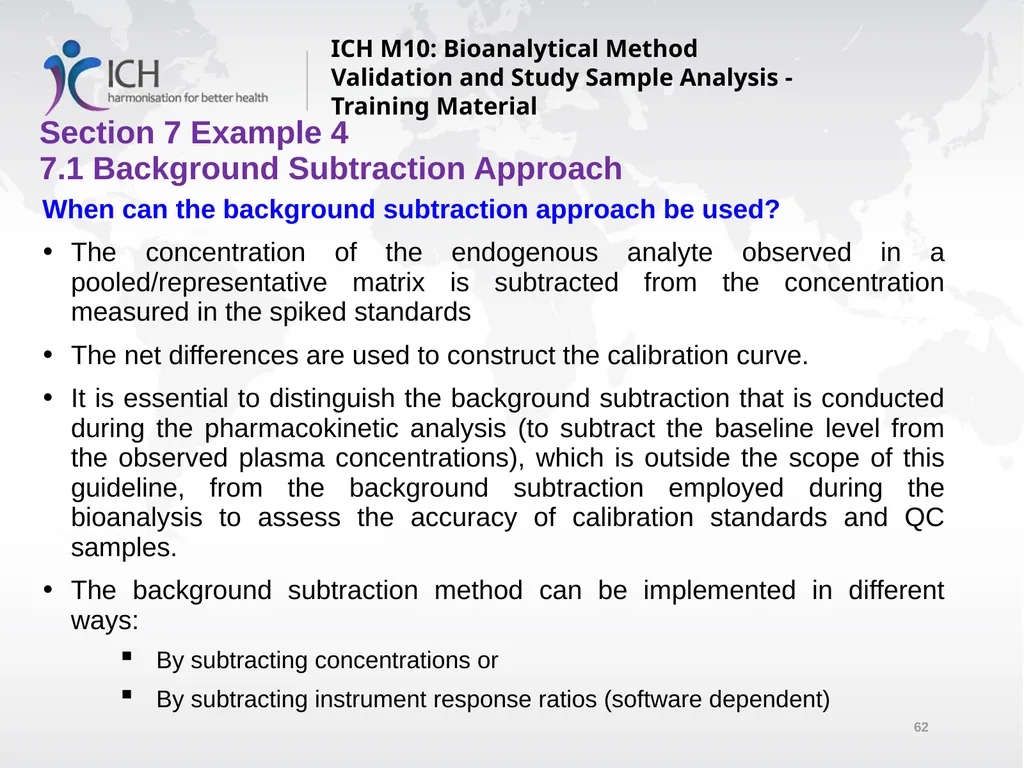
7.1 Background Subtraction Approach ICH M10: Bioanalytical Method Validation and Study Sample Analysis - Training Material When can the background subtraction approach be used?
The concentration of the endogenous analyte observed in a pooled/representative matrix is subtracted from the concentration measured in the spiked standards
The net differences are used to construct the calibration curve.
It is essential to distinguish the background subtraction that is conducted during the pharmacokinetic analysis (to subtract the baseline level from the observed plasma concentrations), which is outside the scope of this guideline, from the background subtraction employed during the bioanalysis to assess the accuracy of calibration standards and QC samples.
The background subtraction method can be implemented in different ways:
By subtracting concentrations or
By subtracting instrument response ratios (software dependent)<br>
The concentration of the endogenous analyte observed in a pooled/representative matrix is subtracted from the concentration measured in the spiked standards
The net differences are used to construct the calibration curve.
It is essential to distinguish the background subtraction that is conducted during the pharmacokinetic analysis (to subtract the baseline level from the observed plasma concentrations), which is outside the scope of this guideline, from the background subtraction employed during the bioanalysis to assess the accuracy of calibration standards and QC samples.
The background subtraction method can be implemented in different ways:
By subtracting concentrations or
By subtracting instrument response ratios (software dependent)<br>
63
Section 7 Example 4a (continued)
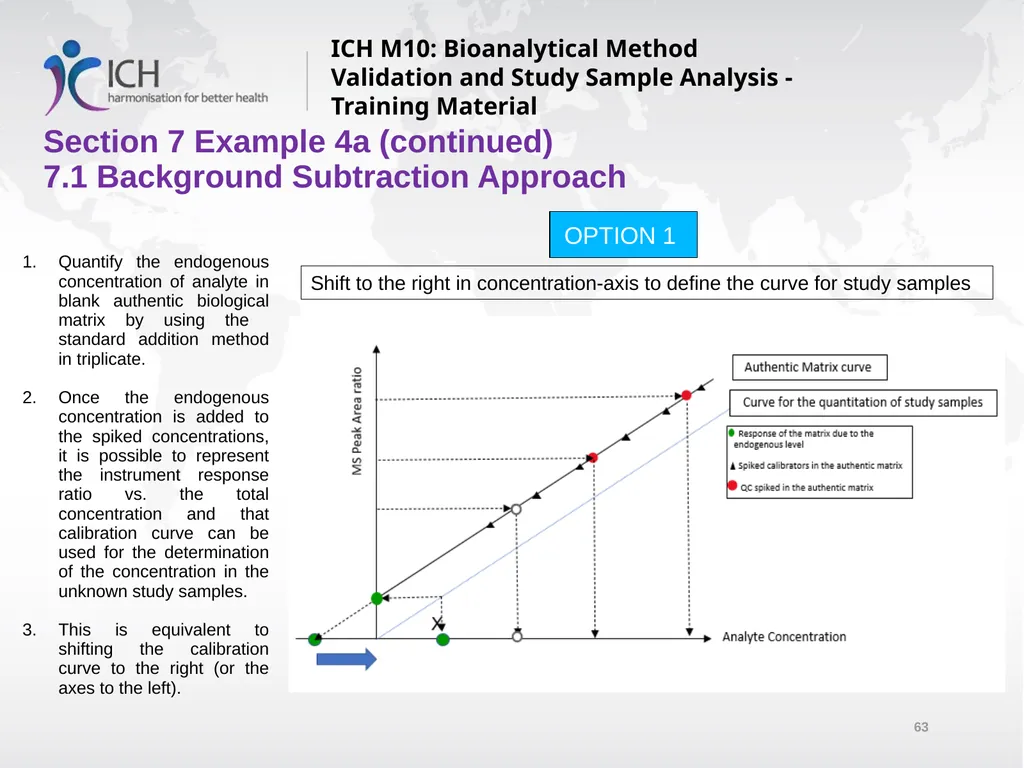
7.1 Background Subtraction Approach ICH M10: Bioanalytical Method Validation and Study Sample Analysis - Training Material Quantify the endogenous concentration of analyte in blank authentic biological matrix by using the standard addition method in triplicate.
Once the endogenous concentration is added to the spiked concentrations, it is possible to represent the instrument response ratio vs. the total concentration and that calibration curve can be used for the determination of the concentration in the unknown study samples.
This is equivalent to shifting the calibration curve to the right (or the axes to the left). OPTION 1 Shift to the right in concentration-axis to define the curve for study samples<br>
Once the endogenous concentration is added to the spiked concentrations, it is possible to represent the instrument response ratio vs. the total concentration and that calibration curve can be used for the determination of the concentration in the unknown study samples.
This is equivalent to shifting the calibration curve to the right (or the axes to the left). OPTION 1 Shift to the right in concentration-axis to define the curve for study samples<br>
64
Section 7 Example 4b (continued)
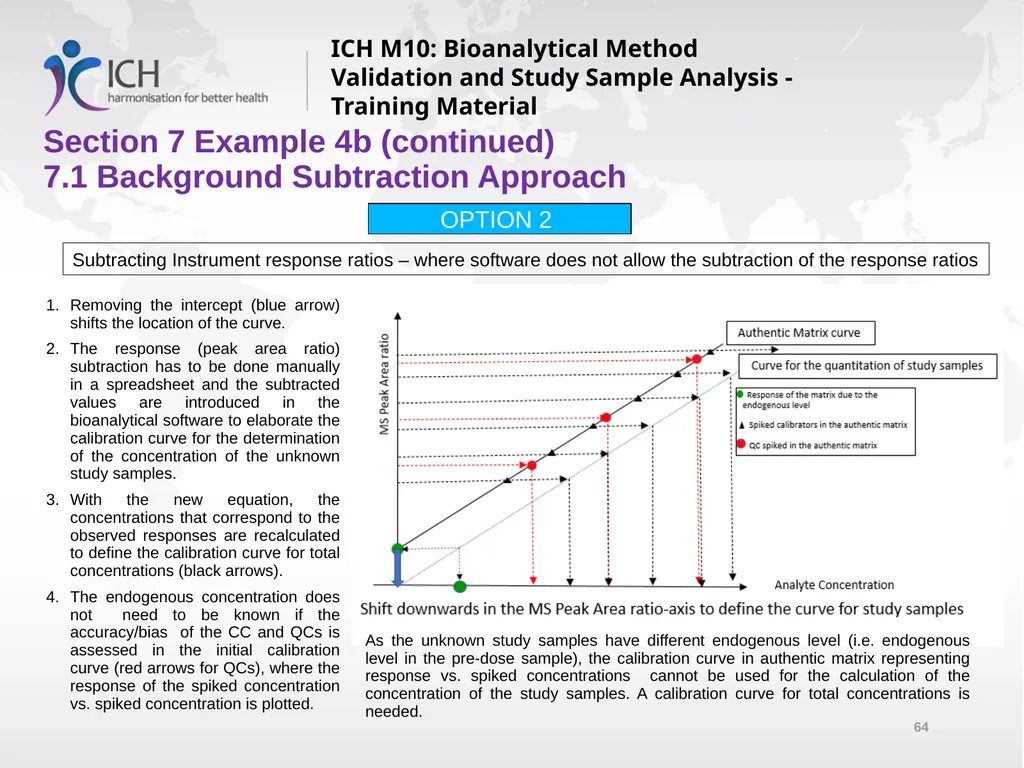
7.1 Background Subtraction Approach ICH M10: Bioanalytical Method Validation and Study Sample Analysis - Training Material OPTION 2 Subtracting Instrument response ratios – where software does not allow the subtraction of the response ratios Removing the intercept (blue arrow) shifts the location of the curve.
The response (peak area ratio) subtraction has to be done manually in a spreadsheet and the subtracted values are introduced in the bioanalytical software to elaborate the calibration curve for the determination of the concentration of the unknown study samples.
With the new equation, the concentrations that correspond to the observed responses are recalculated to define the calibration curve for total concentrations (black arrows).
The endogenous concentration does not need to be known if the accuracy/bias of the CC and QCs is assessed in the initial calibration curve (red arrows for QCs), where the response of the spiked concentration vs. spiked concentration is plotted. As the unknown study samples have different endogenous level (i.e. endogenous level in the pre-dose sample), the calibration curve in authentic matrix representing response vs. spiked concentrations cannot be used for the calculation of the concentration of the study samples. A calibration curve for total concentrations is needed.<br>
The response (peak area ratio) subtraction has to be done manually in a spreadsheet and the subtracted values are introduced in the bioanalytical software to elaborate the calibration curve for the determination of the concentration of the unknown study samples.
With the new equation, the concentrations that correspond to the observed responses are recalculated to define the calibration curve for total concentrations (black arrows).
The endogenous concentration does not need to be known if the accuracy/bias of the CC and QCs is assessed in the initial calibration curve (red arrows for QCs), where the response of the spiked concentration vs. spiked concentration is plotted. As the unknown study samples have different endogenous level (i.e. endogenous level in the pre-dose sample), the calibration curve in authentic matrix representing response vs. spiked concentrations cannot be used for the calculation of the concentration of the study samples. A calibration curve for total concentrations is needed.<br>
65
Section 7 Example 4c (continued)
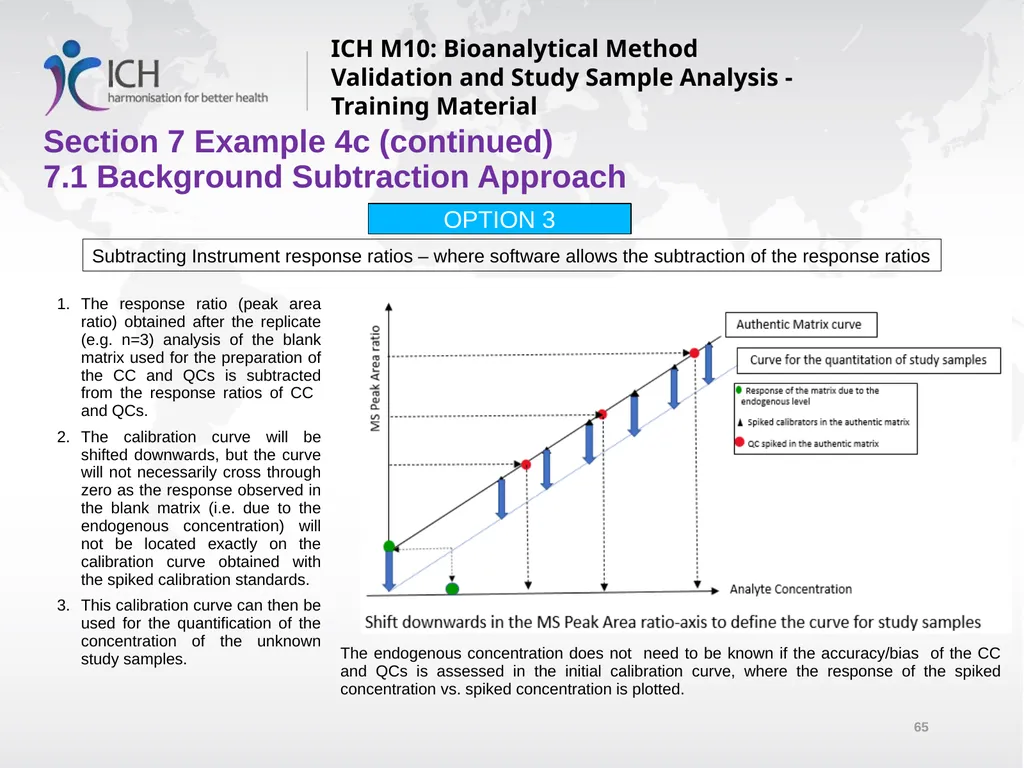
7.1 Background Subtraction Approach ICH M10: Bioanalytical Method Validation and Study Sample Analysis - Training Material OPTION 3 Subtracting Instrument response ratios – where software allows the subtraction of the response ratios The response ratio (peak area ratio) obtained after the replicate (e.g. n=3) analysis of the blank matrix used for the preparation of the CC and QCs is subtracted from the response ratios of CC and QCs.
The calibration curve will be shifted downwards, but the curve will not necessarily cross through zero as the response observed in the blank matrix (i.e. due to the endogenous concentration) will not be located exactly on the calibration curve obtained with the spiked calibration standards.
This calibration curve can then be used for the quantification of the concentration of the unknown study samples. The endogenous concentration does not need to be known if the accuracy/bias of the CC and QCs is assessed in the initial calibration curve, where the response of the spiked concentration vs. spiked concentration is plotted.<br>
The calibration curve will be shifted downwards, but the curve will not necessarily cross through zero as the response observed in the blank matrix (i.e. due to the endogenous concentration) will not be located exactly on the calibration curve obtained with the spiked calibration standards.
This calibration curve can then be used for the quantification of the concentration of the unknown study samples. The endogenous concentration does not need to be known if the accuracy/bias of the CC and QCs is assessed in the initial calibration curve, where the response of the spiked concentration vs. spiked concentration is plotted.<br>
66
Section 7 Example 4 (continued)
7.1 Background Subtraction Approach ICH M10: Bioanalytical Method Validation and Study Sample Analysis - Training Material Advantages and Disadvantages
Disadvantages
In all these three options there is certain degree of bias.
If concentrations are subtracted, the bias is caused by the error in the quantification of the endogenous concentration.
If the response (peak area ratios) is subtracted by eliminating the intercept from the equation, the bias is the one associated to the equation since the calibration curves do not generally cross through the origin of the axes
If the response (peak area ratios) is subtracted by using the mean response of replicate determinations of the blank matrix used for the preparation of CC and QC samples, the bias is associated to that response measurement.
Advantages
By subtracting the response (peak area ratios), the endogenous concentration does not need to be known, which is an advantage when the response of the blank is < LLOQ.<br>
Disadvantages
In all these three options there is certain degree of bias.
If concentrations are subtracted, the bias is caused by the error in the quantification of the endogenous concentration.
If the response (peak area ratios) is subtracted by eliminating the intercept from the equation, the bias is the one associated to the equation since the calibration curves do not generally cross through the origin of the axes
If the response (peak area ratios) is subtracted by using the mean response of replicate determinations of the blank matrix used for the preparation of CC and QC samples, the bias is associated to that response measurement.
Advantages
By subtracting the response (peak area ratios), the endogenous concentration does not need to be known, which is an advantage when the response of the blank is < LLOQ.<br>
67
Section 7 Example 5
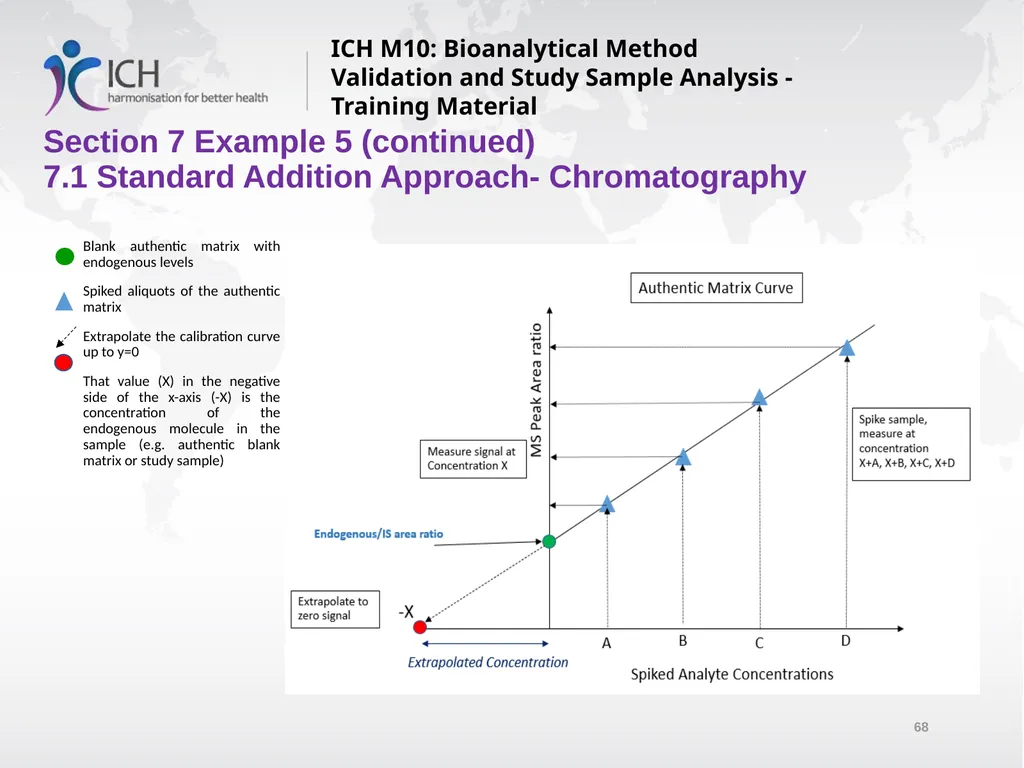
7.1 Standard Addition Approach ICH M10: Bioanalytical Method Validation and Study Sample Analysis - Training Material When can the Standard Addition approach be used?
The standard addition approach is only applicable for linear responses.
More common for chromatographic rather than LBA methods, which are usually not linear
It is used to determine the concentration of the endogenous analyte in the authentic matrix to be used for preparation of standards and QCs.
However, this approach can be employed for determination of study samples as well.
Disadvantages: Too time-consuming and large sample volume is needed
Advantage: There is no impact if different matrix effects are observed in each sample
In this approach, every study sample is divided into aliquots of equal volume.
All aliquots, but one, are separately spiked with known and varying amounts of the analyte standards to construct a calibration curve for either the authentic blank matrix or every study sample (e.g., with 3 to 5 points).
The endogenous blank concentration or the study sample concentration is then determined as the negative x-intercept of the standard calibration curve prepared in that particular study sample.<br>
The standard addition approach is only applicable for linear responses.
More common for chromatographic rather than LBA methods, which are usually not linear
It is used to determine the concentration of the endogenous analyte in the authentic matrix to be used for preparation of standards and QCs.
However, this approach can be employed for determination of study samples as well.
Disadvantages: Too time-consuming and large sample volume is needed
Advantage: There is no impact if different matrix effects are observed in each sample
In this approach, every study sample is divided into aliquots of equal volume.
All aliquots, but one, are separately spiked with known and varying amounts of the analyte standards to construct a calibration curve for either the authentic blank matrix or every study sample (e.g., with 3 to 5 points).
The endogenous blank concentration or the study sample concentration is then determined as the negative x-intercept of the standard calibration curve prepared in that particular study sample.<br>
68
Section 7 Example 5 (continued)
7.1 Standard Addition Approach- Chromatography ICH M10: Bioanalytical Method Validation and Study Sample Analysis - Training Material Blank authentic matrix with endogenous levels
Spiked aliquots of the authentic matrix
Extrapolate the calibration curve up to y=0
That value (X) in the negative side of the x-axis (-X) is the concentration of the endogenous molecule in the sample (e.g. authentic blank matrix or study sample)<br>
Spiked aliquots of the authentic matrix
Extrapolate the calibration curve up to y=0
That value (X) in the negative side of the x-axis (-X) is the concentration of the endogenous molecule in the sample (e.g. authentic blank matrix or study sample)<br>
69
What is parallelism in connection with using surrogate matrix and surrogate analyte and when should it be addressed?
Parallelism should be investigated in method development and confirmed during method validation.
Parallelism compares the calibration curves prepared in authentic and surrogate matrix.
Parallelism assures that observed changes in response per given changes in analyte concentrations are equivalent for the surrogate and the authentic biological matrix across the range of the method as defined by:
Parallelism should be evaluated in the Surrogate Matrix and Surrogate Analyte Approaches, taking into account that parallelism is assessed differently in LBA and chromatographic methods.
The assessment of parallelism for endogenous molecules differs from non-endogenous molecules in which dilution integrity is assessed by diluting samples (refer to section 3.2.7)
What is the difference for parallelism between LBA and Chromatography?
For both platforms - Calibration curves are prepared in both authentic matrix and different surrogate matrices. QCs are also prepared in authentic matrix and surrogate matrices and the spike recovery at the 3 different levels should be within acceptance criteria on both curves using the equation above.
Chromatography – In addition to spike recovery, the standard addition approach could be used to show parallelism.
LBA – In addition, the surrogate matrix is usually the matrix employed to prepare the MRD in the authentic matrix. Section VII Example 6:
Section 7.1.3 Endogenous Molecule-Parallelism ICH M10: Bioanalytical Method Validation and Study Sample Analysis - Training Material<br>
Parallelism should be investigated in method development and confirmed during method validation.
Parallelism compares the calibration curves prepared in authentic and surrogate matrix.
Parallelism assures that observed changes in response per given changes in analyte concentrations are equivalent for the surrogate and the authentic biological matrix across the range of the method as defined by:
Parallelism should be evaluated in the Surrogate Matrix and Surrogate Analyte Approaches, taking into account that parallelism is assessed differently in LBA and chromatographic methods.
The assessment of parallelism for endogenous molecules differs from non-endogenous molecules in which dilution integrity is assessed by diluting samples (refer to section 3.2.7)
What is the difference for parallelism between LBA and Chromatography?
For both platforms - Calibration curves are prepared in both authentic matrix and different surrogate matrices. QCs are also prepared in authentic matrix and surrogate matrices and the spike recovery at the 3 different levels should be within acceptance criteria on both curves using the equation above.
Chromatography – In addition to spike recovery, the standard addition approach could be used to show parallelism.
LBA – In addition, the surrogate matrix is usually the matrix employed to prepare the MRD in the authentic matrix. Section VII Example 6:
Section 7.1.3 Endogenous Molecule-Parallelism ICH M10: Bioanalytical Method Validation and Study Sample Analysis - Training Material<br>
70
Surrogate Matrix Chromatography MS Peak Area ratio Authentic Matrix curve
(spiked or diluted) Parallel Surrogate Matrix curve Non-parallel Surrogate Matrix curve, as example of an unacceptable surrogate matrix Parallelism in chromatographic methods can be assessed by:
Spike recovery of QCs
Standard addition MS Peak Area ratio Analyte Concentrations Section VII Example 6 (cont’d):
Section 7.1.3 Endogenous Molecule-Parallelism ICH M10: Bioanalytical Method Validation and Study Sample Analysis - Training Material<br>
Spike recovery of QCs
Standard addition MS Peak Area ratio Analyte Concentrations Section VII Example 6 (cont’d):
Section 7.1.3 Endogenous Molecule-Parallelism ICH M10: Bioanalytical Method Validation and Study Sample Analysis - Training Material<br>
71
Section 7 Example 6 (continued)
7.1.3 Endogenous Molecule-Parallelism ICH M10: Bioanalytical Method Validation and Study Sample Analysis - Training Material Surrogate Matrix LBA Parallelism in LBA methods should be evaluated by the following steps:
Spike Recovery of QCs
Matrix effect (different MRD)<br>
Spike Recovery of QCs
Matrix effect (different MRD)<br>
72
Section 7 Example 7
7.6.1 Dry Matrix Methods ICH M10: Bioanalytical Method Validation and Study Sample Analysis - Training Material Is a cross validation required if the standard plasma/serum method is replaced with a microsampled plasma/serum method?
A change in volume will require a partial validation (see Section 6), similar to a routine serum/plasma method.
Is a cross validation required if the standard plasma/serum method is replaced with a microsampled dried blood method?
Yes, these are two different matrices, and a relationship/bias between the two measurements would need to be established.
Can the clinical microsampling method be used to support paediatric studies also?
In general, yes. Evaluation of the influence of haematocrit has to be considered during validation.<br>
A change in volume will require a partial validation (see Section 6), similar to a routine serum/plasma method.
Is a cross validation required if the standard plasma/serum method is replaced with a microsampled dried blood method?
Yes, these are two different matrices, and a relationship/bias between the two measurements would need to be established.
Can the clinical microsampling method be used to support paediatric studies also?
In general, yes. Evaluation of the influence of haematocrit has to be considered during validation.<br>
73
ICH M10: Bioanalytical Method Validation and Study Sample Analysis - Training Material Section 8:
Documentation
Examples<br>
Documentation
Examples<br>
74
Section 8: Example 1 ICH M10: Bioanalytical Method Validation and Study Sample Analysis - Training Material Table 1- Analysis: LC-MS/MS Run Summary Table<br>
75
Section 8: Example 2 ICH M10: Bioanalytical Method Validation and Study Sample Analysis - Training Material Table 2- Analysis: LBA Run Summary Table<br>
76
Conclusion ICH M10: Bioanalytical Method Validation and Study Sample Analysis - Training Material This harmonised guideline on the requirements for validation of bioanalytical methods and analysis of study samples will result in applying the same scientific regulatory requirements in different regions, avoiding unnecessary duplicative testing and support streamlined global drug development.
The examples presented illustrate one or some ways to address specific issues, but other solutions may be possible.<br>
The examples presented illustrate one or some ways to address specific issues, but other solutions may be possible.<br>