
Incorporating Digitisation in Asset Management
Description: Incorporating Digitisation in Asset Management Live OEE MEASUREMENT What is OEE OEE is simply stated as the calculation of the product of Availability, Performance and Quality. In real world applications there is not always a simple way to
Related Topics
Download Presentation
"Incorporating Digitisation in Asset Management" is the property of its rightful owner. Permission is granted to download and print the materials on this website for personal, non-commercial use only, and to display it on your personal computer provided you do not modify the materials and that you retain all copyright notices contained in the materials. By downloading content from our website, you accept the terms of this agreement.
Presentation Transcript
slide1. Incorporating Digitisation in Asset Management Live OEE MEASUREMENT<br>
slide2. What is OEE OEE is simply stated as the calculation of the product of Availability, Performance and Quality.
In real world applications there is not always a simple way to get to these calculations as there are often perceived differences usually caused by different silos of views of the same issues.
Historical data may be recorded on paper based systems that are sometimes captured into excel sheets for analysis days, weeks or even months later.
A critical part of OEE is to standardize and agree the way that these values are measured and calculated across the organization.<br>
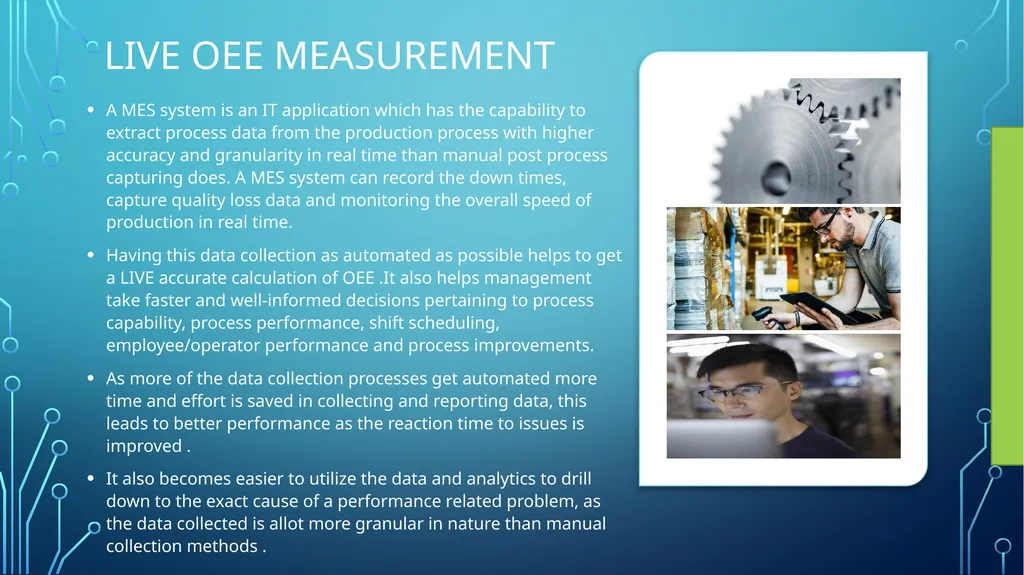
slide3. Live OEE Measurement A MES system is an IT application which has the capability to extract process data from the production process with higher accuracy and granularity in real time than manual post process capturing does. A MES system can record the down times, capture quality loss data and monitoring the overall speed of production in real time.
Having this data collection as automated as possible helps to get a LIVE accurate calculation of OEE .It also helps management take faster and well-informed decisions pertaining to process capability, process performance, shift scheduling, employee/operator performance and process improvements.
As more of the data collection processes get automated more time and effort is saved in collecting and reporting data, this leads to better performance as the reaction time to issues is improved .
It also becomes easier to utilize the data and analytics to drill down to the exact cause of a performance related problem, as the data collected is allot more granular in nature than manual collection methods .<br>
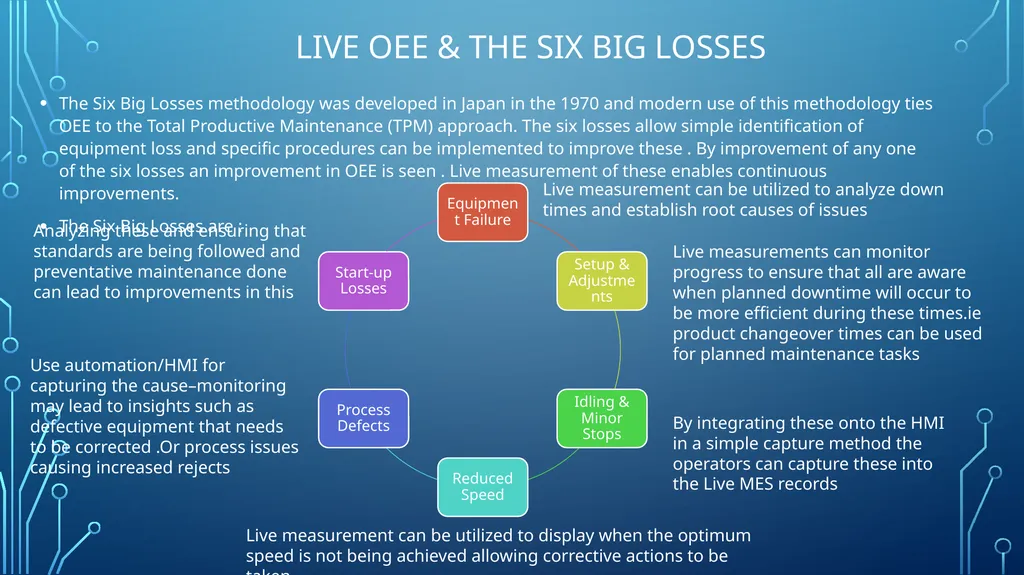
slide4. Live OEE & The Six Big Losses The Six Big Losses methodology was developed in Japan in the 1970 and modern use of this methodology ties OEE to the Total Productive Maintenance (TPM) approach. The six losses allow simple identification of equipment loss and specific procedures can be implemented to improve these . By improvement of any one of the six losses an improvement in OEE is seen . Live measurement of these enables continuous improvements.
The Six Big Losses are : Live measurement can be utilized to analyze down times and establish root causes of issues Live measurements can monitor progress to ensure that all are aware when planned downtime will occur to be more efficient during these times.ie product changeover times can be used for planned maintenance tasks By integrating these onto the HMI in a simple capture method the operators can capture these into the Live MES records Live measurement can be utilized to display when the optimum speed is not being achieved allowing corrective actions to be taken Use automation/HMI for capturing the cause–monitoring may lead to insights such as defective equipment that needs to be corrected .Or process issues causing increased rejects Analyzing these and ensuring that standards are being followed and preventative maintenance done can lead to improvements in this<br>
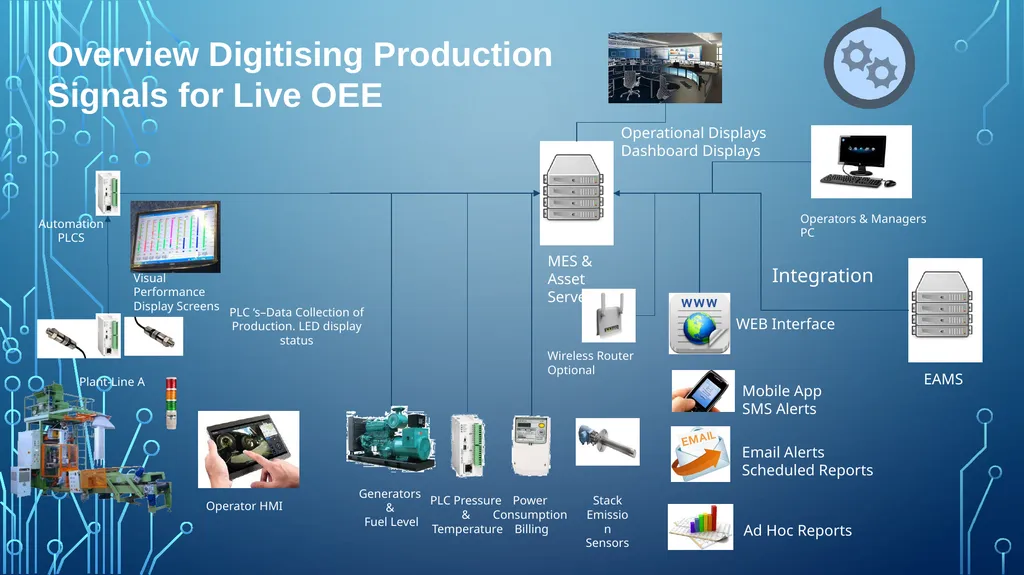
slide5. Overview Digitising Production Signals for Live OEE MES & Asset Server Visual Performance Display Screens Plant-Line A Operational Displays
Dashboard Displays WEB Interface Mobile App
SMS Alerts Email Alerts
Scheduled Reports PLC ‘s–Data Collection of Production. LED display status Operator HMI Ad Hoc Reports Operators & Managers PC EAMS Wireless Router
Optional Automation
PLCS Integration Stack Emission Sensors<br>
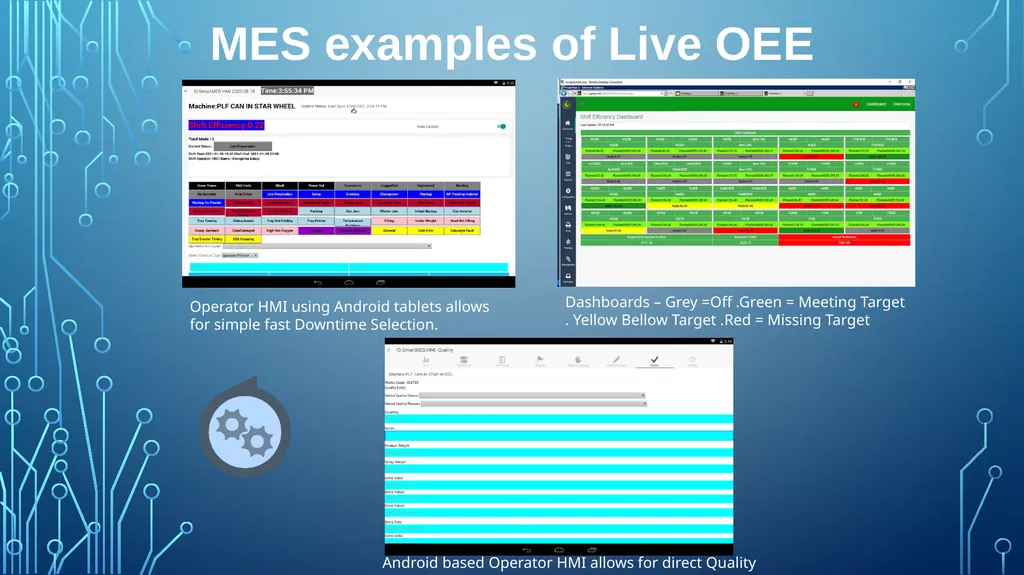
slide6. MES examples of Live OEE Operator HMI using Android tablets allows for simple fast Downtime Selection. Android based Operator HMI allows for direct Quality capturing. Dashboards – Grey =Off .Green = Meeting Target . Yellow Bellow Target .Red = Missing Target<br>
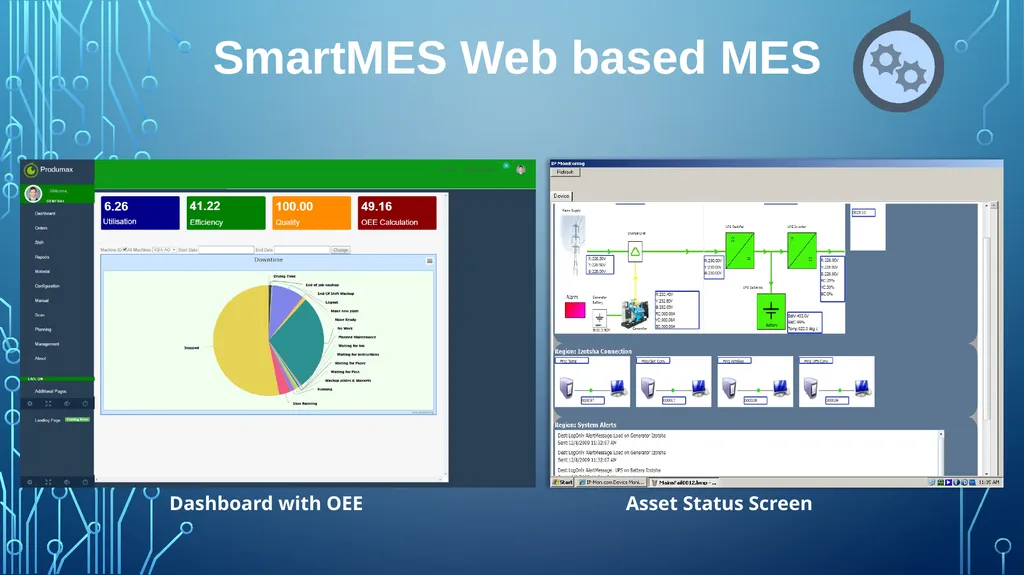
slide7. SmartMES Web based MES Dashboard with OEE Asset Status Screen<br>
slide8. LIVE OEE and the future iot/iiot/4ir/… The continued Automation of data gathering and sharing of information will become a key driver of industry efficiency and the way to measure this is still using OEE principals .
IOT and IIOT technologies makes gathering and sharing of this data simpler and more standardised . IIOT Connected smart anything's & client driven solutions are become more accessible .
Ability to use advance computer power on demand to predict trends using Machine learning , AI and advanced analytics by moving more data to the edge of the cloud and the cloud .
Meshed functionality with other systems including the use of Unified data spaces means systems sharing more information leads to further process improvements e.g. JIT manufacturers become aware of issues in supply chains before they impact their production schedule and can make arrangements to mitigate it . Using Meshed data sets often reveals hidden improvement areas .
In 2020 covid changed the global landscape most likely for a very long term and this impact was felt hugely in the manufacturing sector .
Key outcome of current changes are the ability to do more remotely with less physical contact. Anywhere operations became an overnight ideal. Key requirement is to make the data digital so that it can easily be viewed remotely .Distributed work force is now a reality where the Maintenance and Production management may not be onsite but will need accurate information on the production process status and issues .Be able to make planning and decisions on schedules and resources without physically seeing them .<br>
slide2. What is OEE OEE is simply stated as the calculation of the product of Availability, Performance and Quality.
In real world applications there is not always a simple way to get to these calculations as there are often perceived differences usually caused by different silos of views of the same issues.
Historical data may be recorded on paper based systems that are sometimes captured into excel sheets for analysis days, weeks or even months later.
A critical part of OEE is to standardize and agree the way that these values are measured and calculated across the organization.<br>
slide3. Live OEE Measurement A MES system is an IT application which has the capability to extract process data from the production process with higher accuracy and granularity in real time than manual post process capturing does. A MES system can record the down times, capture quality loss data and monitoring the overall speed of production in real time.
Having this data collection as automated as possible helps to get a LIVE accurate calculation of OEE .It also helps management take faster and well-informed decisions pertaining to process capability, process performance, shift scheduling, employee/operator performance and process improvements.
As more of the data collection processes get automated more time and effort is saved in collecting and reporting data, this leads to better performance as the reaction time to issues is improved .
It also becomes easier to utilize the data and analytics to drill down to the exact cause of a performance related problem, as the data collected is allot more granular in nature than manual collection methods .<br>
slide4. Live OEE & The Six Big Losses The Six Big Losses methodology was developed in Japan in the 1970 and modern use of this methodology ties OEE to the Total Productive Maintenance (TPM) approach. The six losses allow simple identification of equipment loss and specific procedures can be implemented to improve these . By improvement of any one of the six losses an improvement in OEE is seen . Live measurement of these enables continuous improvements.
The Six Big Losses are : Live measurement can be utilized to analyze down times and establish root causes of issues Live measurements can monitor progress to ensure that all are aware when planned downtime will occur to be more efficient during these times.ie product changeover times can be used for planned maintenance tasks By integrating these onto the HMI in a simple capture method the operators can capture these into the Live MES records Live measurement can be utilized to display when the optimum speed is not being achieved allowing corrective actions to be taken Use automation/HMI for capturing the cause–monitoring may lead to insights such as defective equipment that needs to be corrected .Or process issues causing increased rejects Analyzing these and ensuring that standards are being followed and preventative maintenance done can lead to improvements in this<br>
slide5. Overview Digitising Production Signals for Live OEE MES & Asset Server Visual Performance Display Screens Plant-Line A Operational Displays
Dashboard Displays WEB Interface Mobile App
SMS Alerts Email Alerts
Scheduled Reports PLC ‘s–Data Collection of Production. LED display status Operator HMI Ad Hoc Reports Operators & Managers PC EAMS Wireless Router
Optional Automation
PLCS Integration Stack Emission Sensors<br>
slide6. MES examples of Live OEE Operator HMI using Android tablets allows for simple fast Downtime Selection. Android based Operator HMI allows for direct Quality capturing. Dashboards – Grey =Off .Green = Meeting Target . Yellow Bellow Target .Red = Missing Target<br>
slide7. SmartMES Web based MES Dashboard with OEE Asset Status Screen<br>
slide8. LIVE OEE and the future iot/iiot/4ir/… The continued Automation of data gathering and sharing of information will become a key driver of industry efficiency and the way to measure this is still using OEE principals .
IOT and IIOT technologies makes gathering and sharing of this data simpler and more standardised . IIOT Connected smart anything's & client driven solutions are become more accessible .
Ability to use advance computer power on demand to predict trends using Machine learning , AI and advanced analytics by moving more data to the edge of the cloud and the cloud .
Meshed functionality with other systems including the use of Unified data spaces means systems sharing more information leads to further process improvements e.g. JIT manufacturers become aware of issues in supply chains before they impact their production schedule and can make arrangements to mitigate it . Using Meshed data sets often reveals hidden improvement areas .
In 2020 covid changed the global landscape most likely for a very long term and this impact was felt hugely in the manufacturing sector .
Key outcome of current changes are the ability to do more remotely with less physical contact. Anywhere operations became an overnight ideal. Key requirement is to make the data digital so that it can easily be viewed remotely .Distributed work force is now a reality where the Maintenance and Production management may not be onsite but will need accurate information on the production process status and issues .Be able to make planning and decisions on schedules and resources without physically seeing them .<br>