
Instrument Development: Measures of Caring and


Description: Instrument Development: Measures of Caring and Related Constructs Devices for Measuring Constructs Device test of knowledge, machine, psychometric (psychologic measurement) instrument Administration elicits a sample of behavior for many
Related Topics
Download Presentation
"Instrument Development: Measures of Caring and" is the property of its rightful owner. Permission is granted to download and print the materials on this website for personal, non-commercial use only, and to display it on your personal computer provided you do not modify the materials and that you retain all copyright notices contained in the materials. By downloading content from our website, you accept the terms of this agreement.
Presentation Transcript
slide1. Instrument Development: Measures of Caring and Related Constructs<br>
slide2. Devices for Measuring Constructs Device = test of knowledge, machine, psychometric (psychologic measurement) instrument
Administration elicits a sample of behavior for many purposes
Sample of behavior represented by numbers: ultimate reduction, also operationalization of constructs
Measurement: assign numbers to individuals’ responses, chart data, biophysiologic data, etc.<br>
slide3. Measurement: Defined Rules for assigning numbers to objects to represent quantities of attributes
Assign numbers to objects according to rules
Remember attributes of objects vary day to day, from situation to situation, or from one object to another
Variability: numeric expression that signifies how much of an attribute is present in the object
Quantification communicates that amount<br>
slide4. Rules and Measurement Numbers must be assigned to attributes of objects according to rules
Scores assigned systematically
The conditions and criteria with which the numeric values are assigned are specified
The measurement instrument must correspond with the real world of the object being measured
instruments help researchers to measure concepts/constructs/attributes<br>
slide5. Direct and Indirect Measures of Concept/Construct Direct Measures: straightforward measurement of concrete object
Indirect Measures: indicators of concept used to represent abstract concept<br>
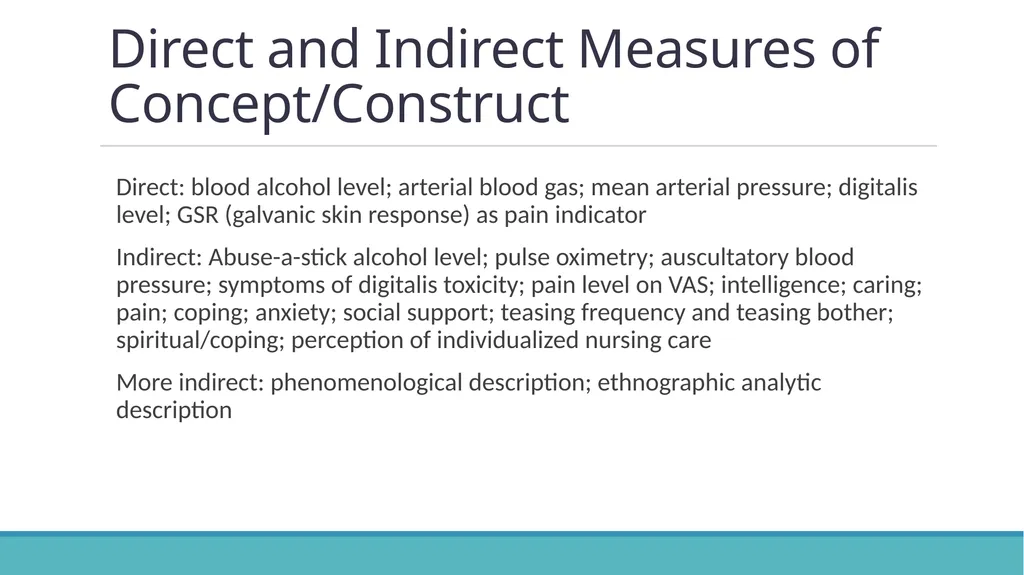
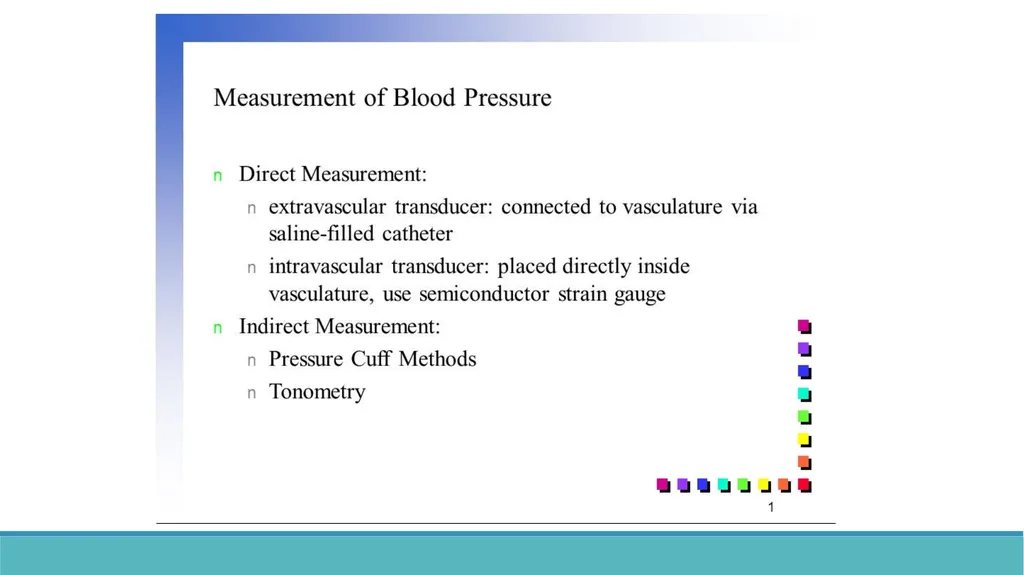
slide6. Direct and Indirect Measures of Concept/Construct Direct: blood alcohol level; arterial blood gas; mean arterial pressure; digitalis level; GSR (galvanic skin response) as pain indicator
Indirect: Abuse-a-stick alcohol level; pulse oximetry; auscultatory blood pressure; symptoms of digitalis toxicity; pain level on VAS; intelligence; caring; pain; coping; anxiety; social support; teasing frequency and teasing bother; spiritual/coping; perception of individualized nursing care
More indirect: phenomenological description; ethnographic analytic description<br>
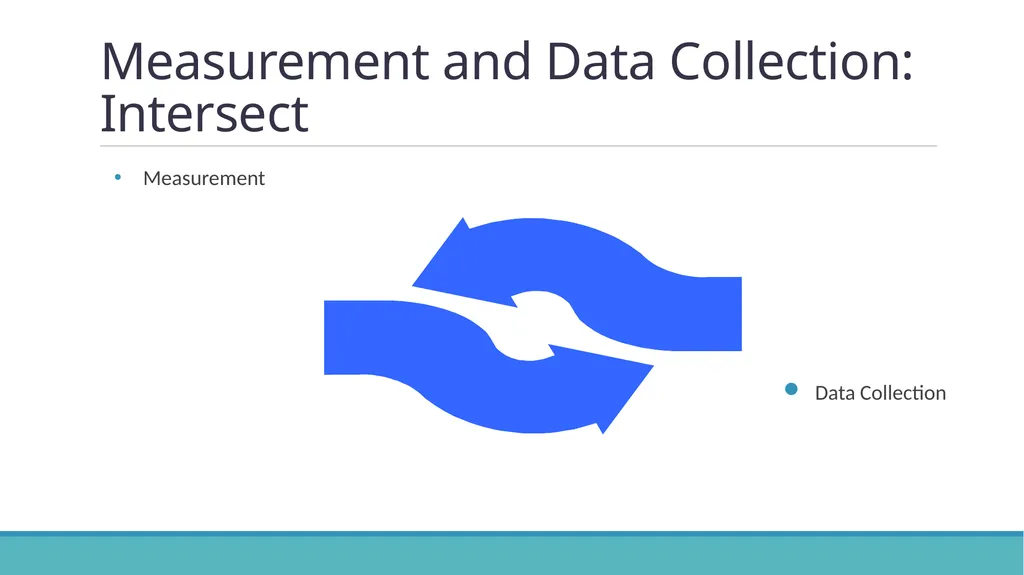
slide8. Measurement and Data Collection: Intersect Measurement
Data Collection<br>
slide9. Measurement Error Difference between what exists in reality and what is measured (obtained or observed score) by a research instrument
Measurement exists in direct and indirect measures
Measurement errors include:
Random error
Systematic error<br>
slide10. Variance: Errors of Measurement Systematic variance: leans in one direction; scores tend to be all positive, all negative, all high, or all low
Error is constant or biased
Glucometer and electronic thermometer that are not calibrated
Postpartum depression instrument measures depression scores too high<br>
slide11. Variance: Errors of Measurement Random error or error variance: variability of measures due to random fluctuations whose basic characteristic is that they (fluctuations) are self-compensatory
Unpredictable
Dialysis patients tested for cognitive functioning on first day of their dialysis schedule
Participant affected by family stress<br>
slide12. Factors Contributing to Errors of Measurement Situational contaminants (presence of researcher)
Transitory personal factors (anxiety)
Response-set biases (social desirability, extreme responses, acquiescence)
Administration variations (change test/instrument instructions)<br>
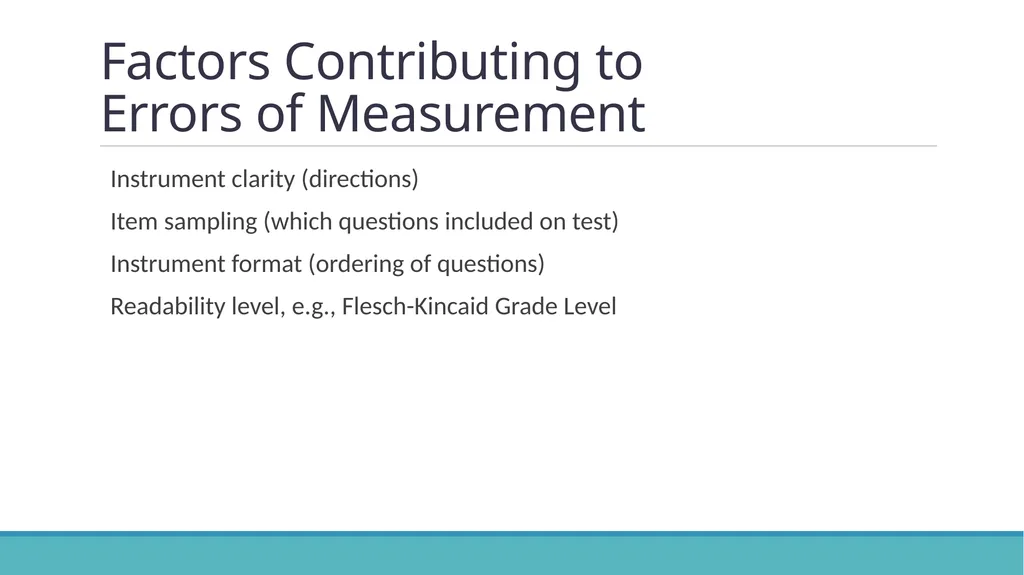
slide13. Factors Contributing to Errors of Measurement Instrument clarity (directions)
Item sampling (which questions included on test)
Instrument format (ordering of questions)
Readability level, e.g., Flesch-Kincaid Grade Level<br>
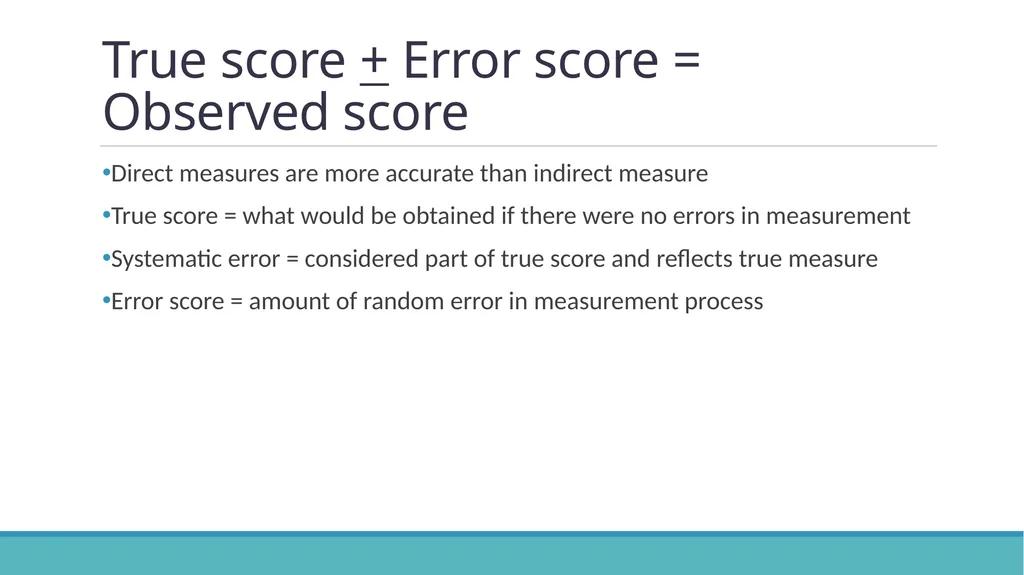
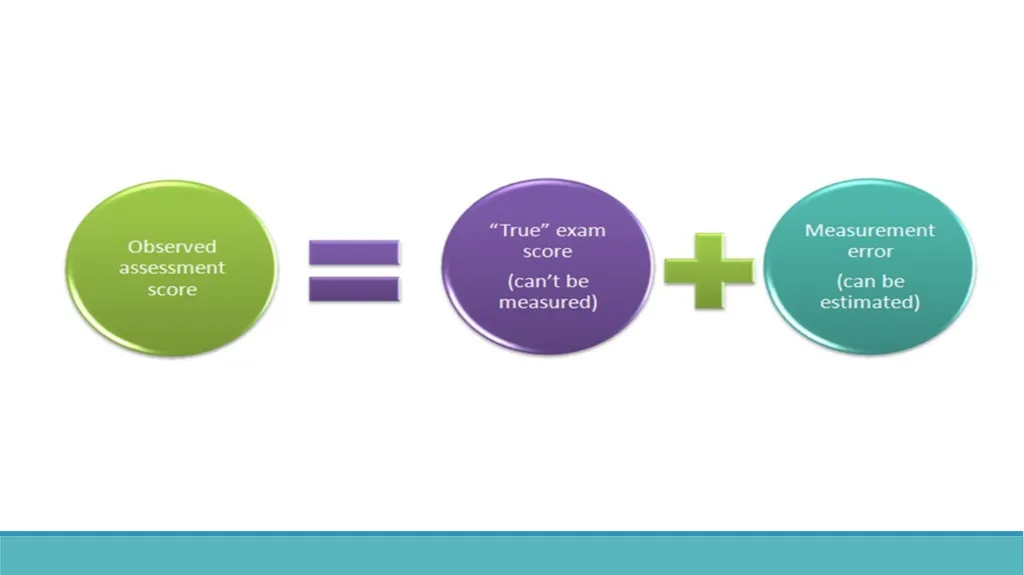
slide14. True score + Error score = Observed score Direct measures are more accurate than indirect measure
True score = what would be obtained if there were no errors in measurement
Systematic error = considered part of true score and reflects true measure
Error score = amount of random error in measurement process<br>
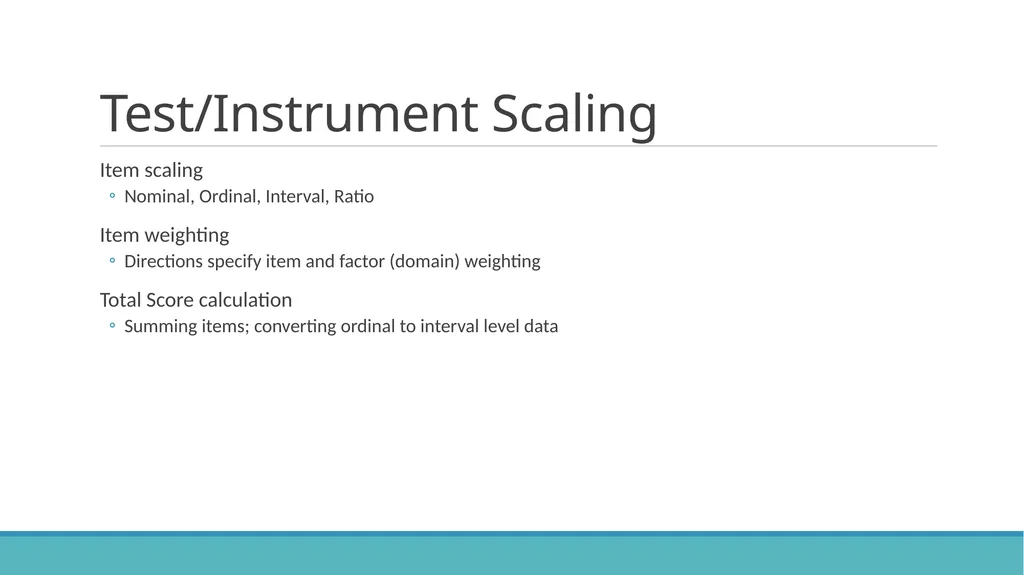
slide16. Test/Instrument Scaling Item scaling
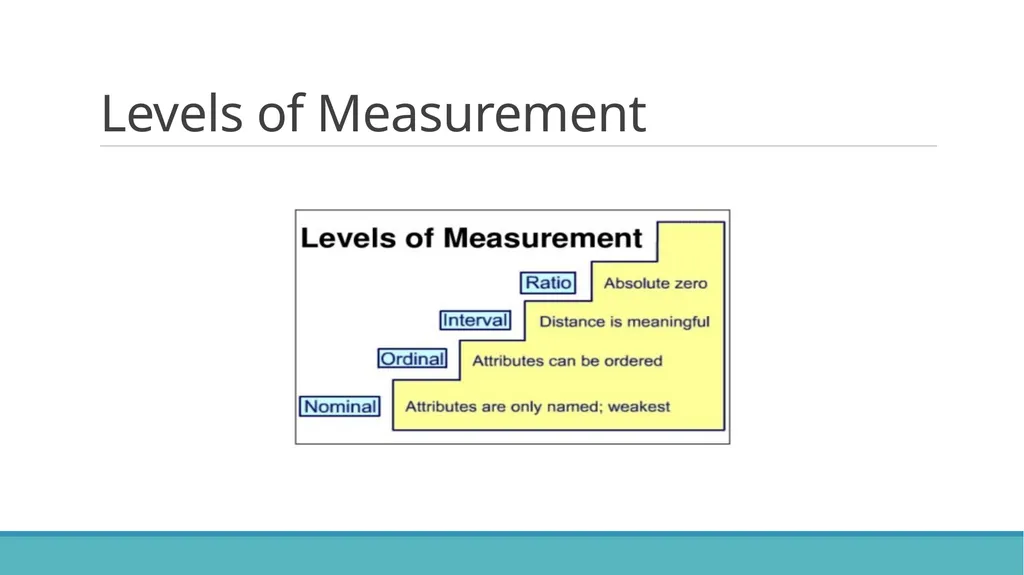
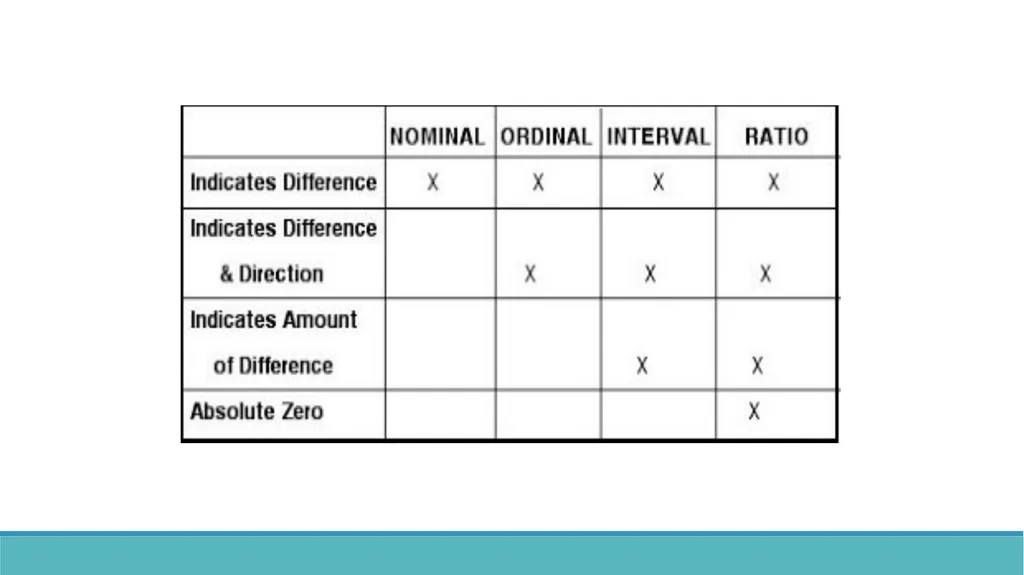
Nominal, Ordinal, Interval, Ratio
Item weighting
Directions specify item and factor (domain) weighting
Total Score calculation
Summing items; converting ordinal to interval level data<br>
slide17. Levels of Measurement<br>
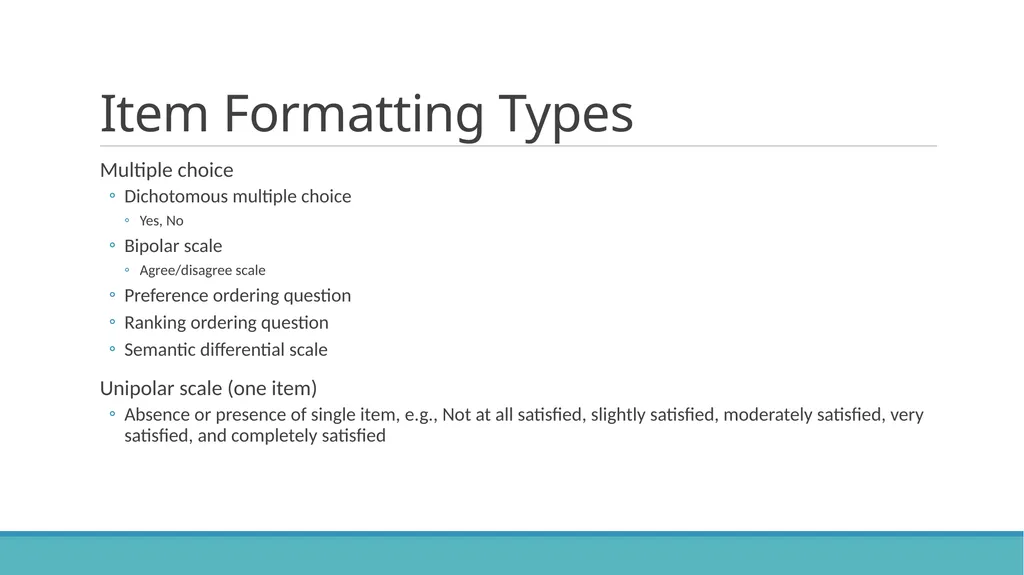
slide19. Item Formatting Types Multiple choice
Dichotomous multiple choice
Yes, No
Bipolar scale
Agree/disagree scale
Preference ordering question
Ranking ordering question
Semantic differential scale
Unipolar scale (one item)
Absence or presence of single item, e.g., Not at all satisfied, slightly satisfied, moderately satisfied, very satisfied, and completely satisfied<br>
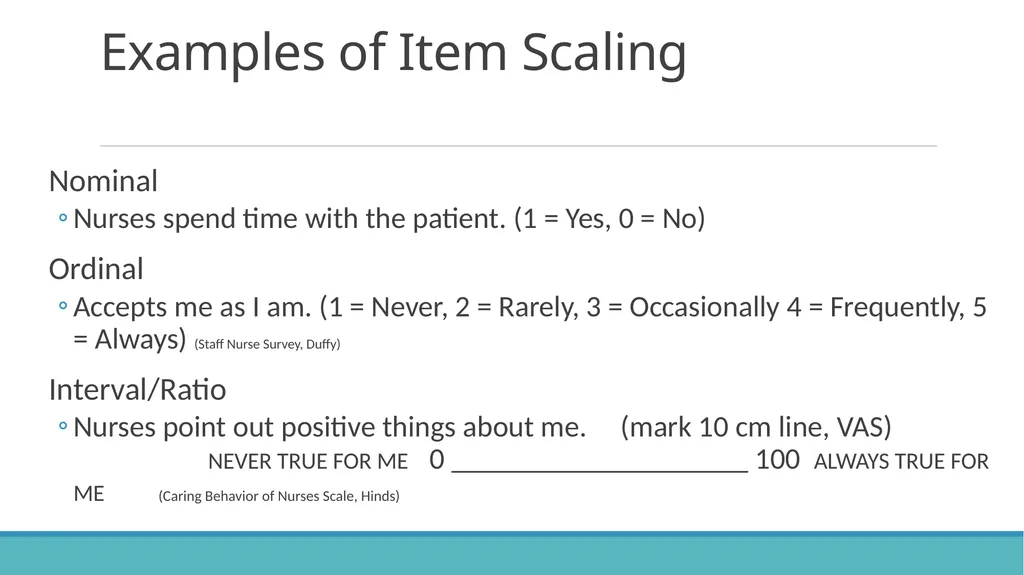
slide20. Examples of Item Scaling Nominal
Nurses spend time with the patient. (1 = Yes, 0 = No)
Ordinal
Accepts me as I am. (1 = Never, 2 = Rarely, 3 = Occasionally 4 = Frequently, 5 = Always) (Staff Nurse Survey, Duffy)
Interval/Ratio
Nurses point out positive things about me. (mark 10 cm line, VAS) NEVER TRUE FOR ME 0 ____________________ 100 ALWAYS TRUE FOR ME (Caring Behavior of Nurses Scale, Hinds)<br>
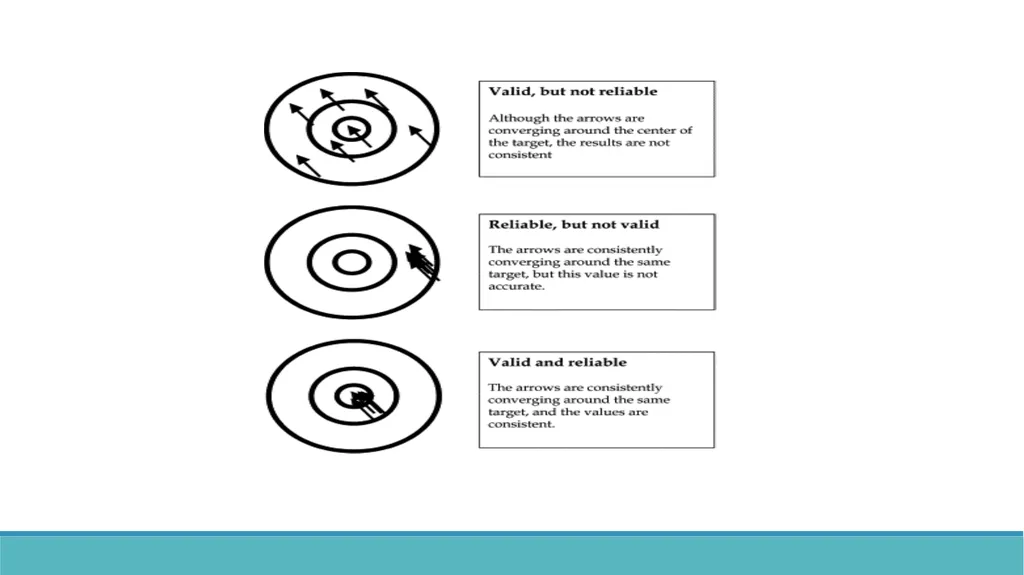
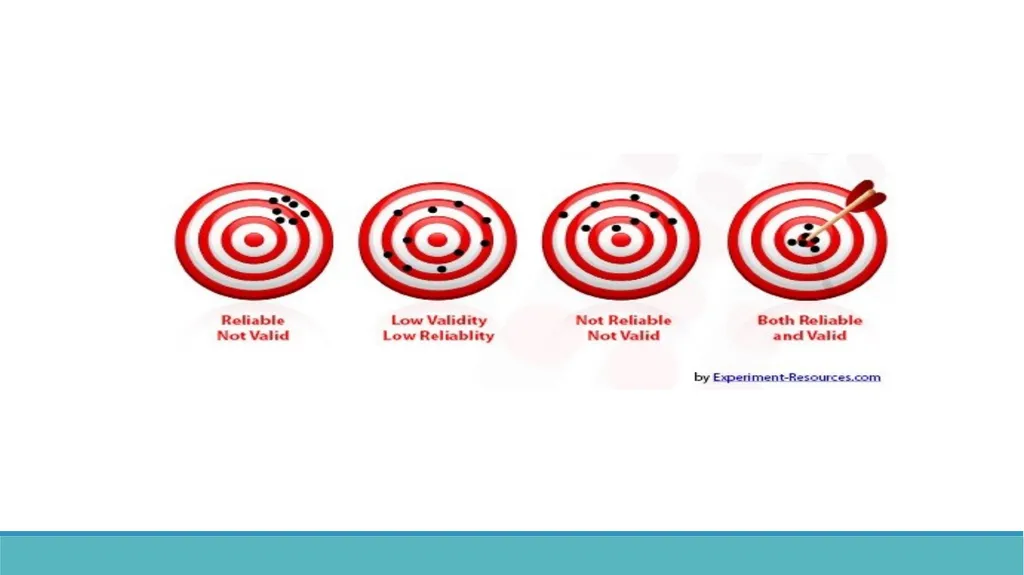
slide21. Reliability and Validity Both needed for valid instrument
Ongoing processes needed
e.g. reliability needs to be established with each new sample<br>
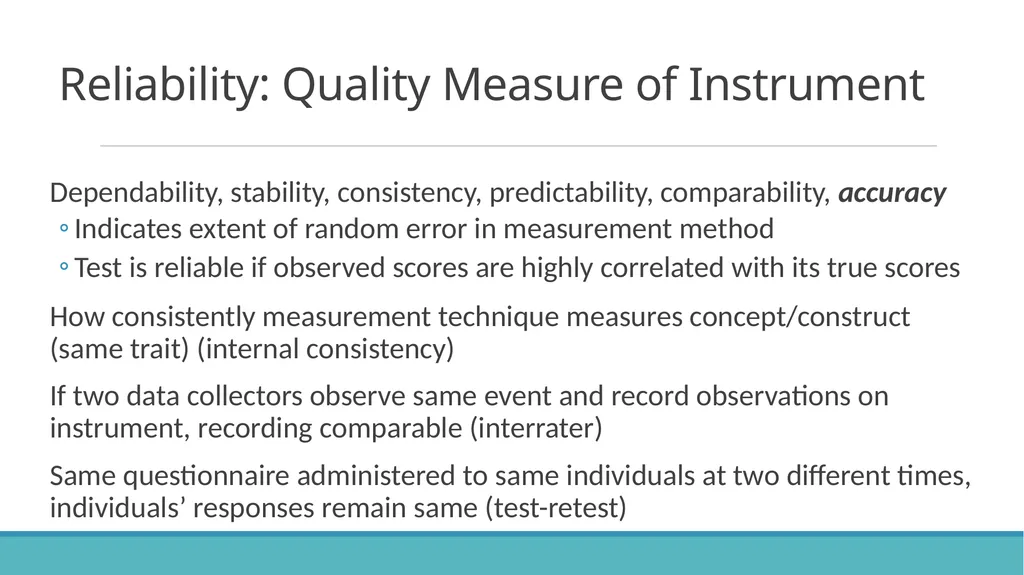
slide23. Reliability: Quality Measure of Instrument Dependability, stability, consistency, predictability, comparability, accuracy
Indicates extent of random error in measurement method
Test is reliable if observed scores are highly correlated with its true scores
How consistently measurement technique measures concept/construct (same trait) (internal consistency)
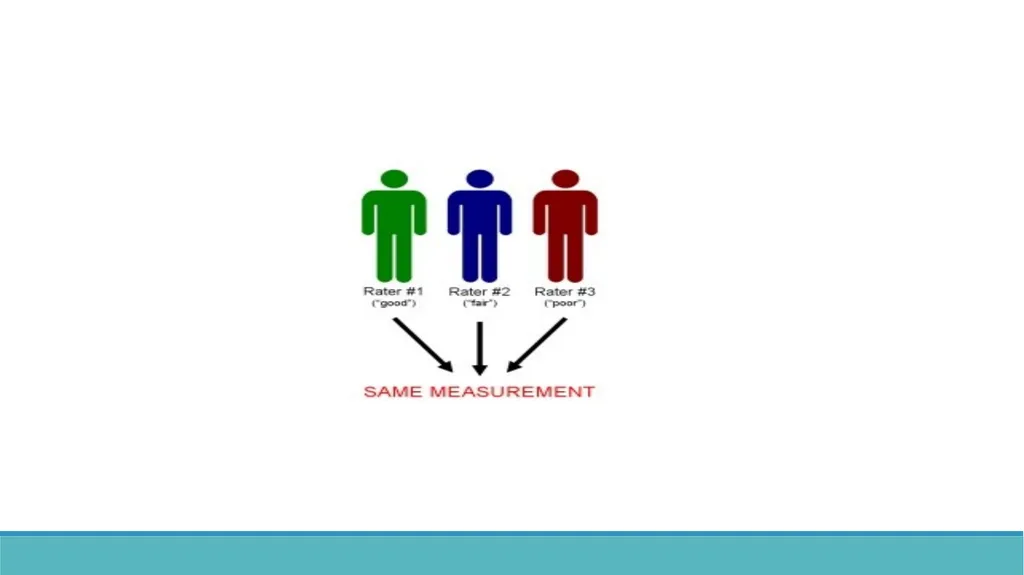
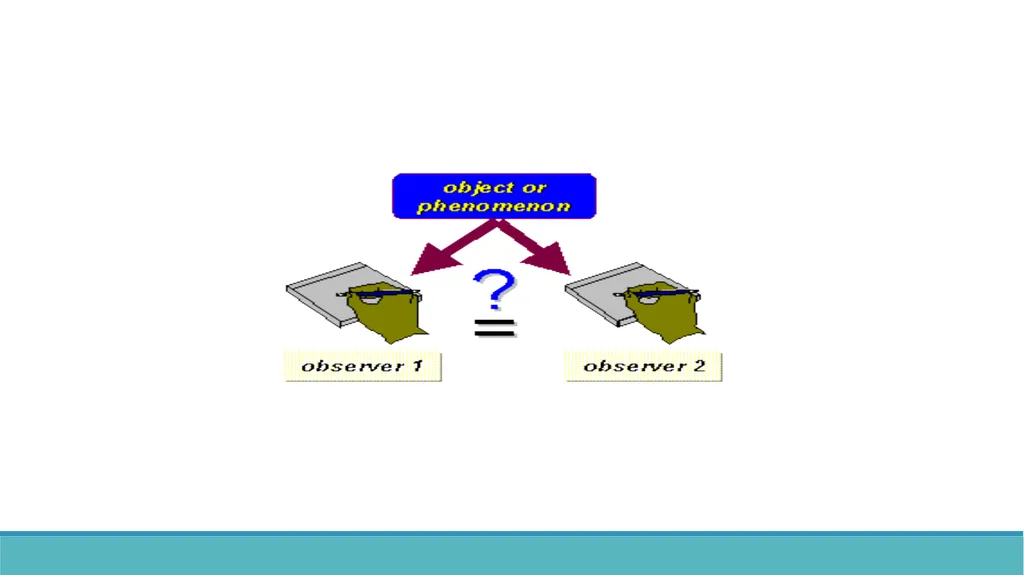
If two data collectors observe same event and record observations on instrument, recording comparable (interrater)
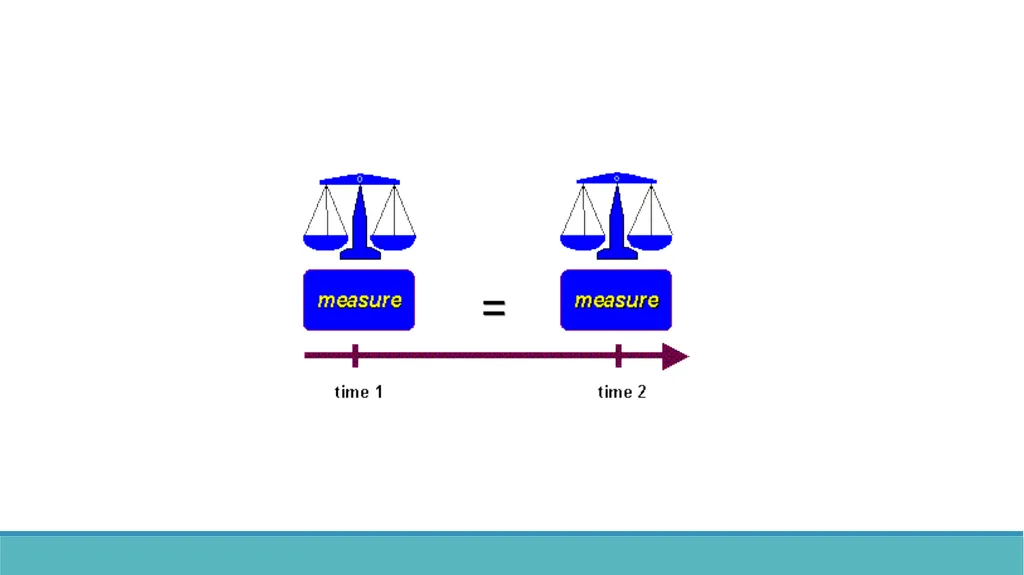
Same questionnaire administered to same individuals at two different times, individuals’ responses remain same (test-retest)<br>
slide24. Reliability Instruments that are reliable provide values with only small amount of random error
Reliable instruments enhance the power of the study
1.00 is perfect reliability; 0.00 is no reliability<br>
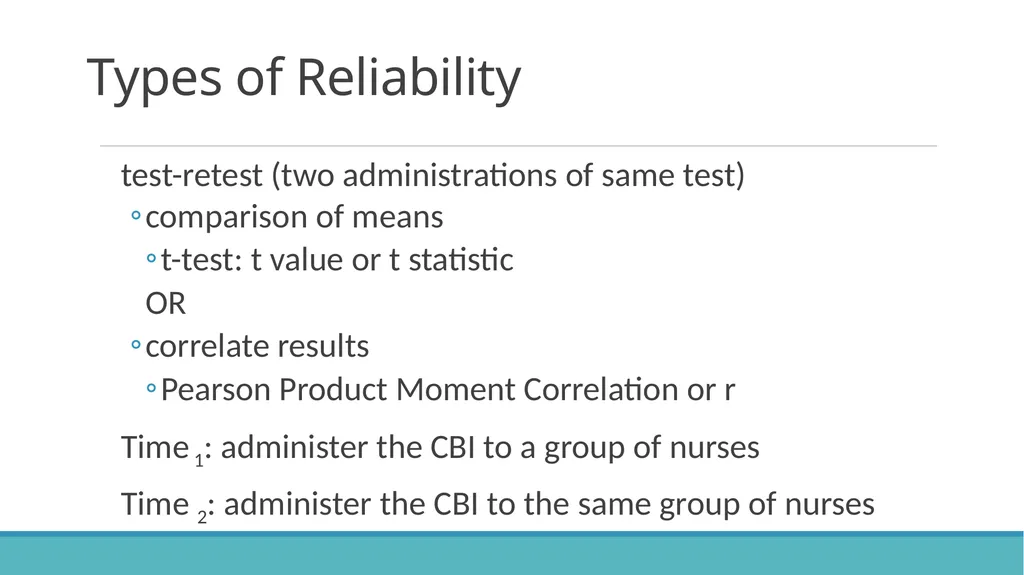
slide25. Types of Reliability test-retest (two administrations of same test)
comparison of means
t-test: t value or t statistic
OR
correlate results
Pearson Product Moment Correlation or r
Time 1: administer the CBI to a group of nurses
Time 2: administer the CBI to the same group of nurses<br>
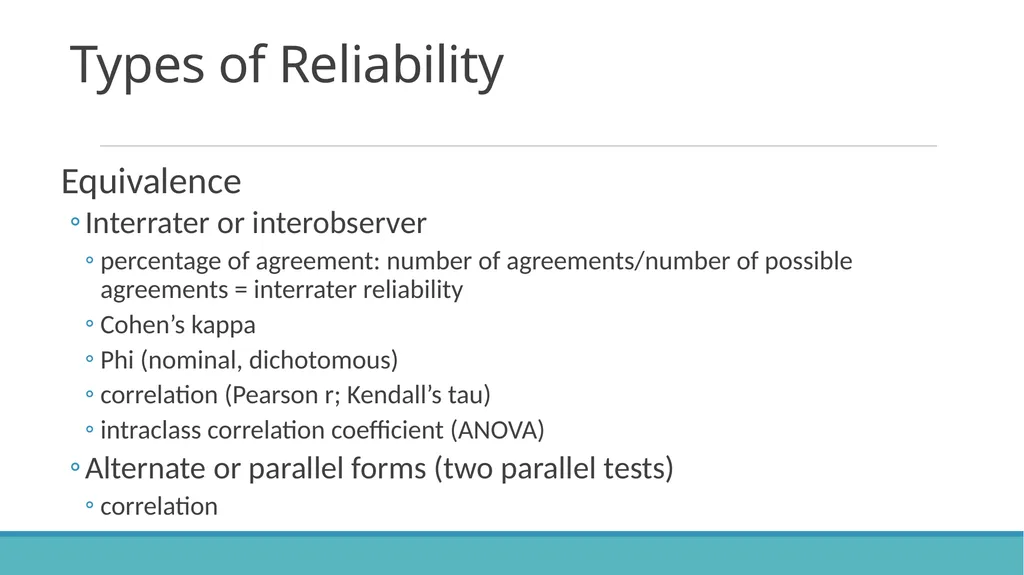
slide27. Types of Reliability Equivalence
Interrater or interobserver
percentage of agreement: number of agreements/number of possible agreements = interrater reliability
Cohen’s kappa
Phi (nominal, dichotomous)
correlation (Pearson r; Kendall’s tau)
intraclass correlation coefficient (ANOVA)
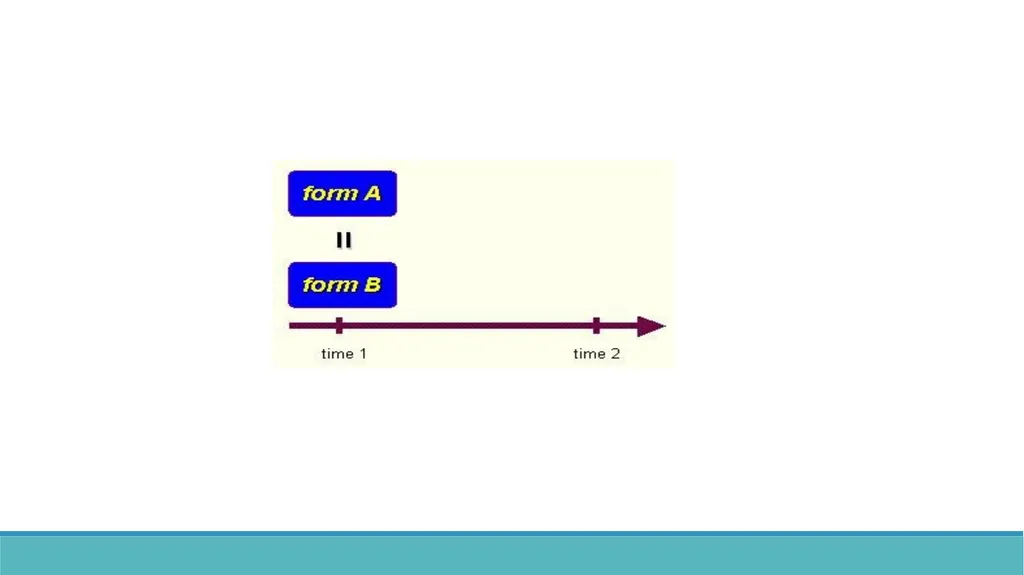
Alternate or parallel forms (two parallel tests)
correlation<br>
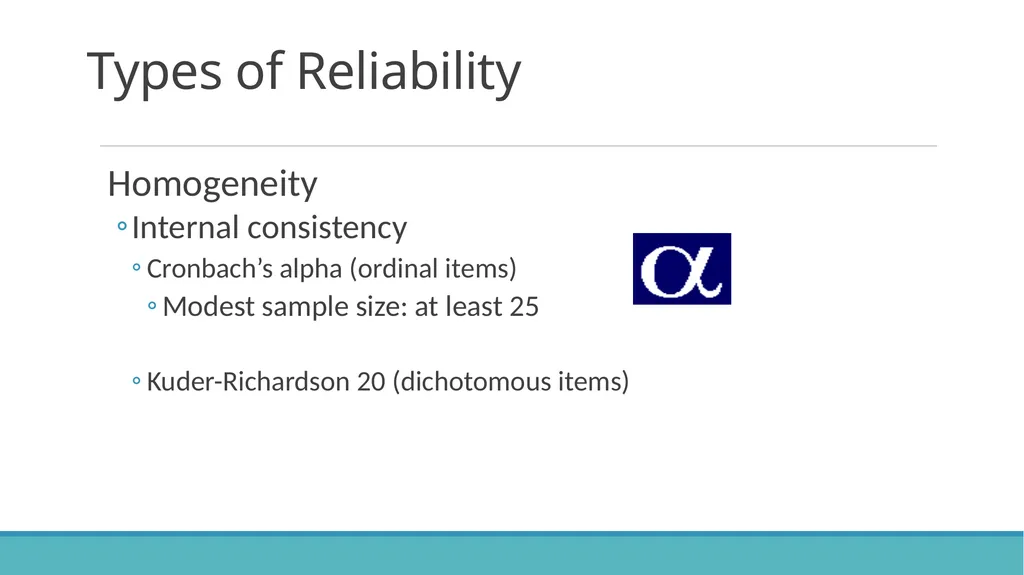
slide31. Types of Reliability Homogeneity
Internal consistency
Cronbach’s alpha (ordinal items)
Modest sample size: at least 25
Kuder-Richardson 20 (dichotomous items)<br>
slide32. Reliability Ischemic Heart Disease Index: coding reliability reported by the authors was .71.
Adult-Adolescent Parenting Inventory (AAPI): Regarding Inappropriate Expectations subscale: in previous studies, Cronbach’s alphas ranged from .40 to .86. Reliabilities in current study ranged from .40 to .84. This subscale was dropped from further analyses.
Cronbach’s alphas are never obtained at a score of 1.00 because all instruments have some measurement error
Test-retest reliability coefficients were r = 0.92 for the whole instrument (SIP) and averaged r = 0.82 for the 12 categories of dysfunctional behavior when two tests were administered at 24-hour intervals
Arterial oxygen saturation was measured by a Nellcor pulse oximeter (Nellcor Inc., Hayward, CA), placed on the subject’s index finger (obtain manufacturer’s product information; conduct test/retest calculations yourself)<br>
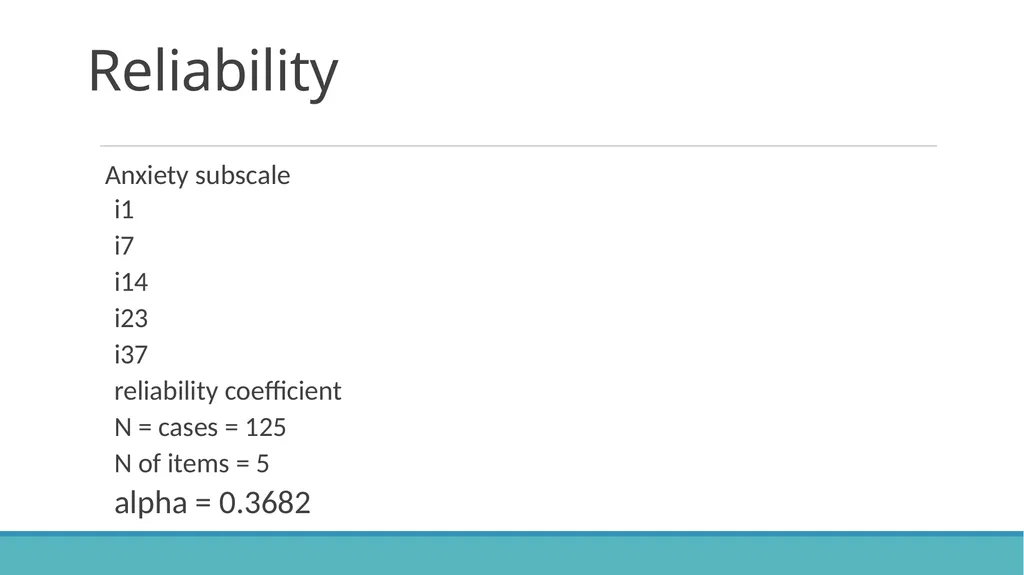
slide33. Reliability Anxiety subscale
i1
i7
i14
i23
i37
reliability coefficient
N = cases = 125
N of items = 5
alpha = 0.3682<br>
slide35. Validity: Defined Extent to which instrument actually reflects abstract construct being examined; measures what it is supposed to measure
Domain or Universe of Construct
Concept analysis
Extensive literature search
Qualitative study results
Theoretically define the construct and subconcepts
Blueprint or matrix
Test items
Instrument items<br>
slide36. Validity Types Face Validity
Instrument looks like it is measuring the construct<br>
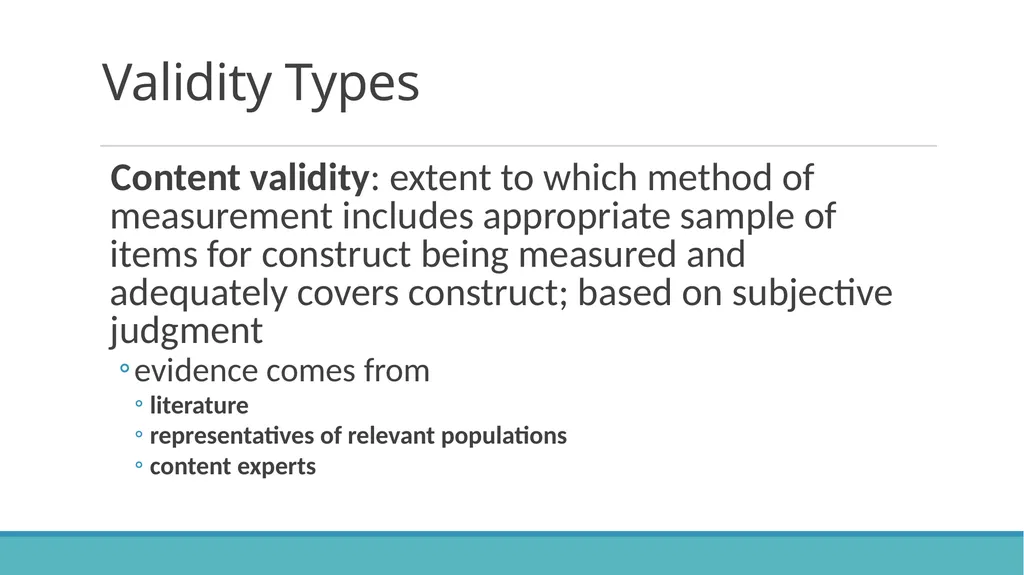
slide37. Validity Types Content validity: extent to which method of measurement includes appropriate sample of items for construct being measured and adequately covers construct; based on subjective judgment
evidence comes from
literature
representatives of relevant populations
content experts<br>
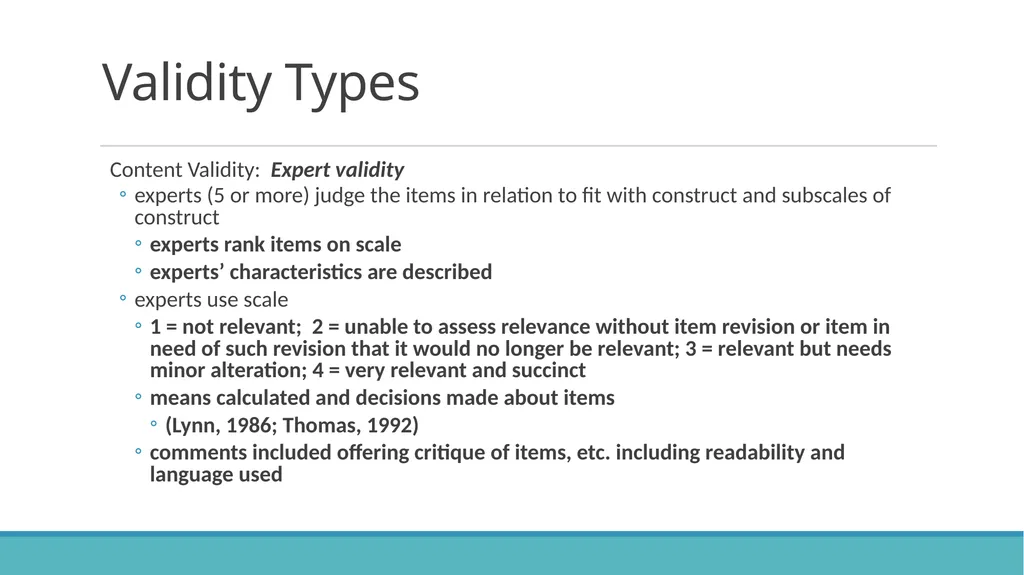
slide38. Validity Types Content Validity: Expert validity
experts (5 or more) judge the items in relation to fit with construct and subscales of construct
experts rank items on scale
experts’ characteristics are described
experts use scale
1 = not relevant; 2 = unable to assess relevance without item revision or item in need of such revision that it would no longer be relevant; 3 = relevant but needs minor alteration; 4 = very relevant and succinct
means calculated and decisions made about items
(Lynn, 1986; Thomas, 1992)
comments included offering critique of items, etc. including readability and language used<br>
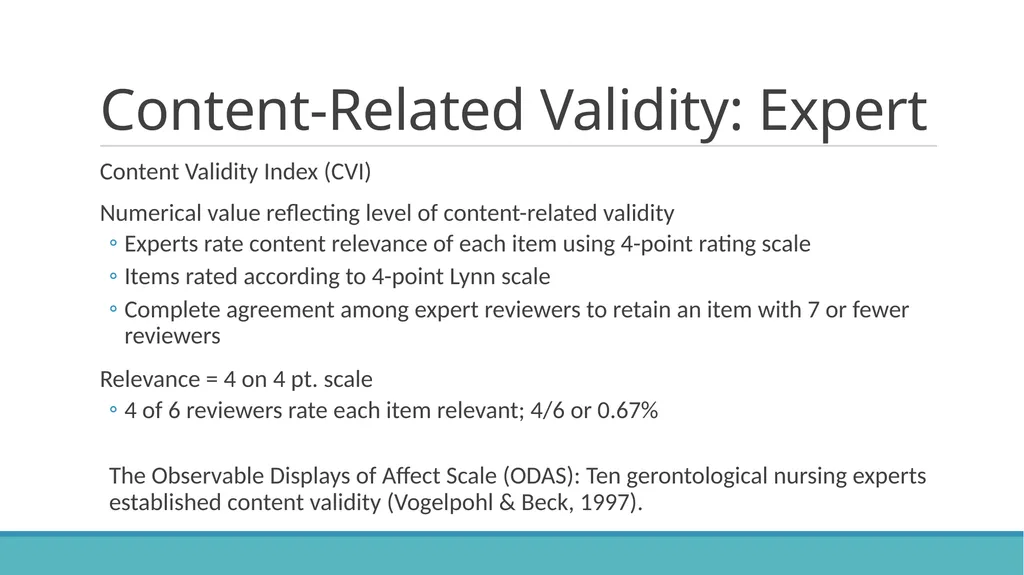
slide39. Content-Related Validity: Expert Content Validity Index (CVI)
Numerical value reflecting level of content-related validity
Experts rate content relevance of each item using 4-point rating scale
Items rated according to 4-point Lynn scale
Complete agreement among expert reviewers to retain an item with 7 or fewer reviewers
Relevance = 4 on 4 pt. scale
4 of 6 reviewers rate each item relevant; 4/6 or 0.67%
The Observable Displays of Affect Scale (ODAS): Ten gerontological nursing experts established content validity (Vogelpohl & Beck, 1997).<br>
slide40. Instrument Readability there are over 30 readability formulas
index of probable degree of difficulty of comprehending text
Fog formula example of readability formula
Flesch-Kinkaid Grade Level Word: calculates readability level<br>
slide41. Content-Related Validity: Example CBI-E items originated in related literature and research on nurse caring from patients’ and nurses’ perspectives as well as expert review. Six experts in gerontologic nursing reviewed the CBI-E and rated the items, directions, length, and other critical points regarding this draft so that content validity of the expert type (Burns & Grove, 2005) was established. Three of the experts were doctoral-prepared. Two were geriatric nurse practitioners, three were clinical nurse specialists, one was a long-term care administrator, and one was a psychiatric-mental health clinician. The content validity (content relevance) of each item was rated by experts using the following 4-point rating scale (Lynn, 1986): “1 = not relevant; 2 = unable to assess relevance without item revision or item is in need of such revision that it would no longer be relevant; 3 = relevant but needs minor alteration; 4 = very relevant and succinct” (p. 384). Items were revised based on expert reviews and one item was eliminated from the 29-item draft. This item had the lowest mean. Experts commented on nebulous wording on specific items and on the excellence of many. Specific item revisions were offered and the investigators modified several items accordingly.<br>
slide42. Types of Content Validity Content Validity: Theoretical validity
the domain of the construct is identified through concept analysis or extensive literature search; qualitative methods can also be used
a matrix or blueprint is created to develop items for a test
item format, item content, and procedures for generating items carefully described<br>
slide43. Construct Validity: Factor Analysis Validity Relationships among various items of instrument established; items fall into a factor, correlate with other items
Items that are closely related are clustered into a factor
factor = subscale = dimension
Instrument may reflect several constructs rather than one construct
factor loadings (-1 to +1) may be thought of as correlations of the item with the factor<br>
slide44. Construct Validity: Factor Analysis Validity Number of constructs in instrument can be validated through use of confirmatory factor analysis
Factor loadings are proportion of variance the item and factor have together
Communality is portion of item variance accounted for by various factors
Eigenvalue for factor is total amount of variance explained by factor (add squared loadings contained in single column [factor])
Factor eigenvalues and variance accounted for are most important results in unrotated factor matrix<br>
slide45. Construct Validity: Examples Construct validity of the State and Trait Anger Scales (20 items) (was assessed by Spielberger et al. (1983) using principal factor analysis with orthogonal rotation, which determined the state-trait anger scales. Fuqua et al. (1991) reported a similar factor structure in 455 college students.<br>
slide46. Types of Construct Validity Construct Validity: test assumptions about instrument; extent to which test measures theoretical construct
Hypotheses identified about expected response of known groups
Contrasted or known groups: groups who have significantly varied scores on instrument
Alcoholics versus teetotalers on Alcoholism Health Risk Appraisal Instrument
t-test or ANOVA determines difference<br>
slide47. Types of Construct Validity Construct Validity: Hypothesis-testing approach
Theory or concept underlying instrument’s design used to develop hypotheses regarding behavior of individuals with varying scores on the measure; determine if rationale underlying instrument’s construction is adequate to explain findings<br>
slide48. Types of Validity Construct Validity: Divergent validity
Instrument that measures the opposite of construct is administered to subjects at same time the instrument measuring variable in research question is; results are compared with correlation coefficient (r = - 0.??)
Hearth Hope Scale and Hopelessness Scale
Fear Survey Scale and Happiness Scale<br>
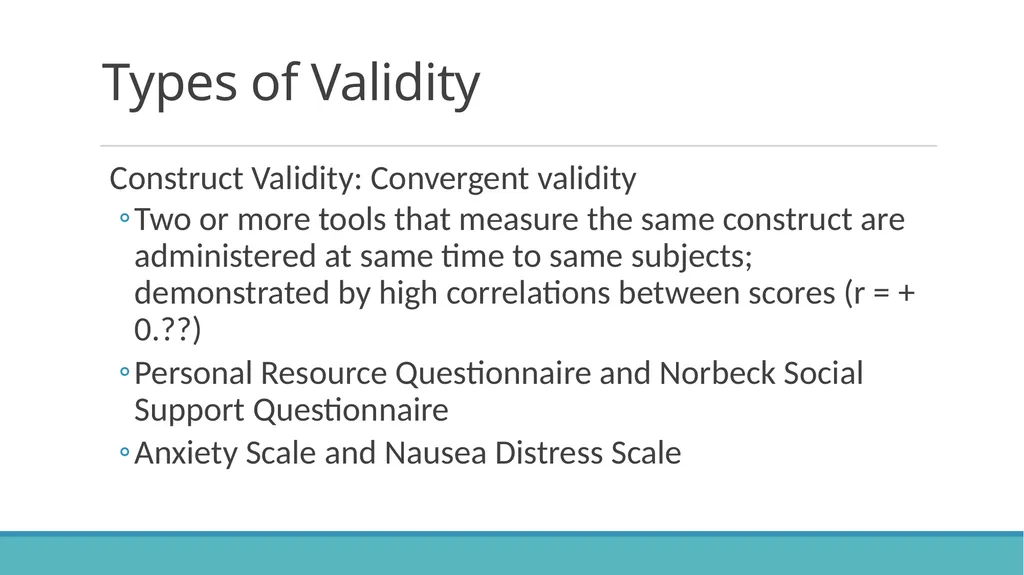
slide49. Types of Validity Construct Validity: Convergent validity
Two or more tools that measure the same construct are administered at same time to same subjects; demonstrated by high correlations between scores (r = + 0.??)
Personal Resource Questionnaire and Norbeck Social Support Questionnaire
Anxiety Scale and Nausea Distress Scale<br>
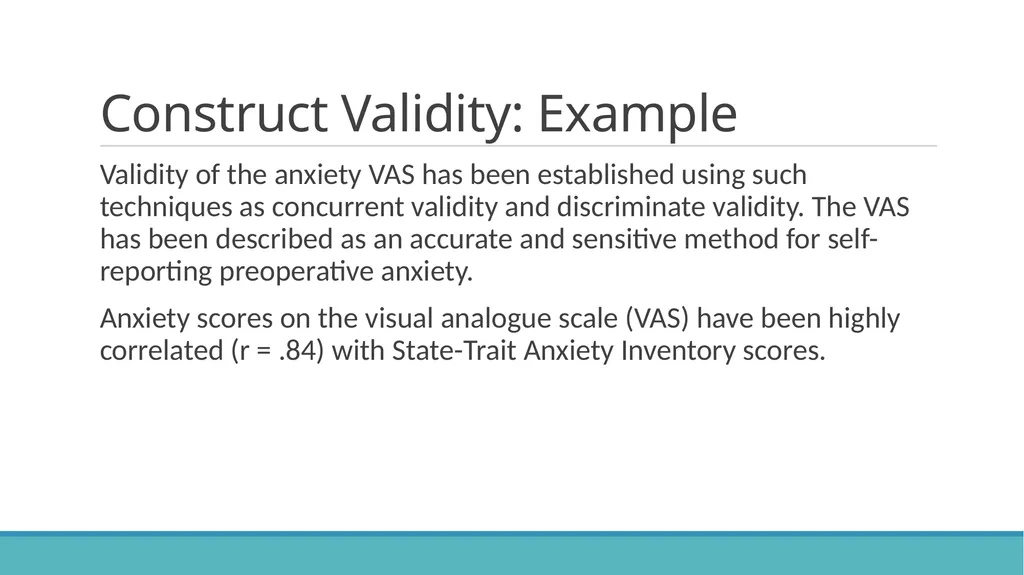
slide50. Construct Validity: Example Validity of the anxiety VAS has been established using such techniques as concurrent validity and discriminate validity. The VAS has been described as an accurate and sensitive method for self-reporting preoperative anxiety.
Anxiety scores on the visual analogue scale (VAS) have been highly correlated (r = .84) with State-Trait Anxiety Inventory scores.<br>
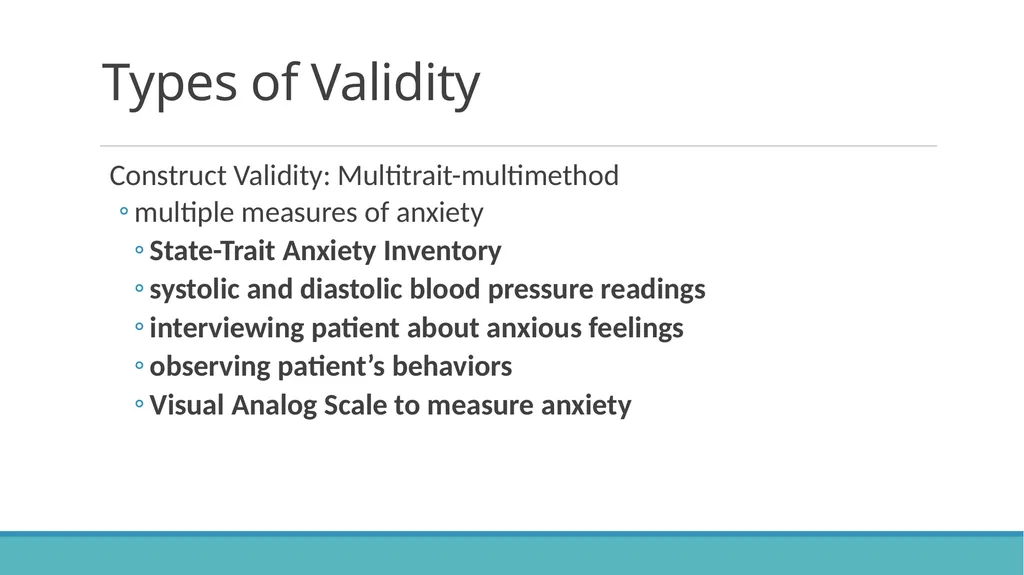
slide51. Types of Validity Construct Validity: Multitrait-multimethod
multiple measures of anxiety
State-Trait Anxiety Inventory
systolic and diastolic blood pressure readings
interviewing patient about anxious feelings
observing patient’s behaviors
Visual Analog Scale to measure anxiety<br>
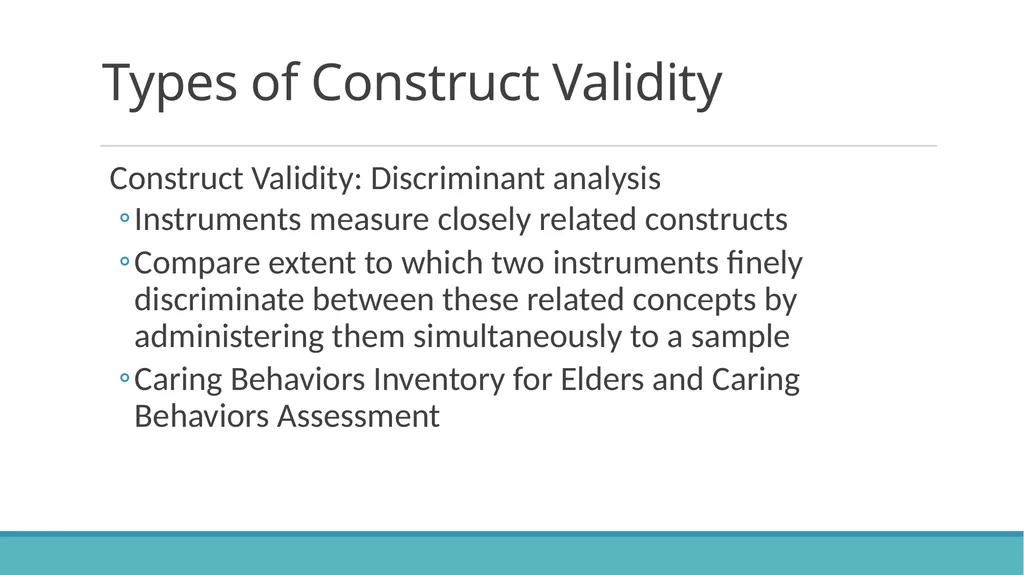
slide52. Types of Construct Validity Construct Validity: Discriminant analysis
Instruments measure closely related constructs
Compare extent to which two instruments finely discriminate between these related concepts by administering them simultaneously to a sample
Caring Behaviors Inventory for Elders and Caring Behaviors Assessment<br>
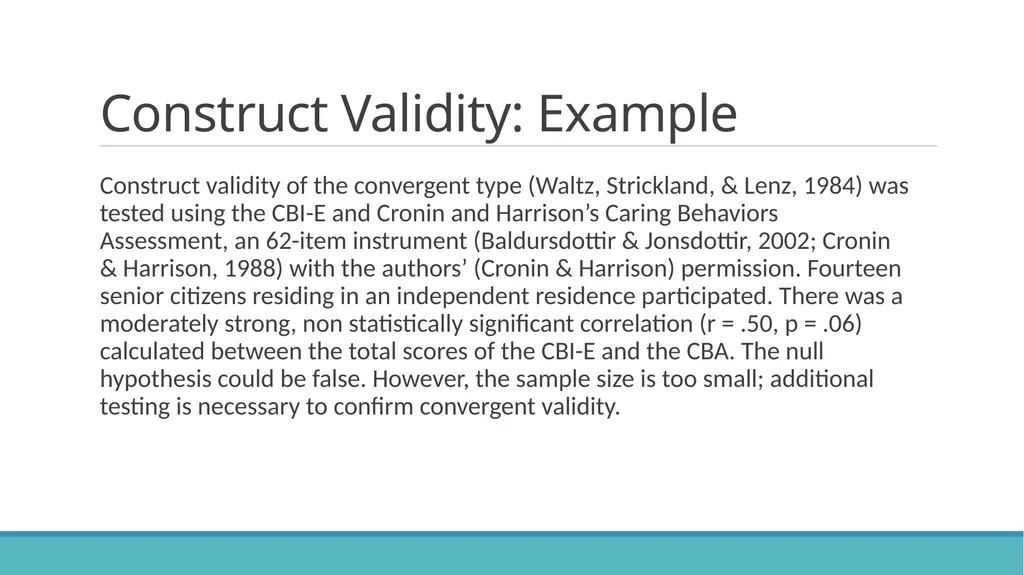
slide53. Construct Validity: Example Construct validity of the convergent type (Waltz, Strickland, & Lenz, 1984) was tested using the CBI-E and Cronin and Harrison’s Caring Behaviors Assessment, an 62-item instrument (Baldursdottir & Jonsdottir, 2002; Cronin & Harrison, 1988) with the authors’ (Cronin & Harrison) permission. Fourteen senior citizens residing in an independent residence participated. There was a moderately strong, non statistically significant correlation (r = .50, p = .06) calculated between the total scores of the CBI-E and the CBA. The null hypothesis could be false. However, the sample size is too small; additional testing is necessary to confirm convergent validity.<br>
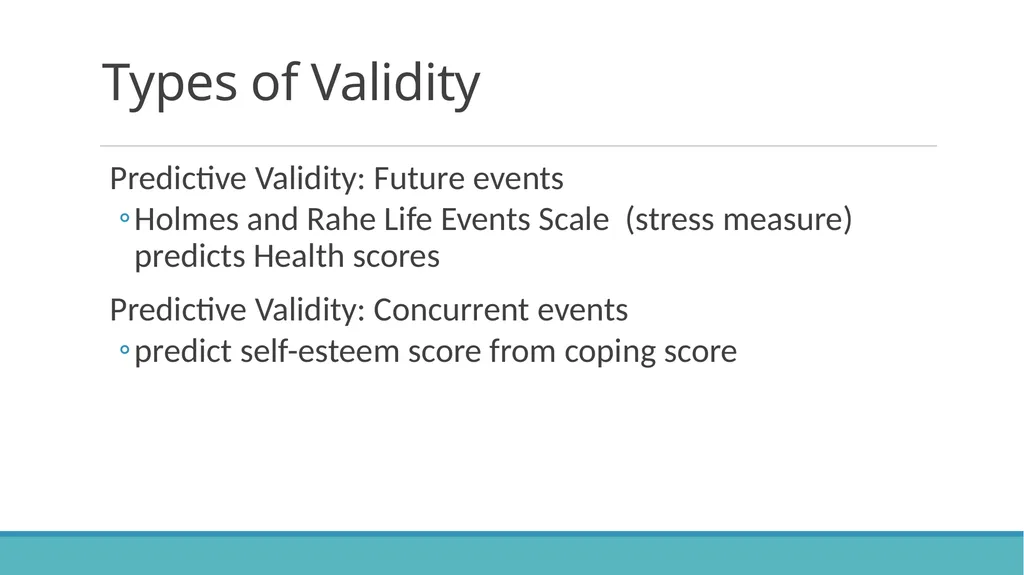
slide54. Types of Validity Predictive Validity: Future events
Holmes and Rahe Life Events Scale (stress measure) predicts Health scores
Predictive Validity: Concurrent events
predict self-esteem score from coping score<br>
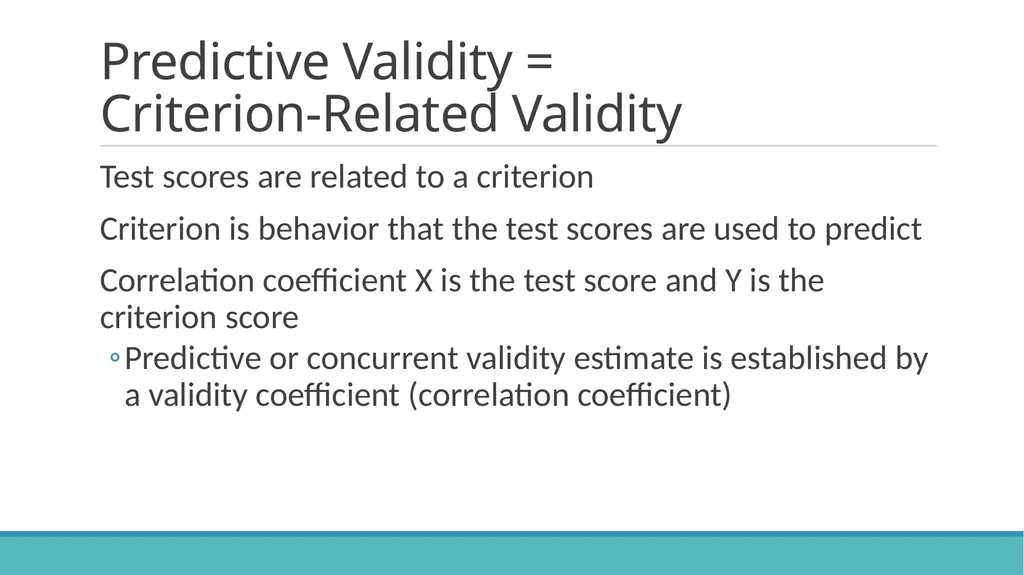
slide55. Predictive Validity = Criterion-Related Validity Test scores are related to a criterion
Criterion is behavior that the test scores are used to predict
Correlation coefficient X is the test score and Y is the criterion score
Predictive or concurrent validity estimate is established by a validity coefficient (correlation coefficient)<br>
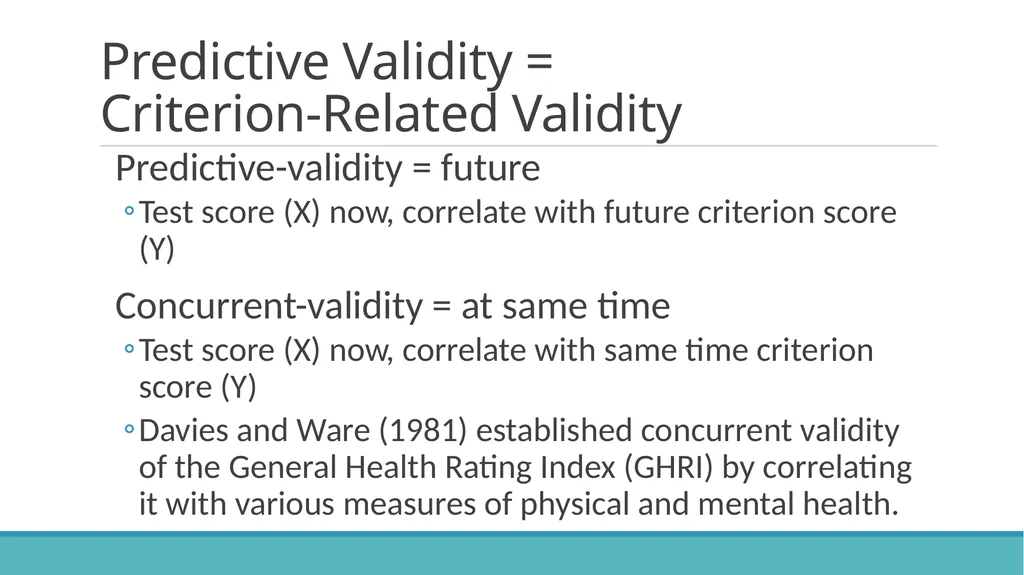
slide56. Predictive Validity = Criterion-Related Validity Predictive-validity = future
Test score (X) now, correlate with future criterion score (Y)
Concurrent-validity = at same time
Test score (X) now, correlate with same time criterion score (Y)
Davies and Ware (1981) established concurrent validity of the General Health Rating Index (GHRI) by correlating it with various measures of physical and mental health.<br>
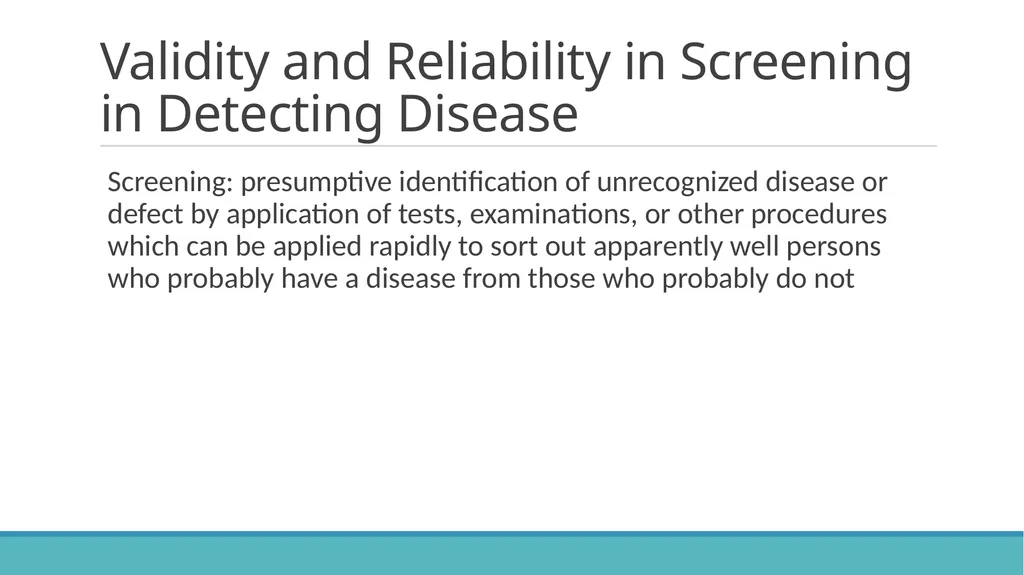
slide57. Validity and Reliability in Screening in Detecting Disease Screening: presumptive identification of unrecognized disease or defect by application of tests, examinations, or other procedures which can be applied rapidly to sort out apparently well persons who probably have a disease from those who probably do not<br>
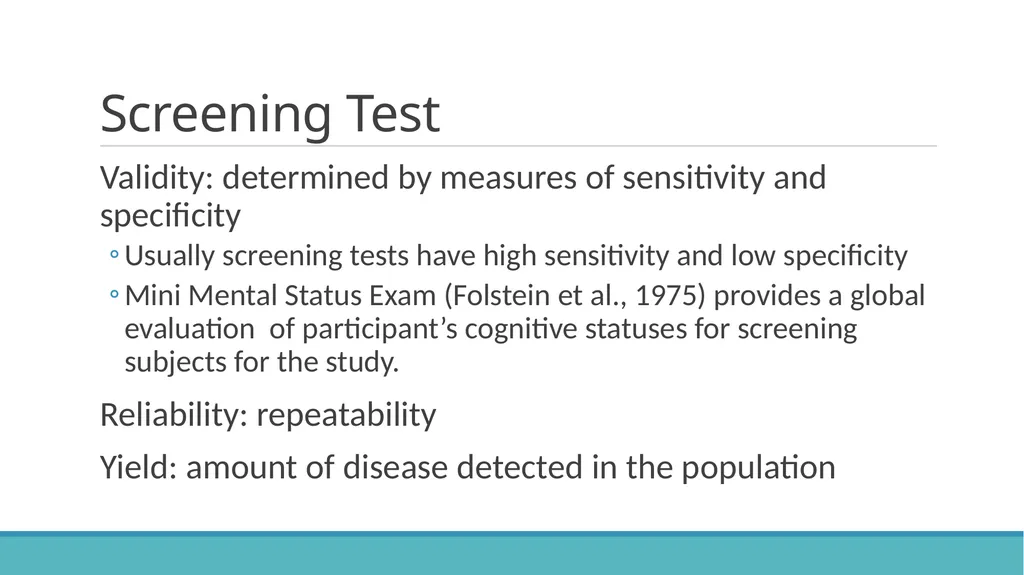
slide58. Screening Test Validity: determined by measures of sensitivity and specificity
Usually screening tests have high sensitivity and low specificity
Mini Mental Status Exam (Folstein et al., 1975) provides a global evaluation of participant’s cognitive statuses for screening subjects for the study.
Reliability: repeatability
Yield: amount of disease detected in the population<br>
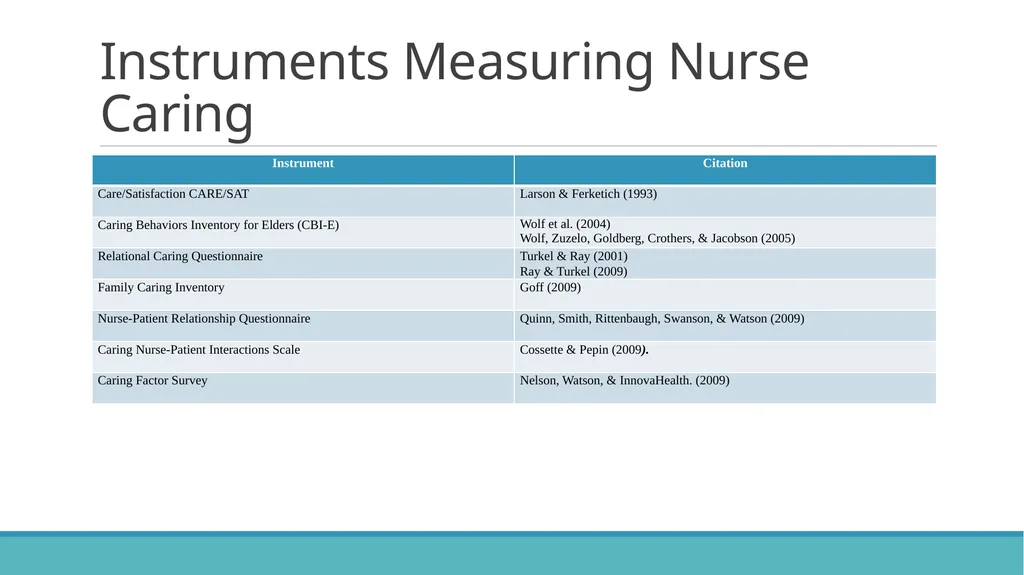
slide59. Instruments Measuring Nurse Caring<br>
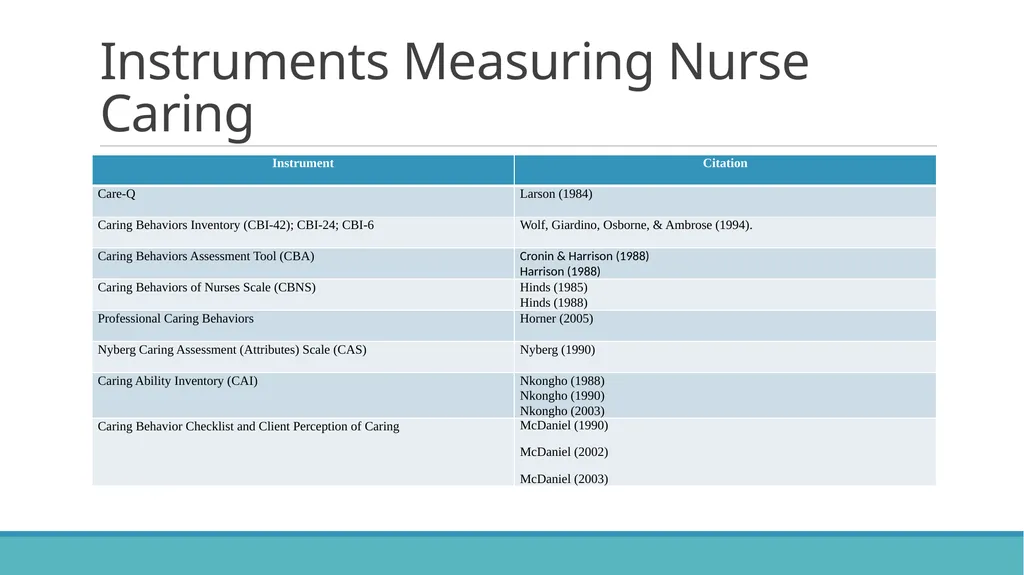
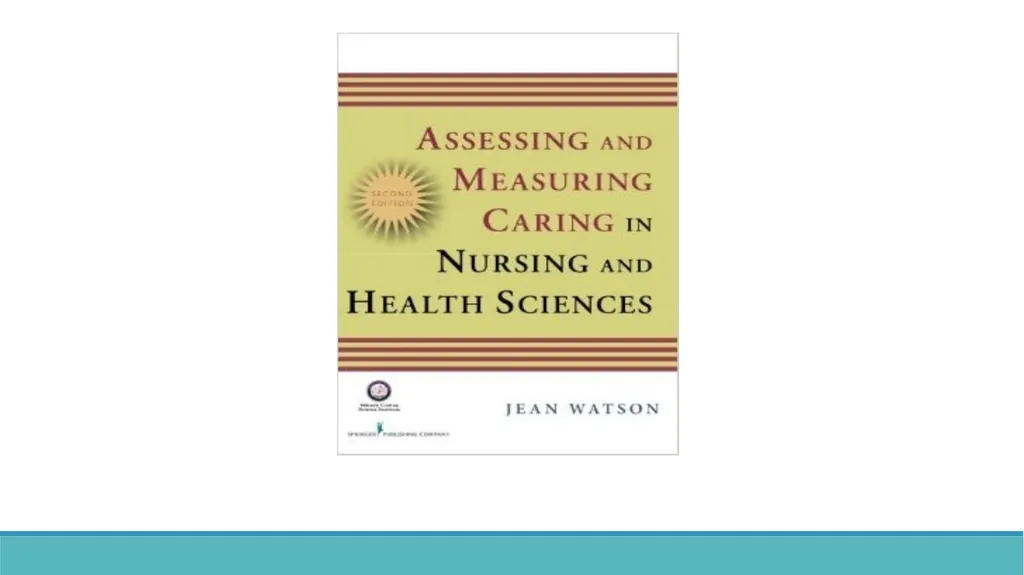
slide60. Instruments Measuring Nurse Caring<br>
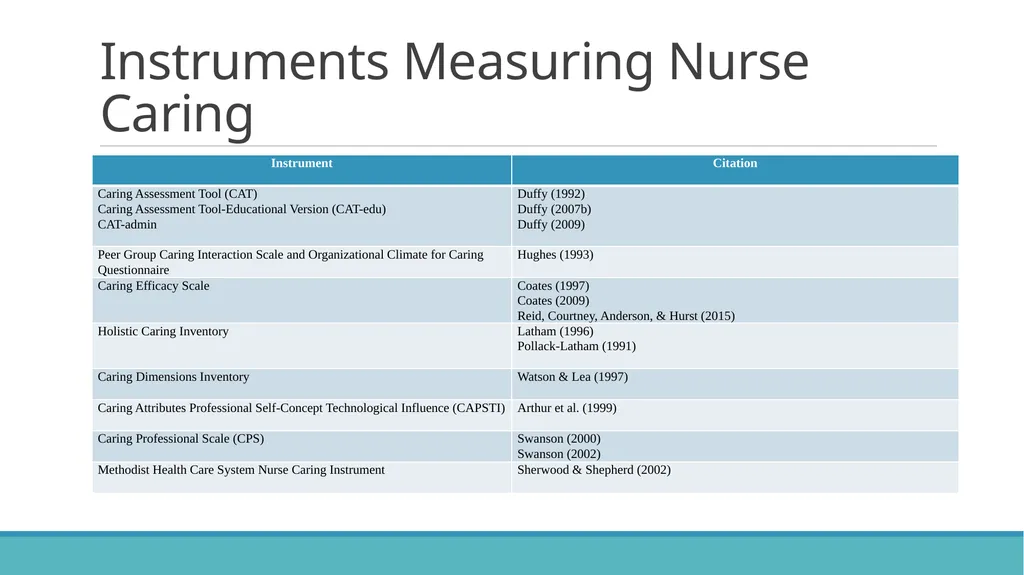
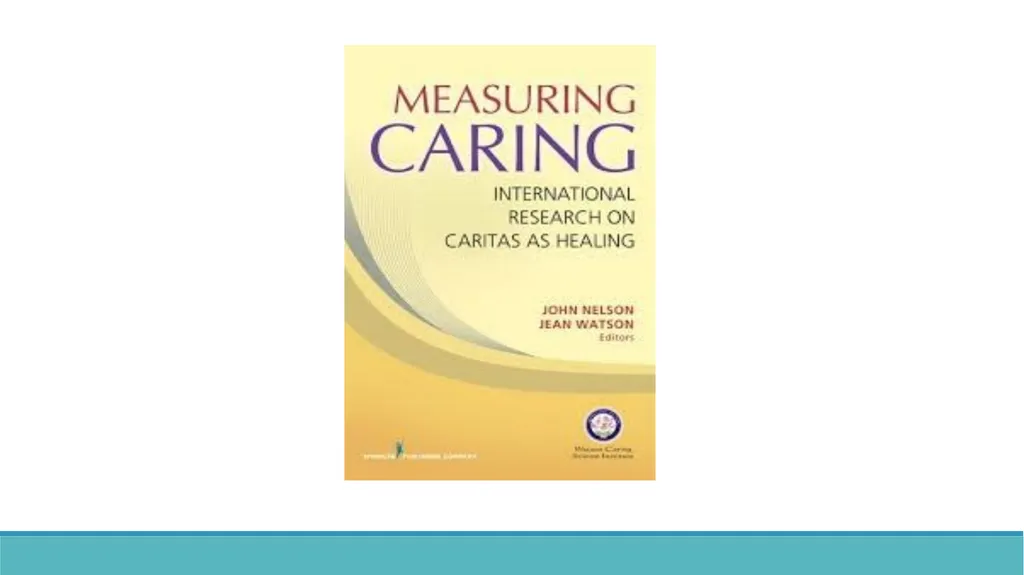
slide61. Instruments Measuring Nurse Caring<br>
slide2. Devices for Measuring Constructs Device = test of knowledge, machine, psychometric (psychologic measurement) instrument
Administration elicits a sample of behavior for many purposes
Sample of behavior represented by numbers: ultimate reduction, also operationalization of constructs
Measurement: assign numbers to individuals’ responses, chart data, biophysiologic data, etc.<br>
slide3. Measurement: Defined Rules for assigning numbers to objects to represent quantities of attributes
Assign numbers to objects according to rules
Remember attributes of objects vary day to day, from situation to situation, or from one object to another
Variability: numeric expression that signifies how much of an attribute is present in the object
Quantification communicates that amount<br>
slide4. Rules and Measurement Numbers must be assigned to attributes of objects according to rules
Scores assigned systematically
The conditions and criteria with which the numeric values are assigned are specified
The measurement instrument must correspond with the real world of the object being measured
instruments help researchers to measure concepts/constructs/attributes<br>
slide5. Direct and Indirect Measures of Concept/Construct Direct Measures: straightforward measurement of concrete object
Indirect Measures: indicators of concept used to represent abstract concept<br>
slide6. Direct and Indirect Measures of Concept/Construct Direct: blood alcohol level; arterial blood gas; mean arterial pressure; digitalis level; GSR (galvanic skin response) as pain indicator
Indirect: Abuse-a-stick alcohol level; pulse oximetry; auscultatory blood pressure; symptoms of digitalis toxicity; pain level on VAS; intelligence; caring; pain; coping; anxiety; social support; teasing frequency and teasing bother; spiritual/coping; perception of individualized nursing care
More indirect: phenomenological description; ethnographic analytic description<br>
slide8. Measurement and Data Collection: Intersect Measurement
Data Collection<br>
slide9. Measurement Error Difference between what exists in reality and what is measured (obtained or observed score) by a research instrument
Measurement exists in direct and indirect measures
Measurement errors include:
Random error
Systematic error<br>
slide10. Variance: Errors of Measurement Systematic variance: leans in one direction; scores tend to be all positive, all negative, all high, or all low
Error is constant or biased
Glucometer and electronic thermometer that are not calibrated
Postpartum depression instrument measures depression scores too high<br>
slide11. Variance: Errors of Measurement Random error or error variance: variability of measures due to random fluctuations whose basic characteristic is that they (fluctuations) are self-compensatory
Unpredictable
Dialysis patients tested for cognitive functioning on first day of their dialysis schedule
Participant affected by family stress<br>
slide12. Factors Contributing to Errors of Measurement Situational contaminants (presence of researcher)
Transitory personal factors (anxiety)
Response-set biases (social desirability, extreme responses, acquiescence)
Administration variations (change test/instrument instructions)<br>
slide13. Factors Contributing to Errors of Measurement Instrument clarity (directions)
Item sampling (which questions included on test)
Instrument format (ordering of questions)
Readability level, e.g., Flesch-Kincaid Grade Level<br>
slide14. True score + Error score = Observed score Direct measures are more accurate than indirect measure
True score = what would be obtained if there were no errors in measurement
Systematic error = considered part of true score and reflects true measure
Error score = amount of random error in measurement process<br>
slide16. Test/Instrument Scaling Item scaling
Nominal, Ordinal, Interval, Ratio
Item weighting
Directions specify item and factor (domain) weighting
Total Score calculation
Summing items; converting ordinal to interval level data<br>
slide17. Levels of Measurement<br>
slide19. Item Formatting Types Multiple choice
Dichotomous multiple choice
Yes, No
Bipolar scale
Agree/disagree scale
Preference ordering question
Ranking ordering question
Semantic differential scale
Unipolar scale (one item)
Absence or presence of single item, e.g., Not at all satisfied, slightly satisfied, moderately satisfied, very satisfied, and completely satisfied<br>
slide20. Examples of Item Scaling Nominal
Nurses spend time with the patient. (1 = Yes, 0 = No)
Ordinal
Accepts me as I am. (1 = Never, 2 = Rarely, 3 = Occasionally 4 = Frequently, 5 = Always) (Staff Nurse Survey, Duffy)
Interval/Ratio
Nurses point out positive things about me. (mark 10 cm line, VAS) NEVER TRUE FOR ME 0 ____________________ 100 ALWAYS TRUE FOR ME (Caring Behavior of Nurses Scale, Hinds)<br>
slide21. Reliability and Validity Both needed for valid instrument
Ongoing processes needed
e.g. reliability needs to be established with each new sample<br>
slide23. Reliability: Quality Measure of Instrument Dependability, stability, consistency, predictability, comparability, accuracy
Indicates extent of random error in measurement method
Test is reliable if observed scores are highly correlated with its true scores
How consistently measurement technique measures concept/construct (same trait) (internal consistency)
If two data collectors observe same event and record observations on instrument, recording comparable (interrater)
Same questionnaire administered to same individuals at two different times, individuals’ responses remain same (test-retest)<br>
slide24. Reliability Instruments that are reliable provide values with only small amount of random error
Reliable instruments enhance the power of the study
1.00 is perfect reliability; 0.00 is no reliability<br>
slide25. Types of Reliability test-retest (two administrations of same test)
comparison of means
t-test: t value or t statistic
OR
correlate results
Pearson Product Moment Correlation or r
Time 1: administer the CBI to a group of nurses
Time 2: administer the CBI to the same group of nurses<br>
slide27. Types of Reliability Equivalence
Interrater or interobserver
percentage of agreement: number of agreements/number of possible agreements = interrater reliability
Cohen’s kappa
Phi (nominal, dichotomous)
correlation (Pearson r; Kendall’s tau)
intraclass correlation coefficient (ANOVA)
Alternate or parallel forms (two parallel tests)
correlation<br>
slide31. Types of Reliability Homogeneity
Internal consistency
Cronbach’s alpha (ordinal items)
Modest sample size: at least 25
Kuder-Richardson 20 (dichotomous items)<br>
slide32. Reliability Ischemic Heart Disease Index: coding reliability reported by the authors was .71.
Adult-Adolescent Parenting Inventory (AAPI): Regarding Inappropriate Expectations subscale: in previous studies, Cronbach’s alphas ranged from .40 to .86. Reliabilities in current study ranged from .40 to .84. This subscale was dropped from further analyses.
Cronbach’s alphas are never obtained at a score of 1.00 because all instruments have some measurement error
Test-retest reliability coefficients were r = 0.92 for the whole instrument (SIP) and averaged r = 0.82 for the 12 categories of dysfunctional behavior when two tests were administered at 24-hour intervals
Arterial oxygen saturation was measured by a Nellcor pulse oximeter (Nellcor Inc., Hayward, CA), placed on the subject’s index finger (obtain manufacturer’s product information; conduct test/retest calculations yourself)<br>
slide33. Reliability Anxiety subscale
i1
i7
i14
i23
i37
reliability coefficient
N = cases = 125
N of items = 5
alpha = 0.3682<br>
slide35. Validity: Defined Extent to which instrument actually reflects abstract construct being examined; measures what it is supposed to measure
Domain or Universe of Construct
Concept analysis
Extensive literature search
Qualitative study results
Theoretically define the construct and subconcepts
Blueprint or matrix
Test items
Instrument items<br>
slide36. Validity Types Face Validity
Instrument looks like it is measuring the construct<br>
slide37. Validity Types Content validity: extent to which method of measurement includes appropriate sample of items for construct being measured and adequately covers construct; based on subjective judgment
evidence comes from
literature
representatives of relevant populations
content experts<br>
slide38. Validity Types Content Validity: Expert validity
experts (5 or more) judge the items in relation to fit with construct and subscales of construct
experts rank items on scale
experts’ characteristics are described
experts use scale
1 = not relevant; 2 = unable to assess relevance without item revision or item in need of such revision that it would no longer be relevant; 3 = relevant but needs minor alteration; 4 = very relevant and succinct
means calculated and decisions made about items
(Lynn, 1986; Thomas, 1992)
comments included offering critique of items, etc. including readability and language used<br>
slide39. Content-Related Validity: Expert Content Validity Index (CVI)
Numerical value reflecting level of content-related validity
Experts rate content relevance of each item using 4-point rating scale
Items rated according to 4-point Lynn scale
Complete agreement among expert reviewers to retain an item with 7 or fewer reviewers
Relevance = 4 on 4 pt. scale
4 of 6 reviewers rate each item relevant; 4/6 or 0.67%
The Observable Displays of Affect Scale (ODAS): Ten gerontological nursing experts established content validity (Vogelpohl & Beck, 1997).<br>
slide40. Instrument Readability there are over 30 readability formulas
index of probable degree of difficulty of comprehending text
Fog formula example of readability formula
Flesch-Kinkaid Grade Level Word: calculates readability level<br>
slide41. Content-Related Validity: Example CBI-E items originated in related literature and research on nurse caring from patients’ and nurses’ perspectives as well as expert review. Six experts in gerontologic nursing reviewed the CBI-E and rated the items, directions, length, and other critical points regarding this draft so that content validity of the expert type (Burns & Grove, 2005) was established. Three of the experts were doctoral-prepared. Two were geriatric nurse practitioners, three were clinical nurse specialists, one was a long-term care administrator, and one was a psychiatric-mental health clinician. The content validity (content relevance) of each item was rated by experts using the following 4-point rating scale (Lynn, 1986): “1 = not relevant; 2 = unable to assess relevance without item revision or item is in need of such revision that it would no longer be relevant; 3 = relevant but needs minor alteration; 4 = very relevant and succinct” (p. 384). Items were revised based on expert reviews and one item was eliminated from the 29-item draft. This item had the lowest mean. Experts commented on nebulous wording on specific items and on the excellence of many. Specific item revisions were offered and the investigators modified several items accordingly.<br>
slide42. Types of Content Validity Content Validity: Theoretical validity
the domain of the construct is identified through concept analysis or extensive literature search; qualitative methods can also be used
a matrix or blueprint is created to develop items for a test
item format, item content, and procedures for generating items carefully described<br>
slide43. Construct Validity: Factor Analysis Validity Relationships among various items of instrument established; items fall into a factor, correlate with other items
Items that are closely related are clustered into a factor
factor = subscale = dimension
Instrument may reflect several constructs rather than one construct
factor loadings (-1 to +1) may be thought of as correlations of the item with the factor<br>
slide44. Construct Validity: Factor Analysis Validity Number of constructs in instrument can be validated through use of confirmatory factor analysis
Factor loadings are proportion of variance the item and factor have together
Communality is portion of item variance accounted for by various factors
Eigenvalue for factor is total amount of variance explained by factor (add squared loadings contained in single column [factor])
Factor eigenvalues and variance accounted for are most important results in unrotated factor matrix<br>
slide45. Construct Validity: Examples Construct validity of the State and Trait Anger Scales (20 items) (was assessed by Spielberger et al. (1983) using principal factor analysis with orthogonal rotation, which determined the state-trait anger scales. Fuqua et al. (1991) reported a similar factor structure in 455 college students.<br>
slide46. Types of Construct Validity Construct Validity: test assumptions about instrument; extent to which test measures theoretical construct
Hypotheses identified about expected response of known groups
Contrasted or known groups: groups who have significantly varied scores on instrument
Alcoholics versus teetotalers on Alcoholism Health Risk Appraisal Instrument
t-test or ANOVA determines difference<br>
slide47. Types of Construct Validity Construct Validity: Hypothesis-testing approach
Theory or concept underlying instrument’s design used to develop hypotheses regarding behavior of individuals with varying scores on the measure; determine if rationale underlying instrument’s construction is adequate to explain findings<br>
slide48. Types of Validity Construct Validity: Divergent validity
Instrument that measures the opposite of construct is administered to subjects at same time the instrument measuring variable in research question is; results are compared with correlation coefficient (r = - 0.??)
Hearth Hope Scale and Hopelessness Scale
Fear Survey Scale and Happiness Scale<br>
slide49. Types of Validity Construct Validity: Convergent validity
Two or more tools that measure the same construct are administered at same time to same subjects; demonstrated by high correlations between scores (r = + 0.??)
Personal Resource Questionnaire and Norbeck Social Support Questionnaire
Anxiety Scale and Nausea Distress Scale<br>
slide50. Construct Validity: Example Validity of the anxiety VAS has been established using such techniques as concurrent validity and discriminate validity. The VAS has been described as an accurate and sensitive method for self-reporting preoperative anxiety.
Anxiety scores on the visual analogue scale (VAS) have been highly correlated (r = .84) with State-Trait Anxiety Inventory scores.<br>
slide51. Types of Validity Construct Validity: Multitrait-multimethod
multiple measures of anxiety
State-Trait Anxiety Inventory
systolic and diastolic blood pressure readings
interviewing patient about anxious feelings
observing patient’s behaviors
Visual Analog Scale to measure anxiety<br>
slide52. Types of Construct Validity Construct Validity: Discriminant analysis
Instruments measure closely related constructs
Compare extent to which two instruments finely discriminate between these related concepts by administering them simultaneously to a sample
Caring Behaviors Inventory for Elders and Caring Behaviors Assessment<br>
slide53. Construct Validity: Example Construct validity of the convergent type (Waltz, Strickland, & Lenz, 1984) was tested using the CBI-E and Cronin and Harrison’s Caring Behaviors Assessment, an 62-item instrument (Baldursdottir & Jonsdottir, 2002; Cronin & Harrison, 1988) with the authors’ (Cronin & Harrison) permission. Fourteen senior citizens residing in an independent residence participated. There was a moderately strong, non statistically significant correlation (r = .50, p = .06) calculated between the total scores of the CBI-E and the CBA. The null hypothesis could be false. However, the sample size is too small; additional testing is necessary to confirm convergent validity.<br>
slide54. Types of Validity Predictive Validity: Future events
Holmes and Rahe Life Events Scale (stress measure) predicts Health scores
Predictive Validity: Concurrent events
predict self-esteem score from coping score<br>
slide55. Predictive Validity = Criterion-Related Validity Test scores are related to a criterion
Criterion is behavior that the test scores are used to predict
Correlation coefficient X is the test score and Y is the criterion score
Predictive or concurrent validity estimate is established by a validity coefficient (correlation coefficient)<br>
slide56. Predictive Validity = Criterion-Related Validity Predictive-validity = future
Test score (X) now, correlate with future criterion score (Y)
Concurrent-validity = at same time
Test score (X) now, correlate with same time criterion score (Y)
Davies and Ware (1981) established concurrent validity of the General Health Rating Index (GHRI) by correlating it with various measures of physical and mental health.<br>
slide57. Validity and Reliability in Screening in Detecting Disease Screening: presumptive identification of unrecognized disease or defect by application of tests, examinations, or other procedures which can be applied rapidly to sort out apparently well persons who probably have a disease from those who probably do not<br>
slide58. Screening Test Validity: determined by measures of sensitivity and specificity
Usually screening tests have high sensitivity and low specificity
Mini Mental Status Exam (Folstein et al., 1975) provides a global evaluation of participant’s cognitive statuses for screening subjects for the study.
Reliability: repeatability
Yield: amount of disease detected in the population<br>
slide59. Instruments Measuring Nurse Caring<br>
slide60. Instruments Measuring Nurse Caring<br>
slide61. Instruments Measuring Nurse Caring<br>