
Integrating natural capital into macroeconomic



Description: Integrating natural capital into macroeconomic models: How may the depletion (and restoration) of natural capital affect medium-term potential output? Olga Croitorov, DG Ecfin DG ECFIN-OGWG workshop on natural capital measurement and
Related Topics
Download Presentation
"Integrating natural capital into macroeconomic" is the property of its rightful owner. Permission is granted to download and print the materials on this website for personal, non-commercial use only, and to display it on your personal computer provided you do not modify the materials and that you retain all copyright notices contained in the materials. By downloading content from our website, you accept the terms of this agreement.
Presentation Transcript
slide1. Integrating natural capital into macroeconomic models:
How may the depletion (and restoration) of natural
capital affect medium-term potential output? Olga Croitorov, DG Ecfin DG ECFIN-OGWG workshop on natural capital measurement and modelling.
Discussion<br>
slide2. Sustainability: Traditional models often assume constant or growing inputs of labor and physical capital, but natural capital is finite. Depletion or degradation of these resources can have long-term negative effects on production capabilities.
Externalities: The standard production function often overlooks negative externalities, coming from economic activities.
Overestimation of Productivity: When natural resources are not included, it may appear that the economy is more productive than it actually is.
Global Interdependencies: Natural capital is not confined by national borders, and its use and depletion can have global consequences.
Papers presented in this session offer insights on how to take into account these issues. Importance of measuring natural capital<br>
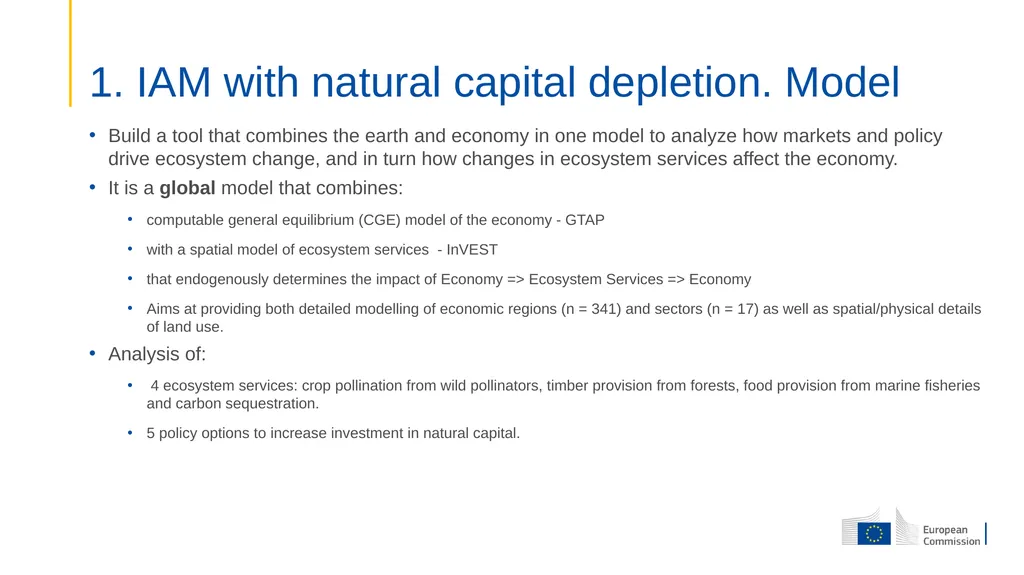
slide3. Build a tool that combines the earth and economy in one model to analyze how markets and policy drive ecosystem change, and in turn how changes in ecosystem services affect the economy.
It is a global model that combines:
computable general equilibrium (CGE) model of the economy - GTAP
with a spatial model of ecosystem services - InVEST
that endogenously determines the impact of Economy => Ecosystem Services => Economy
Aims at providing both detailed modelling of economic regions (n = 341) and sectors (n = 17) as well as spatial/physical details of land use.
Analysis of:
4 ecosystem services: crop pollination from wild pollinators, timber provision from forests, food provision from marine fisheries and carbon sequestration.
5 policy options to increase investment in natural capital. 1. IAM with natural capital depletion. Model<br>
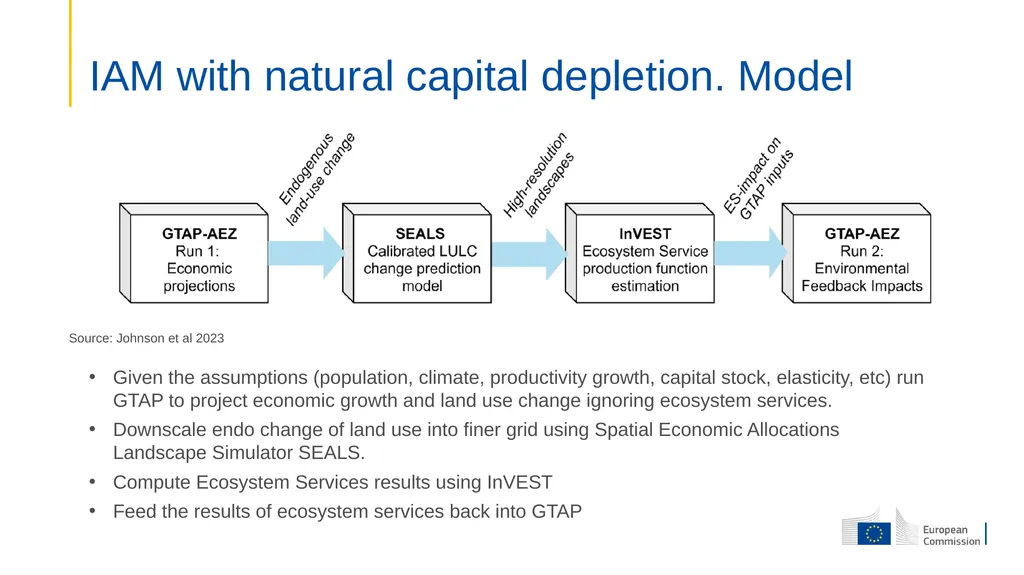
slide4. IAM with natural capital depletion. Model Given the assumptions (population, climate, productivity growth, capital stock, elasticity, etc) run GTAP to project economic growth and land use change ignoring ecosystem services.
Downscale endo change of land use into finer grid using Spatial Economic Allocations Landscape Simulator SEALS.
Compute Ecosystem Services results using InVEST
Feed the results of ecosystem services back into GTAP Source: Johnson et al 2023<br>
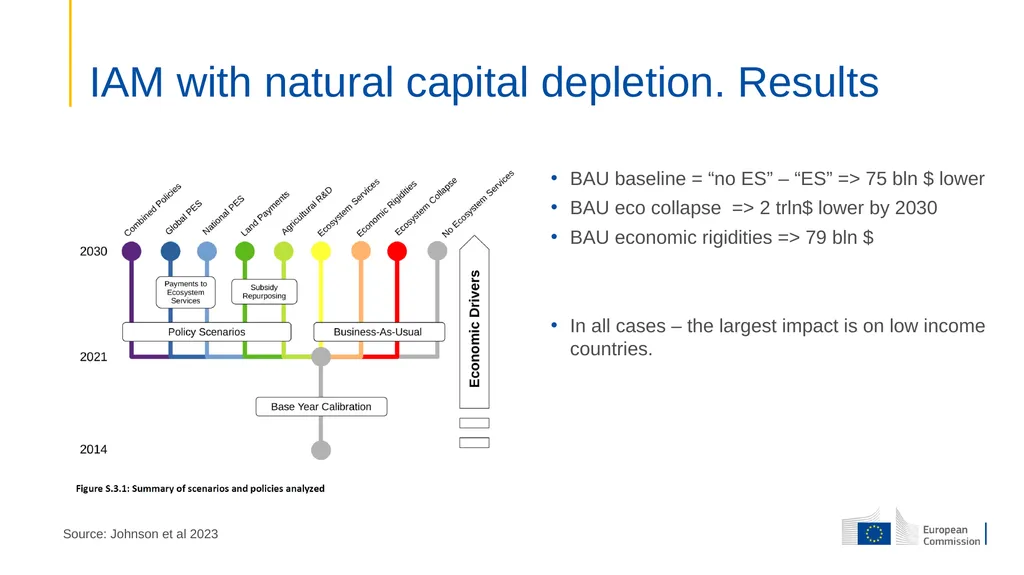
slide5. BAU baseline = “no ES” – “ES” => 75 bln $ lower
BAU eco collapse => 2 trln$ lower by 2030
BAU economic rigidities => 79 bln $
In all cases – the largest impact is on low income countries. IAM with natural capital depletion. Results Source: Johnson et al 2023<br>
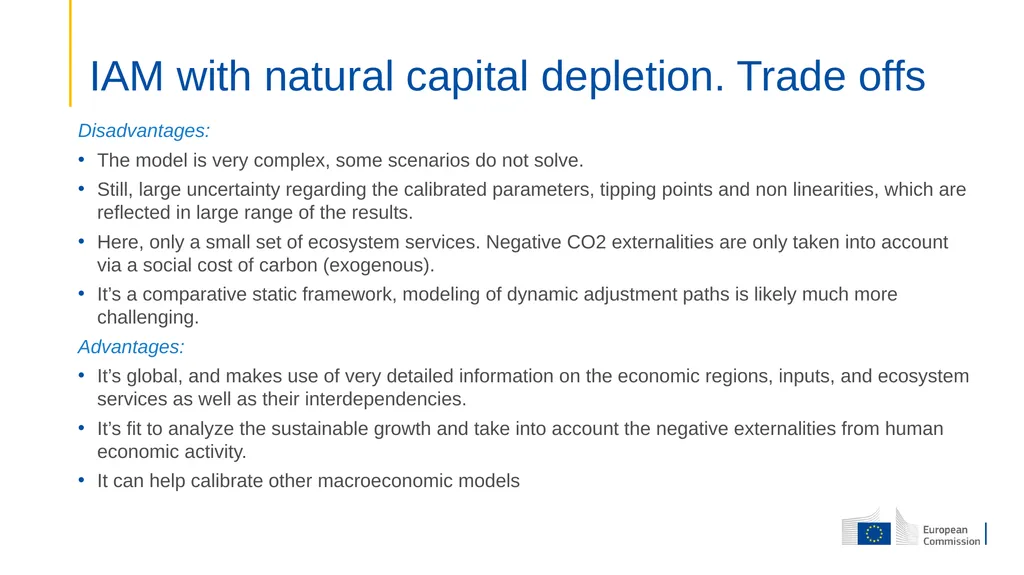
slide6. Disadvantages:
The model is very complex, some scenarios do not solve.
Still, large uncertainty regarding the calibrated parameters, tipping points and non linearities, which are reflected in large range of the results.
Here, only a small set of ecosystem services. Negative CO2 externalities are only taken into account via a social cost of carbon (exogenous).
It’s a comparative static framework, modeling of dynamic adjustment paths is likely much more challenging.
Advantages:
It’s global, and makes use of very detailed information on the economic regions, inputs, and ecosystem services as well as their interdependencies.
It’s fit to analyze the sustainable growth and take into account the negative externalities from human economic activity.
It can help calibrate other macroeconomic models IAM with natural capital depletion. Trade offs<br>
slide7. Authors present a simple and very transparent and easily applicable framework to account for the role of environmental services in production – dependencies (?) and externalities (?).
Paper exploits the growth accounting approach that follows from two assumptions: 1. functional form of the aggregate production and 2. perfect competition in the markets of factor inputs.
Traditional TFP fails to fully account for the role of environmental services in production:
Income generated from natural resources enters GDP, but not the their inputs => falsely higher productivity.
Abatement efforts enter capital and labour inputs, but not as beneficial output in GDP measures => falsely lower productivity.
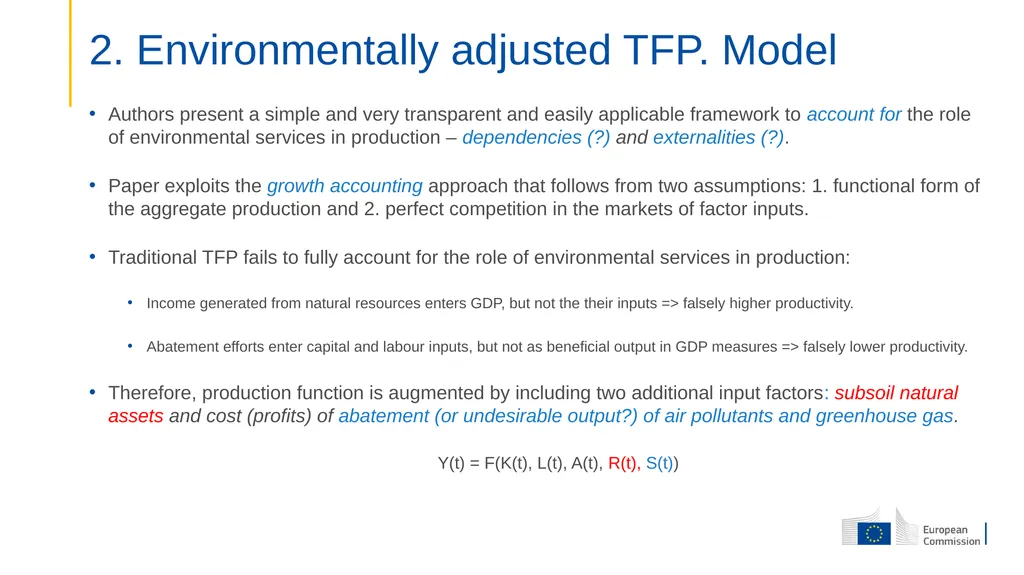
Therefore, production function is augmented by including two additional input factors: subsoil natural assets and cost (profits) of abatement (or undesirable output?) of air pollutants and greenhouse gas.
Y(t) = F(K(t), L(t), A(t), R(t), S(t)) 2. Environmentally adjusted TFP. Model<br>
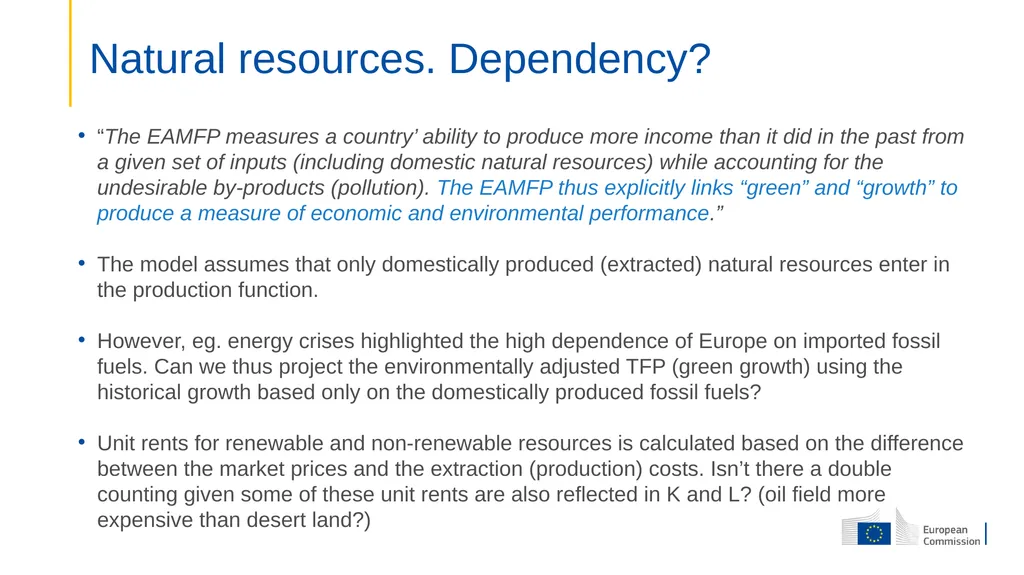
slide8. “The EAMFP measures a country’ ability to produce more income than it did in the past from a given set of inputs (including domestic natural resources) while accounting for the undesirable by-products (pollution). The EAMFP thus explicitly links “green” and “growth” to produce a measure of economic and environmental performance.”
The model assumes that only domestically produced (extracted) natural resources enter in the production function.
However, eg. energy crises highlighted the high dependence of Europe on imported fossil fuels. Can we thus project the environmentally adjusted TFP (green growth) using the historical growth based only on the domestically produced fossil fuels?
Unit rents for renewable and non-renewable resources is calculated based on the difference between the market prices and the extraction (production) costs. Isn’t there a double counting given some of these unit rents are also reflected in K and L? (oil field more expensive than desert land?) Natural resources. Dependency?<br>
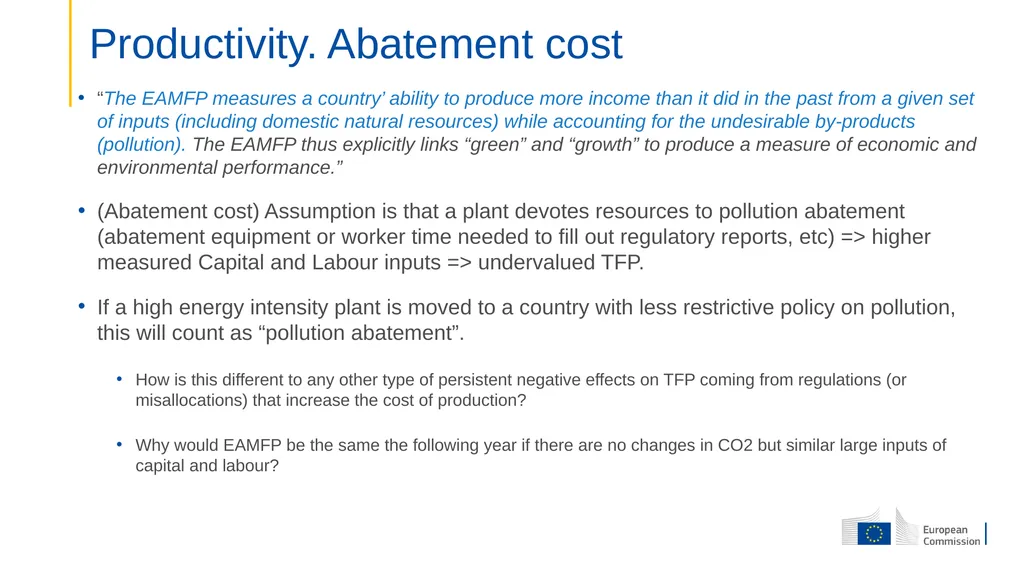
slide9. “The EAMFP measures a country’ ability to produce more income than it did in the past from a given set of inputs (including domestic natural resources) while accounting for the undesirable by-products (pollution). The EAMFP thus explicitly links “green” and “growth” to produce a measure of economic and environmental performance.”
(Abatement cost) Assumption is that a plant devotes resources to pollution abatement (abatement equipment or worker time needed to fill out regulatory reports, etc) => higher measured Capital and Labour inputs => undervalued TFP.
If a high energy intensity plant is moved to a country with less restrictive policy on pollution, this will count as “pollution abatement”.
How is this different to any other type of persistent negative effects on TFP coming from regulations (or misallocations) that increase the cost of production?
Why would EAMFP be the same the following year if there are no changes in CO2 but similar large inputs of capital and labour? Productivity. Abatement cost<br>
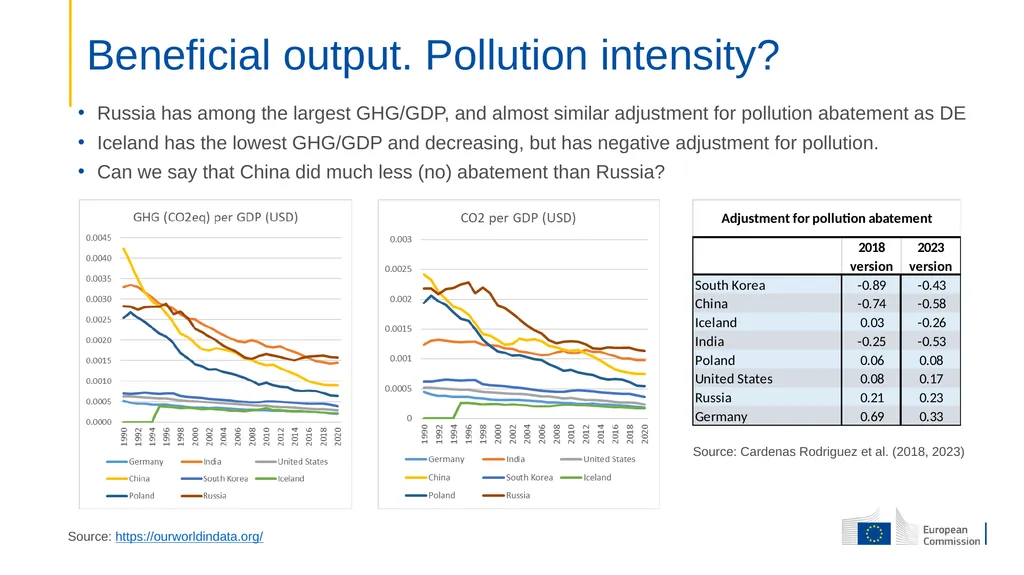
slide10. If the economy catches up (high growth), and uses the existing technologies, rapid growth would still increase CO2 and be interpreted as lack of pollution abatement. Beneficial output. Pollution intensity? Source: https://ourworldindata.org/<br>
slide11. Russia has among the largest GHG/GDP, and almost similar adjustment for pollution abatement as DE
Iceland has the lowest GHG/GDP and decreasing, but has negative adjustment for pollution.
Can we say that China did much less (no) abatement than Russia? Beneficial output. Pollution intensity? Source: https://ourworldindata.org/ Source: Cardenas Rodriguez et al. (2018, 2023)<br>
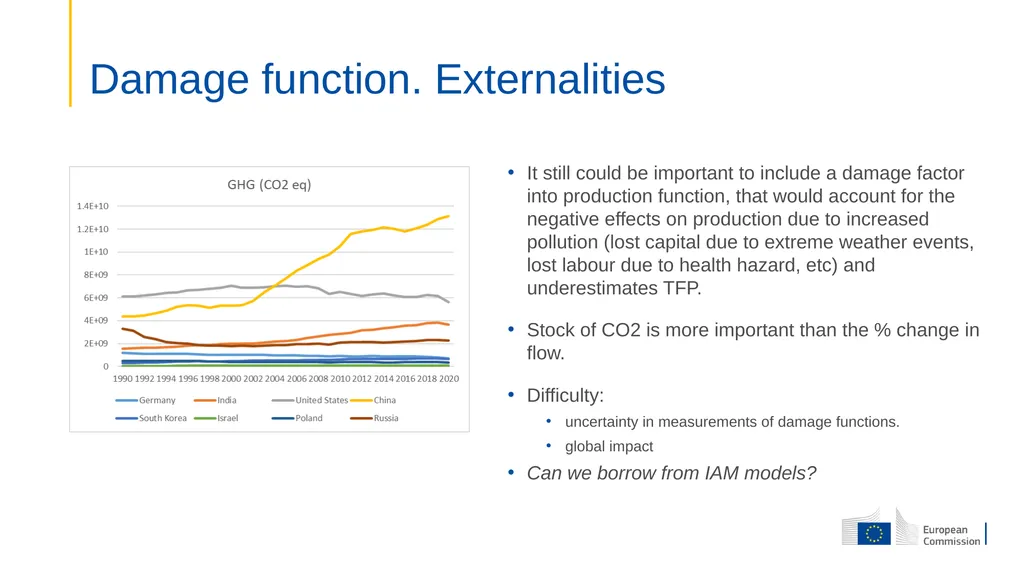
slide12. It still could be important to include a damage factor into production function, that would account for the negative effects on production due to increased pollution (lost capital due to extreme weather events, lost labour due to health hazard, etc) and underestimates TFP.
Stock of CO2 is more important than the % change in flow.
Difficulty:
uncertainty in measurements of damage functions.
global impact
Can we borrow from IAM models? Damage function. Externalities<br>
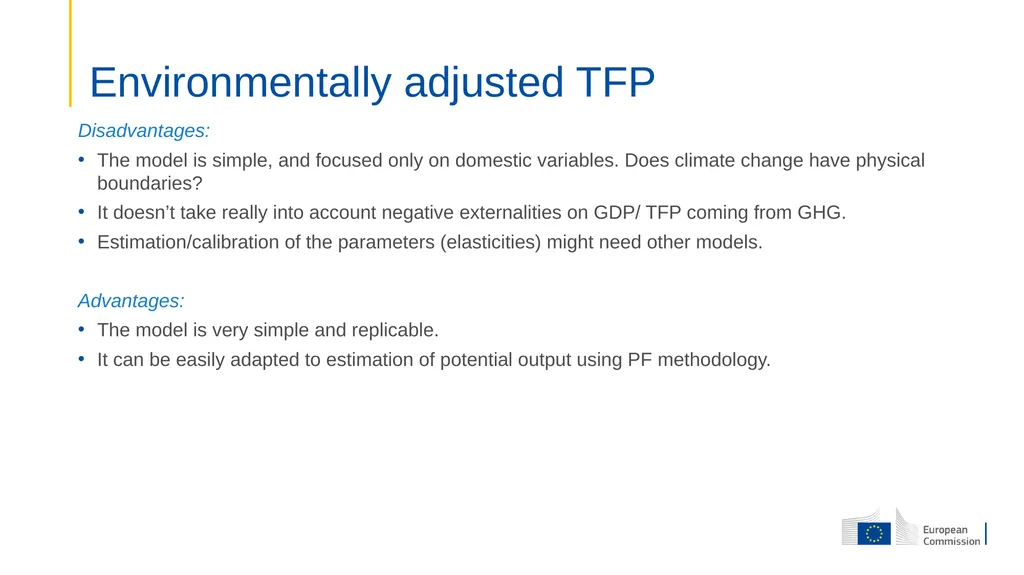
slide13. Disadvantages:
The model is simple, and focused only on domestic variables. Does climate change have physical boundaries?
It doesn’t take really into account negative externalities on GDP/ TFP coming from GHG.
Estimation/calibration of the parameters (elasticities) might need other models.
Advantages:
The model is very simple and replicable.
It can be easily adapted to estimation of potential output using PF methodology. Environmentally adjusted TFP<br>
slide14. Assigning value to natural capital is challenging, but it's essential for understanding the trade-offs between economic growth and environmental preservation.
There is still high uncertainty regarding the evolution of natural capital and impact it might have on the economic growth, welfare and sustainability. Still, it’s important to evaluate the tradeoffs related to this uncertainty.
Similar points for negative externalities coming from economic activity.
“What gets measured gets managed” Challenges ahead<br>
slide15. Thank you © European Union 2020
Unless otherwise noted the reuse of this presentation is authorised under the CC BY 4.0 license. For any use or reproduction of elements that are not owned by the EU, permission may need to be sought directly from the respective right holders.<br>
Discussion<br>
slide2. Sustainability: Traditional models often assume constant or growing inputs of labor and physical capital, but natural capital is finite. Depletion or degradation of these resources can have long-term negative effects on production capabilities.
Externalities: The standard production function often overlooks negative externalities, coming from economic activities.
Overestimation of Productivity: When natural resources are not included, it may appear that the economy is more productive than it actually is.
Global Interdependencies: Natural capital is not confined by national borders, and its use and depletion can have global consequences.
Papers presented in this session offer insights on how to take into account these issues. Importance of measuring natural capital<br>
slide3. Build a tool that combines the earth and economy in one model to analyze how markets and policy drive ecosystem change, and in turn how changes in ecosystem services affect the economy.
It is a global model that combines:
computable general equilibrium (CGE) model of the economy - GTAP
with a spatial model of ecosystem services - InVEST
that endogenously determines the impact of Economy => Ecosystem Services => Economy
Aims at providing both detailed modelling of economic regions (n = 341) and sectors (n = 17) as well as spatial/physical details of land use.
Analysis of:
4 ecosystem services: crop pollination from wild pollinators, timber provision from forests, food provision from marine fisheries and carbon sequestration.
5 policy options to increase investment in natural capital. 1. IAM with natural capital depletion. Model<br>
slide4. IAM with natural capital depletion. Model Given the assumptions (population, climate, productivity growth, capital stock, elasticity, etc) run GTAP to project economic growth and land use change ignoring ecosystem services.
Downscale endo change of land use into finer grid using Spatial Economic Allocations Landscape Simulator SEALS.
Compute Ecosystem Services results using InVEST
Feed the results of ecosystem services back into GTAP Source: Johnson et al 2023<br>
slide5. BAU baseline = “no ES” – “ES” => 75 bln $ lower
BAU eco collapse => 2 trln$ lower by 2030
BAU economic rigidities => 79 bln $
In all cases – the largest impact is on low income countries. IAM with natural capital depletion. Results Source: Johnson et al 2023<br>
slide6. Disadvantages:
The model is very complex, some scenarios do not solve.
Still, large uncertainty regarding the calibrated parameters, tipping points and non linearities, which are reflected in large range of the results.
Here, only a small set of ecosystem services. Negative CO2 externalities are only taken into account via a social cost of carbon (exogenous).
It’s a comparative static framework, modeling of dynamic adjustment paths is likely much more challenging.
Advantages:
It’s global, and makes use of very detailed information on the economic regions, inputs, and ecosystem services as well as their interdependencies.
It’s fit to analyze the sustainable growth and take into account the negative externalities from human economic activity.
It can help calibrate other macroeconomic models IAM with natural capital depletion. Trade offs<br>
slide7. Authors present a simple and very transparent and easily applicable framework to account for the role of environmental services in production – dependencies (?) and externalities (?).
Paper exploits the growth accounting approach that follows from two assumptions: 1. functional form of the aggregate production and 2. perfect competition in the markets of factor inputs.
Traditional TFP fails to fully account for the role of environmental services in production:
Income generated from natural resources enters GDP, but not the their inputs => falsely higher productivity.
Abatement efforts enter capital and labour inputs, but not as beneficial output in GDP measures => falsely lower productivity.
Therefore, production function is augmented by including two additional input factors: subsoil natural assets and cost (profits) of abatement (or undesirable output?) of air pollutants and greenhouse gas.
Y(t) = F(K(t), L(t), A(t), R(t), S(t)) 2. Environmentally adjusted TFP. Model<br>
slide8. “The EAMFP measures a country’ ability to produce more income than it did in the past from a given set of inputs (including domestic natural resources) while accounting for the undesirable by-products (pollution). The EAMFP thus explicitly links “green” and “growth” to produce a measure of economic and environmental performance.”
The model assumes that only domestically produced (extracted) natural resources enter in the production function.
However, eg. energy crises highlighted the high dependence of Europe on imported fossil fuels. Can we thus project the environmentally adjusted TFP (green growth) using the historical growth based only on the domestically produced fossil fuels?
Unit rents for renewable and non-renewable resources is calculated based on the difference between the market prices and the extraction (production) costs. Isn’t there a double counting given some of these unit rents are also reflected in K and L? (oil field more expensive than desert land?) Natural resources. Dependency?<br>
slide9. “The EAMFP measures a country’ ability to produce more income than it did in the past from a given set of inputs (including domestic natural resources) while accounting for the undesirable by-products (pollution). The EAMFP thus explicitly links “green” and “growth” to produce a measure of economic and environmental performance.”
(Abatement cost) Assumption is that a plant devotes resources to pollution abatement (abatement equipment or worker time needed to fill out regulatory reports, etc) => higher measured Capital and Labour inputs => undervalued TFP.
If a high energy intensity plant is moved to a country with less restrictive policy on pollution, this will count as “pollution abatement”.
How is this different to any other type of persistent negative effects on TFP coming from regulations (or misallocations) that increase the cost of production?
Why would EAMFP be the same the following year if there are no changes in CO2 but similar large inputs of capital and labour? Productivity. Abatement cost<br>
slide10. If the economy catches up (high growth), and uses the existing technologies, rapid growth would still increase CO2 and be interpreted as lack of pollution abatement. Beneficial output. Pollution intensity? Source: https://ourworldindata.org/<br>
slide11. Russia has among the largest GHG/GDP, and almost similar adjustment for pollution abatement as DE
Iceland has the lowest GHG/GDP and decreasing, but has negative adjustment for pollution.
Can we say that China did much less (no) abatement than Russia? Beneficial output. Pollution intensity? Source: https://ourworldindata.org/ Source: Cardenas Rodriguez et al. (2018, 2023)<br>
slide12. It still could be important to include a damage factor into production function, that would account for the negative effects on production due to increased pollution (lost capital due to extreme weather events, lost labour due to health hazard, etc) and underestimates TFP.
Stock of CO2 is more important than the % change in flow.
Difficulty:
uncertainty in measurements of damage functions.
global impact
Can we borrow from IAM models? Damage function. Externalities<br>
slide13. Disadvantages:
The model is simple, and focused only on domestic variables. Does climate change have physical boundaries?
It doesn’t take really into account negative externalities on GDP/ TFP coming from GHG.
Estimation/calibration of the parameters (elasticities) might need other models.
Advantages:
The model is very simple and replicable.
It can be easily adapted to estimation of potential output using PF methodology. Environmentally adjusted TFP<br>
slide14. Assigning value to natural capital is challenging, but it's essential for understanding the trade-offs between economic growth and environmental preservation.
There is still high uncertainty regarding the evolution of natural capital and impact it might have on the economic growth, welfare and sustainability. Still, it’s important to evaluate the tradeoffs related to this uncertainty.
Similar points for negative externalities coming from economic activity.
“What gets measured gets managed” Challenges ahead<br>
slide15. Thank you © European Union 2020
Unless otherwise noted the reuse of this presentation is authorised under the CC BY 4.0 license. For any use or reproduction of elements that are not owned by the EU, permission may need to be sought directly from the respective right holders.<br>