Interpreting Sleep Study Reports: A Primer for Pulmonary Fellows By Martha E. Billings, MD MSc for the Sleep Education for Pulmonary Fellows and Practitioners, SRN ATS Committee August 18, 2014 Obstructive Sleep Apnea Obstructive sleep
"Interpreting Sleep Study Reports: A Primer for" is the property of its rightful owner. Permission is granted to
download and print the materials on this website for personal, non-commercial use only, and to display it
on your personal computer provided you do not modify the materials and that you retain all copyright
notices contained in the materials. By downloading content from our website, you accept the terms of this
agreement.
Presentation Transcript
01
Interpreting Sleep Study Reports: A Primer for Pulmonary Fellows By Martha E. Billings, MD MSc
for the Sleep Education for Pulmonary Fellows and Practitioners, SRN ATS Committee
August 18, 2014<br>
02
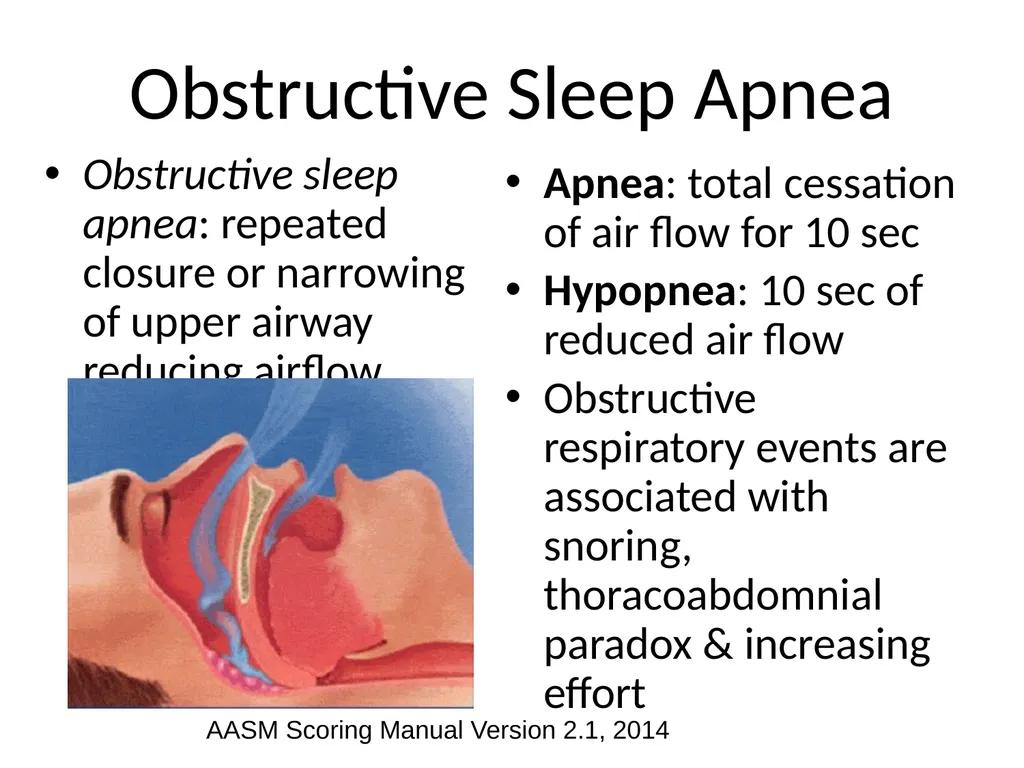
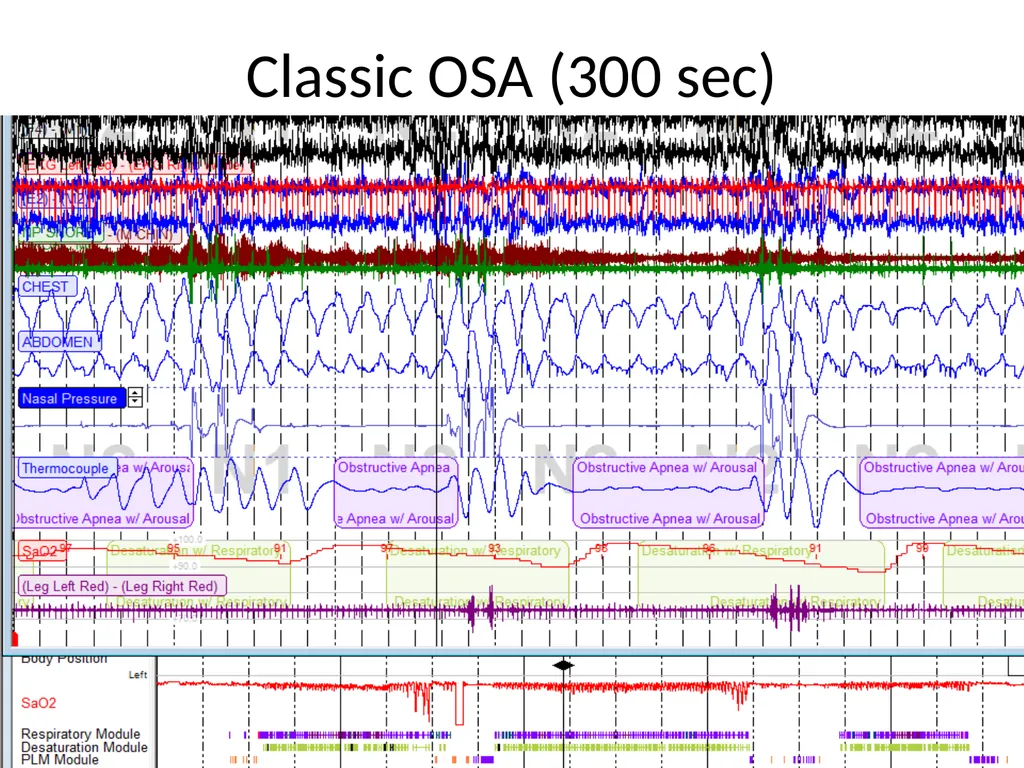
Obstructive Sleep Apnea Obstructive sleep apnea: repeated closure or narrowing of upper airway reducing airflow Apnea: total cessation of air flow for 10 sec
Hypopnea: 10 sec of reduced air flow
Obstructive respiratory events are associated with snoring, thoracoabdomnial paradox & increasing effort AASM Scoring Manual Version 2.1, 2014<br>
03
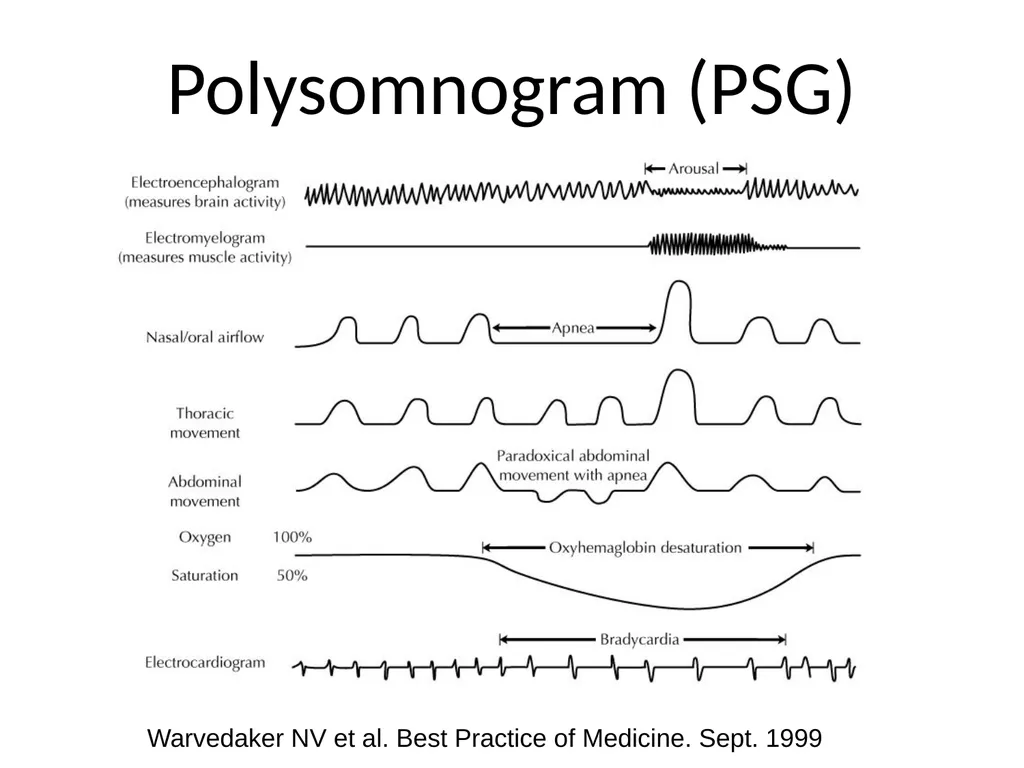
Polysomnogram (PSG) Warvedaker NV et al. Best Practice of Medicine. Sept. 1999<br>
04
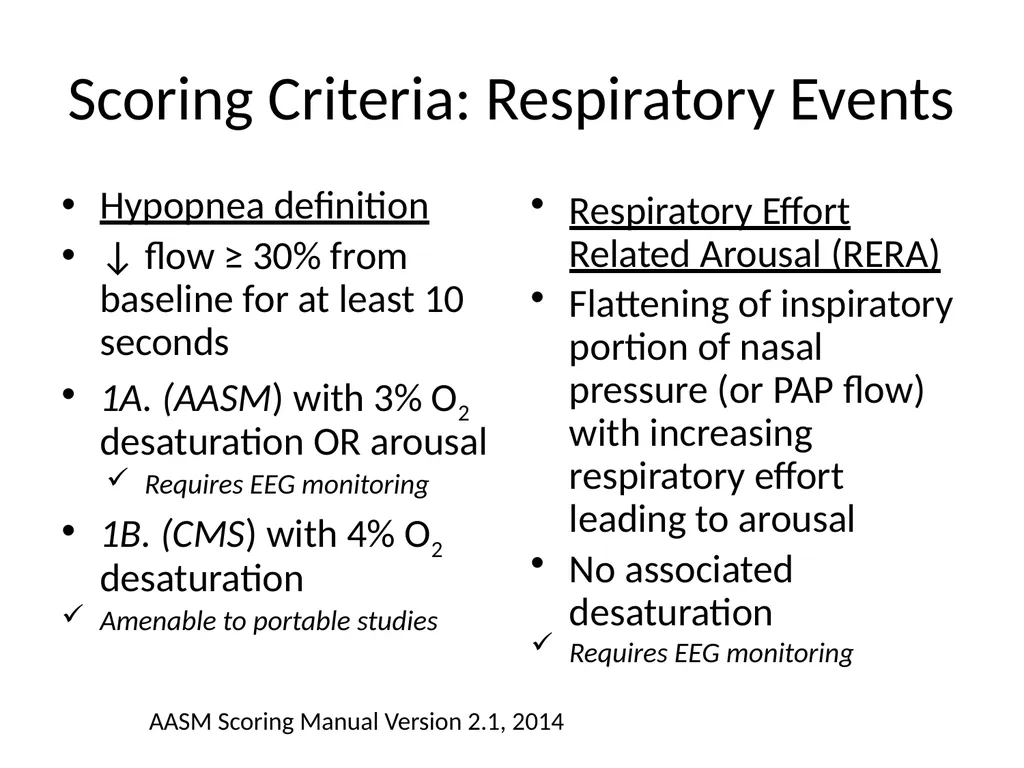
Scoring Criteria: Respiratory Events Hypopnea definition
↓ flow ≥ 30% from baseline for at least 10 seconds
1A. (AASM) with 3% O2 desaturation OR arousal
Requires EEG monitoring
1B. (CMS) with 4% O2 desaturation
Amenable to portable studies Respiratory Effort Related Arousal (RERA)
Flattening of inspiratory portion of nasal pressure (or PAP flow) with increasing respiratory effort leading to arousal
No associated desaturation
Requires EEG monitoring AASM Scoring Manual Version 2.1, 2014<br>
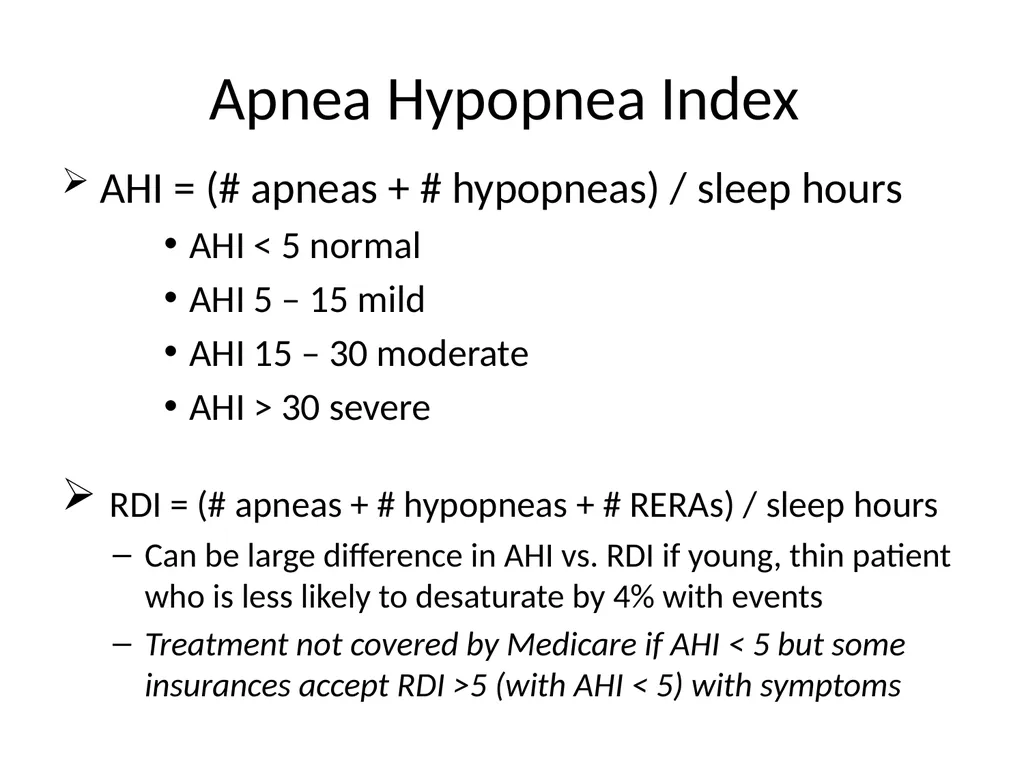
RDI = (# apneas + # hypopneas + # RERAs) / sleep hours
Can be large difference in AHI vs. RDI if young, thin patient who is less likely to desaturate by 4% with events
Treatment not covered by Medicare if AHI < 5 but some insurances accept RDI >5 (with AHI < 5) with symptoms<br>
06
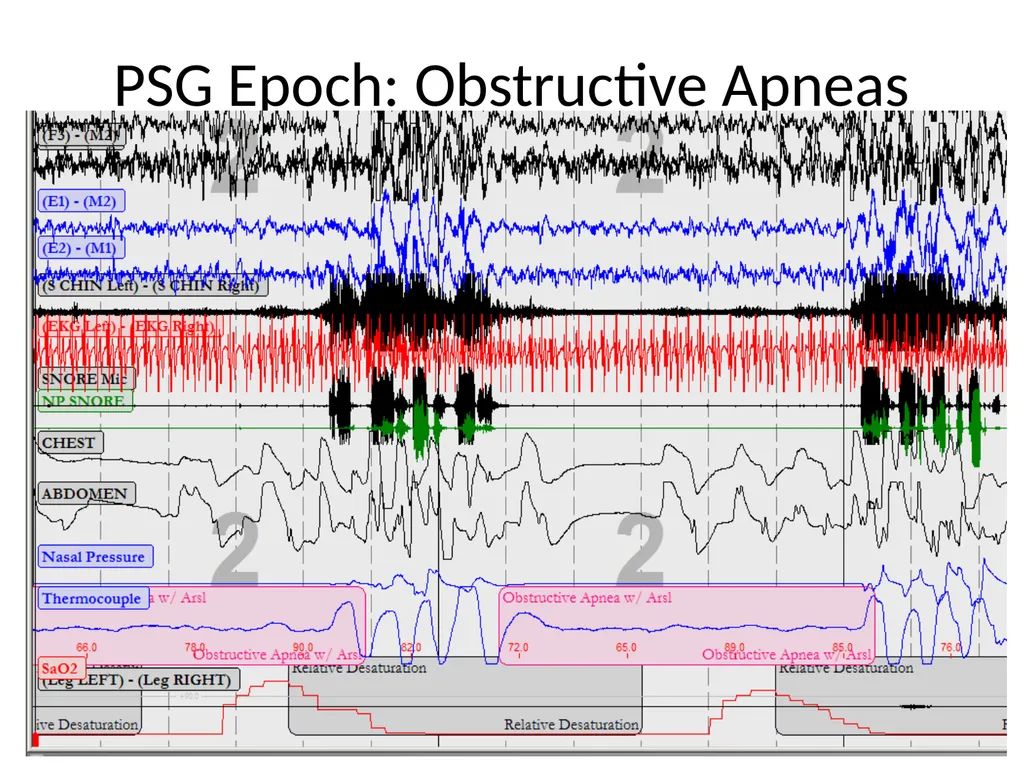
PSG Epoch: Obstructive Apneas<br>
07
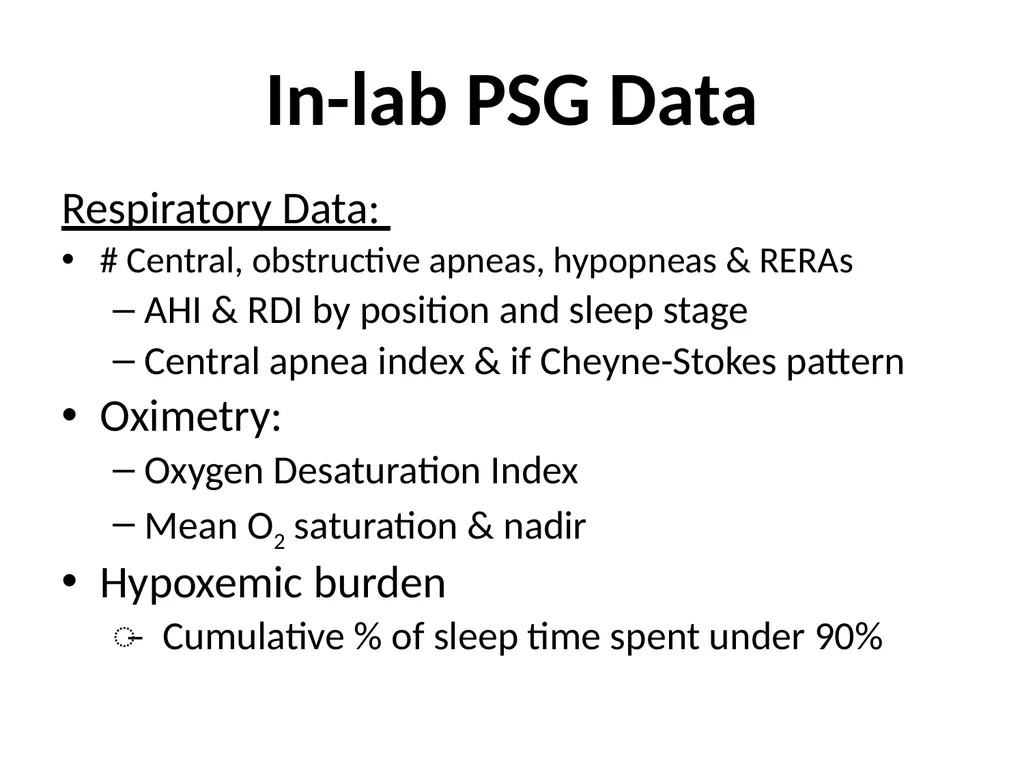
In-lab PSG Data Respiratory Data:
# Central, obstructive apneas, hypopneas & RERAs
AHI & RDI by position and sleep stage
Central apnea index & if Cheyne-Stokes pattern
Oximetry:
Oxygen Desaturation Index
Mean O2 saturation & nadir
Hypoxemic burden
̶ Cumulative % of sleep time spent under 90%<br>
08
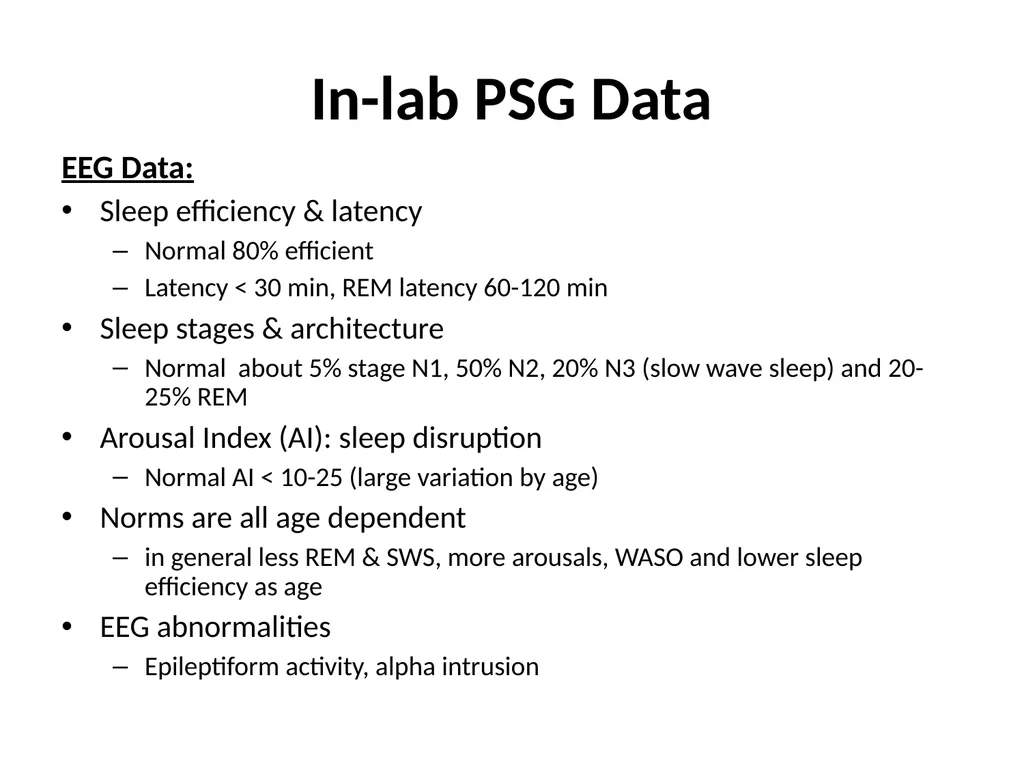
In-lab PSG Data EEG Data:
Sleep efficiency & latency
Normal 80% efficient
Latency < 30 min, REM latency 60-120 min
Sleep stages & architecture
Normal about 5% stage N1, 50% N2, 20% N3 (slow wave sleep) and 20-25% REM
Arousal Index (AI): sleep disruption
Normal AI < 10-25 (large variation by age)
Norms are all age dependent
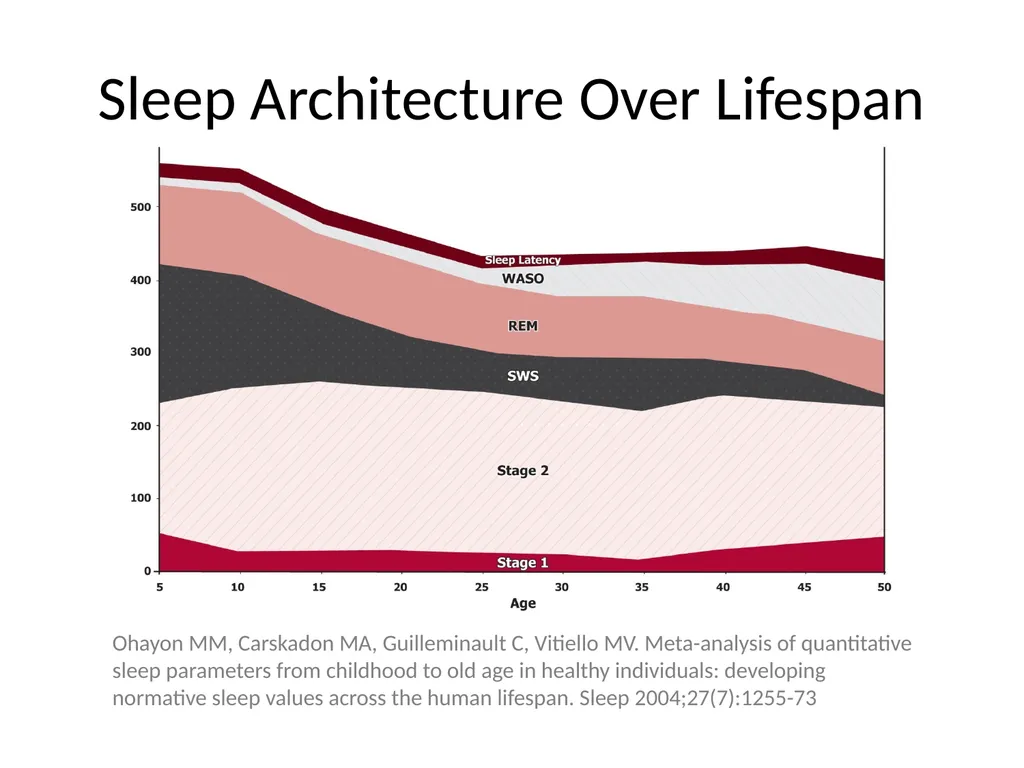
in general less REM & SWS, more arousals, WASO and lower sleep efficiency as age
EEG abnormalities
Epileptiform activity, alpha intrusion<br>
09
Sleep Architecture Over Lifespan Ohayon MM, Carskadon MA, Guilleminault C, Vitiello MV. Meta-analysis of quantitative sleep parameters from childhood to old age in healthy individuals: developing normative sleep values across the human lifespan. Sleep 2004;27(7):1255-73<br>
10
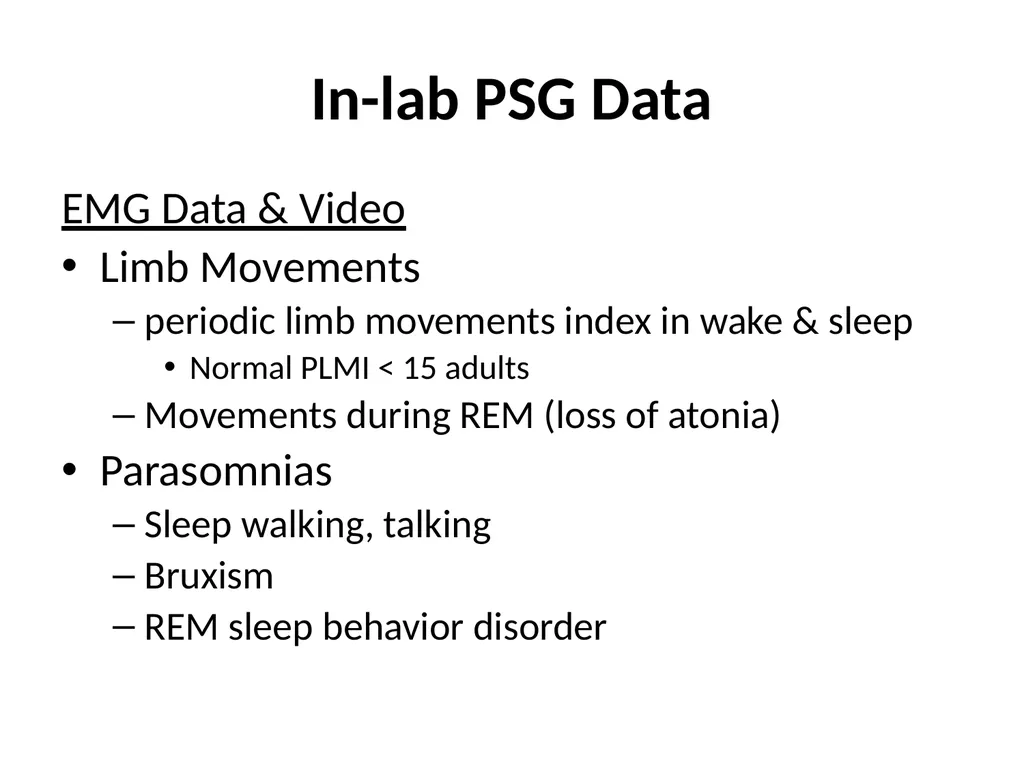
In-lab PSG Data EMG Data & Video
Limb Movements
periodic limb movements index in wake & sleep
Normal PLMI < 15 adults
Movements during REM (loss of atonia)
Parasomnias
Sleep walking, talking
Bruxism
REM sleep behavior disorder<br>
11
Classic OSA (300 sec)<br>
12
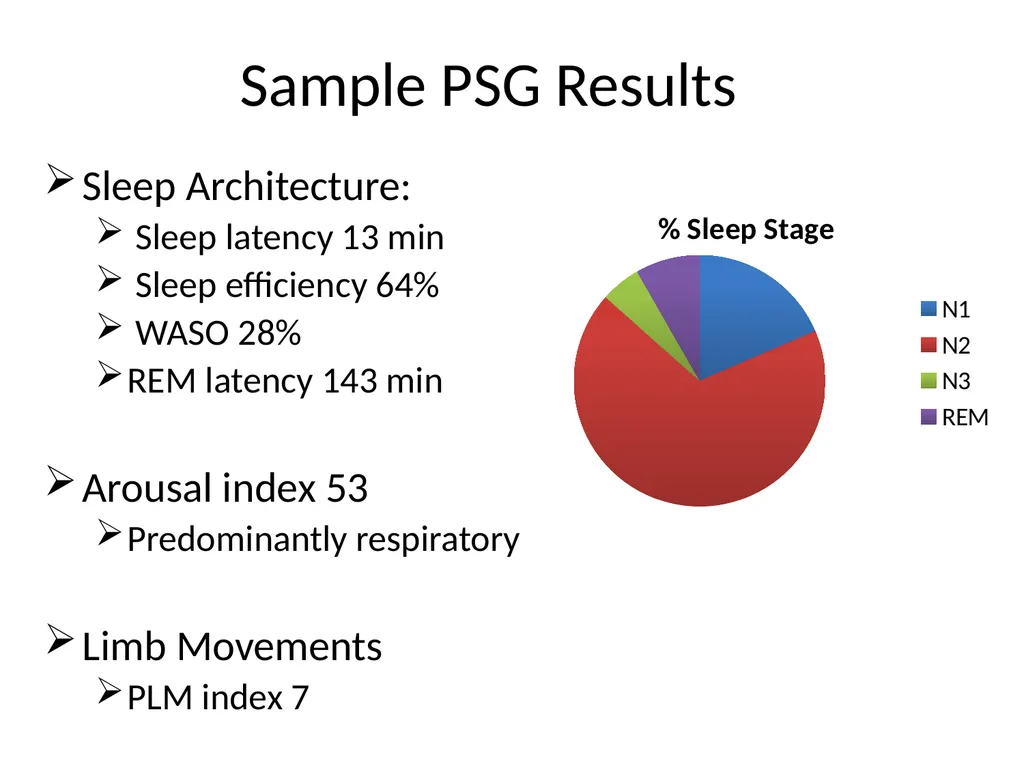
Sample PSG Results Sleep Architecture:
Sleep latency 13 min
Sleep efficiency 64%
WASO 28%
REM latency 143 min
Arousal index 53
Predominantly respiratory
Limb Movements
PLM index 7<br>
13
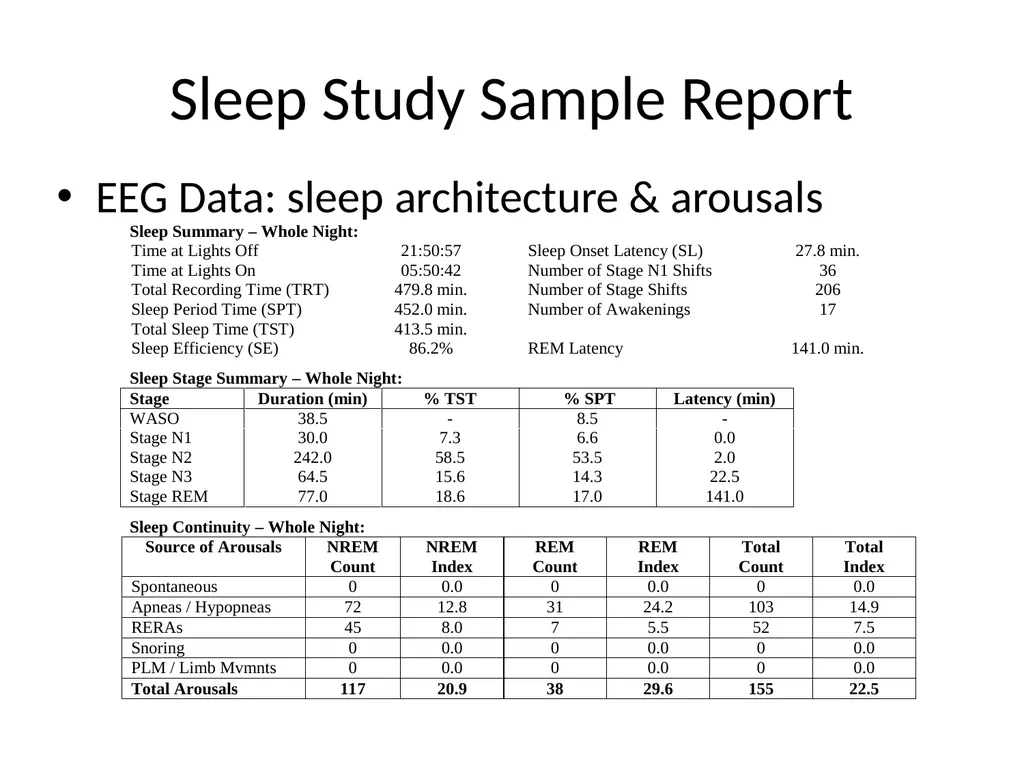
Sleep Study Sample Report EEG Data: sleep architecture & arousals<br>
14
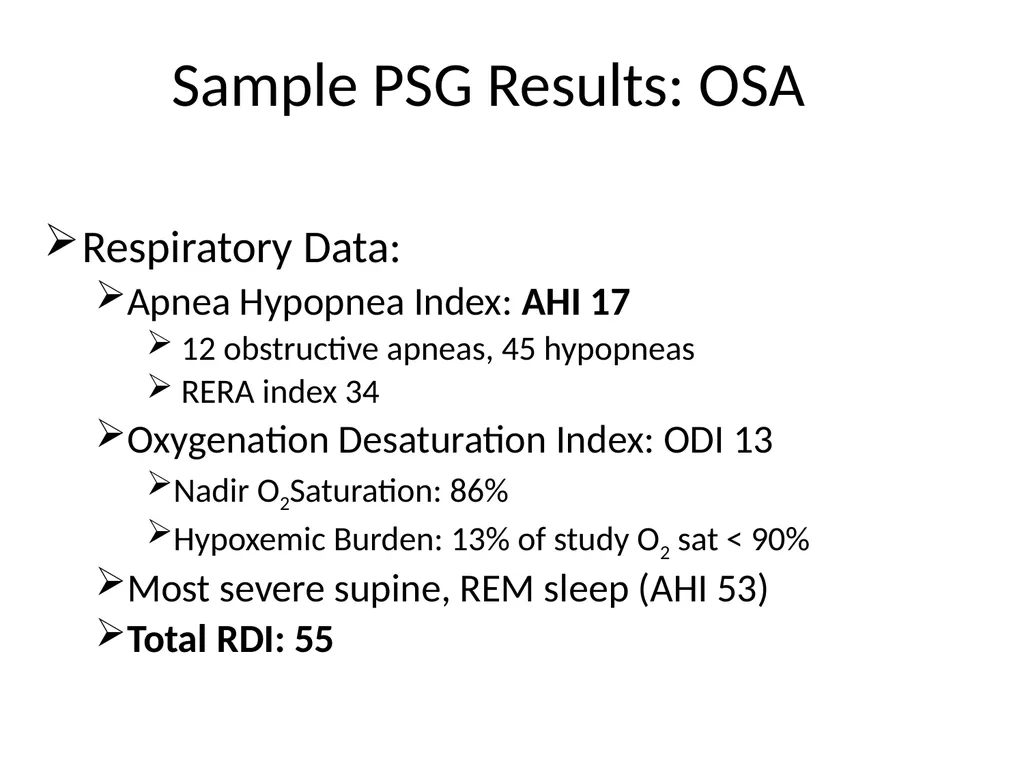
Sample PSG Results: OSA Respiratory Data:
Apnea Hypopnea Index: AHI 17
12 obstructive apneas, 45 hypopneas
RERA index 34
Oxygenation Desaturation Index: ODI 13
Nadir O2Saturation: 86%
Hypoxemic Burden: 13% of study O2 sat < 90%
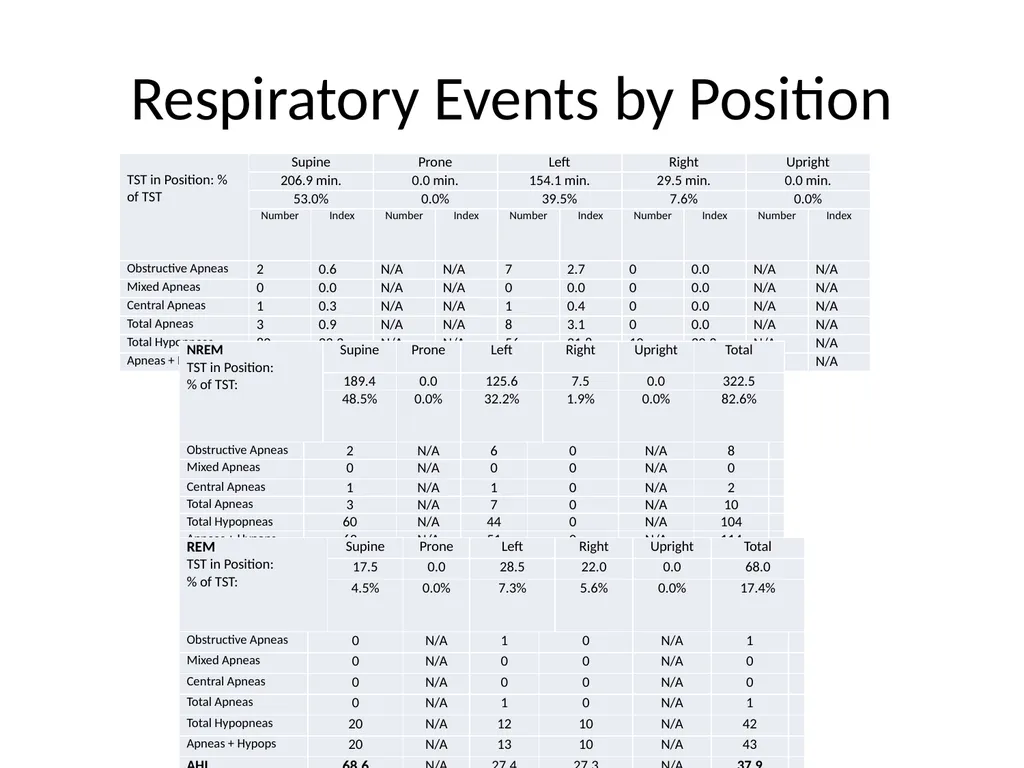
Most severe supine, REM sleep (AHI 53)
Total RDI: 55<br>
15
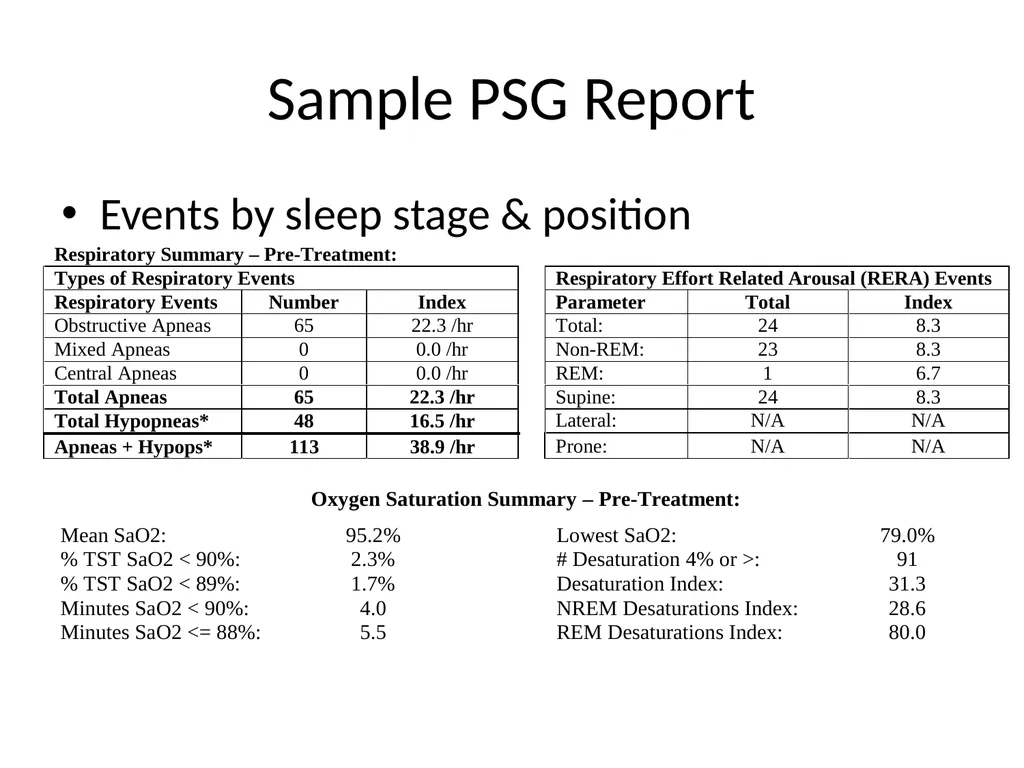
Sample PSG Report Events by sleep stage & position<br>
16
Respiratory Events by Position<br>
17
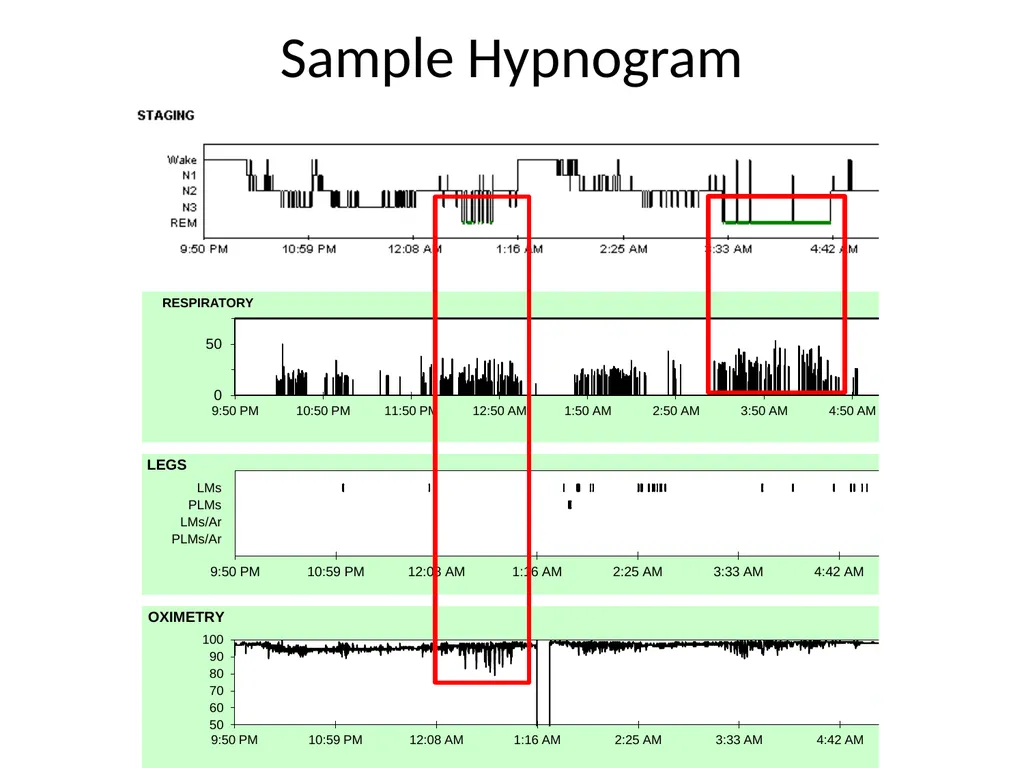
Sample Hypnogram<br>
18
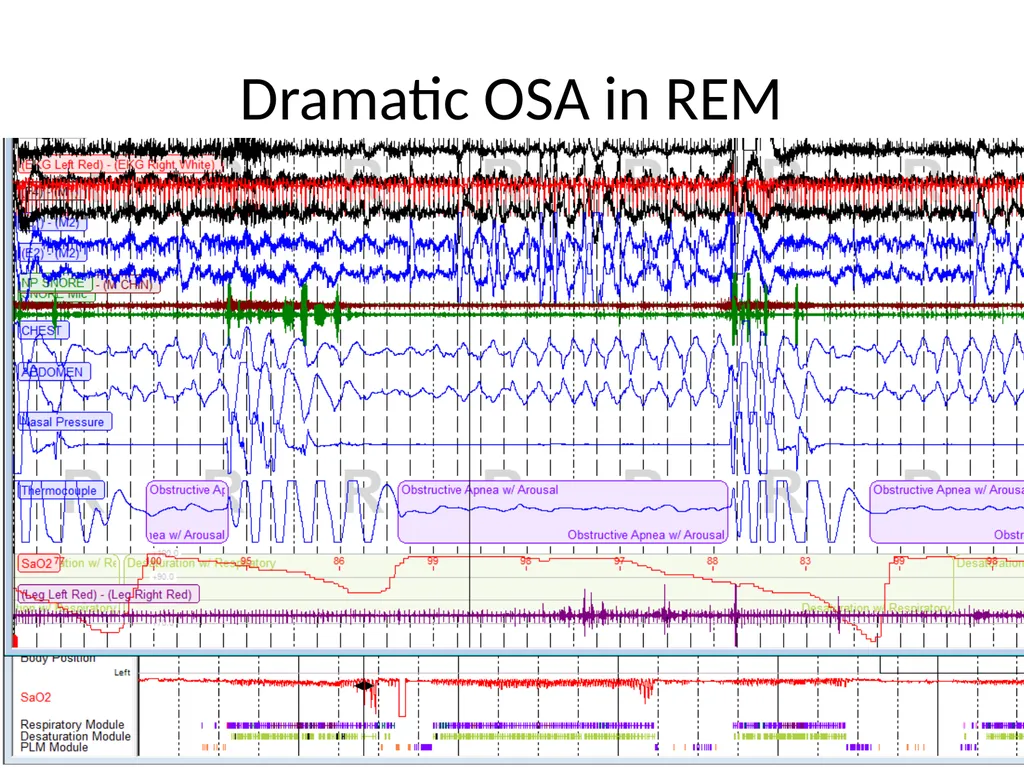
Dramatic OSA in REM<br>
19
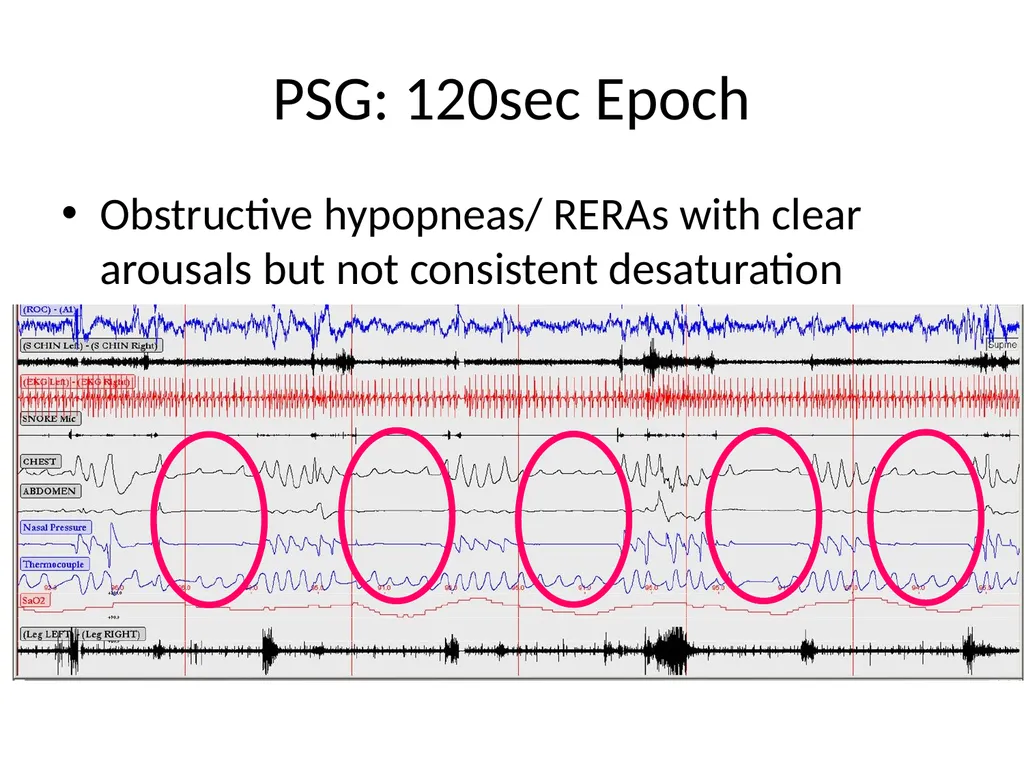
PSG: 120sec Epoch Obstructive hypopneas/ RERAs with clear arousals but not consistent desaturation<br>
20
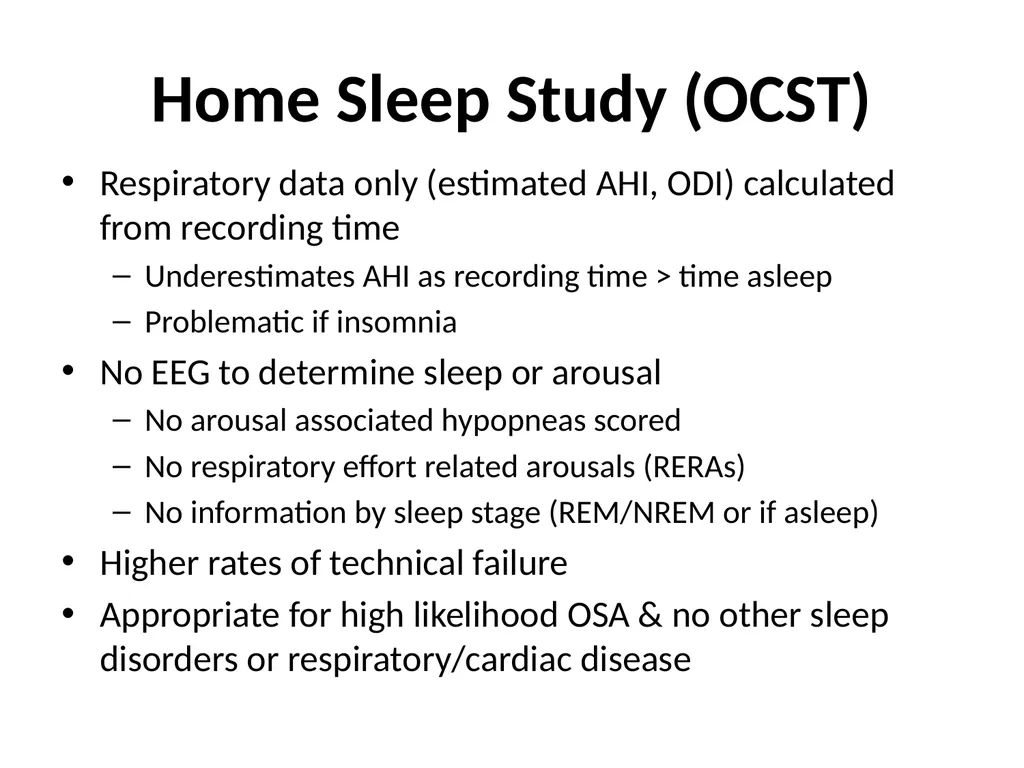
Home Sleep Study (OCST) Respiratory data only (estimated AHI, ODI) calculated from recording time
Underestimates AHI as recording time > time asleep
Problematic if insomnia
No EEG to determine sleep or arousal
No arousal associated hypopneas scored
No respiratory effort related arousals (RERAs)
No information by sleep stage (REM/NREM or if asleep)
Higher rates of technical failure
Appropriate for high likelihood OSA & no other sleep disorders or respiratory/cardiac disease<br>
21
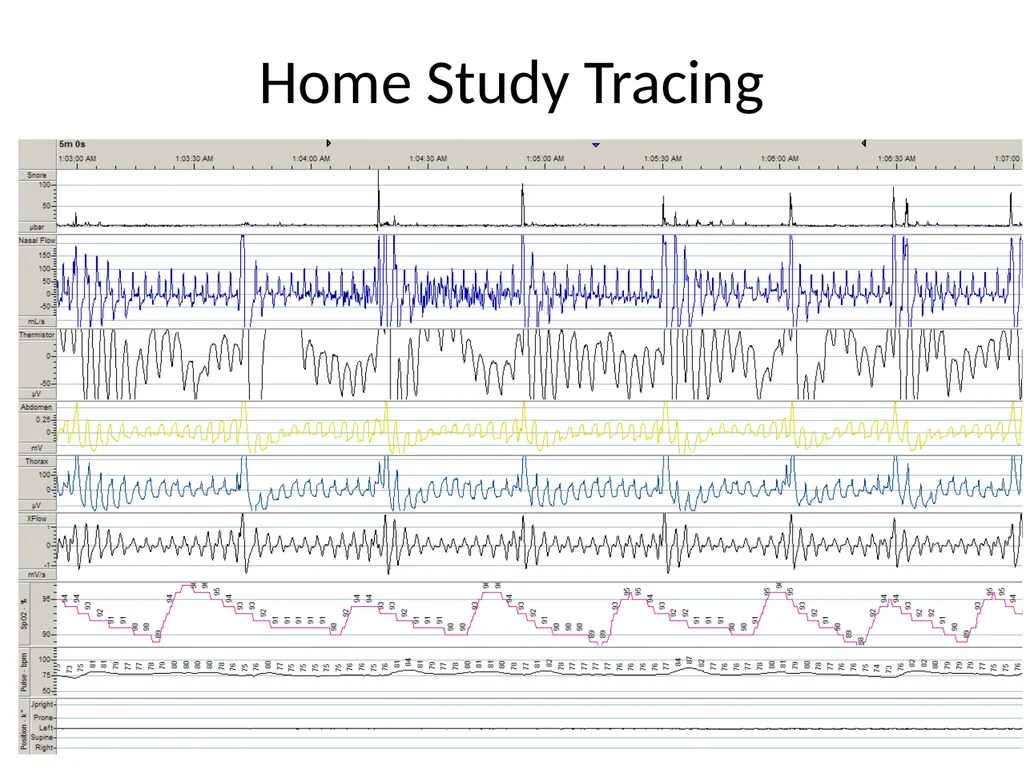
Home Study Tracing<br>
22
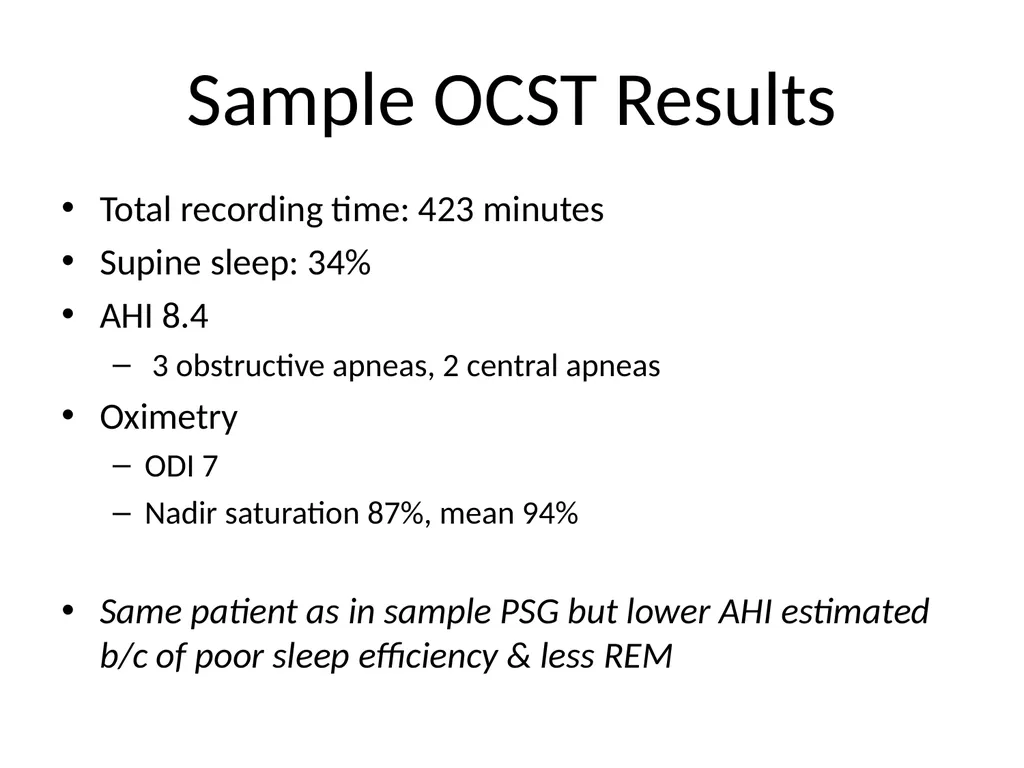
Sample OCST Results Total recording time: 423 minutes
Supine sleep: 34%
AHI 8.4
3 obstructive apneas, 2 central apneas
Oximetry
ODI 7
Nadir saturation 87%, mean 94%
Same patient as in sample PSG but lower AHI estimated b/c of poor sleep efficiency & less REM<br>
23
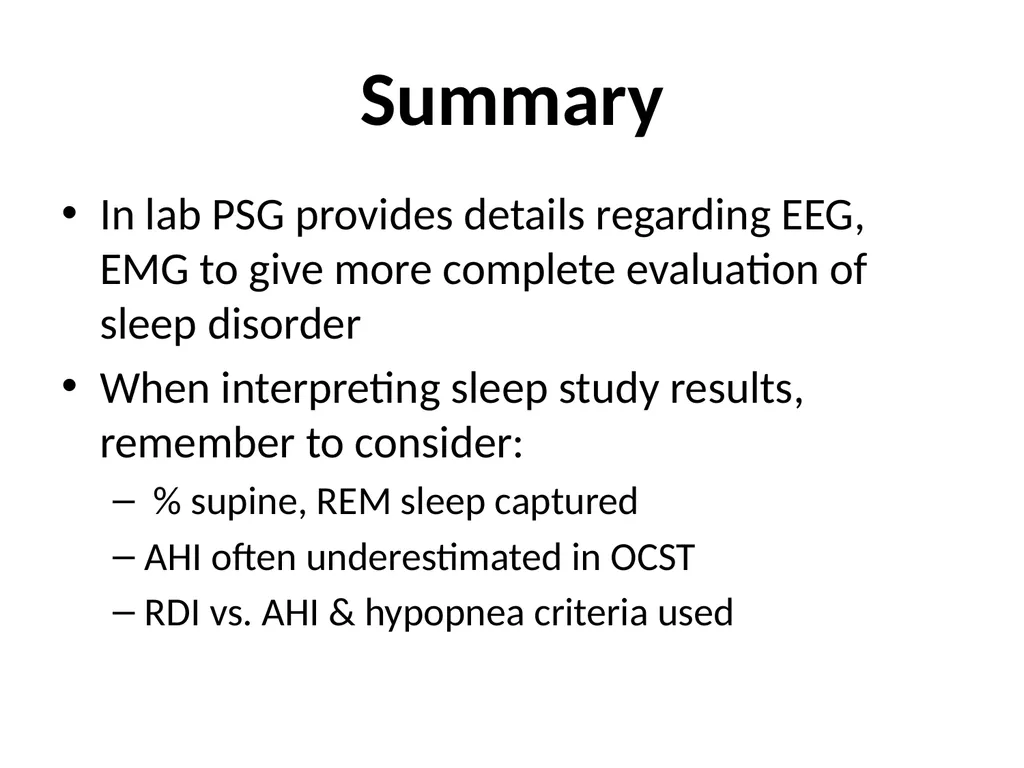
Summary In lab PSG provides details regarding EEG, EMG to give more complete evaluation of sleep disorder
When interpreting sleep study results, remember to consider:
% supine, REM sleep captured
AHI often underestimated in OCST
RDI vs. AHI & hypopnea criteria used<br>