
Introduction to Data Analysis and Decision Making
Description: Introduction to Data Analysis and Decision Making 1 Introduction (slide 1 of 2) Living in the age of technology has implications for everyone entering the business world. Technology makes it possible to collect huge amounts of data.
Related Topics
Download Presentation
"Introduction to Data Analysis and Decision Making" is the property of its rightful owner. Permission is granted to download and print the materials on this website for personal, non-commercial use only, and to display it on your personal computer provided you do not modify the materials and that you retain all copyright notices contained in the materials. By downloading content from our website, you accept the terms of this agreement.
Presentation Transcript
slide1. Introduction to Data Analysis and Decision Making 1<br>
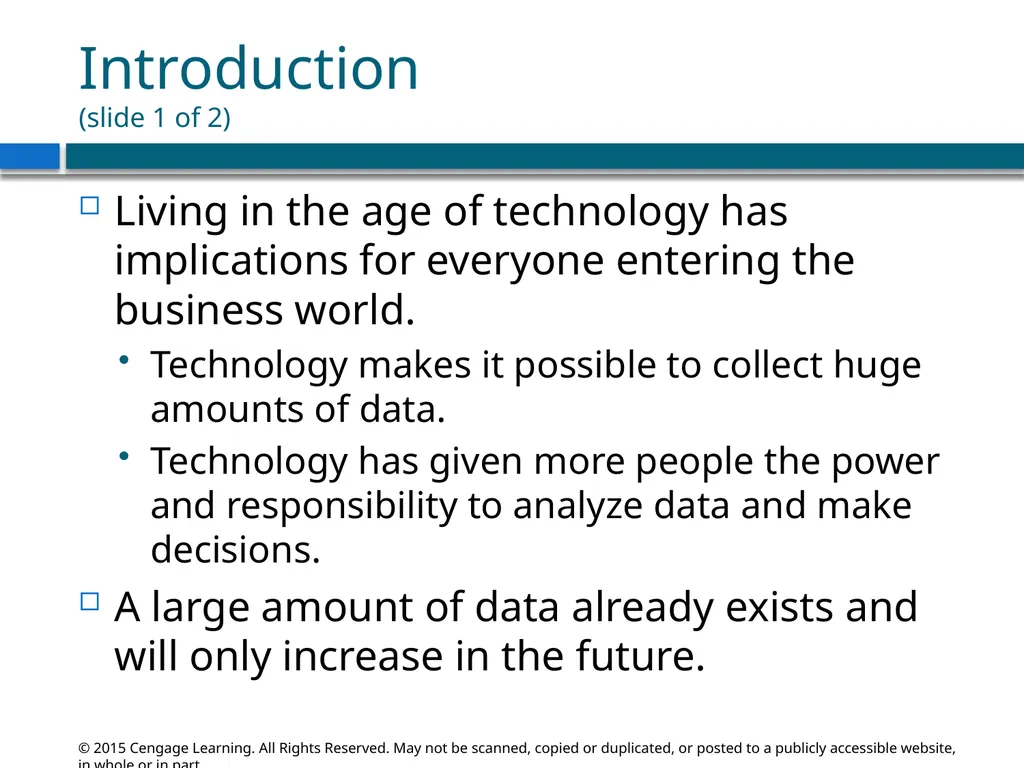
slide2. Introduction (slide 1 of 2) Living in the age of technology has implications for everyone entering the business world.
Technology makes it possible to collect huge amounts of data.
Technology has given more people the power and responsibility to analyze data and make decisions.
A large amount of data already exists and will only increase in the future.<br>
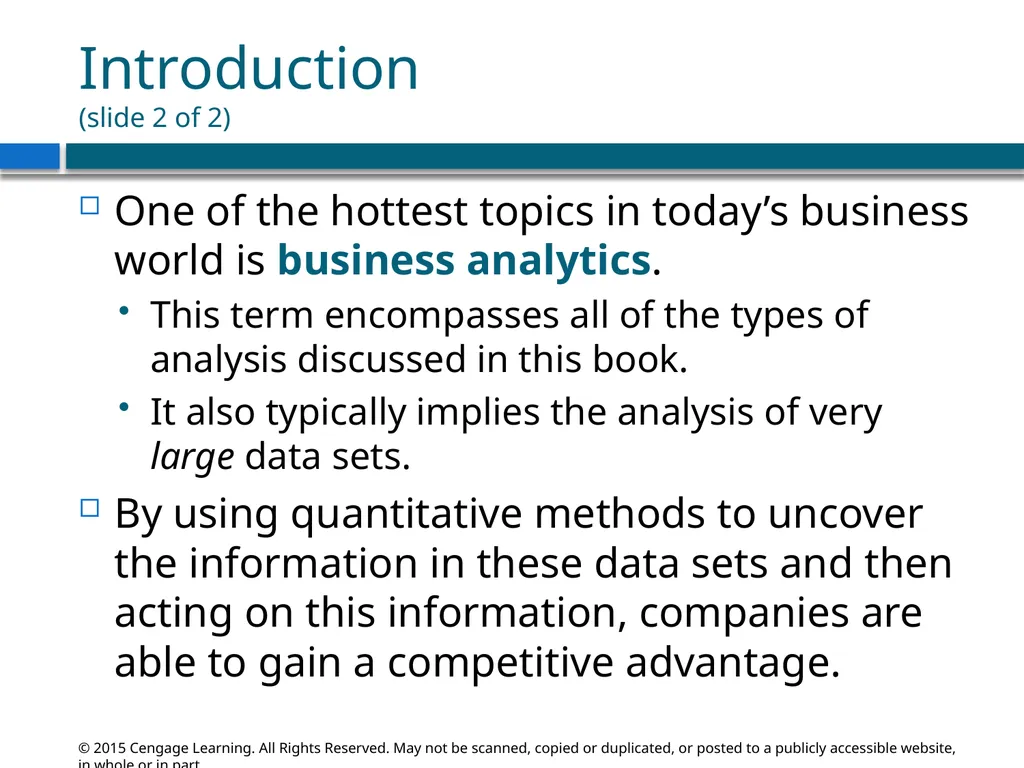
slide3. Introduction (slide 2 of 2) One of the hottest topics in today’s business world is business analytics.
This term encompasses all of the types of analysis discussed in this book.
It also typically implies the analysis of very large data sets.
By using quantitative methods to uncover the information in these data sets and then acting on this information, companies are able to gain a competitive advantage.<br>
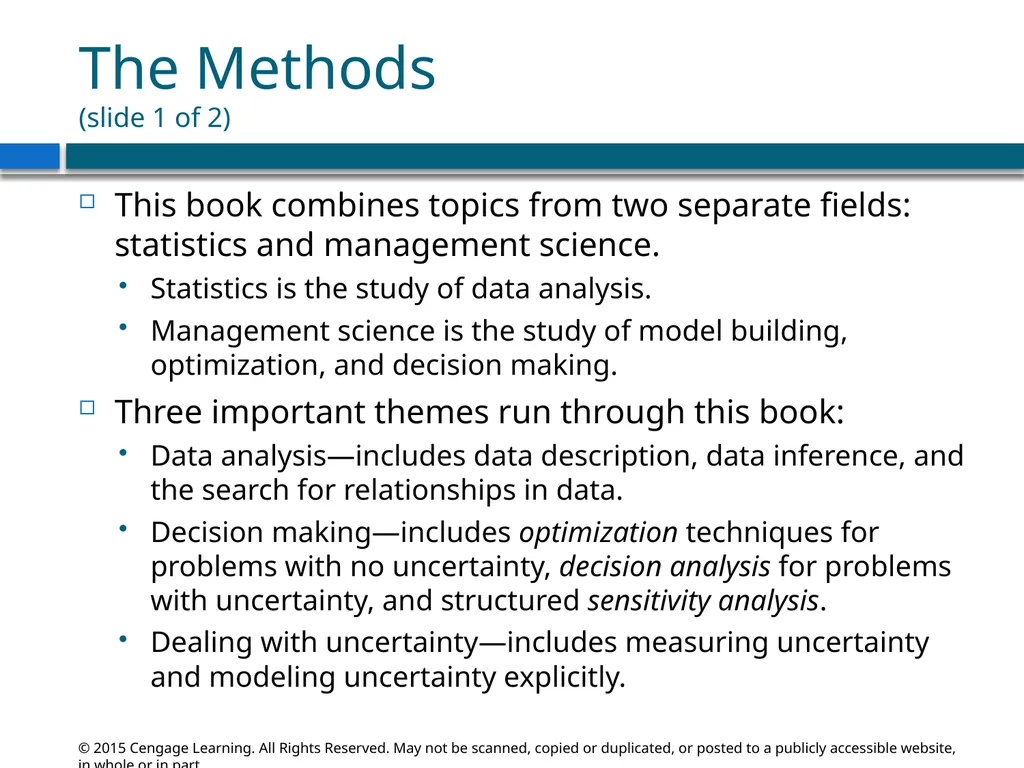
slide4. The Methods (slide 1 of 2) This book combines topics from two separate fields: statistics and management science.
Statistics is the study of data analysis.
Management science is the study of model building, optimization, and decision making.
Three important themes run through this book:
Data analysis—includes data description, data inference, and the search for relationships in data.
Decision making—includes optimization techniques for problems with no uncertainty, decision analysis for problems with uncertainty, and structured sensitivity analysis.
Dealing with uncertainty—includes measuring uncertainty and modeling uncertainty explicitly.<br>
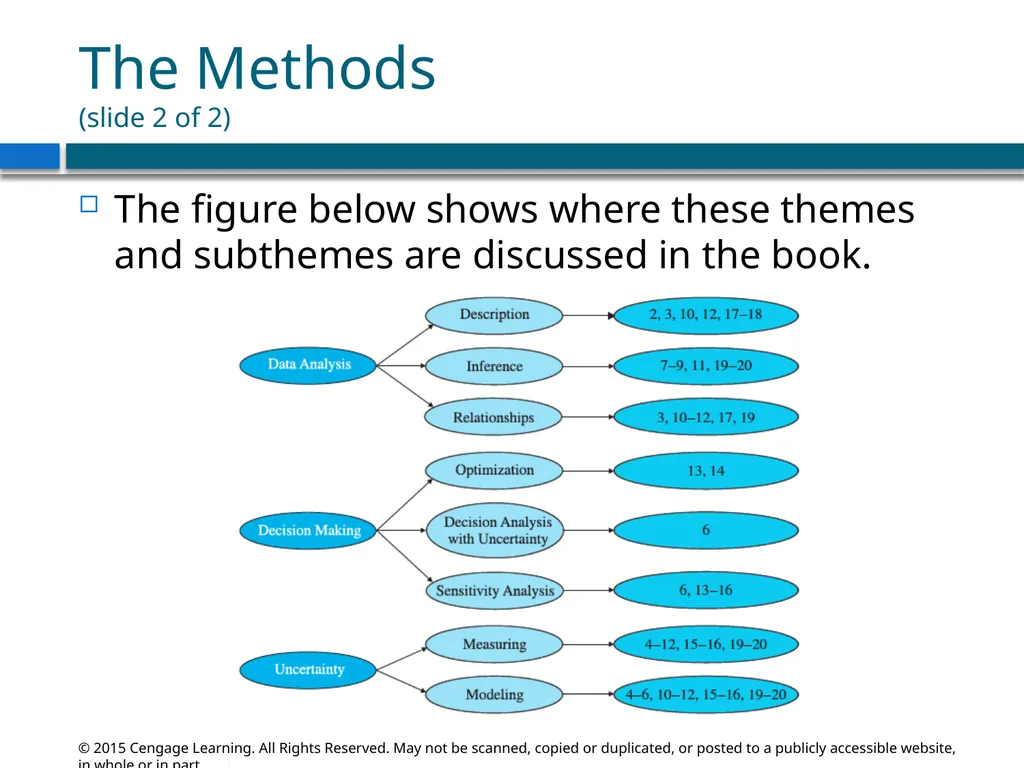
slide5. The Methods (slide 2 of 2) The figure below shows where these themes and subthemes are discussed in the book.<br>
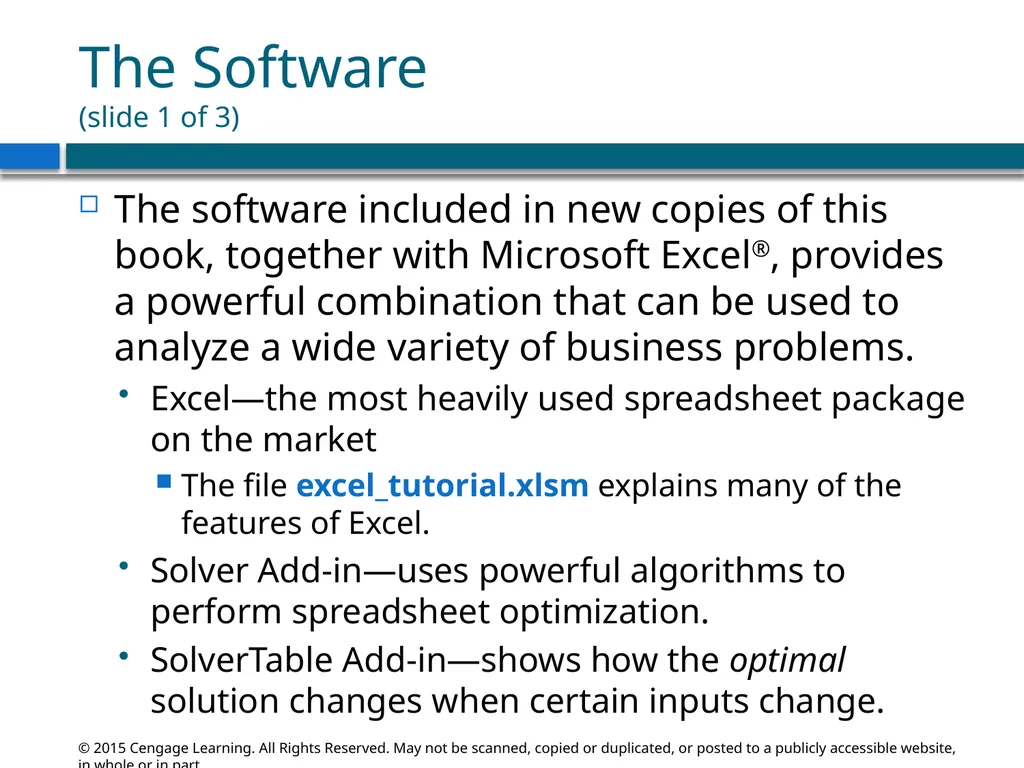
slide6. The Software (slide 1 of 3) The software included in new copies of this book, together with Microsoft Excel®, provides a powerful combination that can be used to analyze a wide variety of business problems.
Excel—the most heavily used spreadsheet package on the market
The file excel_tutorial.xlsm explains many of the features of Excel.
Solver Add-in—uses powerful algorithms to perform spreadsheet optimization.
SolverTable Add-in—shows how the optimal solution changes when certain inputs change.<br>
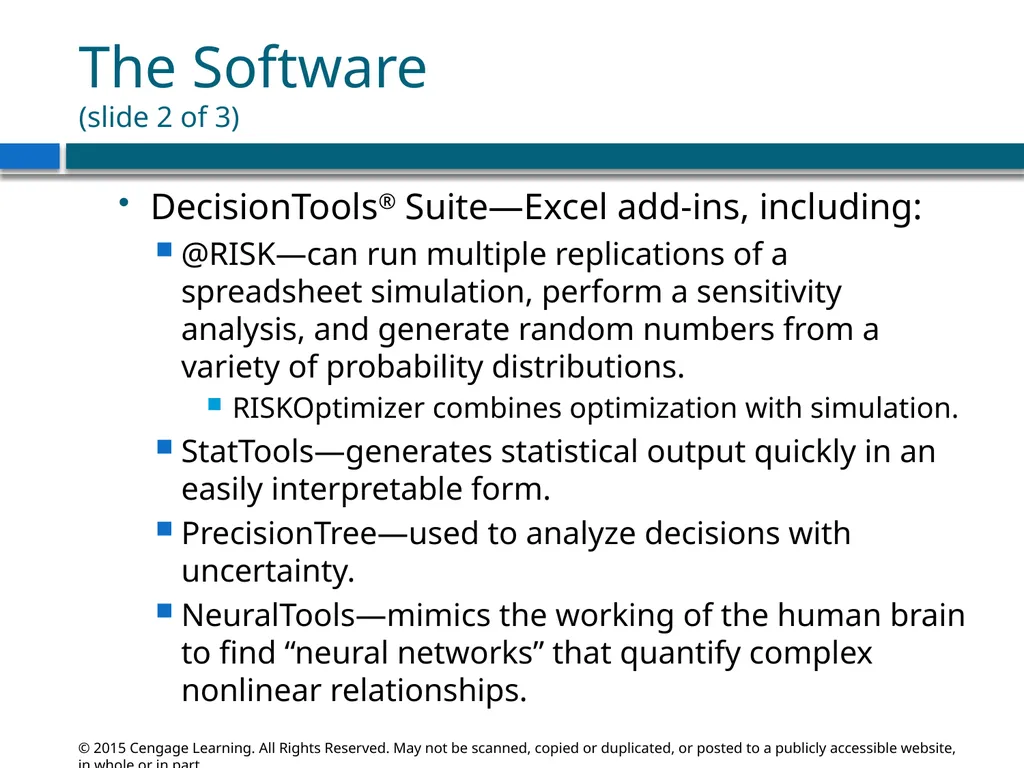
slide7. The Software (slide 2 of 3) DecisionTools® Suite—Excel add-ins, including:
@RISK—can run multiple replications of a spreadsheet simulation, perform a sensitivity analysis, and generate random numbers from a variety of probability distributions.
RISKOptimizer combines optimization with simulation.
StatTools—generates statistical output quickly in an easily interpretable form.
PrecisionTree—used to analyze decisions with uncertainty.
NeuralTools—mimics the working of the human brain to find “neural networks” that quantify complex nonlinear relationships.<br>
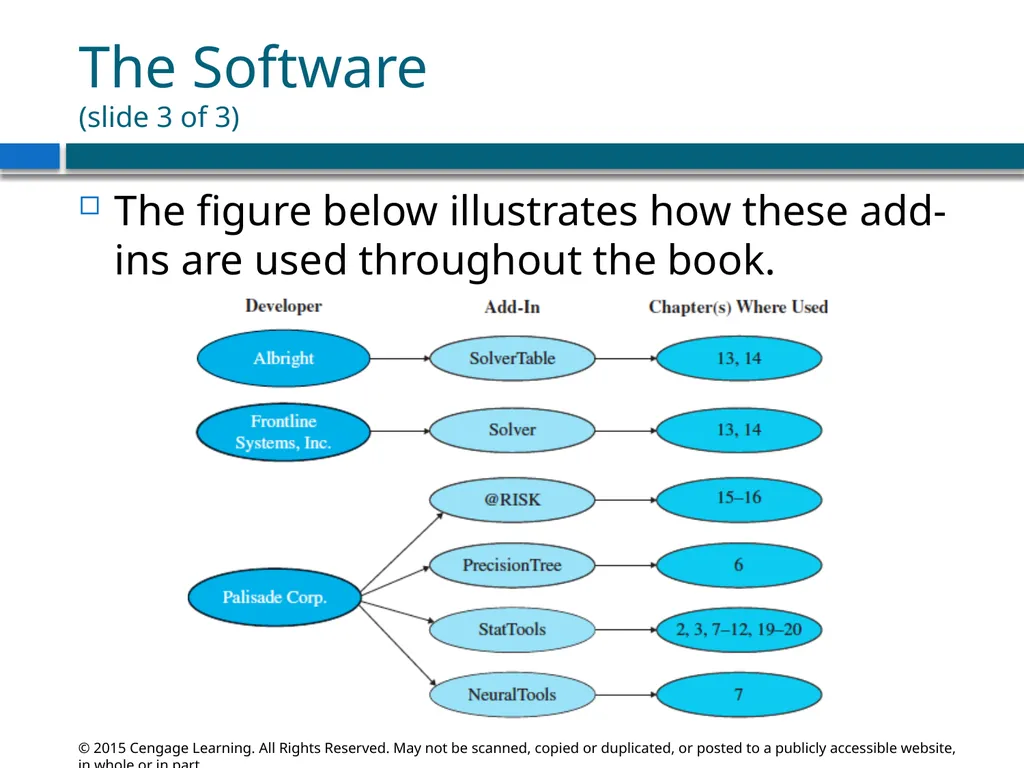
slide8. The Software (slide 3 of 3) The figure below illustrates how these add-ins are used throughout the book.<br>
slide9. Modeling and Models A model is an abstraction of a real problem that tries to capture the essence and key features of the problem.
There are different types of models, and each can be a valuable aid in solving a real problem:
Graphical models
Algebraic models
Spreadsheet models<br>
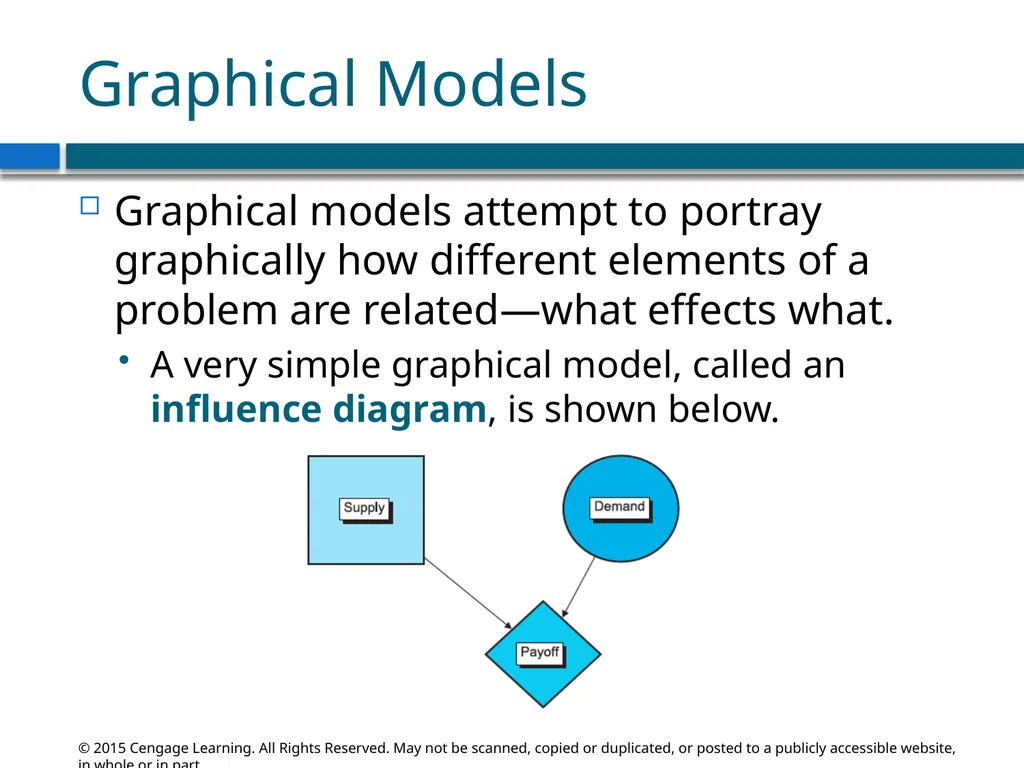
slide10. Graphical Models Graphical models attempt to portray graphically how different elements of a problem are related—what effects what.
A very simple graphical model, called an influence diagram, is shown below.<br>
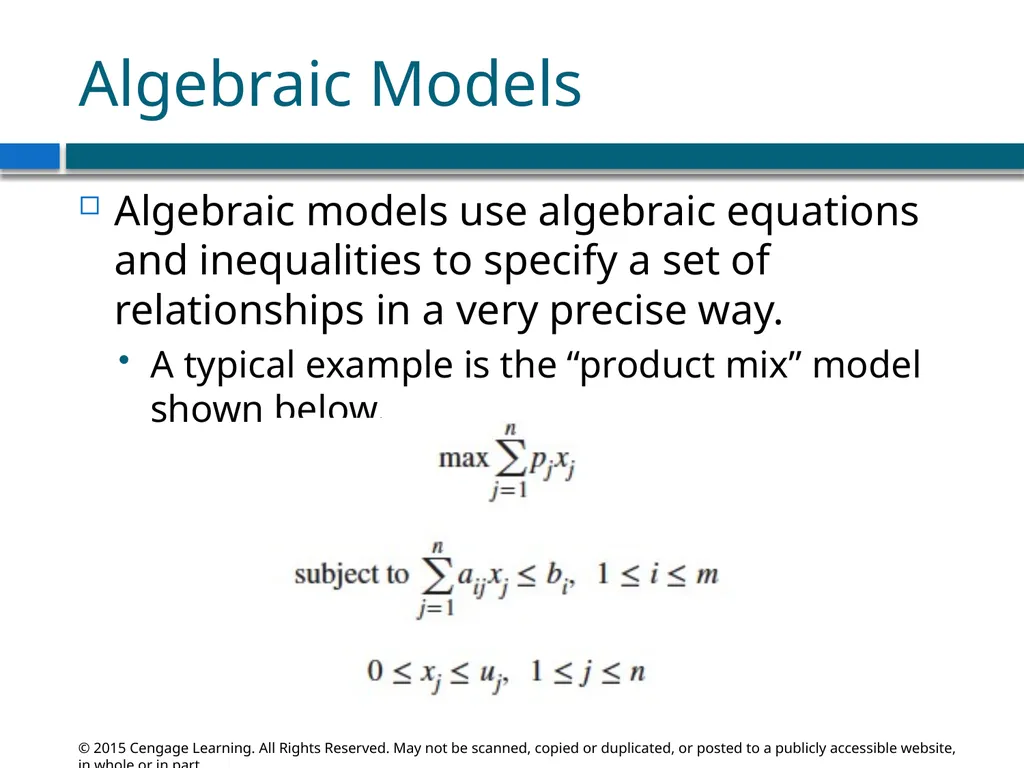
slide11. Algebraic Models Algebraic models use algebraic equations and inequalities to specify a set of relationships in a very precise way.
A typical example is the “product mix” model shown below.<br>
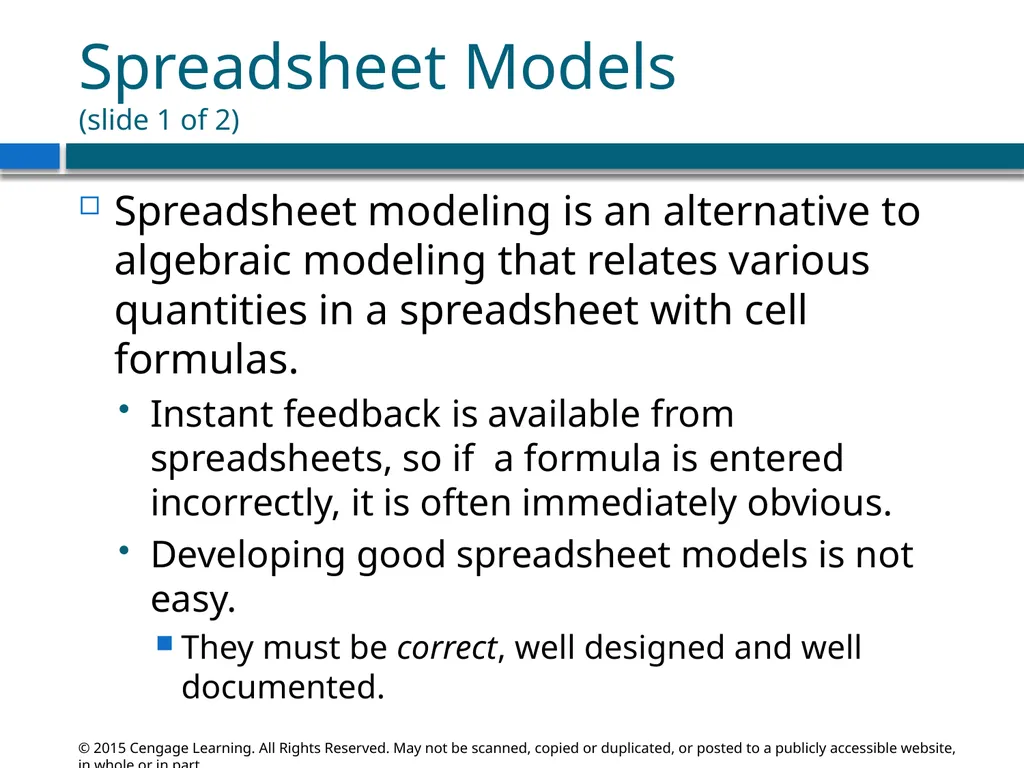
slide12. Spreadsheet Models (slide 1 of 2) Spreadsheet modeling is an alternative to algebraic modeling that relates various quantities in a spreadsheet with cell formulas.
Instant feedback is available from spreadsheets, so if a formula is entered incorrectly, it is often immediately obvious.
Developing good spreadsheet models is not easy.
They must be correct, well designed and well documented.<br>
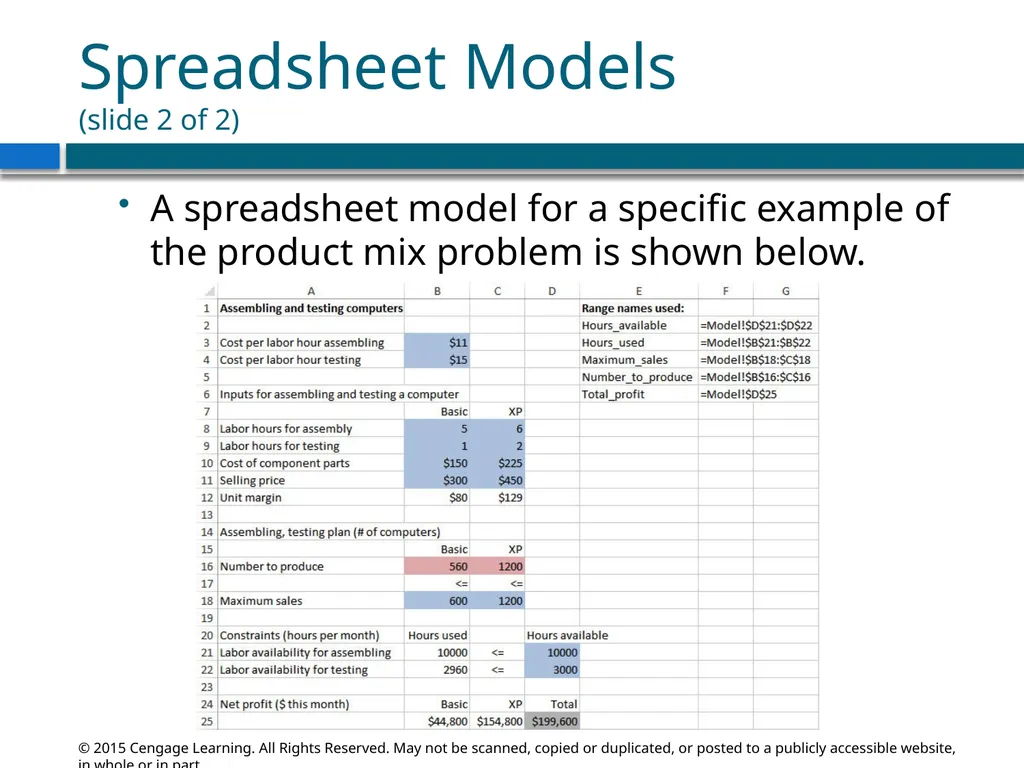
slide13. Spreadsheet Models (slide 2 of 2) A spreadsheet model for a specific example of the product mix problem is shown below.<br>
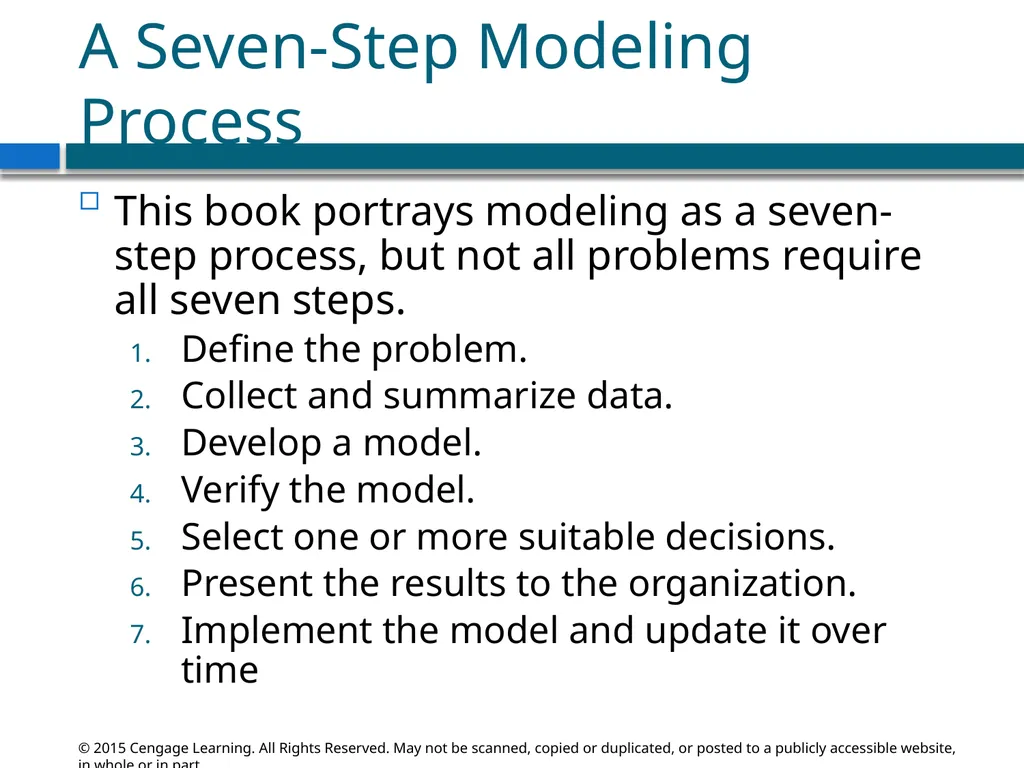
slide14. A Seven-Step Modeling Process This book portrays modeling as a seven-step process, but not all problems require all seven steps.
Define the problem.
Collect and summarize data.
Develop a model.
Verify the model.
Select one or more suitable decisions.
Present the results to the organization.
Implement the model and update it over time<br>
slide2. Introduction (slide 1 of 2) Living in the age of technology has implications for everyone entering the business world.
Technology makes it possible to collect huge amounts of data.
Technology has given more people the power and responsibility to analyze data and make decisions.
A large amount of data already exists and will only increase in the future.<br>
slide3. Introduction (slide 2 of 2) One of the hottest topics in today’s business world is business analytics.
This term encompasses all of the types of analysis discussed in this book.
It also typically implies the analysis of very large data sets.
By using quantitative methods to uncover the information in these data sets and then acting on this information, companies are able to gain a competitive advantage.<br>
slide4. The Methods (slide 1 of 2) This book combines topics from two separate fields: statistics and management science.
Statistics is the study of data analysis.
Management science is the study of model building, optimization, and decision making.
Three important themes run through this book:
Data analysis—includes data description, data inference, and the search for relationships in data.
Decision making—includes optimization techniques for problems with no uncertainty, decision analysis for problems with uncertainty, and structured sensitivity analysis.
Dealing with uncertainty—includes measuring uncertainty and modeling uncertainty explicitly.<br>
slide5. The Methods (slide 2 of 2) The figure below shows where these themes and subthemes are discussed in the book.<br>
slide6. The Software (slide 1 of 3) The software included in new copies of this book, together with Microsoft Excel®, provides a powerful combination that can be used to analyze a wide variety of business problems.
Excel—the most heavily used spreadsheet package on the market
The file excel_tutorial.xlsm explains many of the features of Excel.
Solver Add-in—uses powerful algorithms to perform spreadsheet optimization.
SolverTable Add-in—shows how the optimal solution changes when certain inputs change.<br>
slide7. The Software (slide 2 of 3) DecisionTools® Suite—Excel add-ins, including:
@RISK—can run multiple replications of a spreadsheet simulation, perform a sensitivity analysis, and generate random numbers from a variety of probability distributions.
RISKOptimizer combines optimization with simulation.
StatTools—generates statistical output quickly in an easily interpretable form.
PrecisionTree—used to analyze decisions with uncertainty.
NeuralTools—mimics the working of the human brain to find “neural networks” that quantify complex nonlinear relationships.<br>
slide8. The Software (slide 3 of 3) The figure below illustrates how these add-ins are used throughout the book.<br>
slide9. Modeling and Models A model is an abstraction of a real problem that tries to capture the essence and key features of the problem.
There are different types of models, and each can be a valuable aid in solving a real problem:
Graphical models
Algebraic models
Spreadsheet models<br>
slide10. Graphical Models Graphical models attempt to portray graphically how different elements of a problem are related—what effects what.
A very simple graphical model, called an influence diagram, is shown below.<br>
slide11. Algebraic Models Algebraic models use algebraic equations and inequalities to specify a set of relationships in a very precise way.
A typical example is the “product mix” model shown below.<br>
slide12. Spreadsheet Models (slide 1 of 2) Spreadsheet modeling is an alternative to algebraic modeling that relates various quantities in a spreadsheet with cell formulas.
Instant feedback is available from spreadsheets, so if a formula is entered incorrectly, it is often immediately obvious.
Developing good spreadsheet models is not easy.
They must be correct, well designed and well documented.<br>
slide13. Spreadsheet Models (slide 2 of 2) A spreadsheet model for a specific example of the product mix problem is shown below.<br>
slide14. A Seven-Step Modeling Process This book portrays modeling as a seven-step process, but not all problems require all seven steps.
Define the problem.
Collect and summarize data.
Develop a model.
Verify the model.
Select one or more suitable decisions.
Present the results to the organization.
Implement the model and update it over time<br>