
Introduction to Multiple Imputation Sixia Chen,
EM
Published · 36 slides · 0 views
1 / 1



Description
Introduction to Multiple Imputation Sixia Chen, PhD OSCTR BERD Novel Methodology Unit Workshop 10242024 Acknowledgement This workshop was supported by the Oklahoma Shared Clinical and Translational Resources (U54GM104938) with an
Related Topics
Share
Embed code
Download this presentation From Below
"Introduction to Multiple Imputation Sixia Chen," is the property of its rightful owner. Permission is granted to download and print the materials on this website for personal, non-commercial use only, and to display it on your personal computer provided you do not modify the materials and that you retain all copyright notices contained in the materials. By downloading content from our website, you accept the terms of this agreement.
Presentation Transcript
01
Introduction to Multiple Imputation Sixia Chen, PhD
OSCTR BERD Novel Methodology Unit Workshop
10/24/2024<br>
OSCTR BERD Novel Methodology Unit Workshop
10/24/2024<br>
02
Acknowledgement This workshop was supported by the Oklahoma Shared Clinical and Translational Resources (U54GM104938) with an Institutional Development Award (IDeA) from NIGMS. The content is solely the responsibility of the authors and does not necessarily represent the official views of the National Institutes of Health<br>
03
Please keep presentation slides, data files, and computational codes confidential and don’t share with others
Please use the data files only for the purpose of this short course
We will only use SAS for real data applications and in-class exercise<br>
Please use the data files only for the purpose of this short course
We will only use SAS for real data applications and in-class exercise<br>
04
Course Objectives Obtain basic knowledge of missing data and multiple imputation
Implement multiple imputation method by using SAS
Apply multiple imputation method in practice<br>
Implement multiple imputation method by using SAS
Apply multiple imputation method in practice<br>
05
Outline Introduction to missing data analysis
Multiple imputation method
Computational tools
Real data application
Discussion<br>
Multiple imputation method
Computational tools
Real data application
Discussion<br>
06
1. Introduction to missing data analysis<br>
07
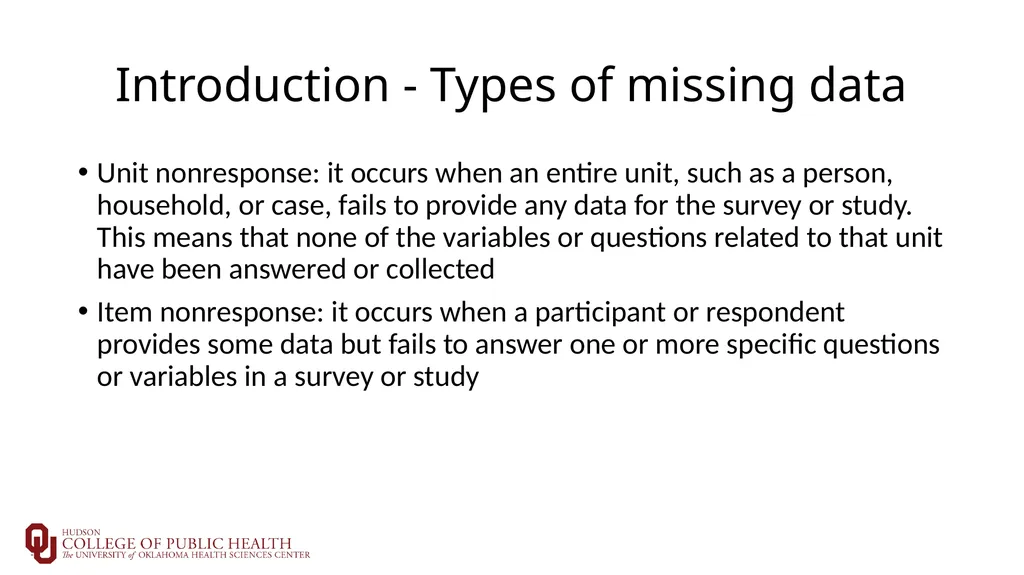
Introduction - Types of missing data Unit nonresponse: it occurs when an entire unit, such as a person, household, or case, fails to provide any data for the survey or study. This means that none of the variables or questions related to that unit have been answered or collected
Item nonresponse: it occurs when a participant or respondent provides some data but fails to answer one or more specific questions or variables in a survey or study<br>
Item nonresponse: it occurs when a participant or respondent provides some data but fails to answer one or more specific questions or variables in a survey or study<br>
08
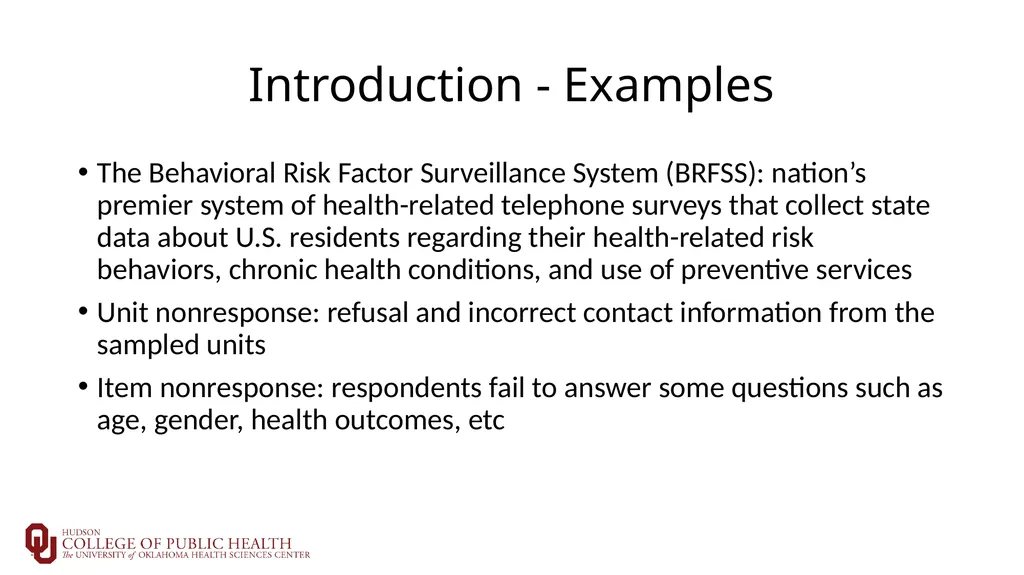
Introduction - Examples The Behavioral Risk Factor Surveillance System (BRFSS): nation’s premier system of health-related telephone surveys that collect state data about U.S. residents regarding their health-related risk behaviors, chronic health conditions, and use of preventive services
Unit nonresponse: refusal and incorrect contact information from the sampled units
Item nonresponse: respondents fail to answer some questions such as age, gender, health outcomes, etc<br>
Unit nonresponse: refusal and incorrect contact information from the sampled units
Item nonresponse: respondents fail to answer some questions such as age, gender, health outcomes, etc<br>
09
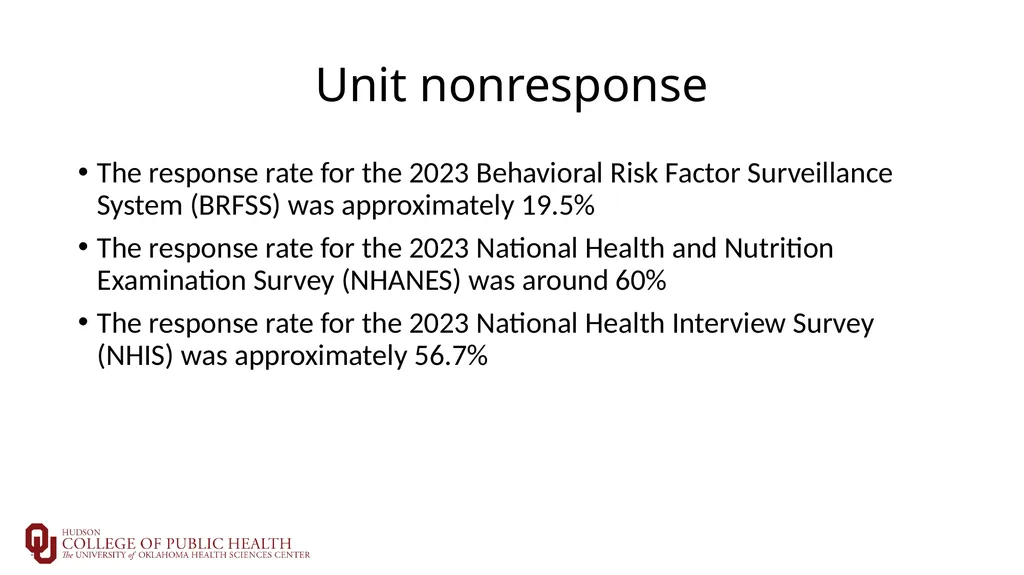
Unit nonresponse The response rate for the 2023 Behavioral Risk Factor Surveillance System (BRFSS) was approximately 19.5%
The response rate for the 2023 National Health and Nutrition Examination Survey (NHANES) was around 60%
The response rate for the 2023 National Health Interview Survey (NHIS) was approximately 56.7%<br>
The response rate for the 2023 National Health and Nutrition Examination Survey (NHANES) was around 60%
The response rate for the 2023 National Health Interview Survey (NHIS) was approximately 56.7%<br>
10
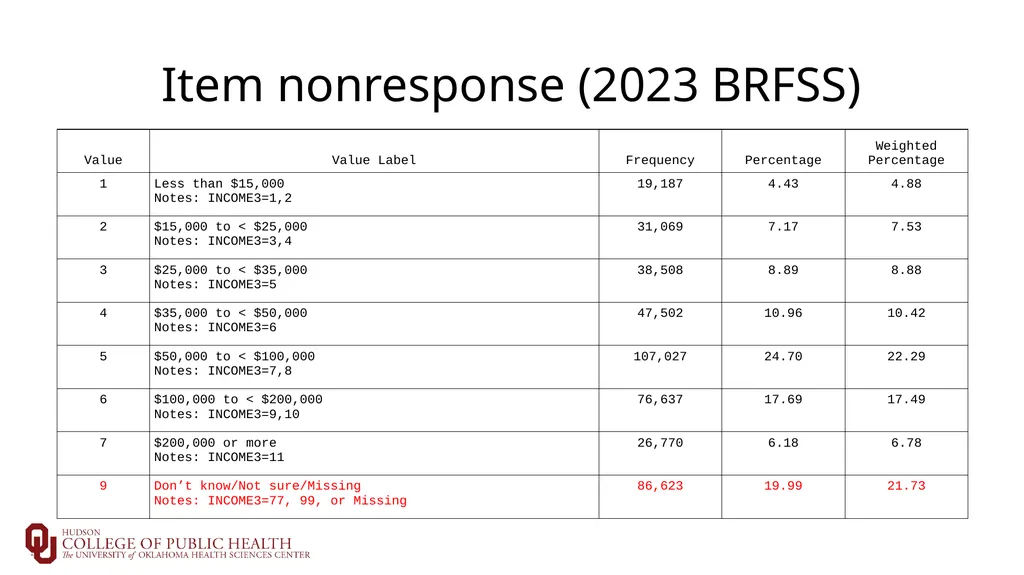
Item nonresponse (2023 BRFSS)<br>
11
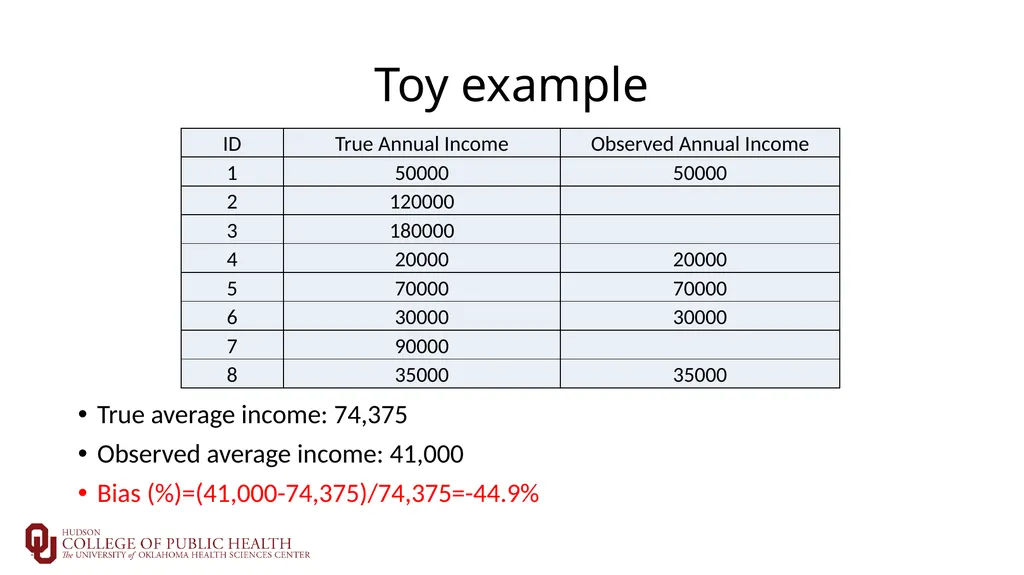
Toy example True average income: 74,375
Observed average income: 41,000
Bias (%)=(41,000-74,375)/74,375=-44.9%<br>
Observed average income: 41,000
Bias (%)=(41,000-74,375)/74,375=-44.9%<br>
12
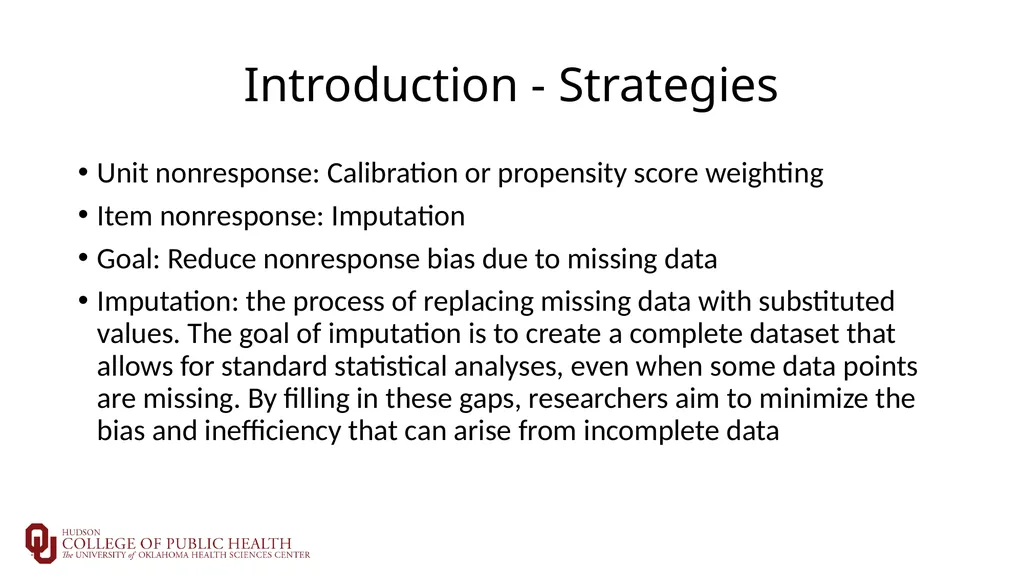
Introduction - Strategies Unit nonresponse: Calibration or propensity score weighting
Item nonresponse: Imputation
Goal: Reduce nonresponse bias due to missing data
Imputation: the process of replacing missing data with substituted values. The goal of imputation is to create a complete dataset that allows for standard statistical analyses, even when some data points are missing. By filling in these gaps, researchers aim to minimize the bias and inefficiency that can arise from incomplete data<br>
Item nonresponse: Imputation
Goal: Reduce nonresponse bias due to missing data
Imputation: the process of replacing missing data with substituted values. The goal of imputation is to create a complete dataset that allows for standard statistical analyses, even when some data points are missing. By filling in these gaps, researchers aim to minimize the bias and inefficiency that can arise from incomplete data<br>
13
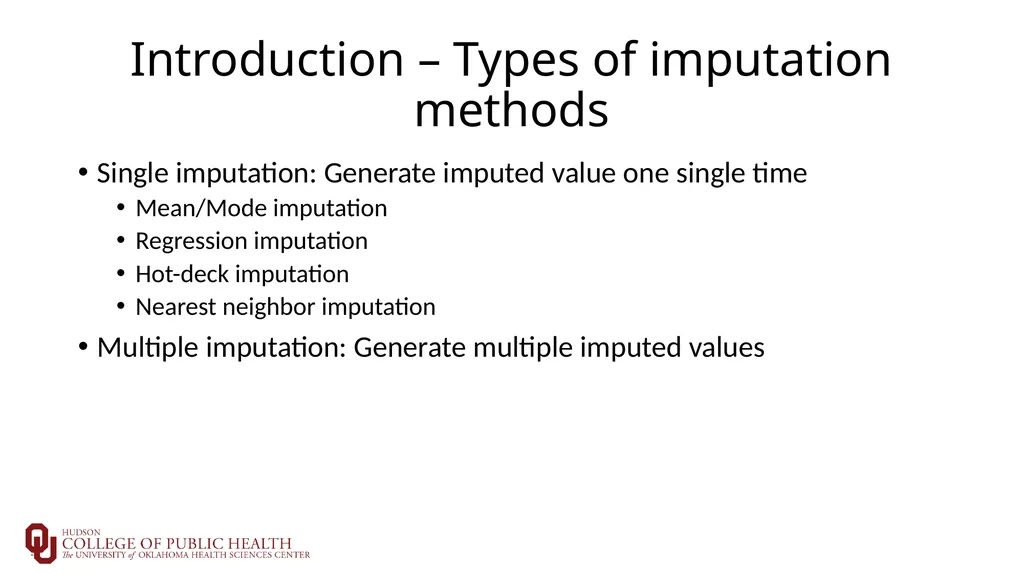
Introduction – Types of imputation methods Single imputation: Generate imputed value one single time
Mean/Mode imputation
Regression imputation
Hot-deck imputation
Nearest neighbor imputation
Multiple imputation: Generate multiple imputed values<br>
Mean/Mode imputation
Regression imputation
Hot-deck imputation
Nearest neighbor imputation
Multiple imputation: Generate multiple imputed values<br>
14
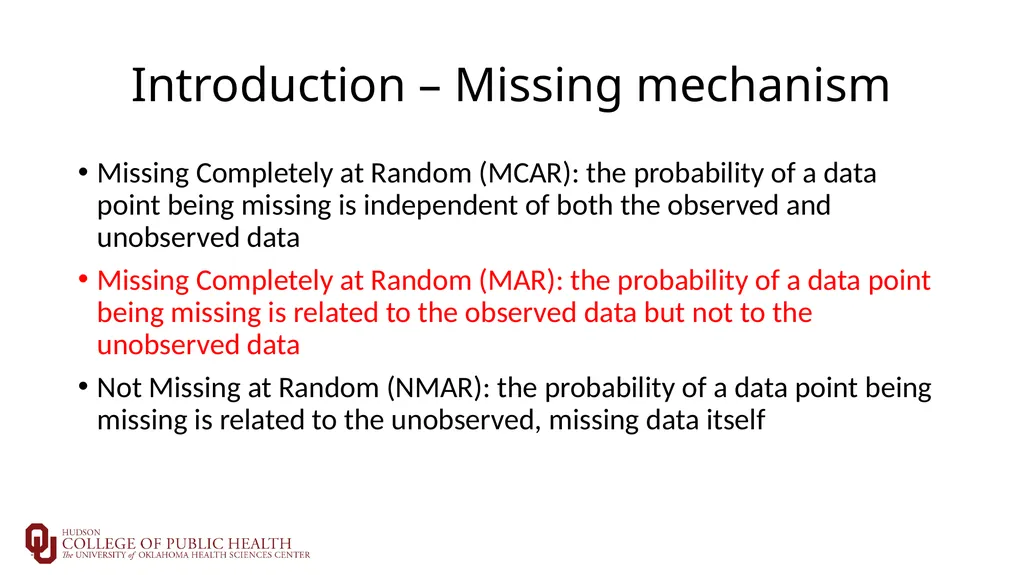
Introduction – Missing mechanism Missing Completely at Random (MCAR): the probability of a data point being missing is independent of both the observed and unobserved data
Missing Completely at Random (MAR): the probability of a data point being missing is related to the observed data but not to the unobserved data
Not Missing at Random (NMAR): the probability of a data point being missing is related to the unobserved, missing data itself<br>
Missing Completely at Random (MAR): the probability of a data point being missing is related to the observed data but not to the unobserved data
Not Missing at Random (NMAR): the probability of a data point being missing is related to the unobserved, missing data itself<br>
15
2. Multiple imputation method<br>
16
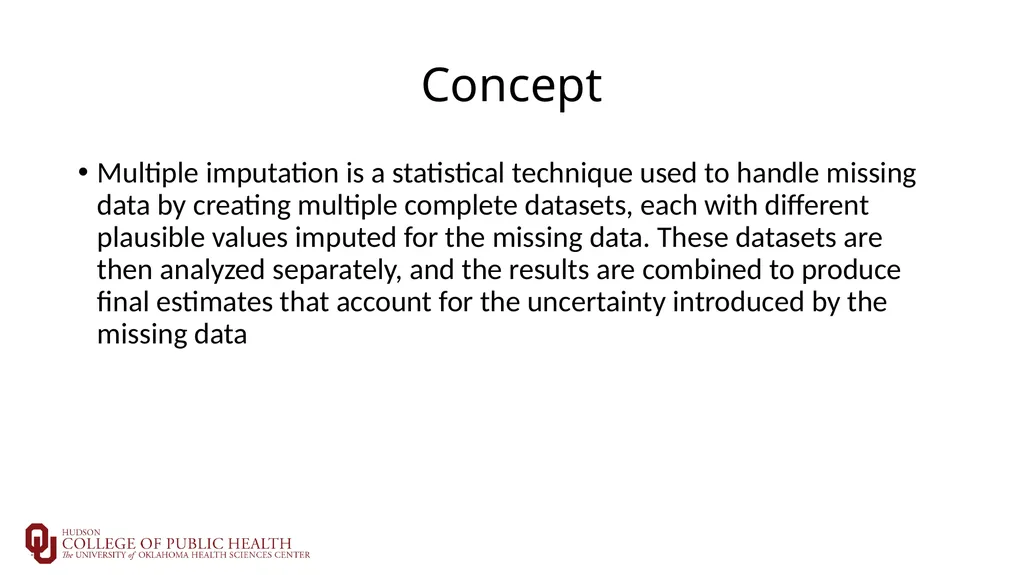
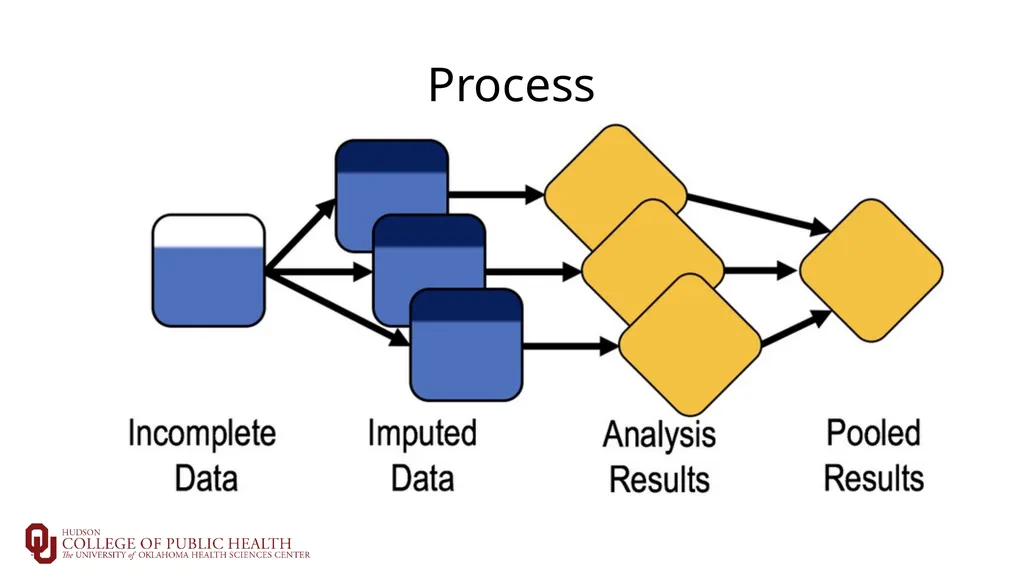
Concept Multiple imputation is a statistical technique used to handle missing data by creating multiple complete datasets, each with different plausible values imputed for the missing data. These datasets are then analyzed separately, and the results are combined to produce final estimates that account for the uncertainty introduced by the missing data<br>
17
Process<br>
18
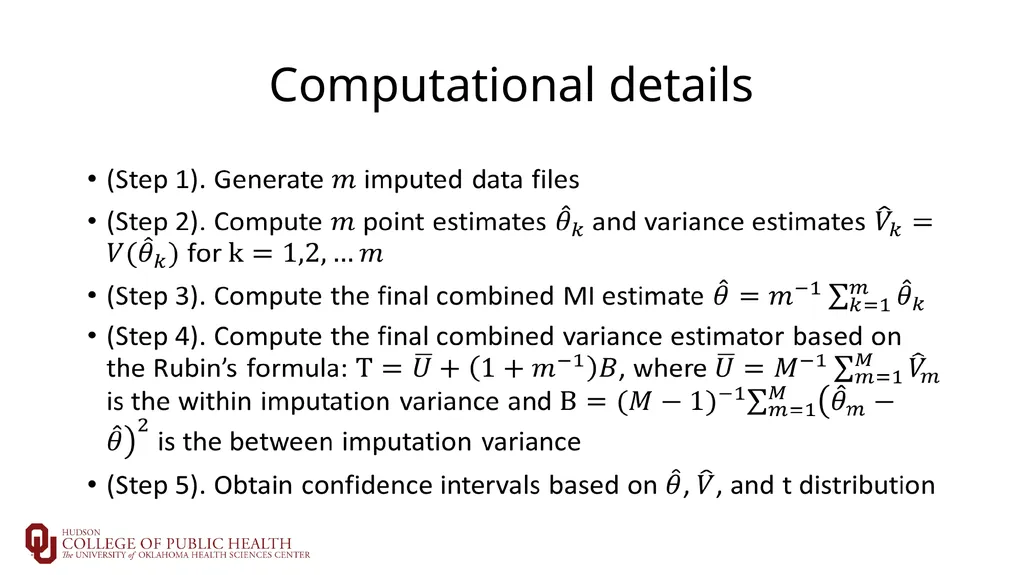
Computational details<br>
19
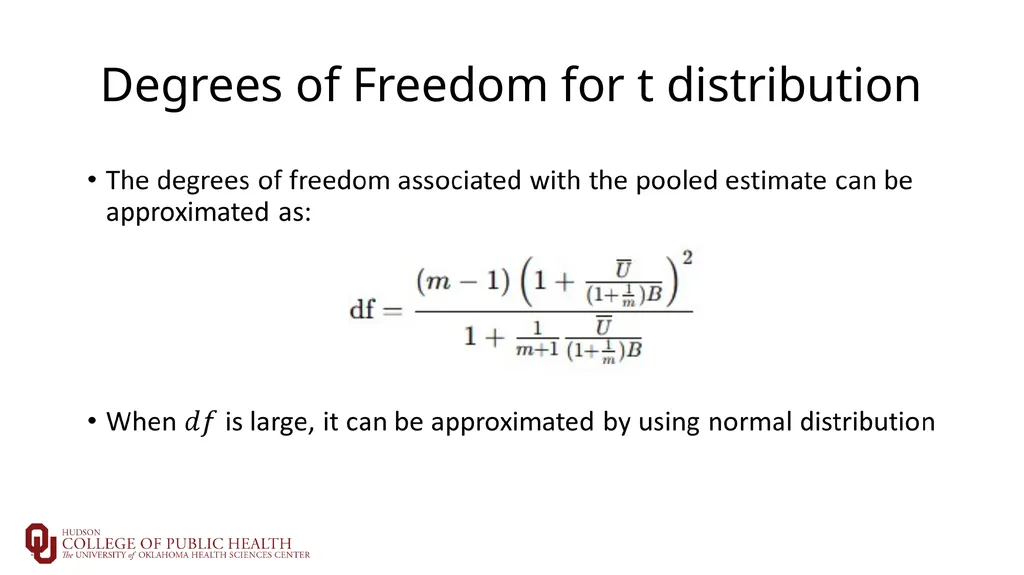
Degrees of Freedom for t distribution<br>
20
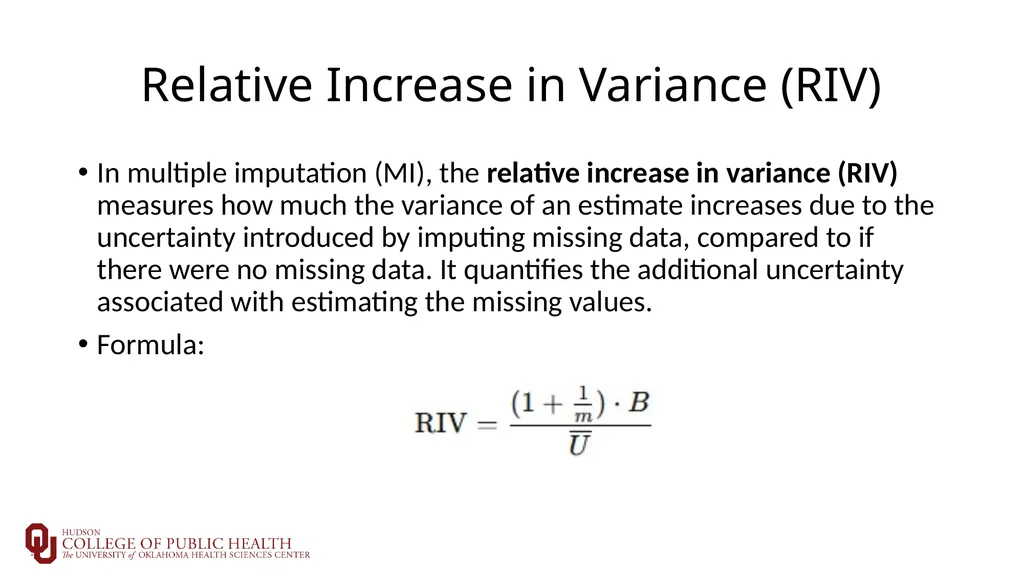
Relative Increase in Variance (RIV) In multiple imputation (MI), the relative increase in variance (RIV) measures how much the variance of an estimate increases due to the uncertainty introduced by imputing missing data, compared to if there were no missing data. It quantifies the additional uncertainty associated with estimating the missing values.
Formula:<br>
Formula:<br>
21
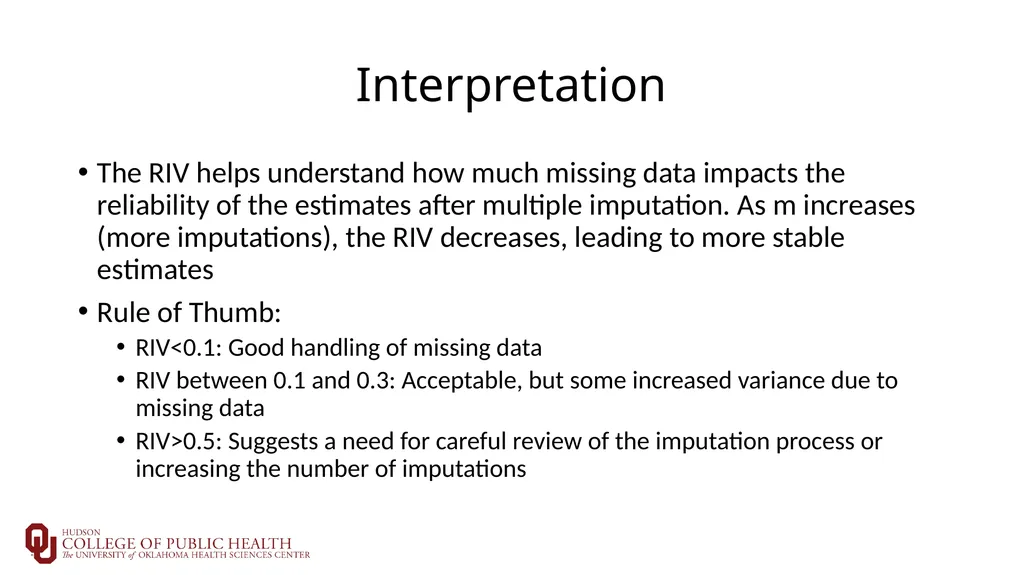
Interpretation The RIV helps understand how much missing data impacts the reliability of the estimates after multiple imputation. As m increases (more imputations), the RIV decreases, leading to more stable estimates
Rule of Thumb:
RIV<0.1: Good handling of missing data
RIV between 0.1 and 0.3: Acceptable, but some increased variance due to missing data
RIV>0.5: Suggests a need for careful review of the imputation process or increasing the number of imputations<br>
Rule of Thumb:
RIV<0.1: Good handling of missing data
RIV between 0.1 and 0.3: Acceptable, but some increased variance due to missing data
RIV>0.5: Suggests a need for careful review of the imputation process or increasing the number of imputations<br>
22
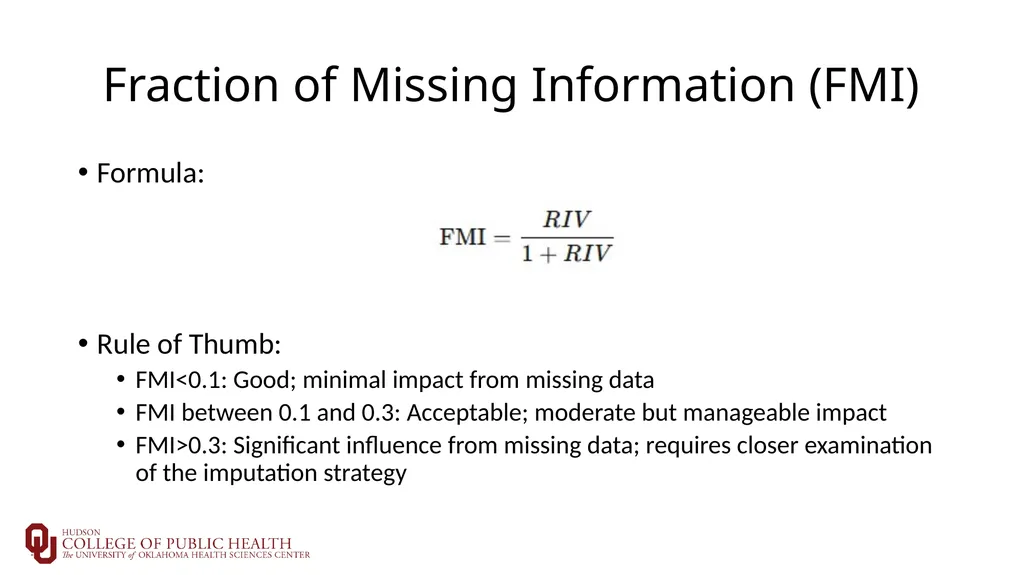
Fraction of Missing Information (FMI) Formula:
Rule of Thumb:
FMI<0.1: Good; minimal impact from missing data
FMI between 0.1 and 0.3: Acceptable; moderate but manageable impact
FMI>0.3: Significant influence from missing data; requires closer examination of the imputation strategy<br>
Rule of Thumb:
FMI<0.1: Good; minimal impact from missing data
FMI between 0.1 and 0.3: Acceptable; moderate but manageable impact
FMI>0.3: Significant influence from missing data; requires closer examination of the imputation strategy<br>
23
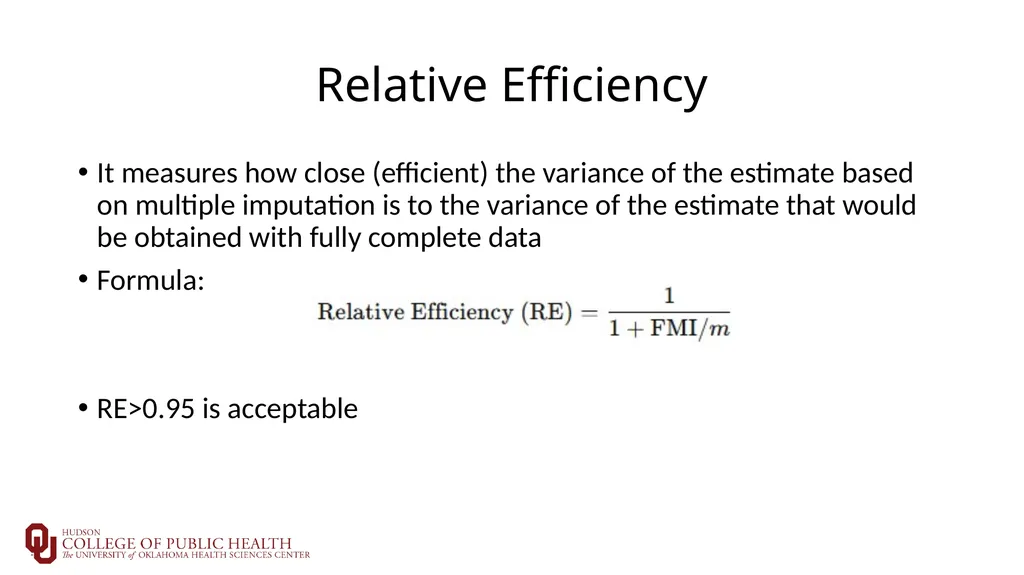
Relative Efficiency It measures how close (efficient) the variance of the estimate based on multiple imputation is to the variance of the estimate that would be obtained with fully complete data
Formula:
RE>0.95 is acceptable<br>
Formula:
RE>0.95 is acceptable<br>
24
History Concept Introduction (1978): Rubin introduced the concept of MI in his 1978 paper, where he outlined the theoretical framework
Formalization and Implementation (1980s-1990s): Rubin and others formalized the methodology, developed algorithms, and implemented MI in various statistical software packages. Rubin’s 1987 book, Multiple Imputation for Nonresponse in Surveys, is considered a seminal work in the field, providing a comprehensive treatment of the theory and application of MI
Wider Adoption (1990s-2000s): As computational power increased and software tools improved, MI became more widely adopted in various fields, including social sciences, epidemiology, and economics<br>
Formalization and Implementation (1980s-1990s): Rubin and others formalized the methodology, developed algorithms, and implemented MI in various statistical software packages. Rubin’s 1987 book, Multiple Imputation for Nonresponse in Surveys, is considered a seminal work in the field, providing a comprehensive treatment of the theory and application of MI
Wider Adoption (1990s-2000s): As computational power increased and software tools improved, MI became more widely adopted in various fields, including social sciences, epidemiology, and economics<br>
25
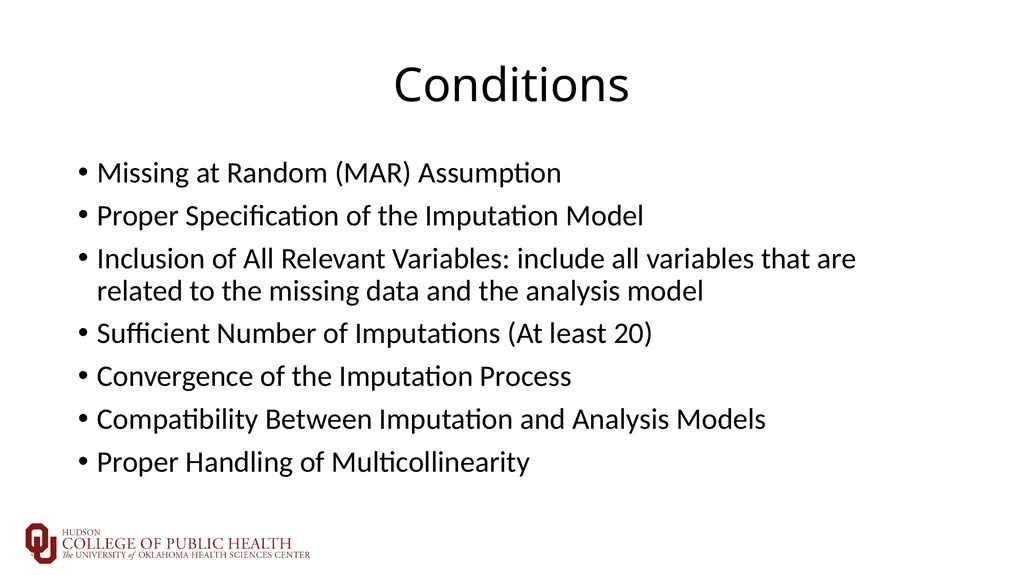
Conditions Missing at Random (MAR) Assumption
Proper Specification of the Imputation Model
Inclusion of All Relevant Variables: include all variables that are related to the missing data and the analysis model
Sufficient Number of Imputations (At least 20)
Convergence of the Imputation Process
Compatibility Between Imputation and Analysis Models
Proper Handling of Multicollinearity<br>
Proper Specification of the Imputation Model
Inclusion of All Relevant Variables: include all variables that are related to the missing data and the analysis model
Sufficient Number of Imputations (At least 20)
Convergence of the Imputation Process
Compatibility Between Imputation and Analysis Models
Proper Handling of Multicollinearity<br>
26
Advantages of MI Reduces bias
Reflects uncertainty due to imputation
Preserves relationships among variables
Flexible and generalizable
Compatible with standard analysis methods
Widely available in software<br>
Reflects uncertainty due to imputation
Preserves relationships among variables
Flexible and generalizable
Compatible with standard analysis methods
Widely available in software<br>
27
Disadvantages of MI Computationally intensive
Complex implementation
Assumes MAR
Risk of model mis-specification
Potential for increased variability
Interpretation challenges
Dependence on proper software use<br>
Complex implementation
Assumes MAR
Risk of model mis-specification
Potential for increased variability
Interpretation challenges
Dependence on proper software use<br>
28
3. Computational tools<br>
29
Computational tools of MI R: Flexible and comprehensive, with packages like mice, Amelia, and missForest.
SAS: Powerful for MI with PROC MI and PROC MIANALYZE.
SPSS: User-friendly with a GUI for MI through its MVA module.
Stata: Extensive support for MI with the mi command.
Mplus: Excellent for structural equation modeling with MI.
Python: Libraries like Fancyimpute and Statsmodels offer MI functionality.
Standalone: Tools like Amelia and others by Schafer for specific MI needs.<br>
SAS: Powerful for MI with PROC MI and PROC MIANALYZE.
SPSS: User-friendly with a GUI for MI through its MVA module.
Stata: Extensive support for MI with the mi command.
Mplus: Excellent for structural equation modeling with MI.
Python: Libraries like Fancyimpute and Statsmodels offer MI functionality.
Standalone: Tools like Amelia and others by Schafer for specific MI needs.<br>
30
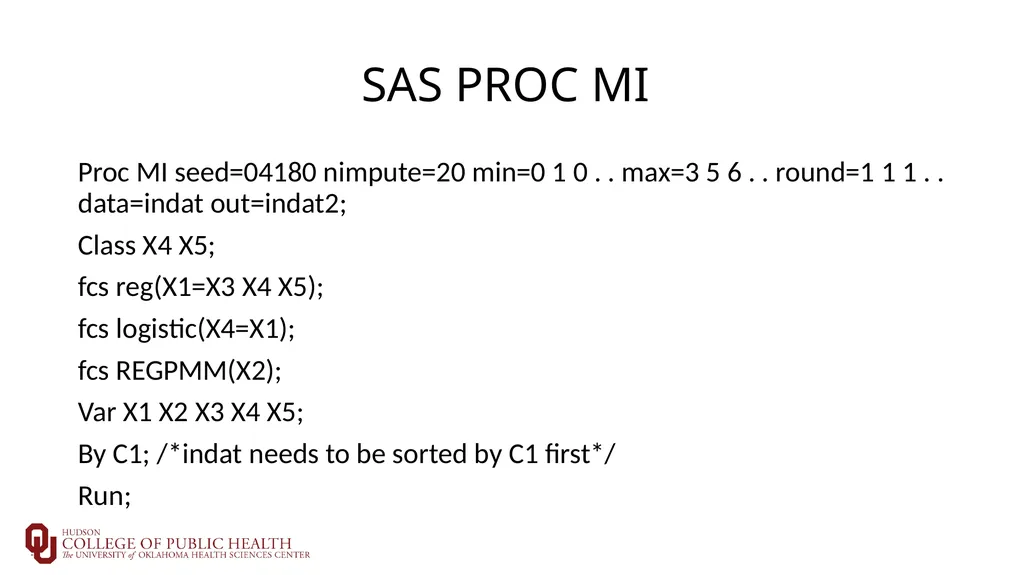
SAS PROC MI Proc MI seed=04180 nimpute=20 min=0 1 0 . . max=3 5 6 . . round=1 1 1 . . data=indat out=indat2;
Class X4 X5;
fcs reg(X1=X3 X4 X5);
fcs logistic(X4=X1);
fcs REGPMM(X2);
Var X1 X2 X3 X4 X5;
By C1; /*indat needs to be sorted by C1 first*/
Run;<br>
Class X4 X5;
fcs reg(X1=X3 X4 X5);
fcs logistic(X4=X1);
fcs REGPMM(X2);
Var X1 X2 X3 X4 X5;
By C1; /*indat needs to be sorted by C1 first*/
Run;<br>
31
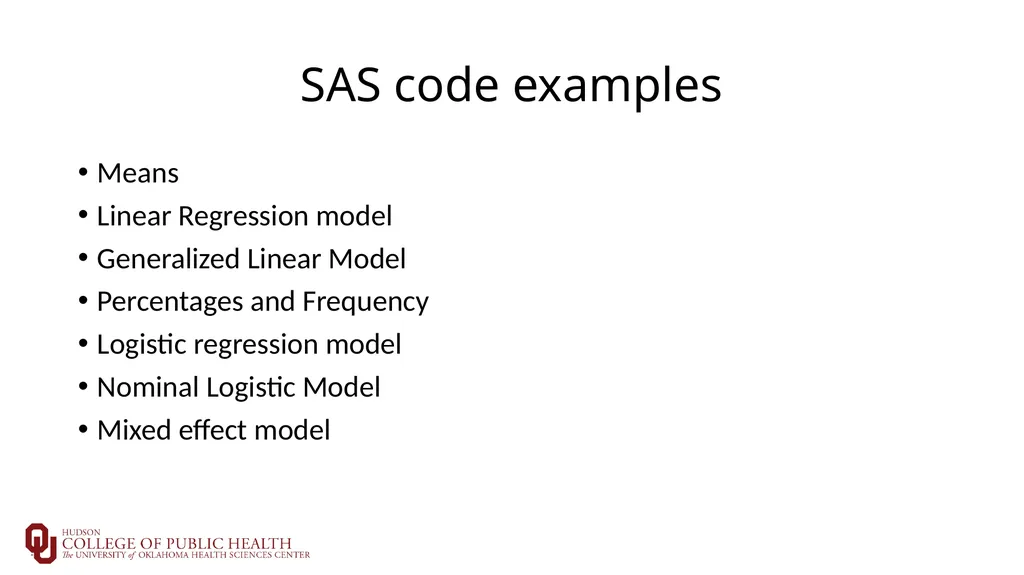
SAS code examples Means
Linear Regression model
Generalized Linear Model
Percentages and Frequency
Logistic regression model
Nominal Logistic Model
Mixed effect model<br>
Linear Regression model
Generalized Linear Model
Percentages and Frequency
Logistic regression model
Nominal Logistic Model
Mixed effect model<br>
32
4. Real data application<br>
33
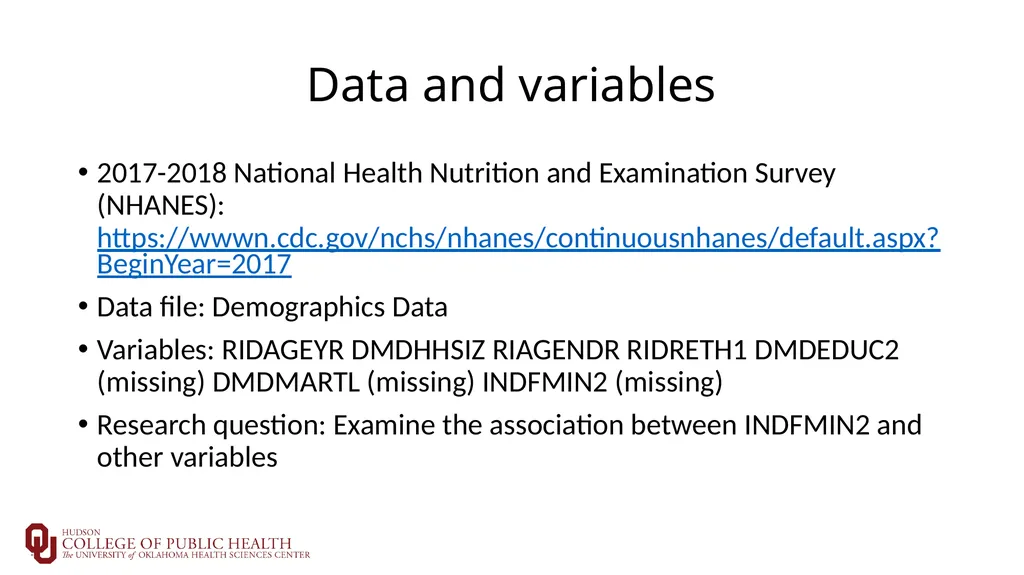
Data and variables 2017-2018 National Health Nutrition and Examination Survey (NHANES): https://wwwn.cdc.gov/nchs/nhanes/continuousnhanes/default.aspx?BeginYear=2017
Data file: Demographics Data
Variables: RIDAGEYR DMDHHSIZ RIAGENDR RIDRETH1 DMDEDUC2 (missing) DMDMARTL (missing) INDFMIN2 (missing)
Research question: Examine the association between INDFMIN2 and other variables<br>
Data file: Demographics Data
Variables: RIDAGEYR DMDHHSIZ RIAGENDR RIDRETH1 DMDEDUC2 (missing) DMDMARTL (missing) INDFMIN2 (missing)
Research question: Examine the association between INDFMIN2 and other variables<br>
34
5. Discussion<br>
35
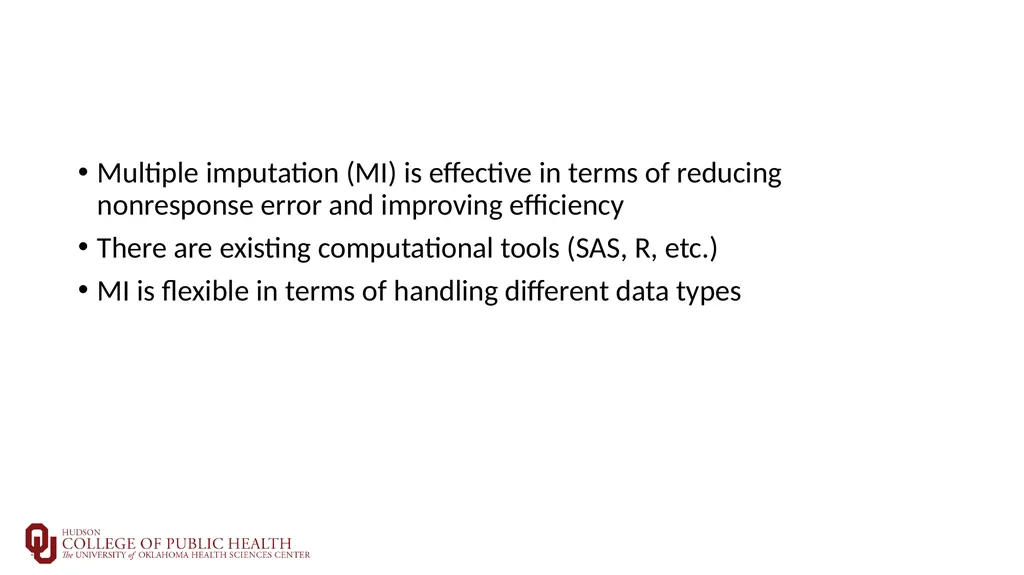
Multiple imputation (MI) is effective in terms of reducing nonresponse error and improving efficiency
There are existing computational tools (SAS, R, etc.)
MI is flexible in terms of handling different data types<br>
There are existing computational tools (SAS, R, etc.)
MI is flexible in terms of handling different data types<br>
36
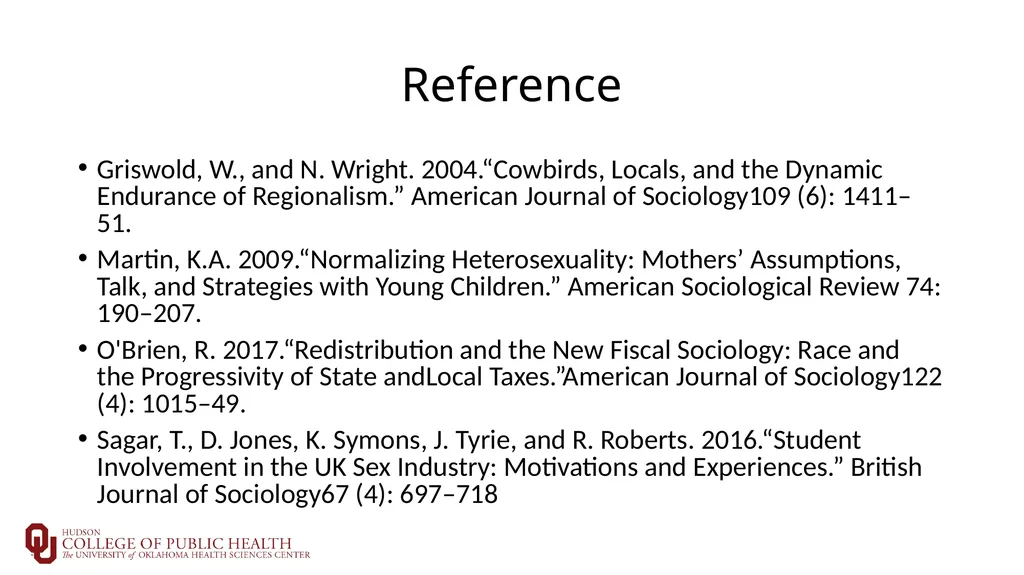
Reference Griswold, W., and N. Wright. 2004.“Cowbirds, Locals, and the Dynamic Endurance of Regionalism.” American Journal of Sociology109 (6): 1411–51.
Martin, K.A. 2009.“Normalizing Heterosexuality: Mothers’ Assumptions, Talk, and Strategies with Young Children.” American Sociological Review 74: 190–207.
O'Brien, R. 2017.“Redistribution and the New Fiscal Sociology: Race and the Progressivity of State andLocal Taxes.”American Journal of Sociology122 (4): 1015–49.
Sagar, T., D. Jones, K. Symons, J. Tyrie, and R. Roberts. 2016.“Student Involvement in the UK Sex Industry: Motivations and Experiences.” British Journal of Sociology67 (4): 697–718<br>
Martin, K.A. 2009.“Normalizing Heterosexuality: Mothers’ Assumptions, Talk, and Strategies with Young Children.” American Sociological Review 74: 190–207.
O'Brien, R. 2017.“Redistribution and the New Fiscal Sociology: Race and the Progressivity of State andLocal Taxes.”American Journal of Sociology122 (4): 1015–49.
Sagar, T., D. Jones, K. Symons, J. Tyrie, and R. Roberts. 2016.“Student Involvement in the UK Sex Industry: Motivations and Experiences.” British Journal of Sociology67 (4): 697–718<br>