
K-Nearest Neighbor Applied Machine Learning Derek
TF
Published · 43 slides · 0 views
1 / 1
Description
K-Nearest Neighbor Applied Machine Learning Derek Hoiem Dall-E What breed is this? (a) Siberian Husky (c) Alaskan Malamut (b) Australian Cattle Dog (d) Bernese Mountain Dog How did you do it? (a) Siberian Husky (c) Alaskan Malamut (b)
Related Topics
Share
Embed code
Download this presentation From Below
"K-Nearest Neighbor Applied Machine Learning Derek" is the property of its rightful owner. Permission is granted to download and print the materials on this website for personal, non-commercial use only, and to display it on your personal computer provided you do not modify the materials and that you retain all copyright notices contained in the materials. By downloading content from our website, you accept the terms of this agreement.
Presentation Transcript
01
K-Nearest Neighbor Applied Machine Learning
Derek Hoiem Dall-E<br>
02
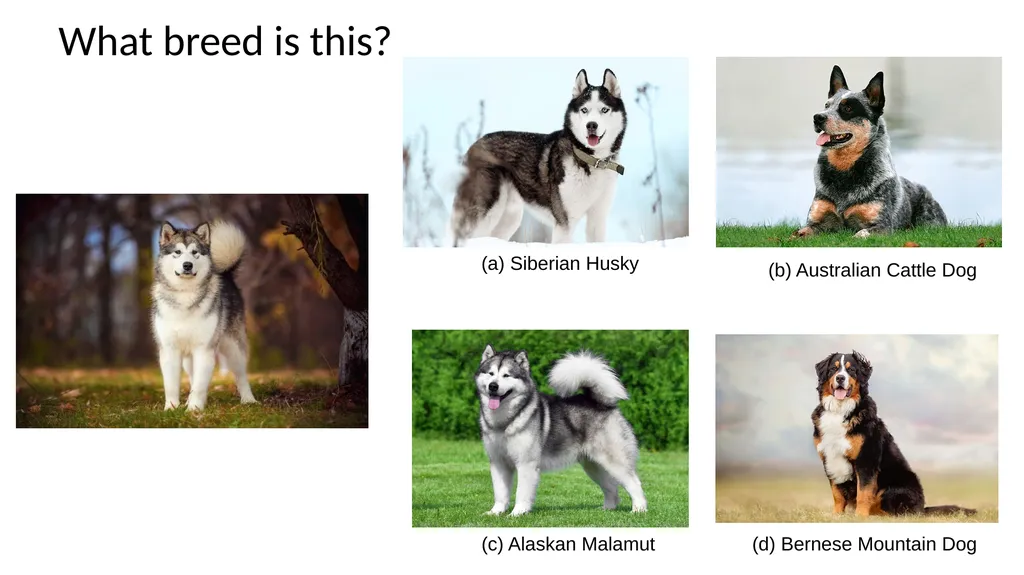
What breed is this? (a) Siberian Husky (c) Alaskan Malamut (b) Australian Cattle Dog (d) Bernese Mountain Dog<br>
03
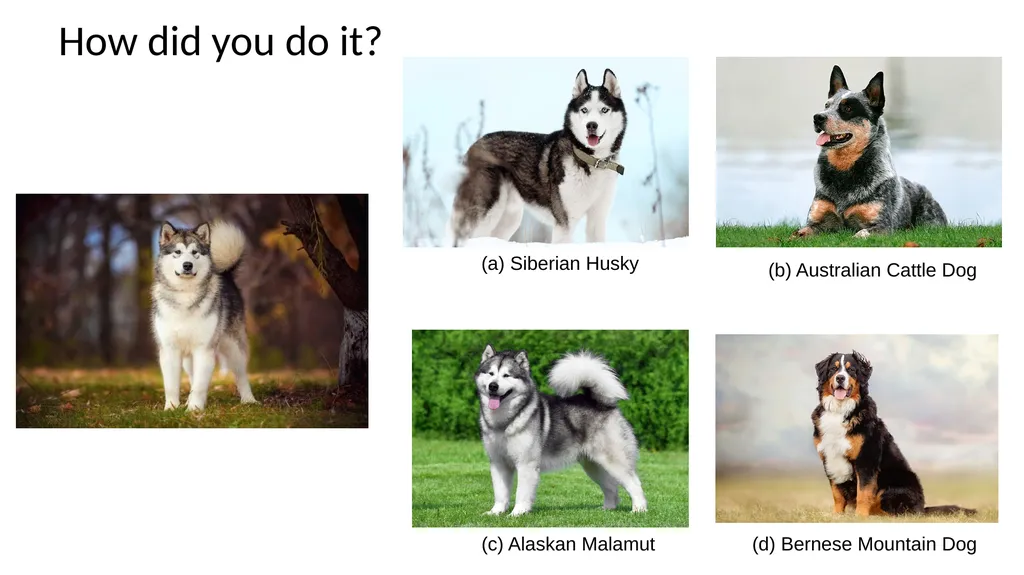
How did you do it? (a) Siberian Husky (c) Alaskan Malamut (b) Australian Cattle Dog (d) Bernese Mountain Dog<br>
04
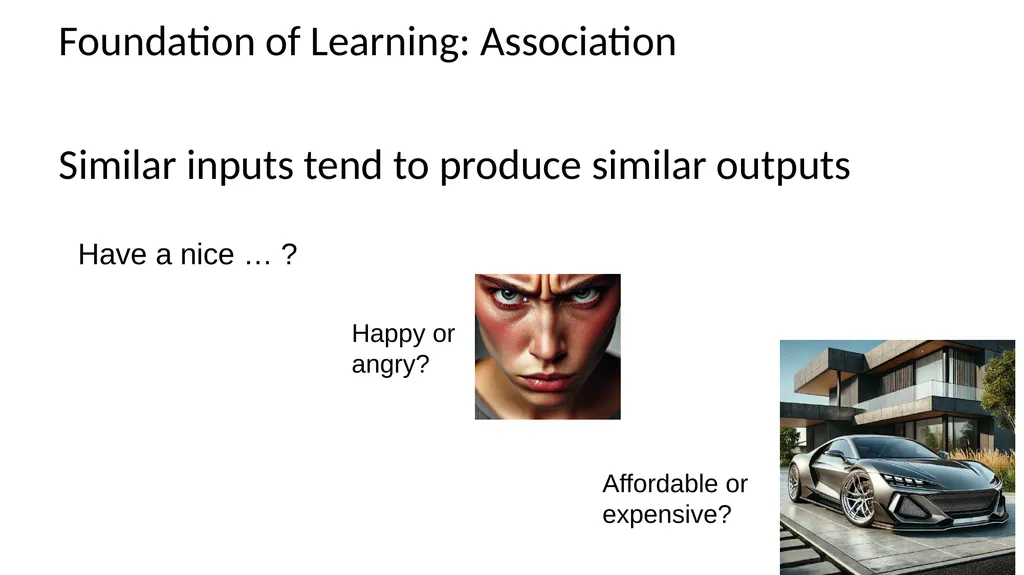
Foundation of Learning: Association Similar inputs tend to produce similar outputs Affordable or expensive? Happy or angry? Have a nice … ?<br>
05
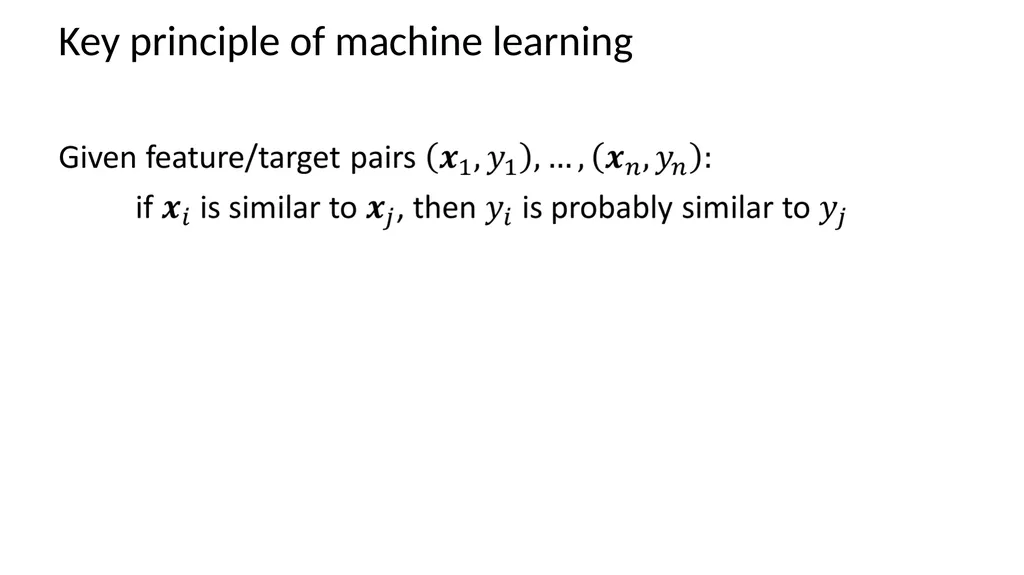
Key principle of machine learning<br>
06
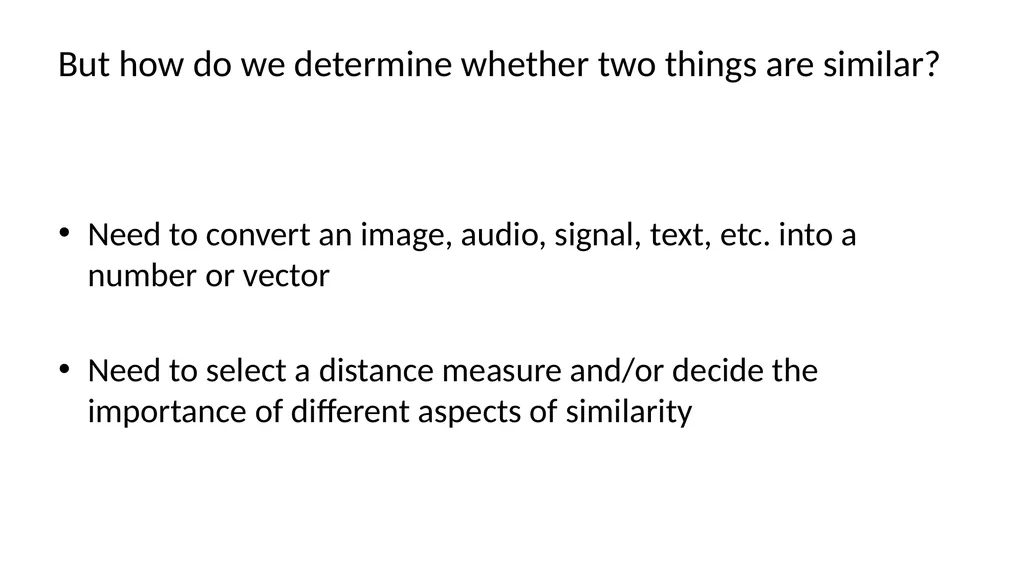
But how do we determine whether two things are similar? Need to convert an image, audio, signal, text, etc. into a number or vector
Need to select a distance measure and/or decide the importance of different aspects of similarity<br>
Need to select a distance measure and/or decide the importance of different aspects of similarity<br>
07
In ML, every object/concept/document is a number or series of numbers.
The main challenge is creating those numbers in a way that similarity makes sense.<br>
The main challenge is creating those numbers in a way that similarity makes sense.<br>
08
Data and Information Data are stored numbers
Information is the predictive power of data
Processing data never adds information, but it can make the information easier to access<br>
Information is the predictive power of data
Processing data never adds information, but it can make the information easier to access<br>
09
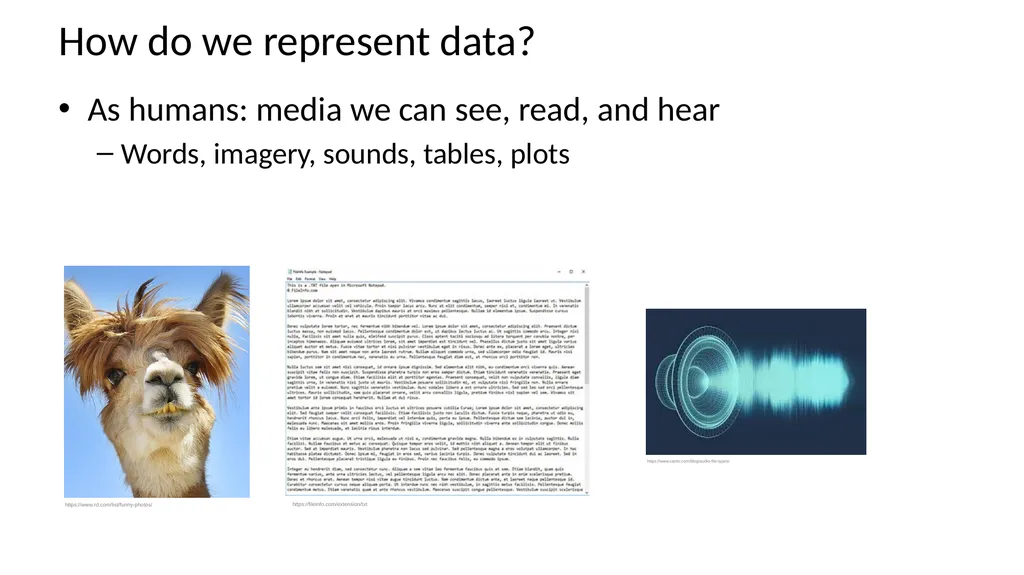
How do we represent data? As humans: media we can see, read, and hear
Words, imagery, sounds, tables, plots https://www.rd.com/list/funny-photos/ https://www.canto.com/blog/audio-file-types/ https://fileinfo.com/extension/txt<br>
Words, imagery, sounds, tables, plots https://www.rd.com/list/funny-photos/ https://www.canto.com/blog/audio-file-types/ https://fileinfo.com/extension/txt<br>
10
Sometimes, we can transform the data while preserving much or all of the information Resize an image
Rephrase a paragraph
1.5x an audio book<br>
Rephrase a paragraph
1.5x an audio book<br>
11
Sometimes, we can even transform the data so that it is more informative (to humans) Perform denoising on an image
Identify key points and insights in a document
Remove background noise from audio
None of these operations add information to the data, but they re-organize and/or remove distracting information<br>
Identify key points and insights in a document
Remove background noise from audio
None of these operations add information to the data, but they re-organize and/or remove distracting information<br>
12
In computers, data are numbers The numbers do not “mean” anything by themselves
The meaning comes from the way the numbers were produced and how they relate to each other
The meaning can be contained in each number by itself, or commonly by patterns in groups of numbers<br>
The meaning comes from the way the numbers were produced and how they relate to each other
The meaning can be contained in each number by itself, or commonly by patterns in groups of numbers<br>
13
We can transform the data while preserving much or all of the information Add or multiply by a constant value
Represent as a 16-bit or 32-bit float or integer
Compress a document, or store in a different file format<br>
Represent as a 16-bit or 32-bit float or integer
Compress a document, or store in a different file format<br>
14
Sometimes, we can even transform the data so that it is more informative (i.e. simple comparisons are more effective) Center and rescale images of digits so they are easier to compare to each other
Normalize (subtract means and divide by standard deviations) cancer cell measurements to make simple similarity measures better reflect malignancy
Select features or create new ones out of combinations of inputs<br>
Normalize (subtract means and divide by standard deviations) cancer cell measurements to make simple similarity measures better reflect malignancy
Select features or create new ones out of combinations of inputs<br>
15
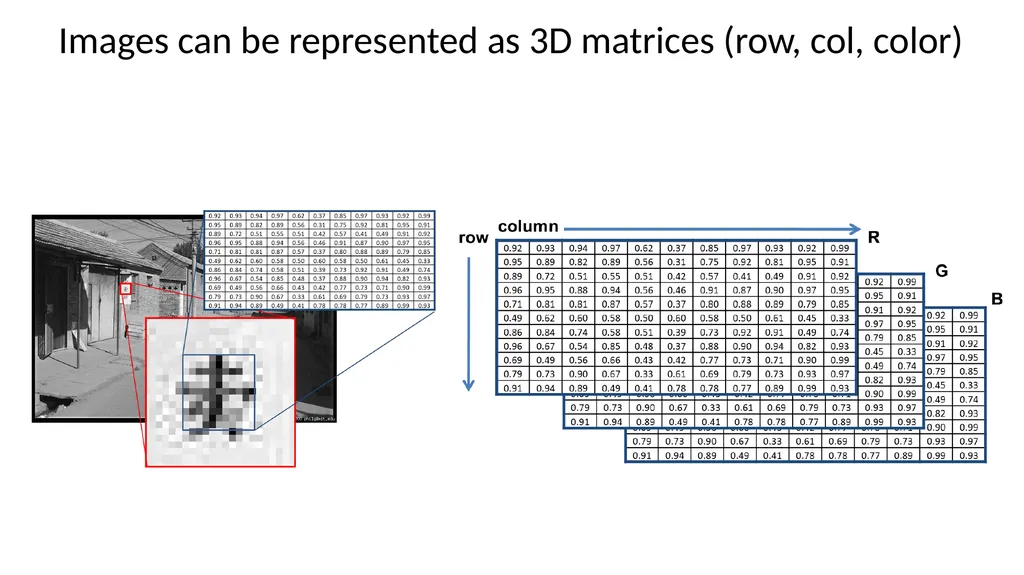
Images can be represented as 3D matrices (row, col, color)<br>
16
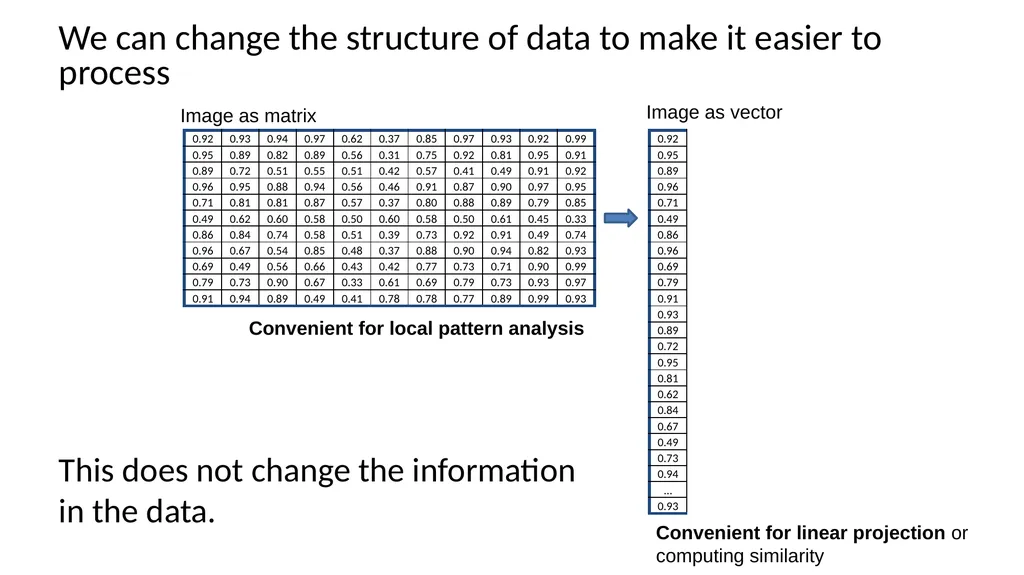
We can change the structure of data to make it easier to process This does not change the information in the data. Image as matrix Image as vector Convenient for local pattern analysis Convenient for linear projection or computing similarity<br>
17
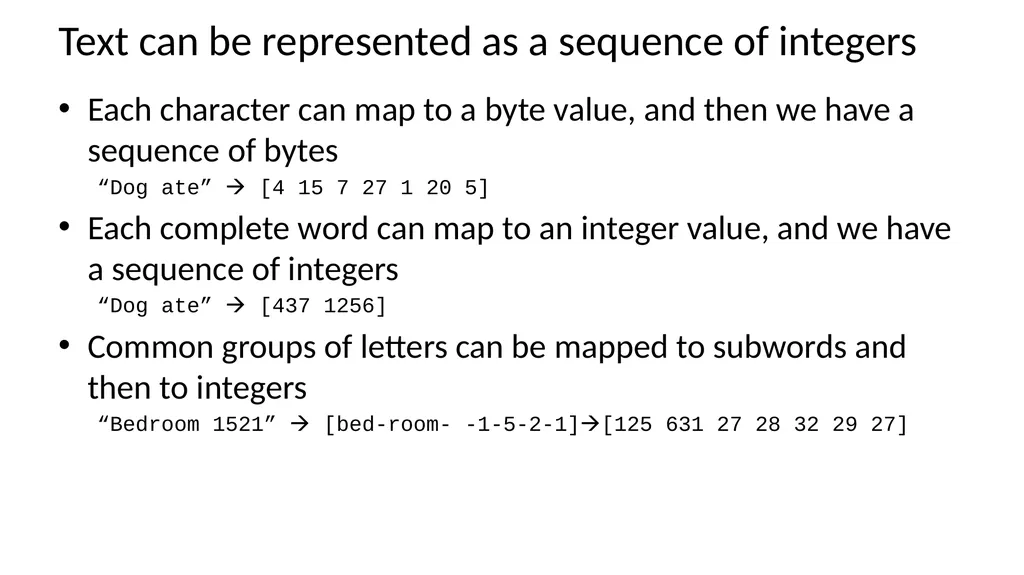
Text can be represented as a sequence of integers Each character can map to a byte value, and then we have a sequence of bytes
“Dog ate” [4 15 7 27 1 20 5]
Each complete word can map to an integer value, and we have a sequence of integers
“Dog ate” [437 1256]
Common groups of letters can be mapped to subwords and then to integers
“Bedroom 1521” [bed-room- -1-5-2-1][125 631 27 28 32 29 27]<br>
“Dog ate” [4 15 7 27 1 20 5]
Each complete word can map to an integer value, and we have a sequence of integers
“Dog ate” [437 1256]
Common groups of letters can be mapped to subwords and then to integers
“Bedroom 1521” [bed-room- -1-5-2-1][125 631 27 28 32 29 27]<br>
18
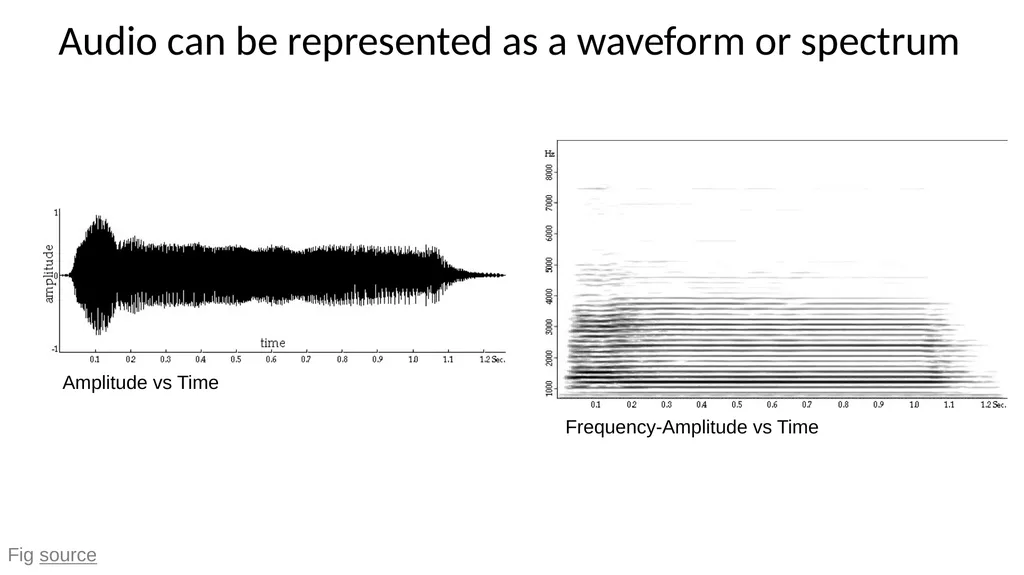
Audio can be represented as a waveform or spectrum Fig source Amplitude vs Time Frequency-Amplitude vs Time<br>
19
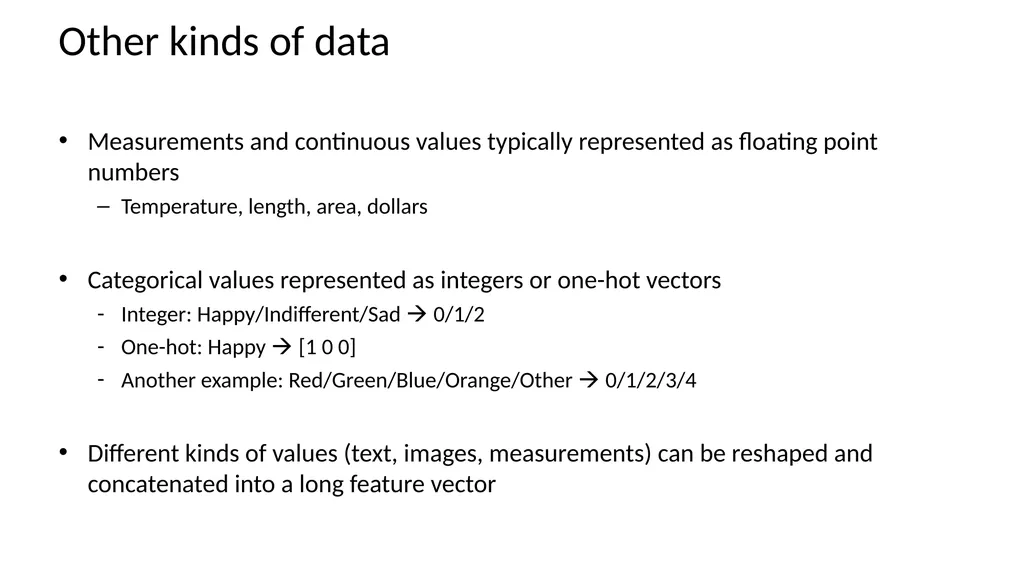
Other kinds of data Measurements and continuous values typically represented as floating point numbers
Temperature, length, area, dollars
Categorical values represented as integers or one-hot vectors
Integer: Happy/Indifferent/Sad 0/1/2
One-hot: Happy [1 0 0]
Another example: Red/Green/Blue/Orange/Other 0/1/2/3/4
Different kinds of values (text, images, measurements) can be reshaped and concatenated into a long feature vector<br>
Temperature, length, area, dollars
Categorical values represented as integers or one-hot vectors
Integer: Happy/Indifferent/Sad 0/1/2
One-hot: Happy [1 0 0]
Another example: Red/Green/Blue/Orange/Other 0/1/2/3/4
Different kinds of values (text, images, measurements) can be reshaped and concatenated into a long feature vector<br>
20
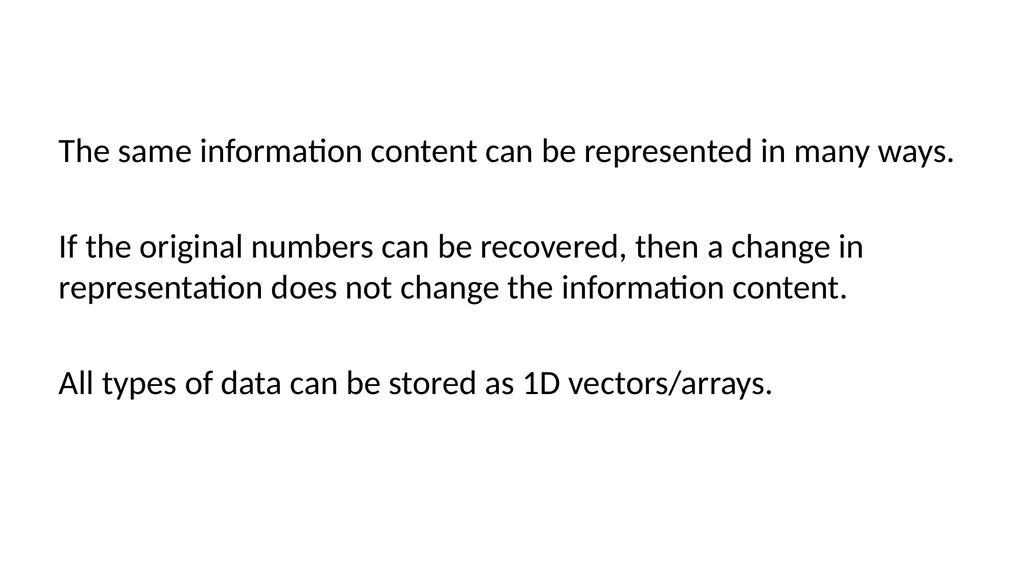
The same information content can be represented in many ways.
If the original numbers can be recovered, then a change in representation does not change the information content.
All types of data can be stored as 1D vectors/arrays.<br>
If the original numbers can be recovered, then a change in representation does not change the information content.
All types of data can be stored as 1D vectors/arrays.<br>
21
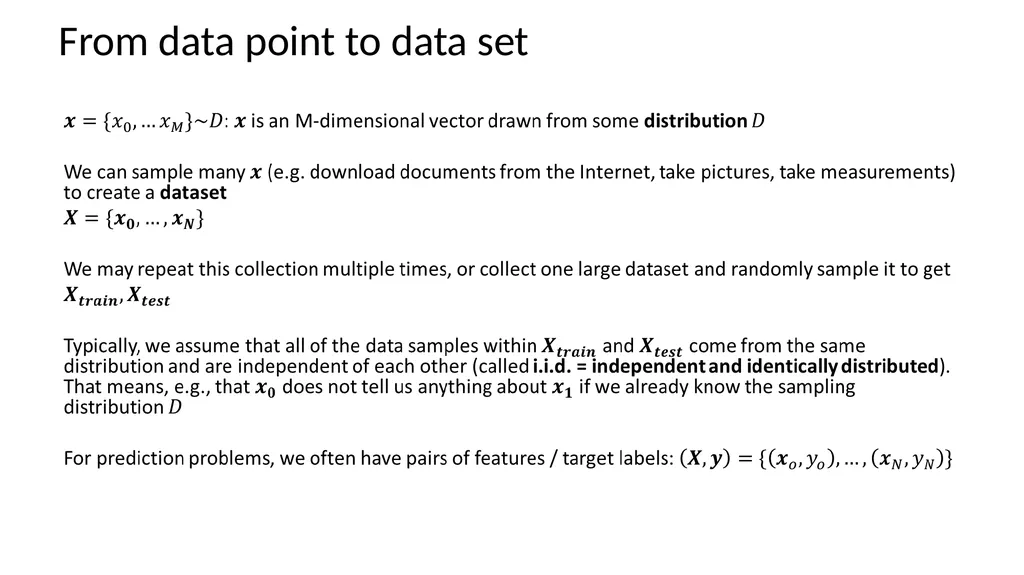
From data point to data set<br>
22
Answer Q1,Q2 https://tinyurl.com/AML441-L2<br>
23
Machine learning model maps from features to prediction Examples
Classification: predict label
Is this a dog or a cat?
Is this email spam or not?
Regression: predict value
What will the stock price be tomorrow?
What will be the high temperature tomorrow?
Structured prediction
What is the pose of this person? Features Prediction<br>
Classification: predict label
Is this a dog or a cat?
Is this email spam or not?
Regression: predict value
What will the stock price be tomorrow?
What will be the high temperature tomorrow?
Structured prediction
What is the pose of this person? Features Prediction<br>
24
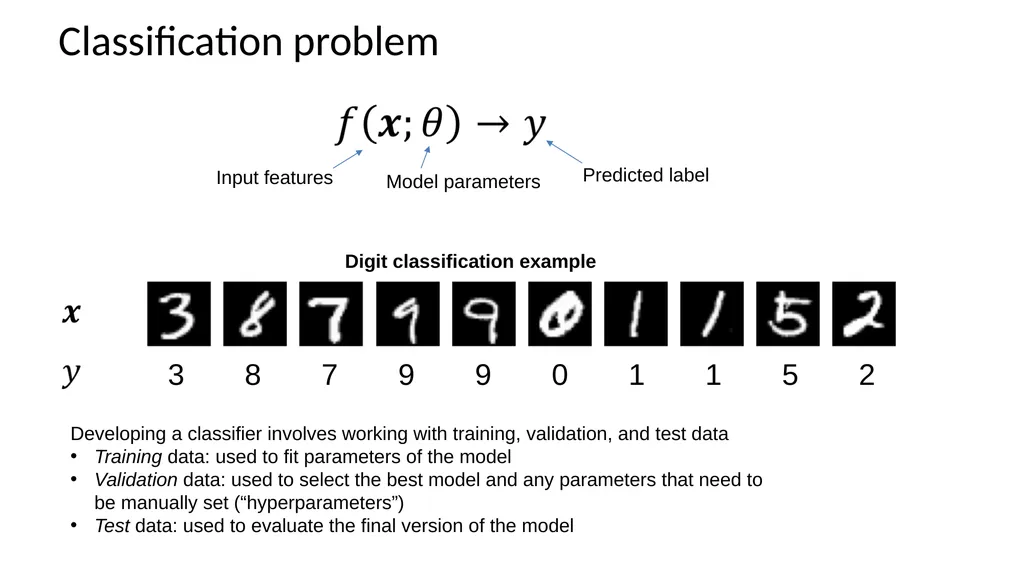
Classification problem Developing a classifier involves working with training, validation, and test data
Training data: used to fit parameters of the model
Validation data: used to select the best model and any parameters that need to be manually set (“hyperparameters”)
Test data: used to evaluate the final version of the model<br>
Training data: used to fit parameters of the model
Validation data: used to select the best model and any parameters that need to be manually set (“hyperparameters”)
Test data: used to evaluate the final version of the model<br>
25
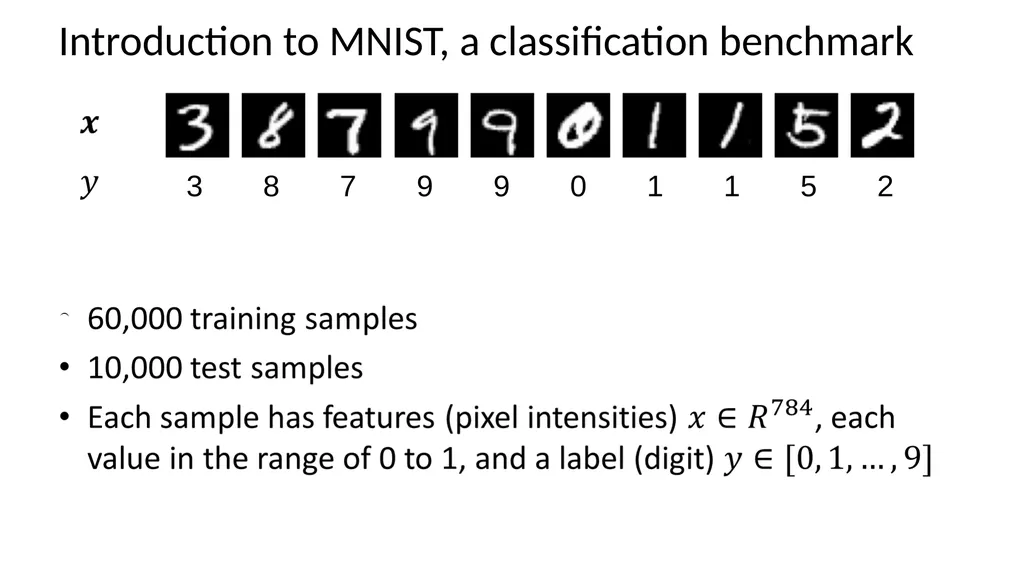
Introduction to MNIST, a classification benchmark 3 8 7 9 9 0 1 1 5 2<br>
26
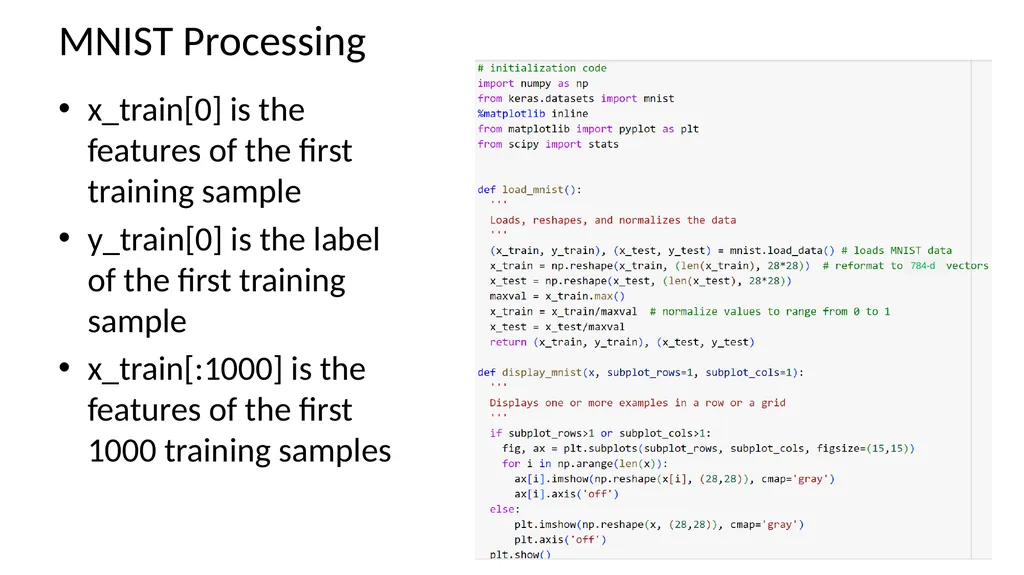
MNIST Processing x_train[0] is the features of the first training sample
y_train[0] is the label of the first training sample
x_train[:1000] is the features of the first 1000 training samples 784-d<br>
y_train[0] is the label of the first training sample
x_train[:1000] is the features of the first 1000 training samples 784-d<br>
27
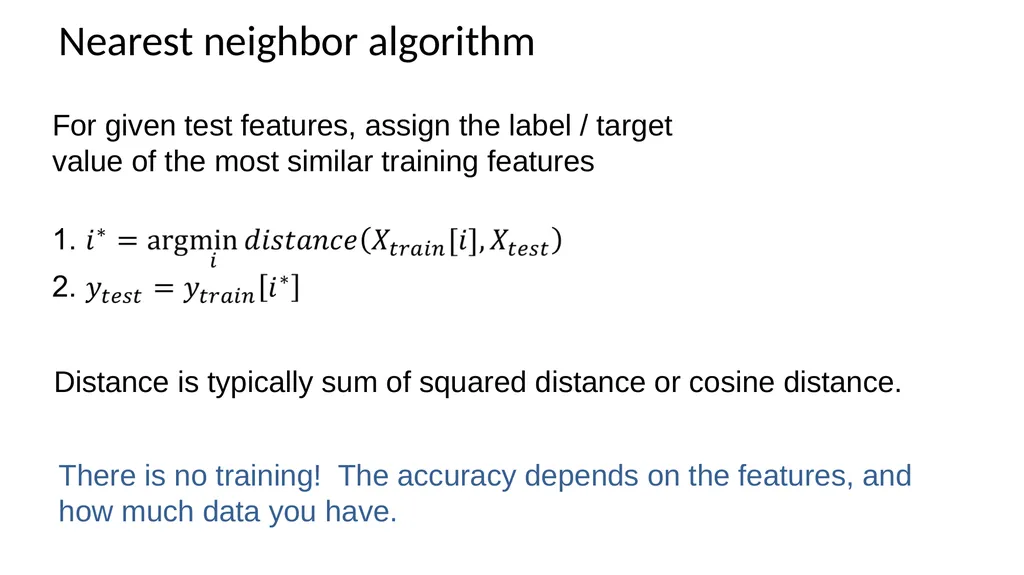
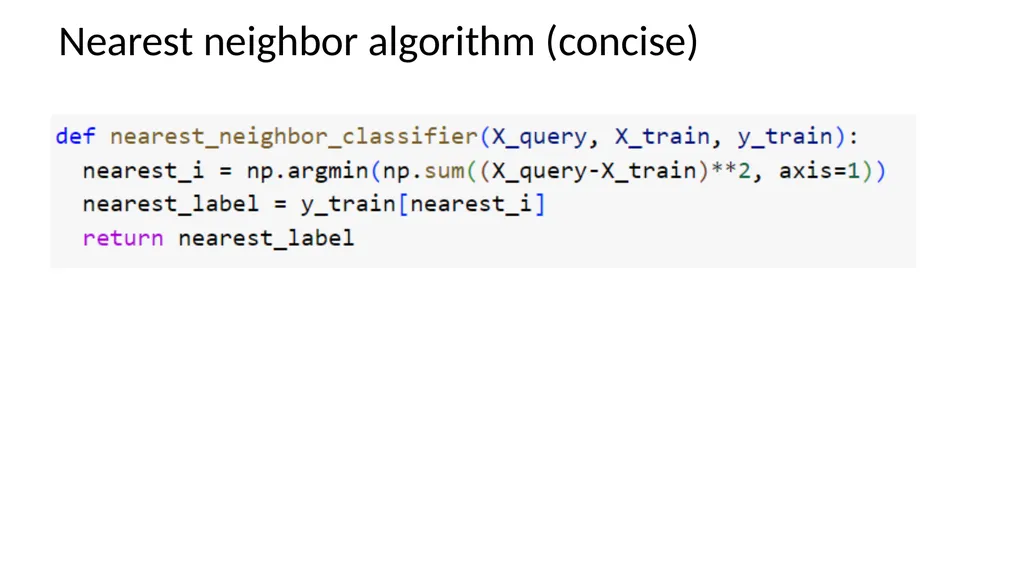
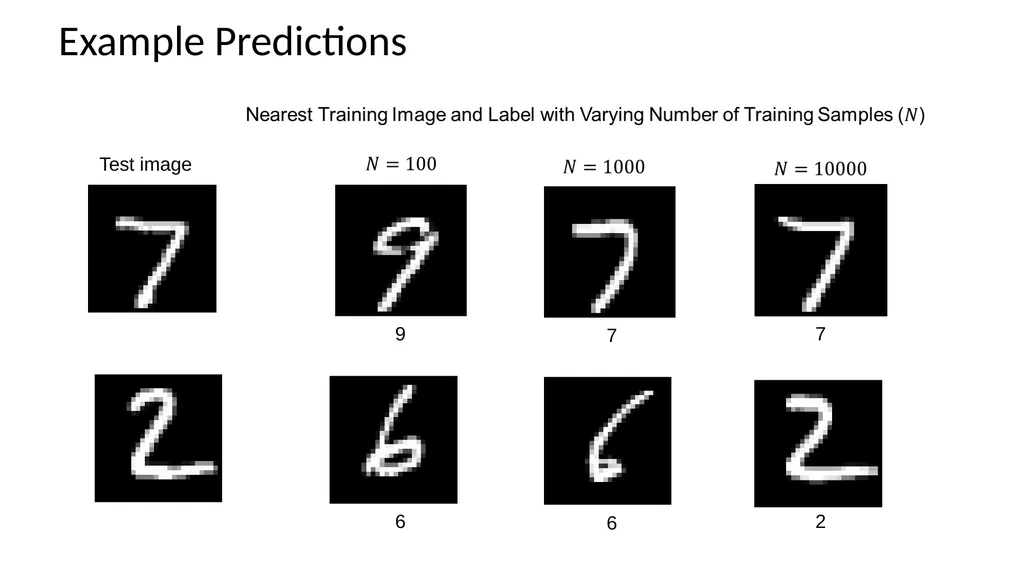
Nearest neighbor algorithm For given test features, assign the label / target value of the most similar training features Distance is typically sum of squared distance or cosine distance. There is no training! The accuracy depends on the features, and how much data you have.<br>
28
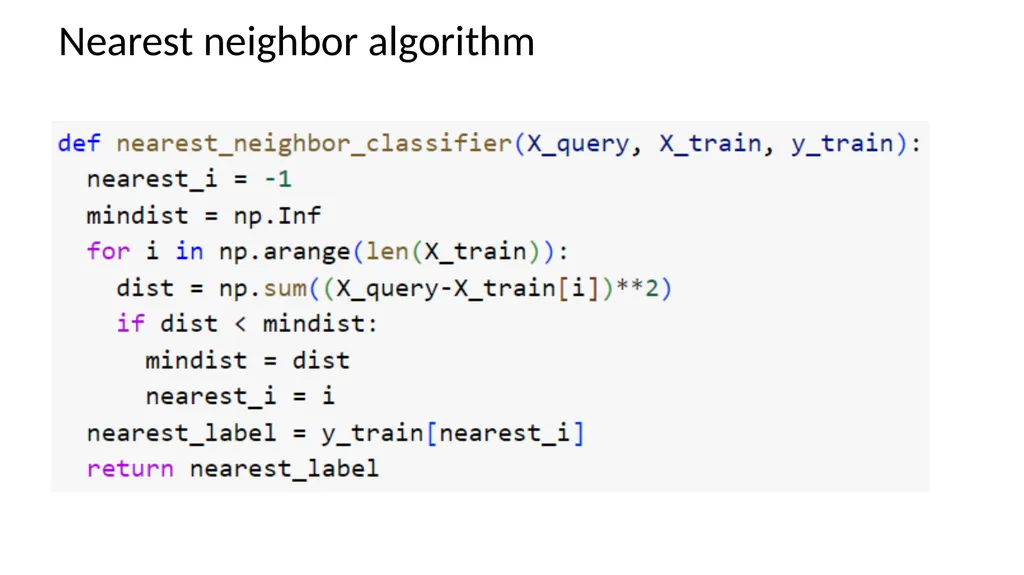
Nearest neighbor algorithm<br>
29
Nearest neighbor algorithm (concise)<br>
30
Example Predictions Test image 9 7 7 6 6 2<br>
31
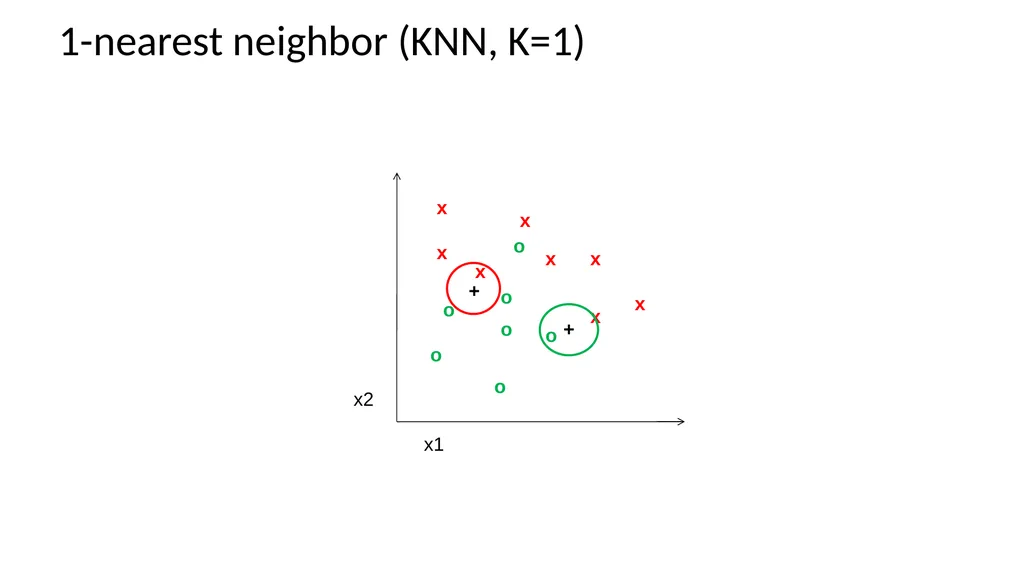
1-nearest neighbor (KNN, K=1) + +<br>
32
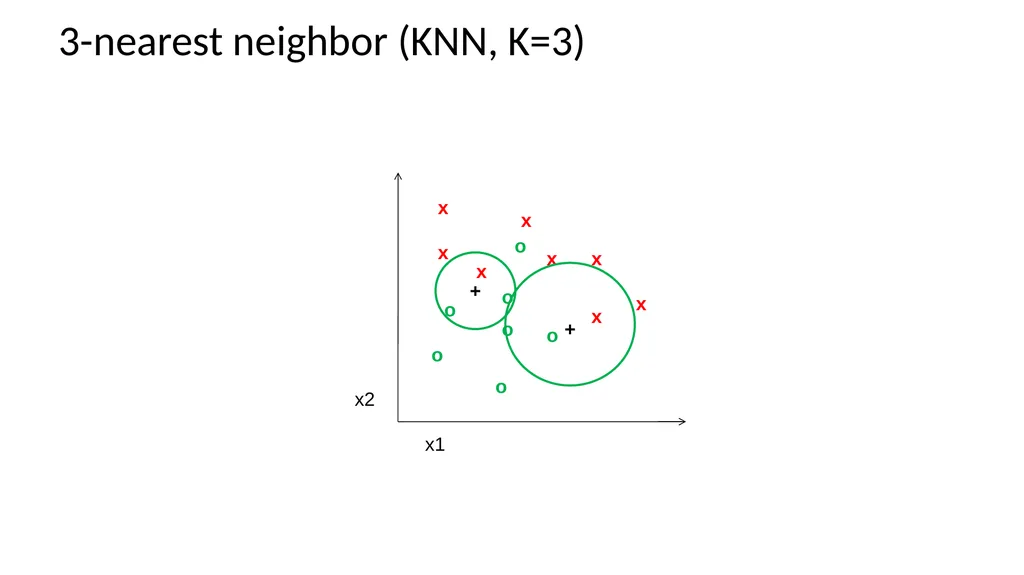
3-nearest neighbor (KNN, K=3) + +<br>
33
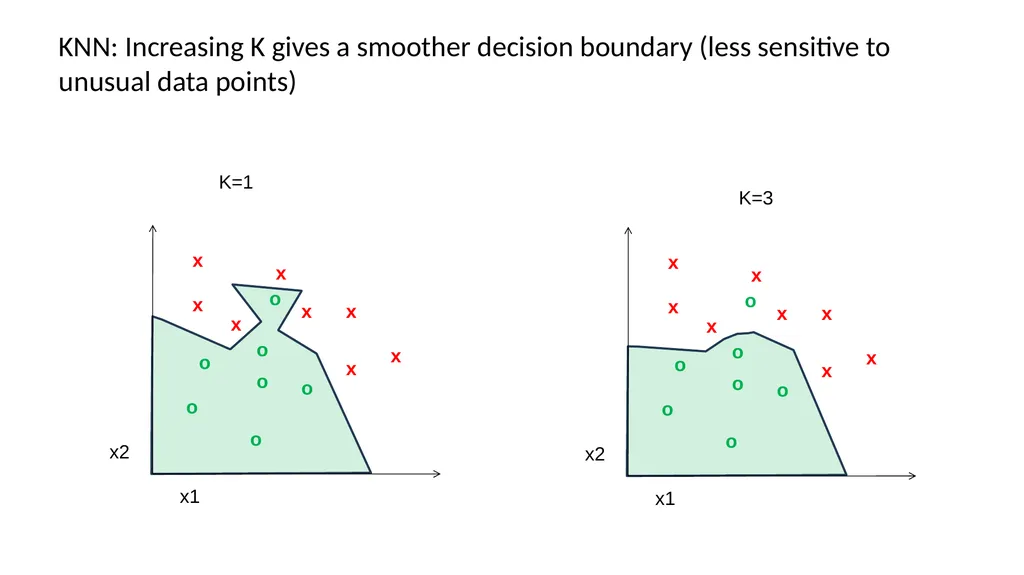
KNN: Increasing K gives a smoother decision boundary (less sensitive to unusual data points) K=1 K=3<br>
34
5-nearest neighbor (KNN, K=5) + +<br>
35
Answer Q3 https://tinyurl.com/AML441-L2<br>
36
Comments on K-NN Simple: an excellent baseline and sometimes hard to beat
Higher K gives smoother functions
Can work with only one example per class
Naturally scales with data: can work very well if you have a very large training set
Naïve implementations are slow, but fast retrieval methods are available (as we’ll see in Lecture 4)
No training time (other than storing/indexing examples)
With infinite examples, 1-NN provably has error that is at most twice Bayes optimal error (but we never have infinite examples)<br>
Higher K gives smoother functions
Can work with only one example per class
Naturally scales with data: can work very well if you have a very large training set
Naïve implementations are slow, but fast retrieval methods are available (as we’ll see in Lecture 4)
No training time (other than storing/indexing examples)
With infinite examples, 1-NN provably has error that is at most twice Bayes optimal error (but we never have infinite examples)<br>
37
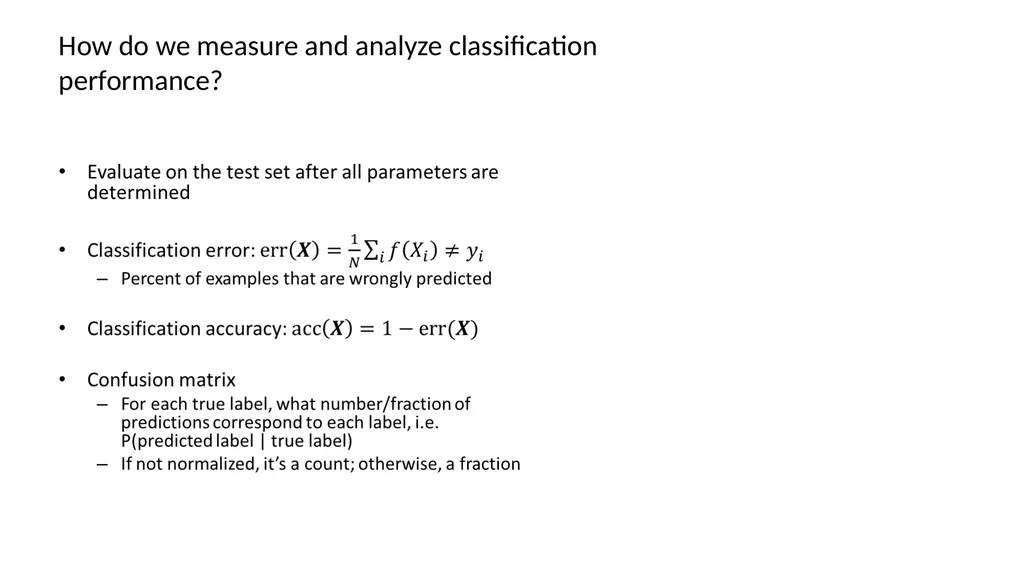
How do we measure and analyze classification performance?<br>
38
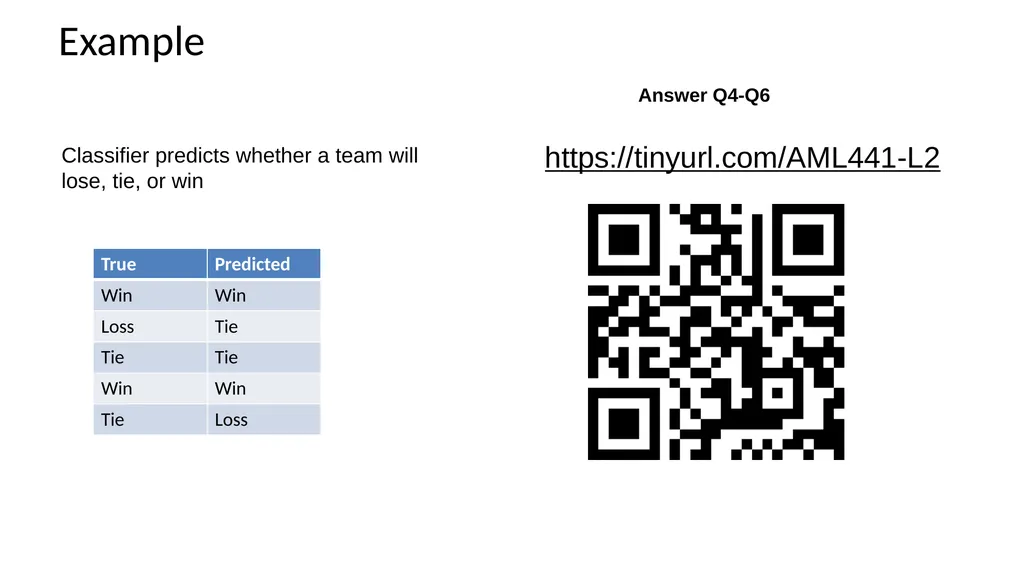
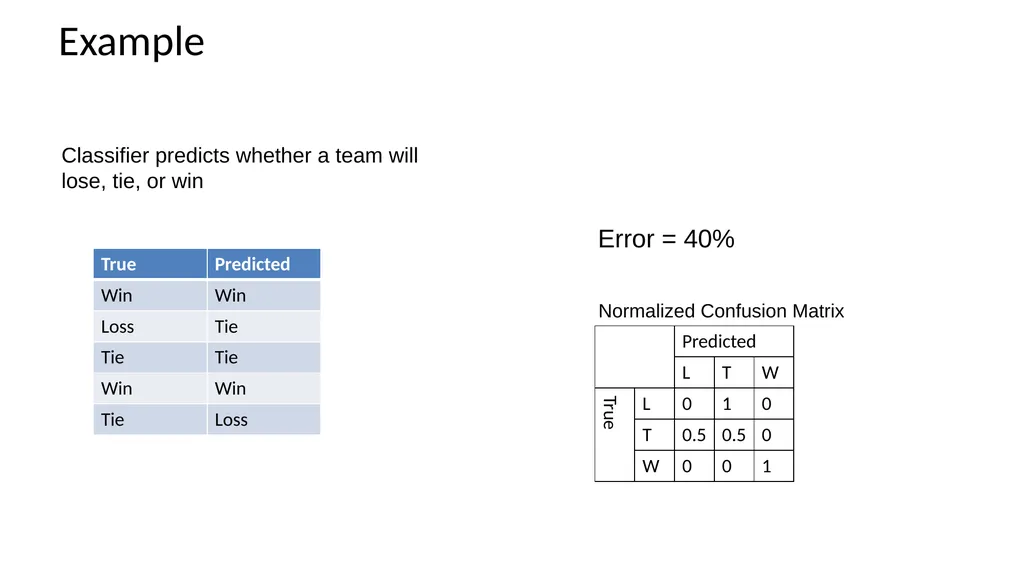
Example Classifier predicts whether a team will lose, tie, or win Answer Q4-Q6 https://tinyurl.com/AML441-L2<br>
39
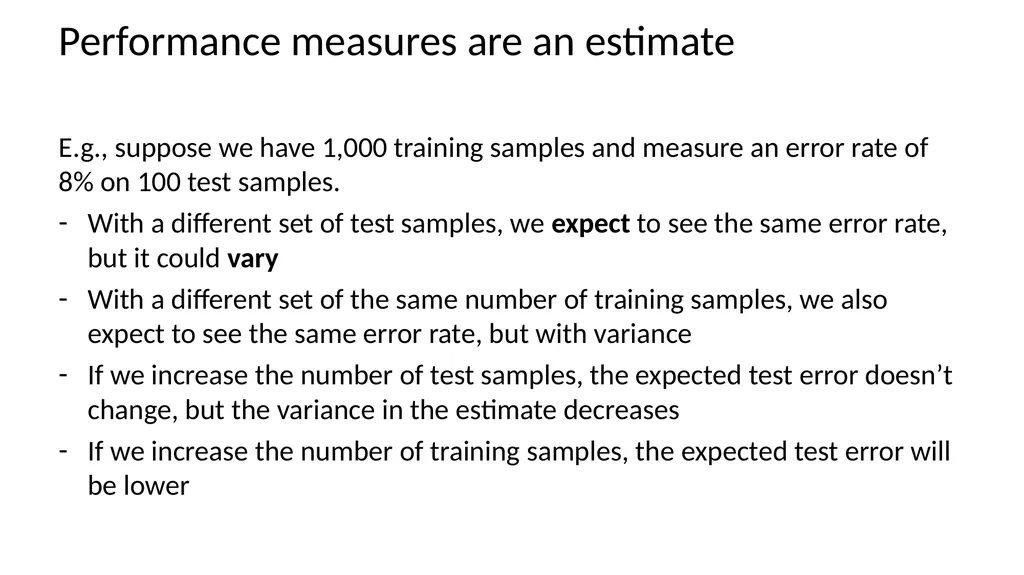
Performance measures are an estimate E.g., suppose we have 1,000 training samples and measure an error rate of 8% on 100 test samples.
With a different set of test samples, we expect to see the same error rate, but it could vary
With a different set of the same number of training samples, we also expect to see the same error rate, but with variance
If we increase the number of test samples, the expected test error doesn’t change, but the variance in the estimate decreases
If we increase the number of training samples, the expected test error will be lower<br>
With a different set of test samples, we expect to see the same error rate, but it could vary
With a different set of the same number of training samples, we also expect to see the same error rate, but with variance
If we increase the number of test samples, the expected test error doesn’t change, but the variance in the estimate decreases
If we increase the number of training samples, the expected test error will be lower<br>
40
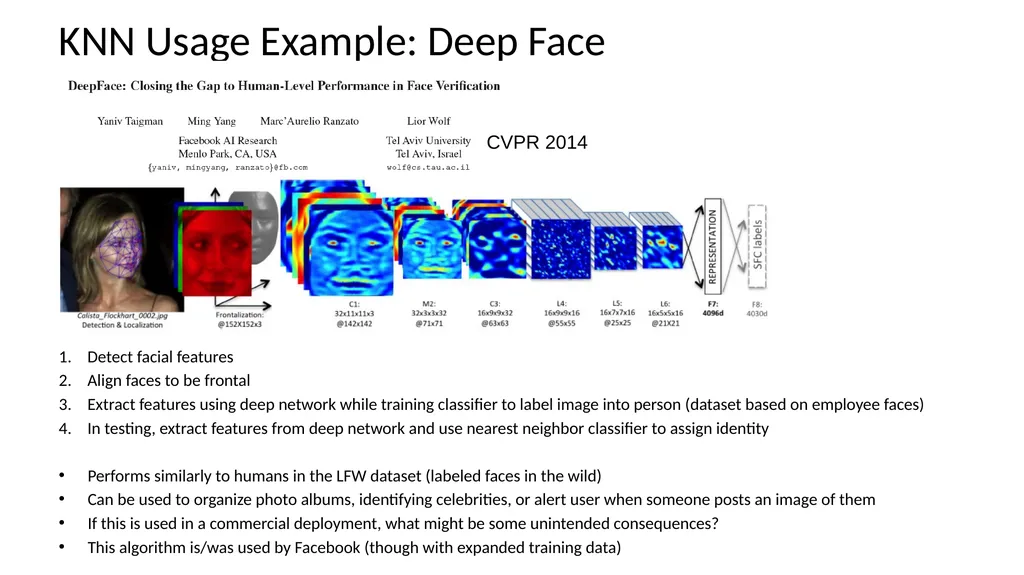
KNN Usage Example: Deep Face Detect facial features
Align faces to be frontal
Extract features using deep network while training classifier to label image into person (dataset based on employee faces)
In testing, extract features from deep network and use nearest neighbor classifier to assign identity
Performs similarly to humans in the LFW dataset (labeled faces in the wild)
Can be used to organize photo albums, identifying celebrities, or alert user when someone posts an image of them
If this is used in a commercial deployment, what might be some unintended consequences?
This algorithm is/was used by Facebook (though with expanded training data) CVPR 2014<br>
Align faces to be frontal
Extract features using deep network while training classifier to label image into person (dataset based on employee faces)
In testing, extract features from deep network and use nearest neighbor classifier to assign identity
Performs similarly to humans in the LFW dataset (labeled faces in the wild)
Can be used to organize photo albums, identifying celebrities, or alert user when someone posts an image of them
If this is used in a commercial deployment, what might be some unintended consequences?
This algorithm is/was used by Facebook (though with expanded training data) CVPR 2014<br>
41
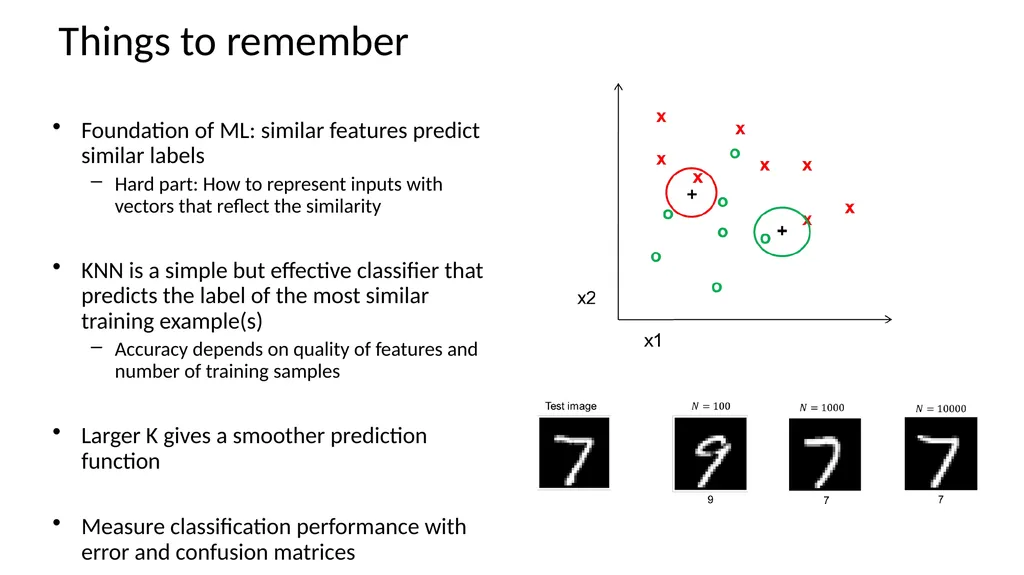
Things to remember Foundation of ML: similar features predict similar labels
Hard part: How to represent inputs with vectors that reflect the similarity
KNN is a simple but effective classifier that predicts the label of the most similar training example(s)
Accuracy depends on quality of features and number of training samples
Larger K gives a smoother prediction function
Measure classification performance with error and confusion matrices<br>
Hard part: How to represent inputs with vectors that reflect the similarity
KNN is a simple but effective classifier that predicts the label of the most similar training example(s)
Accuracy depends on quality of features and number of training samples
Larger K gives a smoother prediction function
Measure classification performance with error and confusion matrices<br>
42
Coming up Tues: Regression with KNN, Generalization
Thurs: Search and Clustering<br>
Thurs: Search and Clustering<br>
43
Example Normalized Confusion Matrix Classifier predicts whether a team will lose, tie, or win Error = 40%<br>
44
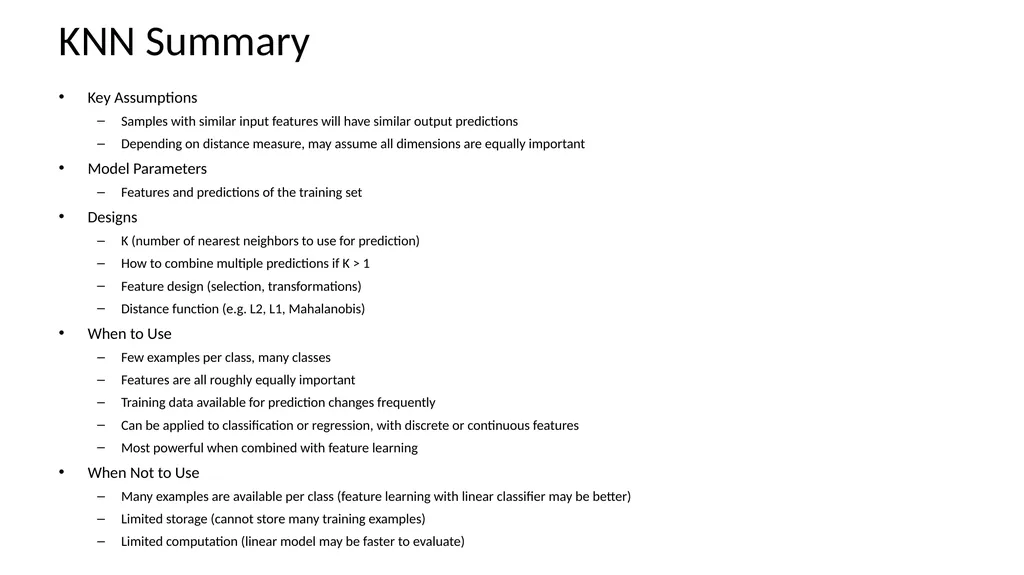
KNN Summary Key Assumptions
Samples with similar input features will have similar output predictions
Depending on distance measure, may assume all dimensions are equally important
Model Parameters
Features and predictions of the training set
Designs
K (number of nearest neighbors to use for prediction)
How to combine multiple predictions if K > 1
Feature design (selection, transformations)
Distance function (e.g. L2, L1, Mahalanobis)
When to Use
Few examples per class, many classes
Features are all roughly equally important
Training data available for prediction changes frequently
Can be applied to classification or regression, with discrete or continuous features
Most powerful when combined with feature learning
When Not to Use
Many examples are available per class (feature learning with linear classifier may be better)
Limited storage (cannot store many training examples)
Limited computation (linear model may be faster to evaluate)<br>
Samples with similar input features will have similar output predictions
Depending on distance measure, may assume all dimensions are equally important
Model Parameters
Features and predictions of the training set
Designs
K (number of nearest neighbors to use for prediction)
How to combine multiple predictions if K > 1
Feature design (selection, transformations)
Distance function (e.g. L2, L1, Mahalanobis)
When to Use
Few examples per class, many classes
Features are all roughly equally important
Training data available for prediction changes frequently
Can be applied to classification or regression, with discrete or continuous features
Most powerful when combined with feature learning
When Not to Use
Many examples are available per class (feature learning with linear classifier may be better)
Limited storage (cannot store many training examples)
Limited computation (linear model may be faster to evaluate)<br>