
Kentucky State University Review Update Aaron
A
Published · 32 slides · 0 views

1 / 1
Description
Kentucky State University Review Update Aaron Thompson, President Travis Powell, Vice President and General Counsel Kentucky Council on Postsecondary Education November 16, 2021 Overview 2 Executive Order Cash Reserves and Working Capital
Related Topics
Share
Embed code
Download this presentation From Below
"Kentucky State University Review Update Aaron" is the property of its rightful owner. Permission is granted to download and print the materials on this website for personal, non-commercial use only, and to display it on your personal computer provided you do not modify the materials and that you retain all copyright notices contained in the materials. By downloading content from our website, you accept the terms of this agreement.
Presentation Transcript
01
Kentucky State University Review Update Aaron Thompson, President
Travis Powell, Vice President and General Counsel
Kentucky Council on Postsecondary Education
November 16, 2021<br>
Travis Powell, Vice President and General Counsel
Kentucky Council on Postsecondary Education
November 16, 2021<br>
02
Overview 2 Executive Order
Cash Reserves and Working Capital Analysis
Financial Health Assessment
Peer Group Comparisons
Validation of Financial Information
Review of Controls over Financial Management and Reporting
Recommendations and Key Takeaways<br>
Cash Reserves and Working Capital Analysis
Financial Health Assessment
Peer Group Comparisons
Validation of Financial Information
Review of Controls over Financial Management and Reporting
Recommendations and Key Takeaways<br>
03
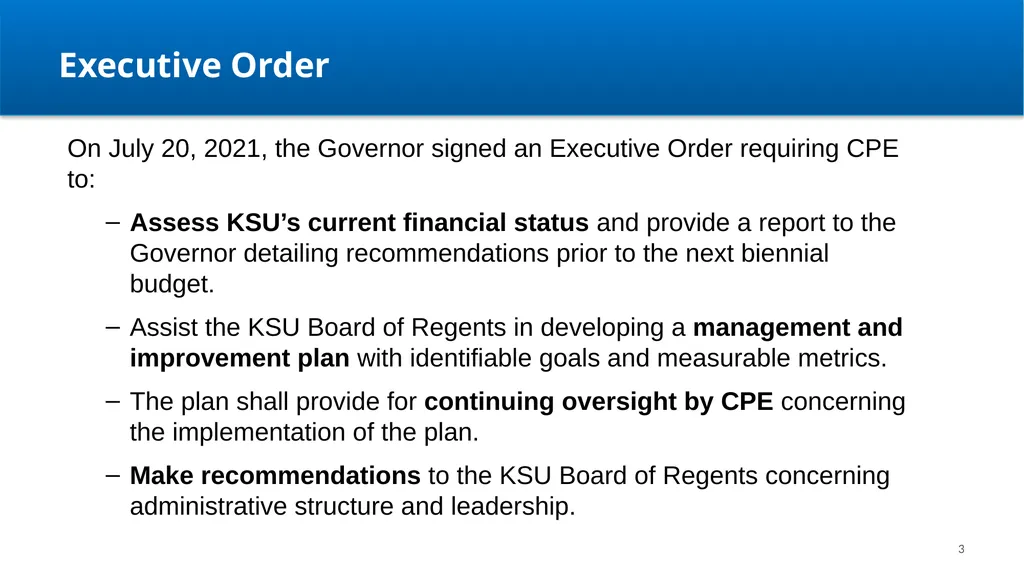
Executive Order 3 On July 20, 2021, the Governor signed an Executive Order requiring CPE to:
Assess KSU’s current financial status and provide a report to the Governor detailing recommendations prior to the next biennial budget.
Assist the KSU Board of Regents in developing a management and improvement plan with identifiable goals and measurable metrics.
The plan shall provide for continuing oversight by CPE concerning the implementation of the plan.
Make recommendations to the KSU Board of Regents concerning administrative structure and leadership.<br>
Assess KSU’s current financial status and provide a report to the Governor detailing recommendations prior to the next biennial budget.
Assist the KSU Board of Regents in developing a management and improvement plan with identifiable goals and measurable metrics.
The plan shall provide for continuing oversight by CPE concerning the implementation of the plan.
Make recommendations to the KSU Board of Regents concerning administrative structure and leadership.<br>
04
4 Cash Flow and Working Capital Analysis
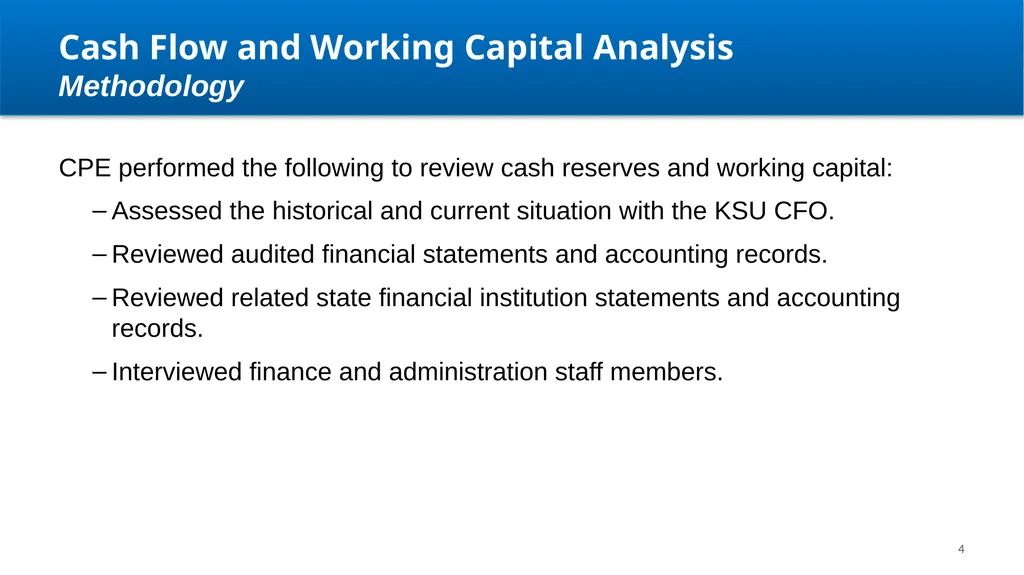
Methodology CPE performed the following to review cash reserves and working capital:
Assessed the historical and current situation with the KSU CFO.
Reviewed audited financial statements and accounting records.
Reviewed related state financial institution statements and accounting records.
Interviewed finance and administration staff members.<br>
Assessed the historical and current situation with the KSU CFO.
Reviewed audited financial statements and accounting records.
Reviewed related state financial institution statements and accounting records.
Interviewed finance and administration staff members.<br>
05
5 Cash Flow and Working Capital Analysis
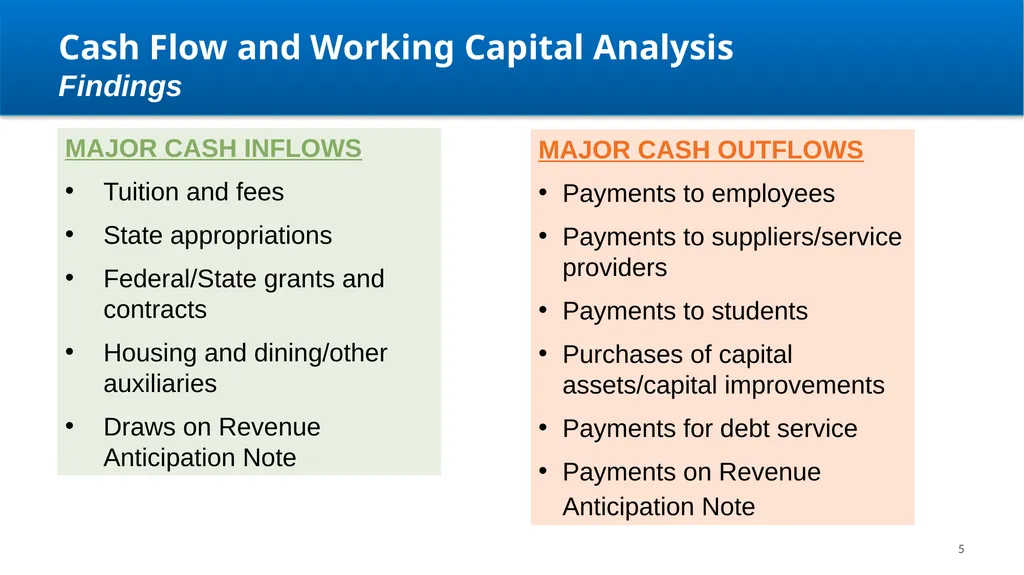
Findings MAJOR CASH INFLOWS
Tuition and fees
State appropriations
Federal/State grants and contracts
Housing and dining/other auxiliaries
Draws on Revenue Anticipation Note MAJOR CASH OUTFLOWS
Payments to employees
Payments to suppliers/service providers
Payments to students
Purchases of capital assets/capital improvements
Payments for debt service
Payments on Revenue Anticipation Note<br>
Tuition and fees
State appropriations
Federal/State grants and contracts
Housing and dining/other auxiliaries
Draws on Revenue Anticipation Note MAJOR CASH OUTFLOWS
Payments to employees
Payments to suppliers/service providers
Payments to students
Purchases of capital assets/capital improvements
Payments for debt service
Payments on Revenue Anticipation Note<br>
06
Cash Flow and Working Capital Analysis
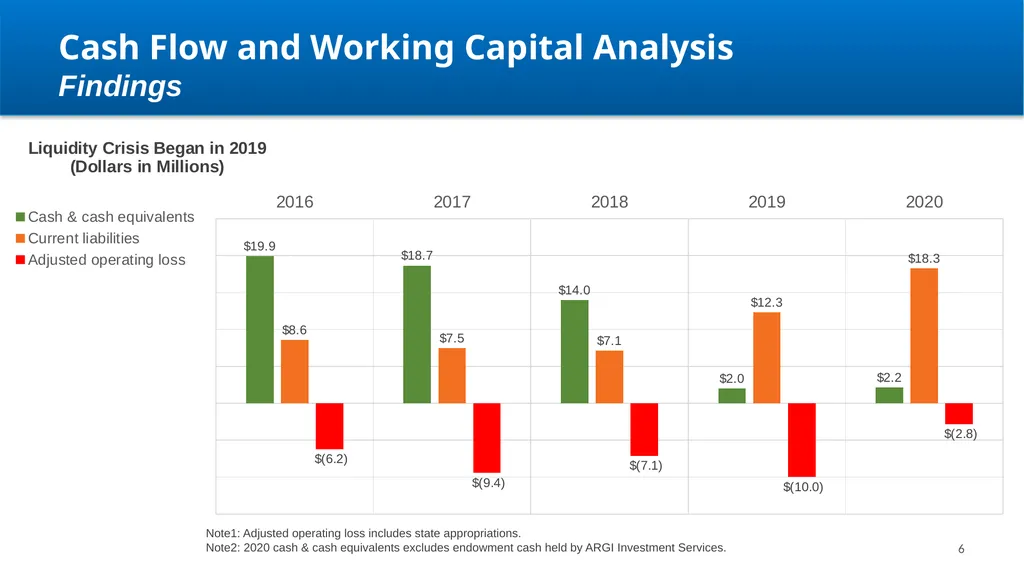
Findings 6 Note1: Adjusted operating loss includes state appropriations.
Note2: 2020 cash & cash equivalents excludes endowment cash held by ARGI Investment Services.<br>
Note2: 2020 cash & cash equivalents excludes endowment cash held by ARGI Investment Services.<br>
07
Cash Flow and Working Capital Analysis
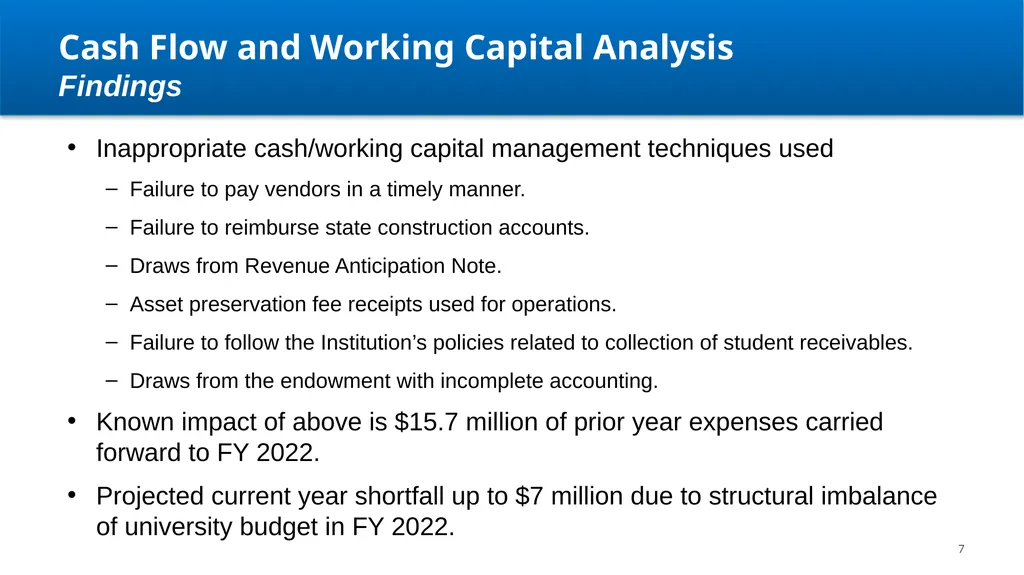
Findings Inappropriate cash/working capital management techniques used
Failure to pay vendors in a timely manner.
Failure to reimburse state construction accounts.
Draws from Revenue Anticipation Note.
Asset preservation fee receipts used for operations.
Failure to follow the Institution’s policies related to collection of student receivables.
Draws from the endowment with incomplete accounting.
Known impact of above is $15.7 million of prior year expenses carried forward to FY 2022.
Projected current year shortfall up to $7 million due to structural imbalance of university budget in FY 2022. 7<br>
Failure to pay vendors in a timely manner.
Failure to reimburse state construction accounts.
Draws from Revenue Anticipation Note.
Asset preservation fee receipts used for operations.
Failure to follow the Institution’s policies related to collection of student receivables.
Draws from the endowment with incomplete accounting.
Known impact of above is $15.7 million of prior year expenses carried forward to FY 2022.
Projected current year shortfall up to $7 million due to structural imbalance of university budget in FY 2022. 7<br>
08
Cash Flow and Working Capital Analysis
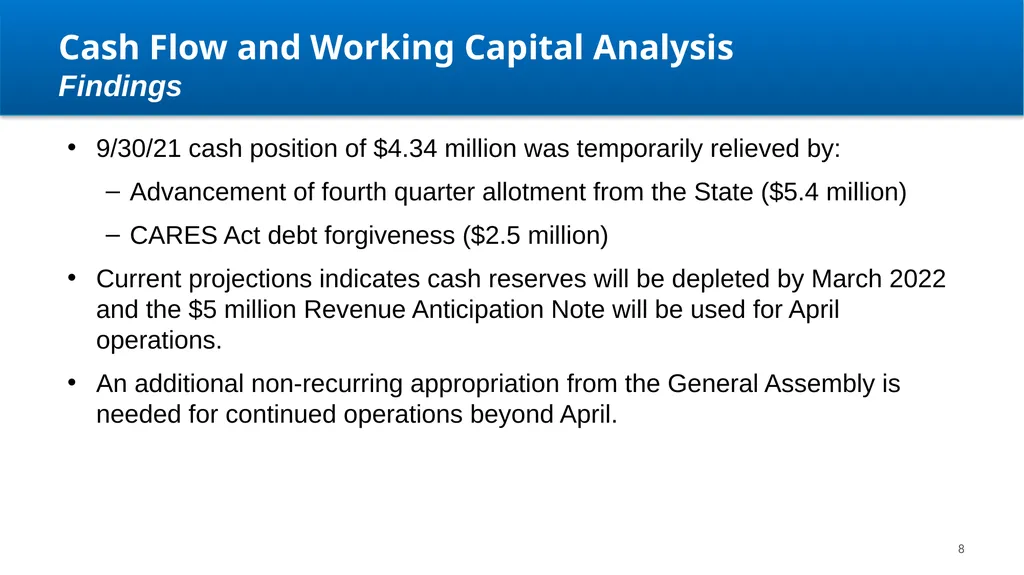
Findings 9/30/21 cash position of $4.34 million was temporarily relieved by:
Advancement of fourth quarter allotment from the State ($5.4 million)
CARES Act debt forgiveness ($2.5 million)
Current projections indicates cash reserves will be depleted by March 2022 and the $5 million Revenue Anticipation Note will be used for April operations.
An additional non-recurring appropriation from the General Assembly is needed for continued operations beyond April. 8<br>
Advancement of fourth quarter allotment from the State ($5.4 million)
CARES Act debt forgiveness ($2.5 million)
Current projections indicates cash reserves will be depleted by March 2022 and the $5 million Revenue Anticipation Note will be used for April operations.
An additional non-recurring appropriation from the General Assembly is needed for continued operations beyond April. 8<br>
09
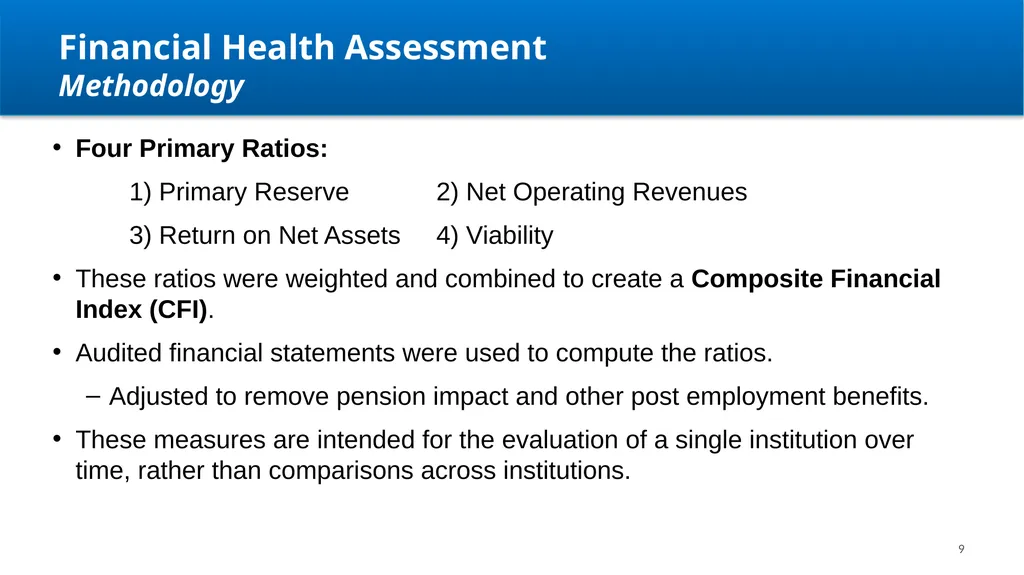
9 Four Primary Ratios:
1) Primary Reserve 2) Net Operating Revenues
3) Return on Net Assets 4) Viability
These ratios were weighted and combined to create a Composite Financial Index (CFI).
Audited financial statements were used to compute the ratios.
Adjusted to remove pension impact and other post employment benefits.
These measures are intended for the evaluation of a single institution over time, rather than comparisons across institutions. Financial Health Assessment Methodology<br>
1) Primary Reserve 2) Net Operating Revenues
3) Return on Net Assets 4) Viability
These ratios were weighted and combined to create a Composite Financial Index (CFI).
Audited financial statements were used to compute the ratios.
Adjusted to remove pension impact and other post employment benefits.
These measures are intended for the evaluation of a single institution over time, rather than comparisons across institutions. Financial Health Assessment Methodology<br>
10
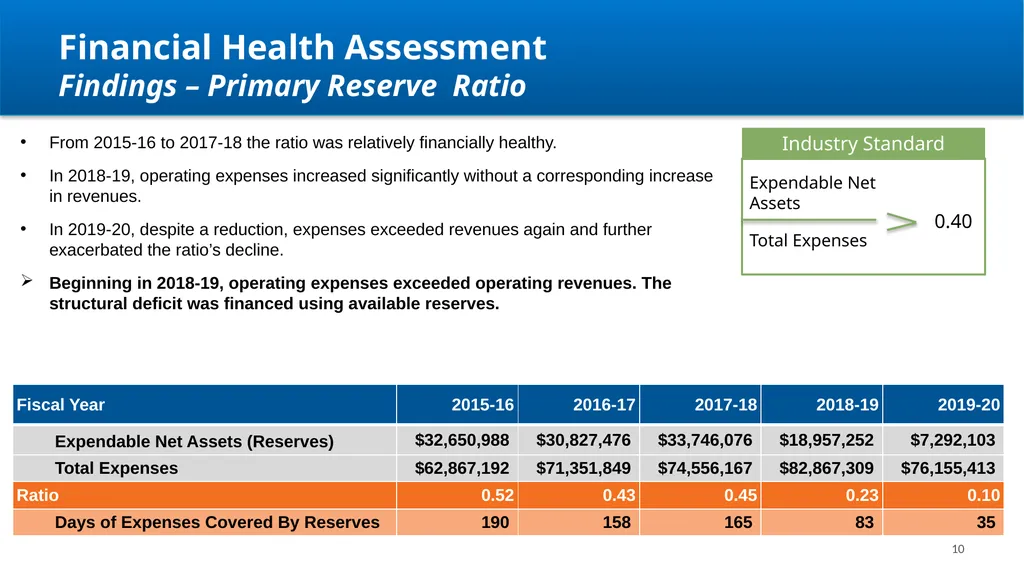
10 From 2015-16 to 2017-18 the ratio was relatively financially healthy.
In 2018-19, operating expenses increased significantly without a corresponding increase in revenues.
In 2019-20, despite a reduction, expenses exceeded revenues again and further exacerbated the ratio’s decline.
Beginning in 2018-19, operating expenses exceeded operating revenues. The structural deficit was financed using available reserves. Expendable Net Assets Total Expenses 0.40 Industry Standard Financial Health Assessment Findings – Primary Reserve Ratio<br>
In 2018-19, operating expenses increased significantly without a corresponding increase in revenues.
In 2019-20, despite a reduction, expenses exceeded revenues again and further exacerbated the ratio’s decline.
Beginning in 2018-19, operating expenses exceeded operating revenues. The structural deficit was financed using available reserves. Expendable Net Assets Total Expenses 0.40 Industry Standard Financial Health Assessment Findings – Primary Reserve Ratio<br>
11
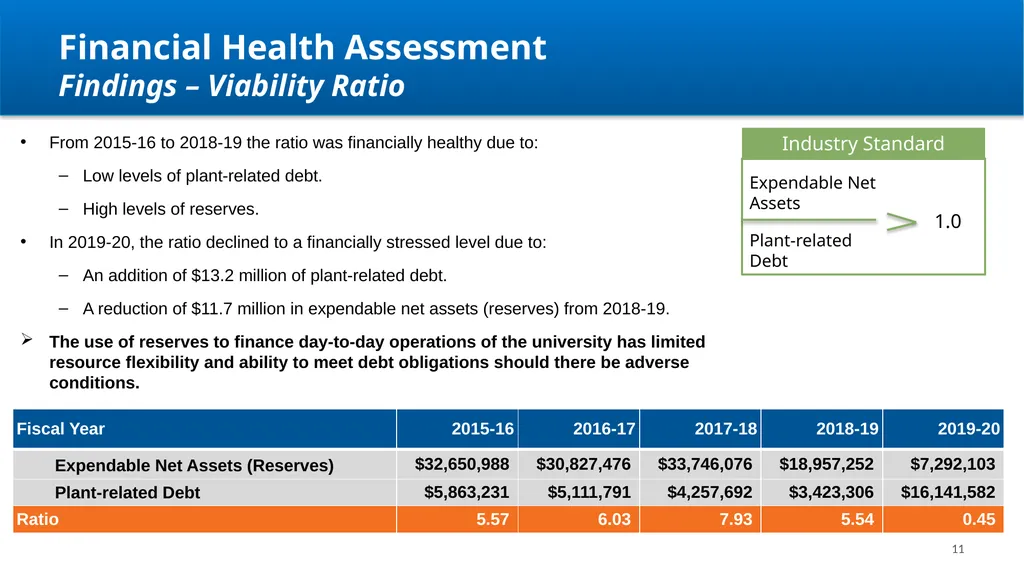
11 From 2015-16 to 2018-19 the ratio was financially healthy due to:
Low levels of plant-related debt.
High levels of reserves.
In 2019-20, the ratio declined to a financially stressed level due to:
An addition of $13.2 million of plant-related debt.
A reduction of $11.7 million in expendable net assets (reserves) from 2018-19.
The use of reserves to finance day-to-day operations of the university has limited resource flexibility and ability to meet debt obligations should there be adverse conditions. Expendable Net Assets Plant-related Debt 1.0 Industry Standard Financial Health Assessment Findings – Viability Ratio<br>
Low levels of plant-related debt.
High levels of reserves.
In 2019-20, the ratio declined to a financially stressed level due to:
An addition of $13.2 million of plant-related debt.
A reduction of $11.7 million in expendable net assets (reserves) from 2018-19.
The use of reserves to finance day-to-day operations of the university has limited resource flexibility and ability to meet debt obligations should there be adverse conditions. Expendable Net Assets Plant-related Debt 1.0 Industry Standard Financial Health Assessment Findings – Viability Ratio<br>
12
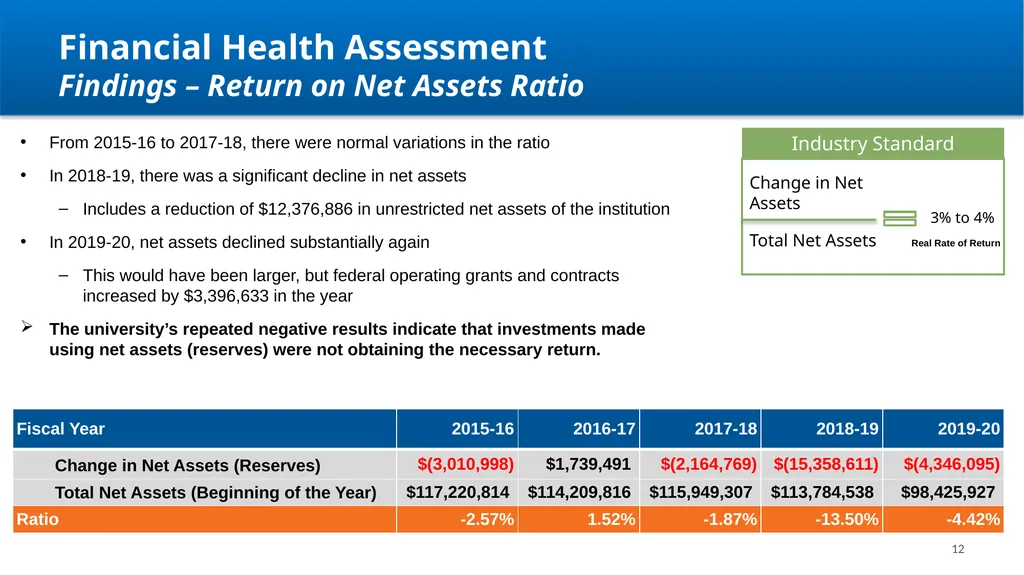
12 From 2015-16 to 2017-18, there were normal variations in the ratio
In 2018-19, there was a significant decline in net assets
Includes a reduction of $12,376,886 in unrestricted net assets of the institution
In 2019-20, net assets declined substantially again
This would have been larger, but federal operating grants and contracts increased by $3,396,633 in the year
The university’s repeated negative results indicate that investments made using net assets (reserves) were not obtaining the necessary return. 3% to 4% Industry Standard Change in Net Assets Total Net Assets Real Rate of Return Financial Health Assessment Findings – Return on Net Assets Ratio<br>
In 2018-19, there was a significant decline in net assets
Includes a reduction of $12,376,886 in unrestricted net assets of the institution
In 2019-20, net assets declined substantially again
This would have been larger, but federal operating grants and contracts increased by $3,396,633 in the year
The university’s repeated negative results indicate that investments made using net assets (reserves) were not obtaining the necessary return. 3% to 4% Industry Standard Change in Net Assets Total Net Assets Real Rate of Return Financial Health Assessment Findings – Return on Net Assets Ratio<br>
13
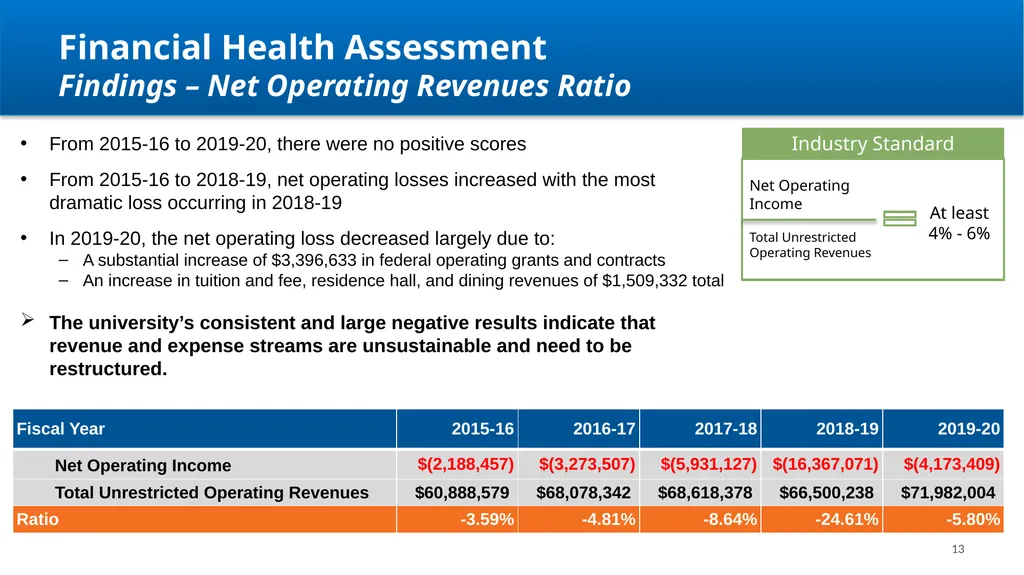
13 From 2015-16 to 2019-20, there were no positive scores
From 2015-16 to 2018-19, net operating losses increased with the most dramatic loss occurring in 2018-19
In 2019-20, the net operating loss decreased largely due to:
A substantial increase of $3,396,633 in federal operating grants and contracts
An increase in tuition and fee, residence hall, and dining revenues of $1,509,332 total
The university’s consistent and large negative results indicate that revenue and expense streams are unsustainable and need to be restructured. At least
4% - 6% Industry Standard Net Operating Income Total Unrestricted Operating Revenues Financial Health Assessment Findings – Net Operating Revenues Ratio<br>
From 2015-16 to 2018-19, net operating losses increased with the most dramatic loss occurring in 2018-19
In 2019-20, the net operating loss decreased largely due to:
A substantial increase of $3,396,633 in federal operating grants and contracts
An increase in tuition and fee, residence hall, and dining revenues of $1,509,332 total
The university’s consistent and large negative results indicate that revenue and expense streams are unsustainable and need to be restructured. At least
4% - 6% Industry Standard Net Operating Income Total Unrestricted Operating Revenues Financial Health Assessment Findings – Net Operating Revenues Ratio<br>
14
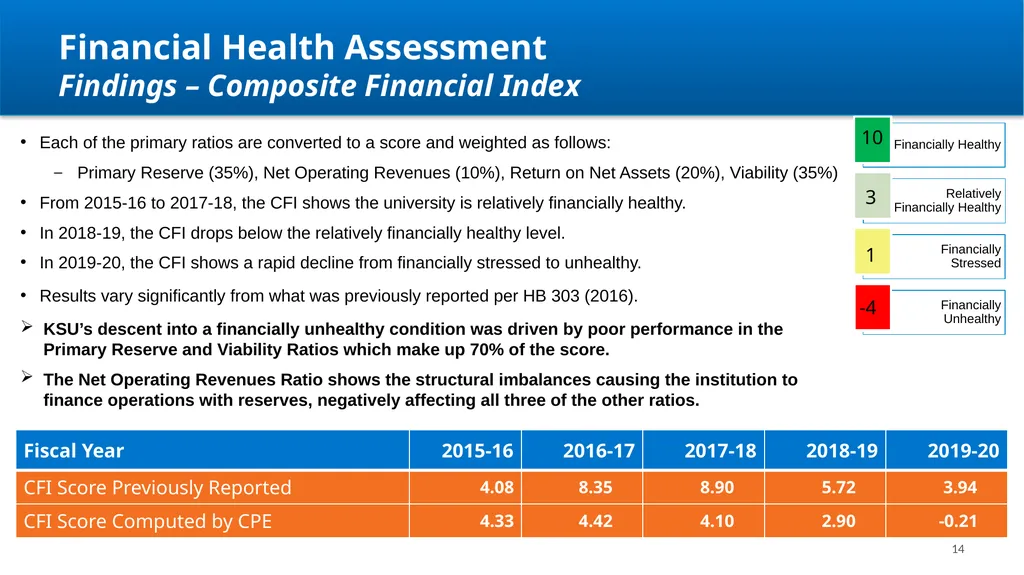
14 Each of the primary ratios are converted to a score and weighted as follows:
Primary Reserve (35%), Net Operating Revenues (10%), Return on Net Assets (20%), Viability (35%)
From 2015-16 to 2017-18, the CFI shows the university is relatively financially healthy.
In 2018-19, the CFI drops below the relatively financially healthy level.
In 2019-20, the CFI shows a rapid decline from financially stressed to unhealthy.
Results vary significantly from what was previously reported per HB 303 (2016).
KSU’s descent into a financially unhealthy condition was driven by poor performance in the Primary Reserve and Viability Ratios which make up 70% of the score.
The Net Operating Revenues Ratio shows the structural imbalances causing the institution to finance operations with reserves, negatively affecting all three of the other ratios. Financial Health Assessment Findings – Composite Financial Index<br>
Primary Reserve (35%), Net Operating Revenues (10%), Return on Net Assets (20%), Viability (35%)
From 2015-16 to 2017-18, the CFI shows the university is relatively financially healthy.
In 2018-19, the CFI drops below the relatively financially healthy level.
In 2019-20, the CFI shows a rapid decline from financially stressed to unhealthy.
Results vary significantly from what was previously reported per HB 303 (2016).
KSU’s descent into a financially unhealthy condition was driven by poor performance in the Primary Reserve and Viability Ratios which make up 70% of the score.
The Net Operating Revenues Ratio shows the structural imbalances causing the institution to finance operations with reserves, negatively affecting all three of the other ratios. Financial Health Assessment Findings – Composite Financial Index<br>
15
15 Peer Group Comparisons
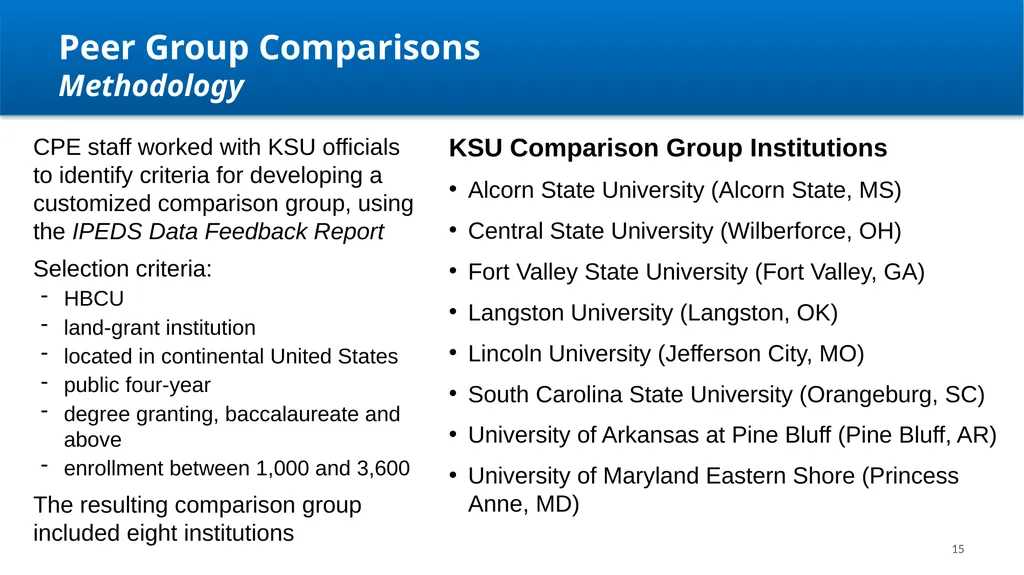
Methodology CPE staff worked with KSU officials to identify criteria for developing a customized comparison group, using the IPEDS Data Feedback Report
Selection criteria:
HBCU
land-grant institution
located in continental United States
public four-year
degree granting, baccalaureate and above
enrollment between 1,000 and 3,600
The resulting comparison group included eight institutions KSU Comparison Group Institutions
Alcorn State University (Alcorn State, MS)
Central State University (Wilberforce, OH)
Fort Valley State University (Fort Valley, GA)
Langston University (Langston, OK)
Lincoln University (Jefferson City, MO)
South Carolina State University (Orangeburg, SC)
University of Arkansas at Pine Bluff (Pine Bluff, AR)
University of Maryland Eastern Shore (Princess Anne, MD)<br>
Selection criteria:
HBCU
land-grant institution
located in continental United States
public four-year
degree granting, baccalaureate and above
enrollment between 1,000 and 3,600
The resulting comparison group included eight institutions KSU Comparison Group Institutions
Alcorn State University (Alcorn State, MS)
Central State University (Wilberforce, OH)
Fort Valley State University (Fort Valley, GA)
Langston University (Langston, OK)
Lincoln University (Jefferson City, MO)
South Carolina State University (Orangeburg, SC)
University of Arkansas at Pine Bluff (Pine Bluff, AR)
University of Maryland Eastern Shore (Princess Anne, MD)<br>
16
16 Peer Group Comparisons
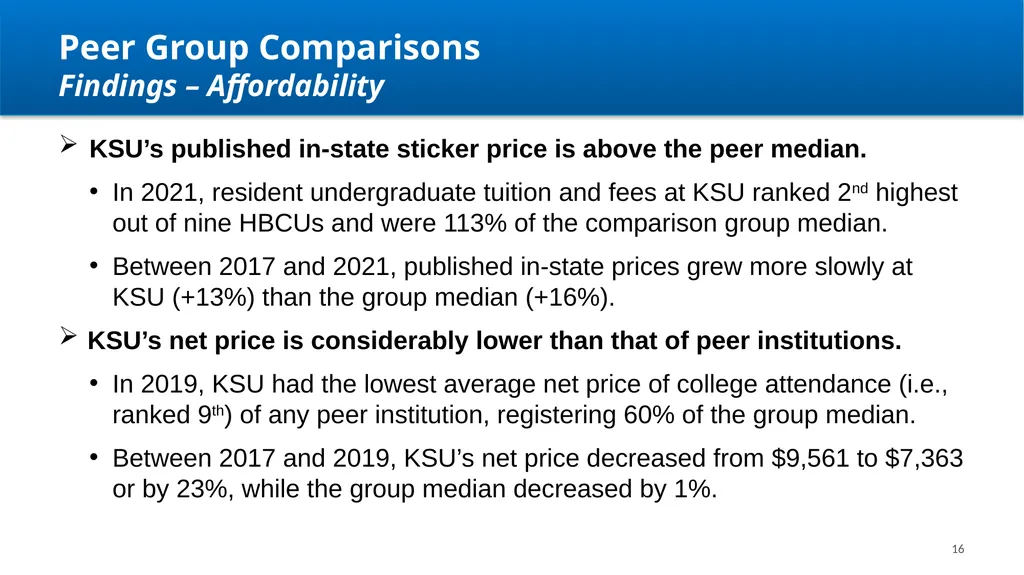
Findings – Affordability KSU’s published in-state sticker price is above the peer median.
In 2021, resident undergraduate tuition and fees at KSU ranked 2nd highest out of nine HBCUs and were 113% of the comparison group median.
Between 2017 and 2021, published in-state prices grew more slowly at KSU (+13%) than the group median (+16%).
KSU’s net price is considerably lower than that of peer institutions.
In 2019, KSU had the lowest average net price of college attendance (i.e., ranked 9th) of any peer institution, registering 60% of the group median.
Between 2017 and 2019, KSU’s net price decreased from $9,561 to $7,363 or by 23%, while the group median decreased by 1%.<br>
In 2021, resident undergraduate tuition and fees at KSU ranked 2nd highest out of nine HBCUs and were 113% of the comparison group median.
Between 2017 and 2021, published in-state prices grew more slowly at KSU (+13%) than the group median (+16%).
KSU’s net price is considerably lower than that of peer institutions.
In 2019, KSU had the lowest average net price of college attendance (i.e., ranked 9th) of any peer institution, registering 60% of the group median.
Between 2017 and 2019, KSU’s net price decreased from $9,561 to $7,363 or by 23%, while the group median decreased by 1%.<br>
17
17 Peer Group Comparisons
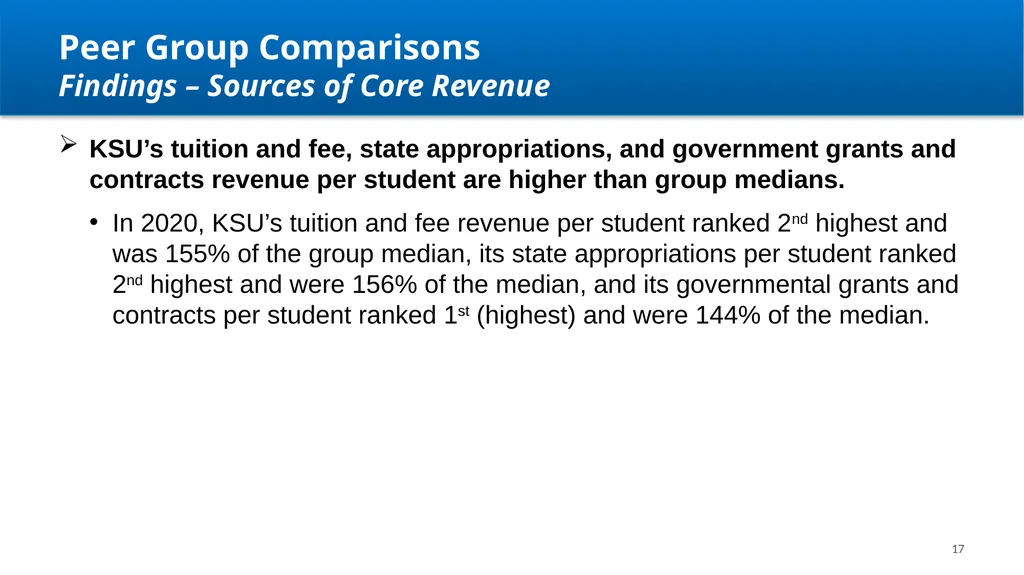
Findings – Sources of Core Revenue KSU’s tuition and fee, state appropriations, and government grants and contracts revenue per student are higher than group medians.
In 2020, KSU’s tuition and fee revenue per student ranked 2nd highest and was 155% of the group median, its state appropriations per student ranked 2nd highest and were 156% of the median, and its governmental grants and contracts per student ranked 1st (highest) and were 144% of the median.<br>
In 2020, KSU’s tuition and fee revenue per student ranked 2nd highest and was 155% of the group median, its state appropriations per student ranked 2nd highest and were 156% of the median, and its governmental grants and contracts per student ranked 1st (highest) and were 144% of the median.<br>
18
18 Peer Group Comparisons
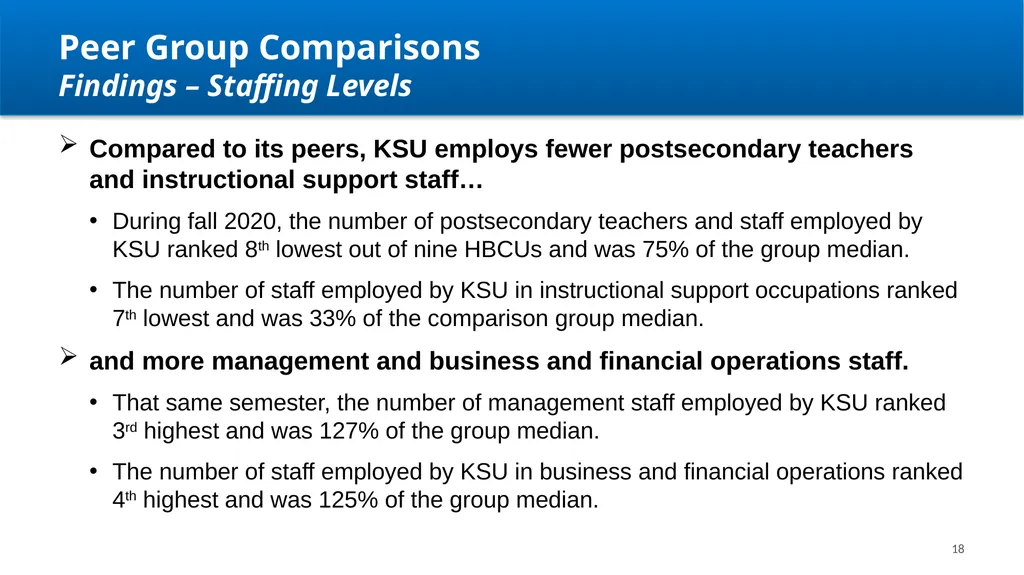
Findings – Staffing Levels Compared to its peers, KSU employs fewer postsecondary teachers and instructional support staff…
During fall 2020, the number of postsecondary teachers and staff employed by KSU ranked 8th lowest out of nine HBCUs and was 75% of the group median.
The number of staff employed by KSU in instructional support occupations ranked 7th lowest and was 33% of the comparison group median.
and more management and business and financial operations staff.
That same semester, the number of management staff employed by KSU ranked 3rd highest and was 127% of the group median.
The number of staff employed by KSU in business and financial operations ranked 4th highest and was 125% of the group median.<br>
During fall 2020, the number of postsecondary teachers and staff employed by KSU ranked 8th lowest out of nine HBCUs and was 75% of the group median.
The number of staff employed by KSU in instructional support occupations ranked 7th lowest and was 33% of the comparison group median.
and more management and business and financial operations staff.
That same semester, the number of management staff employed by KSU ranked 3rd highest and was 127% of the group median.
The number of staff employed by KSU in business and financial operations ranked 4th highest and was 125% of the group median.<br>
19
19 Peer Group Comparisons
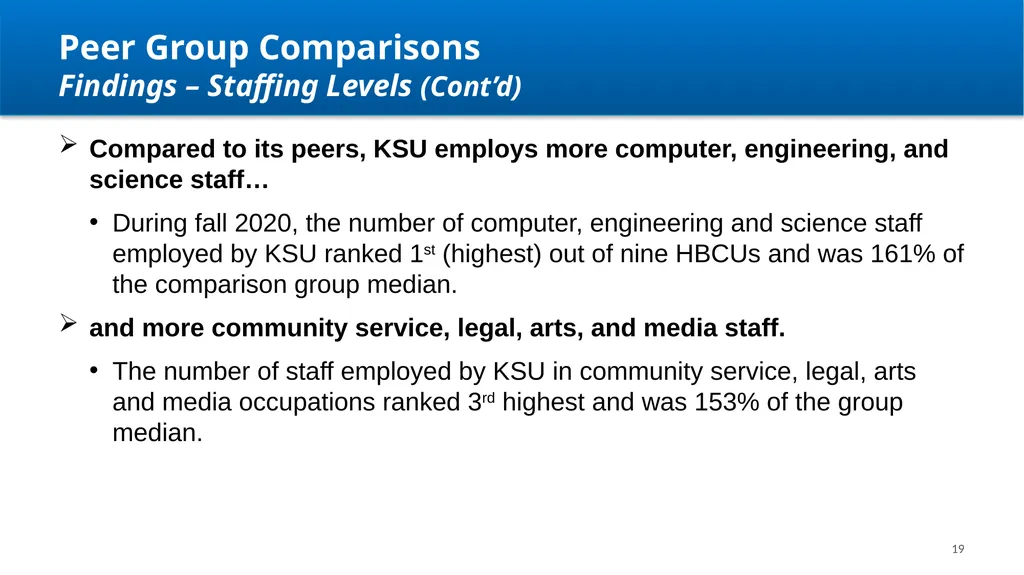
Findings – Staffing Levels (Cont’d) Compared to its peers, KSU employs more computer, engineering, and science staff…
During fall 2020, the number of computer, engineering and science staff employed by KSU ranked 1st (highest) out of nine HBCUs and was 161% of the comparison group median.
and more community service, legal, arts, and media staff.
The number of staff employed by KSU in community service, legal, arts and media occupations ranked 3rd highest and was 153% of the group median.<br>
During fall 2020, the number of computer, engineering and science staff employed by KSU ranked 1st (highest) out of nine HBCUs and was 161% of the comparison group median.
and more community service, legal, arts, and media staff.
The number of staff employed by KSU in community service, legal, arts and media occupations ranked 3rd highest and was 153% of the group median.<br>
20
20 Peer Group Comparisons
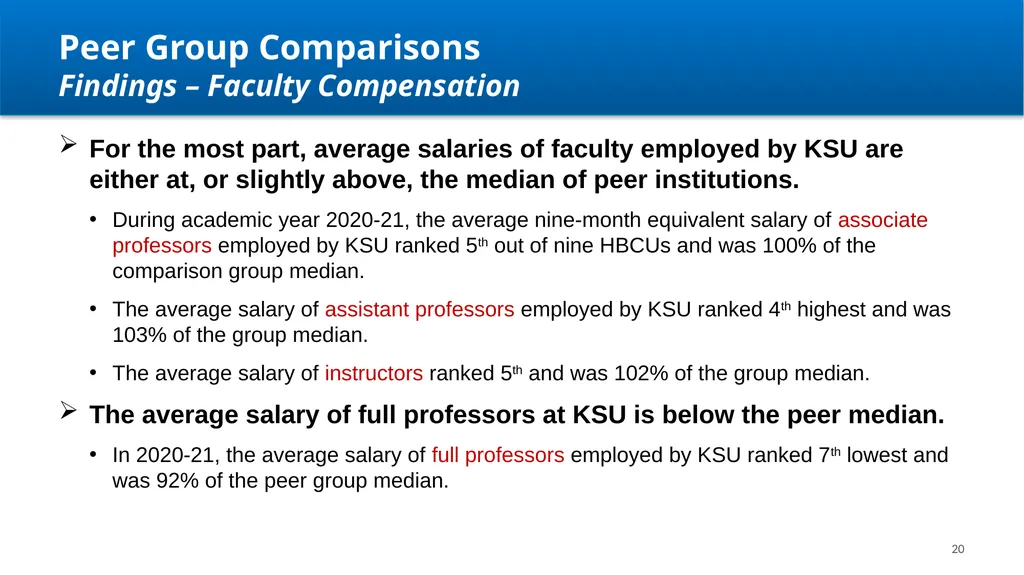
Findings – Faculty Compensation For the most part, average salaries of faculty employed by KSU are either at, or slightly above, the median of peer institutions.
During academic year 2020-21, the average nine-month equivalent salary of associate professors employed by KSU ranked 5th out of nine HBCUs and was 100% of the comparison group median.
The average salary of assistant professors employed by KSU ranked 4th highest and was 103% of the group median.
The average salary of instructors ranked 5th and was 102% of the group median.
The average salary of full professors at KSU is below the peer median.
In 2020-21, the average salary of full professors employed by KSU ranked 7th lowest and was 92% of the peer group median.<br>
During academic year 2020-21, the average nine-month equivalent salary of associate professors employed by KSU ranked 5th out of nine HBCUs and was 100% of the comparison group median.
The average salary of assistant professors employed by KSU ranked 4th highest and was 103% of the group median.
The average salary of instructors ranked 5th and was 102% of the group median.
The average salary of full professors at KSU is below the peer median.
In 2020-21, the average salary of full professors employed by KSU ranked 7th lowest and was 92% of the peer group median.<br>
21
21 Peer Group Comparisons
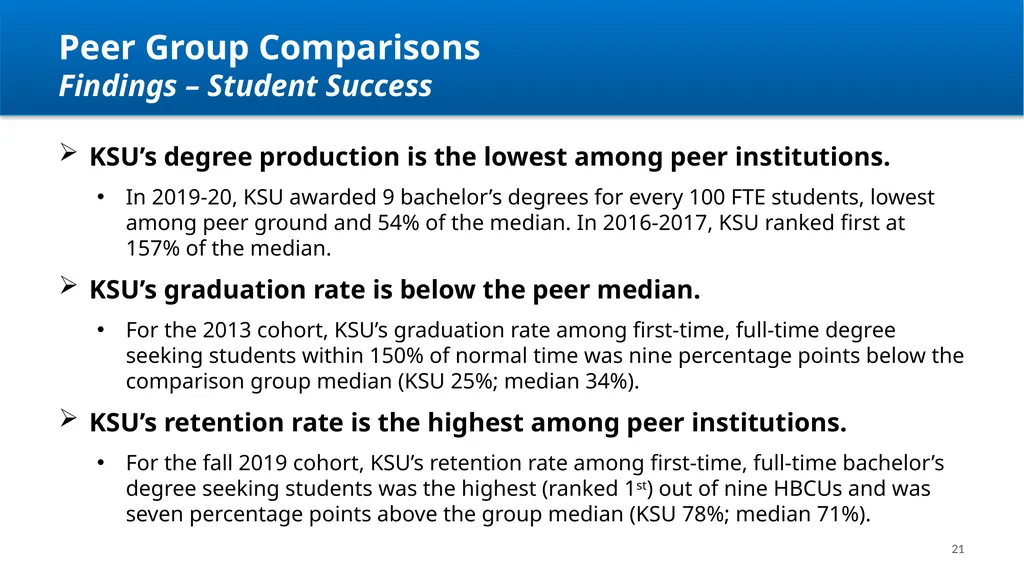
Findings – Student Success KSU’s degree production is the lowest among peer institutions.
In 2019-20, KSU awarded 9 bachelor’s degrees for every 100 FTE students, lowest among peer ground and 54% of the median. In 2016-2017, KSU ranked first at 157% of the median.
KSU’s graduation rate is below the peer median.
For the 2013 cohort, KSU’s graduation rate among first-time, full-time degree seeking students within 150% of normal time was nine percentage points below the comparison group median (KSU 25%; median 34%).
KSU’s retention rate is the highest among peer institutions.
For the fall 2019 cohort, KSU’s retention rate among first-time, full-time bachelor’s degree seeking students was the highest (ranked 1st) out of nine HBCUs and was seven percentage points above the group median (KSU 78%; median 71%).<br>
In 2019-20, KSU awarded 9 bachelor’s degrees for every 100 FTE students, lowest among peer ground and 54% of the median. In 2016-2017, KSU ranked first at 157% of the median.
KSU’s graduation rate is below the peer median.
For the 2013 cohort, KSU’s graduation rate among first-time, full-time degree seeking students within 150% of normal time was nine percentage points below the comparison group median (KSU 25%; median 34%).
KSU’s retention rate is the highest among peer institutions.
For the fall 2019 cohort, KSU’s retention rate among first-time, full-time bachelor’s degree seeking students was the highest (ranked 1st) out of nine HBCUs and was seven percentage points above the group median (KSU 78%; median 71%).<br>
22
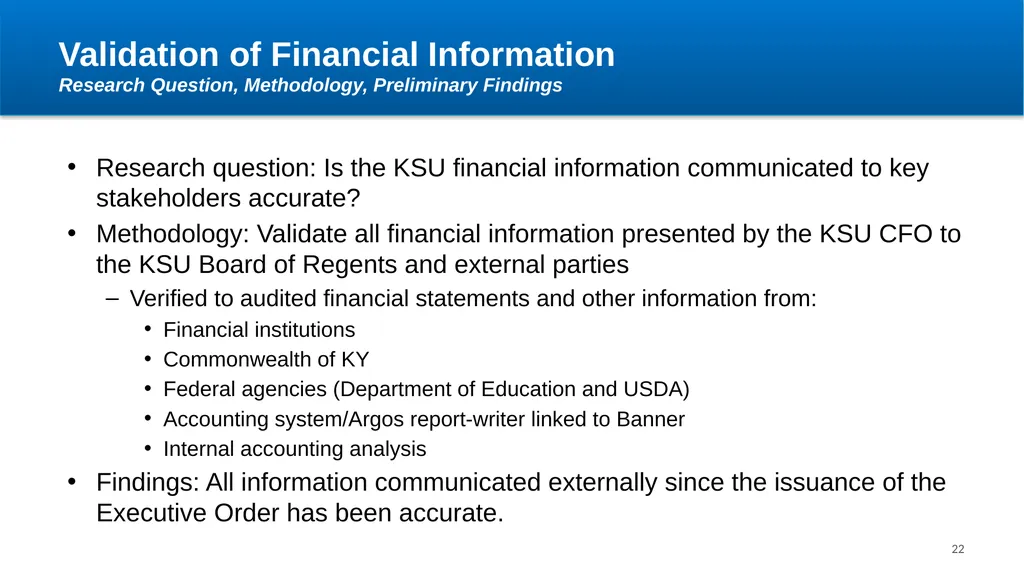
Validation of Financial Information
Research Question, Methodology, Preliminary Findings Research question: Is the KSU financial information communicated to key stakeholders accurate?
Methodology: Validate all financial information presented by the KSU CFO to the KSU Board of Regents and external parties
Verified to audited financial statements and other information from:
Financial institutions
Commonwealth of KY
Federal agencies (Department of Education and USDA)
Accounting system/Argos report-writer linked to Banner
Internal accounting analysis
Findings: All information communicated externally since the issuance of the Executive Order has been accurate. 22<br>
Methodology: Validate all financial information presented by the KSU CFO to the KSU Board of Regents and external parties
Verified to audited financial statements and other information from:
Financial institutions
Commonwealth of KY
Federal agencies (Department of Education and USDA)
Accounting system/Argos report-writer linked to Banner
Internal accounting analysis
Findings: All information communicated externally since the issuance of the Executive Order has been accurate. 22<br>
23
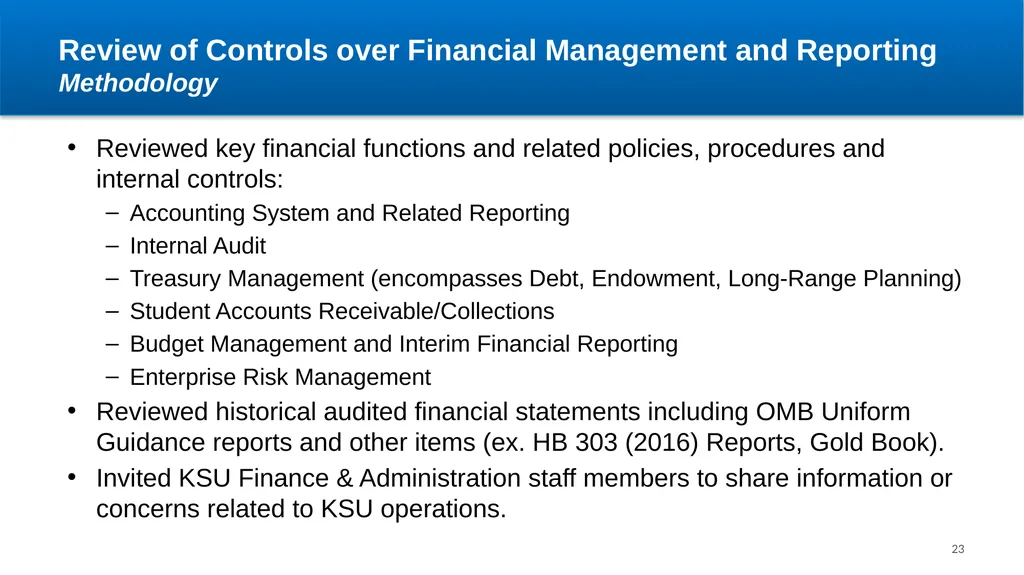
Review of Controls over Financial Management and Reporting
Methodology Reviewed key financial functions and related policies, procedures and internal controls:
Accounting System and Related Reporting
Internal Audit
Treasury Management (encompasses Debt, Endowment, Long-Range Planning)
Student Accounts Receivable/Collections
Budget Management and Interim Financial Reporting
Enterprise Risk Management
Reviewed historical audited financial statements including OMB Uniform Guidance reports and other items (ex. HB 303 (2016) Reports, Gold Book).
Invited KSU Finance & Administration staff members to share information or concerns related to KSU operations. 23<br>
Accounting System and Related Reporting
Internal Audit
Treasury Management (encompasses Debt, Endowment, Long-Range Planning)
Student Accounts Receivable/Collections
Budget Management and Interim Financial Reporting
Enterprise Risk Management
Reviewed historical audited financial statements including OMB Uniform Guidance reports and other items (ex. HB 303 (2016) Reports, Gold Book).
Invited KSU Finance & Administration staff members to share information or concerns related to KSU operations. 23<br>
24
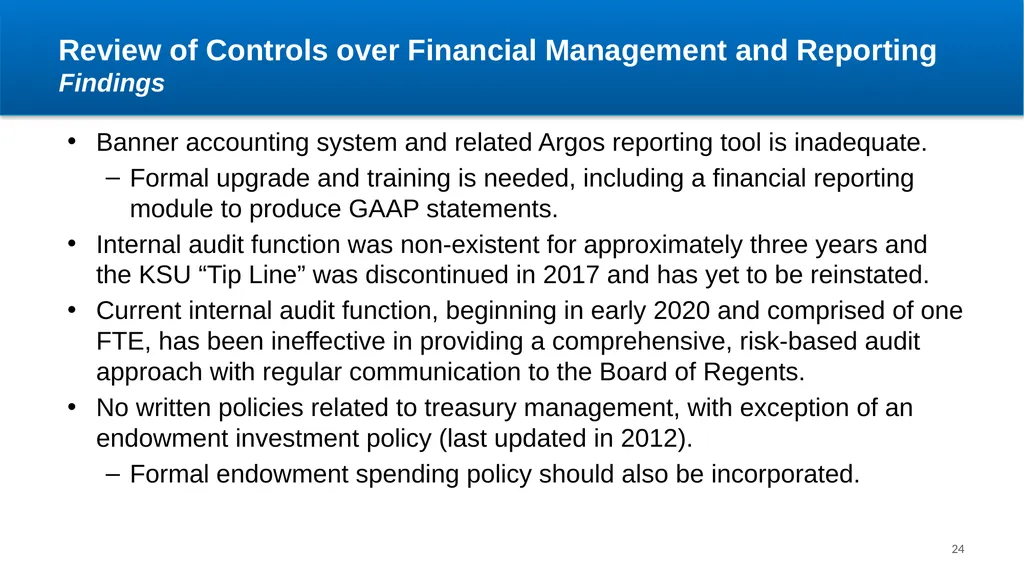
Review of Controls over Financial Management and Reporting
Findings Banner accounting system and related Argos reporting tool is inadequate.
Formal upgrade and training is needed, including a financial reporting module to produce GAAP statements.
Internal audit function was non-existent for approximately three years and the KSU “Tip Line” was discontinued in 2017 and has yet to be reinstated.
Current internal audit function, beginning in early 2020 and comprised of one FTE, has been ineffective in providing a comprehensive, risk-based audit approach with regular communication to the Board of Regents.
No written policies related to treasury management, with exception of an endowment investment policy (last updated in 2012).
Formal endowment spending policy should also be incorporated. 24<br>
Formal upgrade and training is needed, including a financial reporting module to produce GAAP statements.
Internal audit function was non-existent for approximately three years and the KSU “Tip Line” was discontinued in 2017 and has yet to be reinstated.
Current internal audit function, beginning in early 2020 and comprised of one FTE, has been ineffective in providing a comprehensive, risk-based audit approach with regular communication to the Board of Regents.
No written policies related to treasury management, with exception of an endowment investment policy (last updated in 2012).
Formal endowment spending policy should also be incorporated. 24<br>
25
Review of Controls over Financial Management and Reporting
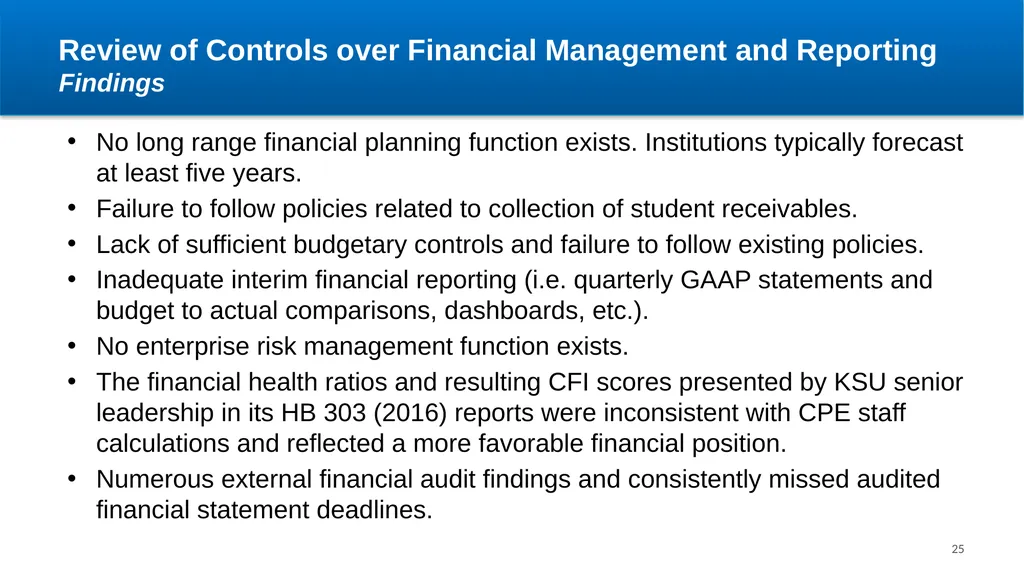
Findings No long range financial planning function exists. Institutions typically forecast at least five years.
Failure to follow policies related to collection of student receivables.
Lack of sufficient budgetary controls and failure to follow existing policies.
Inadequate interim financial reporting (i.e. quarterly GAAP statements and budget to actual comparisons, dashboards, etc.).
No enterprise risk management function exists.
The financial health ratios and resulting CFI scores presented by KSU senior leadership in its HB 303 (2016) reports were inconsistent with CPE staff calculations and reflected a more favorable financial position.
Numerous external financial audit findings and consistently missed audited financial statement deadlines. 25<br>
Failure to follow policies related to collection of student receivables.
Lack of sufficient budgetary controls and failure to follow existing policies.
Inadequate interim financial reporting (i.e. quarterly GAAP statements and budget to actual comparisons, dashboards, etc.).
No enterprise risk management function exists.
The financial health ratios and resulting CFI scores presented by KSU senior leadership in its HB 303 (2016) reports were inconsistent with CPE staff calculations and reflected a more favorable financial position.
Numerous external financial audit findings and consistently missed audited financial statement deadlines. 25<br>
26
Budget Request to Cover FY 2022 Projected Cash Shortfall and
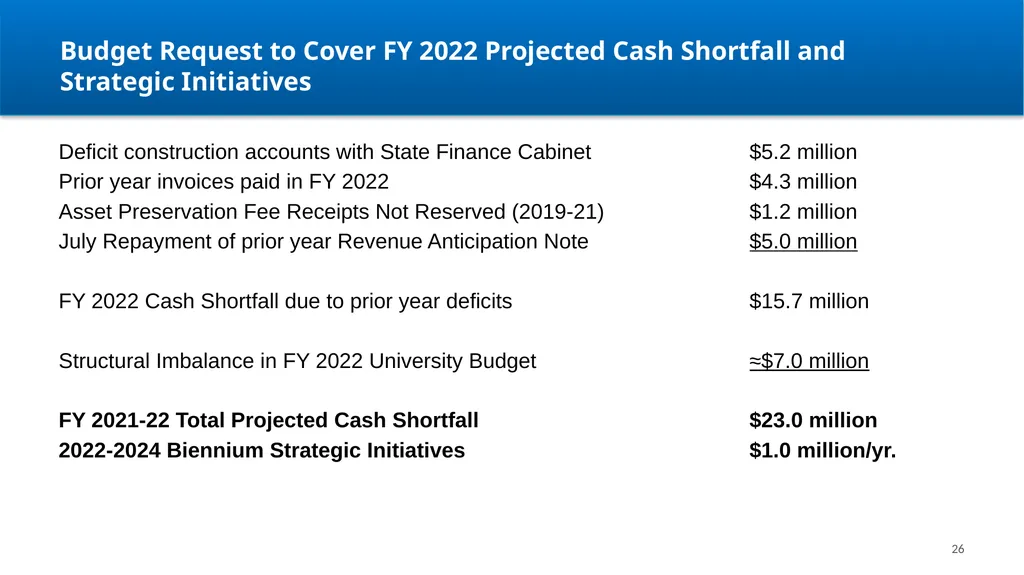
Strategic Initiatives 26 Deficit construction accounts with State Finance Cabinet $5.2 million
Prior year invoices paid in FY 2022 $4.3 million
Asset Preservation Fee Receipts Not Reserved (2019-21) $1.2 million
July Repayment of prior year Revenue Anticipation Note $5.0 million
FY 2022 Cash Shortfall due to prior year deficits $15.7 million
Structural Imbalance in FY 2022 University Budget ≈$7.0 million
FY 2021-22 Total Projected Cash Shortfall $23.0 million
2022-2024 Biennium Strategic Initiatives $1.0 million/yr.<br>
Prior year invoices paid in FY 2022 $4.3 million
Asset Preservation Fee Receipts Not Reserved (2019-21) $1.2 million
July Repayment of prior year Revenue Anticipation Note $5.0 million
FY 2022 Cash Shortfall due to prior year deficits $15.7 million
Structural Imbalance in FY 2022 University Budget ≈$7.0 million
FY 2021-22 Total Projected Cash Shortfall $23.0 million
2022-2024 Biennium Strategic Initiatives $1.0 million/yr.<br>
27
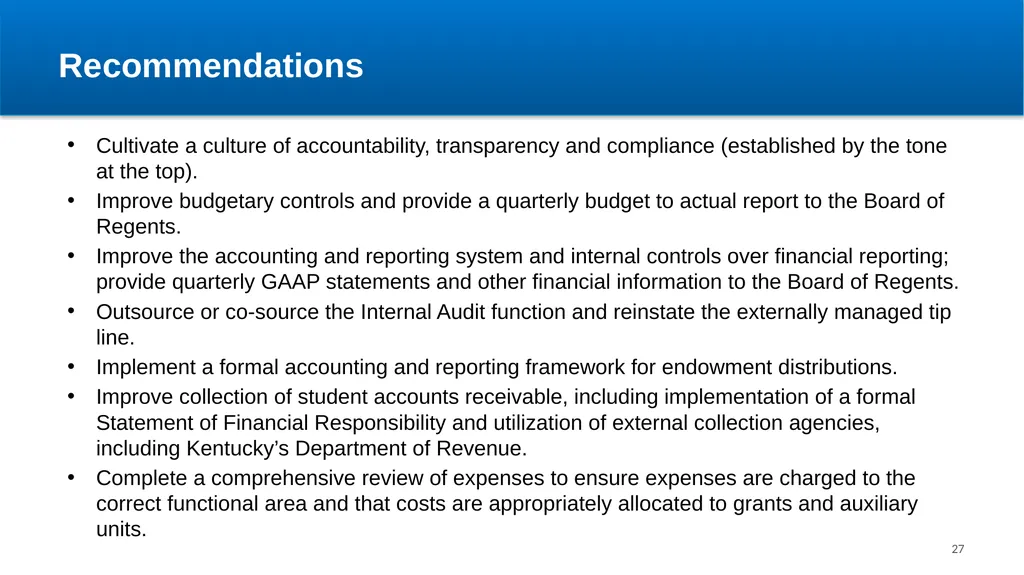
Recommendations Cultivate a culture of accountability, transparency and compliance (established by the tone at the top).
Improve budgetary controls and provide a quarterly budget to actual report to the Board of Regents.
Improve the accounting and reporting system and internal controls over financial reporting; provide quarterly GAAP statements and other financial information to the Board of Regents.
Outsource or co-source the Internal Audit function and reinstate the externally managed tip line.
Implement a formal accounting and reporting framework for endowment distributions.
Improve collection of student accounts receivable, including implementation of a formal Statement of Financial Responsibility and utilization of external collection agencies, including Kentucky’s Department of Revenue.
Complete a comprehensive review of expenses to ensure expenses are charged to the correct functional area and that costs are appropriately allocated to grants and auxiliary units. 27<br>
Improve budgetary controls and provide a quarterly budget to actual report to the Board of Regents.
Improve the accounting and reporting system and internal controls over financial reporting; provide quarterly GAAP statements and other financial information to the Board of Regents.
Outsource or co-source the Internal Audit function and reinstate the externally managed tip line.
Implement a formal accounting and reporting framework for endowment distributions.
Improve collection of student accounts receivable, including implementation of a formal Statement of Financial Responsibility and utilization of external collection agencies, including Kentucky’s Department of Revenue.
Complete a comprehensive review of expenses to ensure expenses are charged to the correct functional area and that costs are appropriately allocated to grants and auxiliary units. 27<br>
28
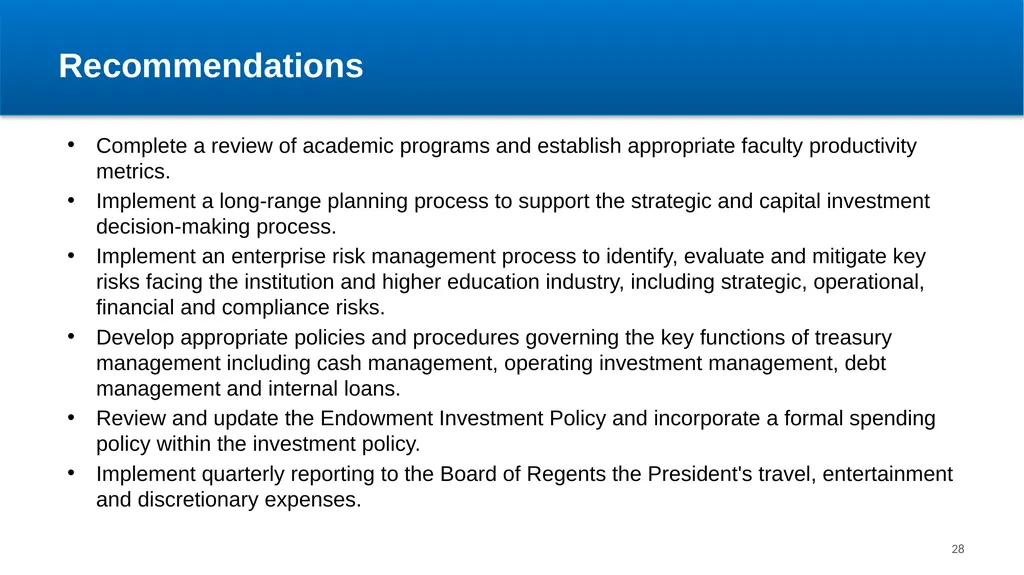
Recommendations Complete a review of academic programs and establish appropriate faculty productivity metrics.
Implement a long-range planning process to support the strategic and capital investment decision-making process.
Implement an enterprise risk management process to identify, evaluate and mitigate key risks facing the institution and higher education industry, including strategic, operational, financial and compliance risks.
Develop appropriate policies and procedures governing the key functions of treasury management including cash management, operating investment management, debt management and internal loans.
Review and update the Endowment Investment Policy and incorporate a formal spending policy within the investment policy.
Implement quarterly reporting to the Board of Regents the President's travel, entertainment and discretionary expenses. 28<br>
Implement a long-range planning process to support the strategic and capital investment decision-making process.
Implement an enterprise risk management process to identify, evaluate and mitigate key risks facing the institution and higher education industry, including strategic, operational, financial and compliance risks.
Develop appropriate policies and procedures governing the key functions of treasury management including cash management, operating investment management, debt management and internal loans.
Review and update the Endowment Investment Policy and incorporate a formal spending policy within the investment policy.
Implement quarterly reporting to the Board of Regents the President's travel, entertainment and discretionary expenses. 28<br>
29
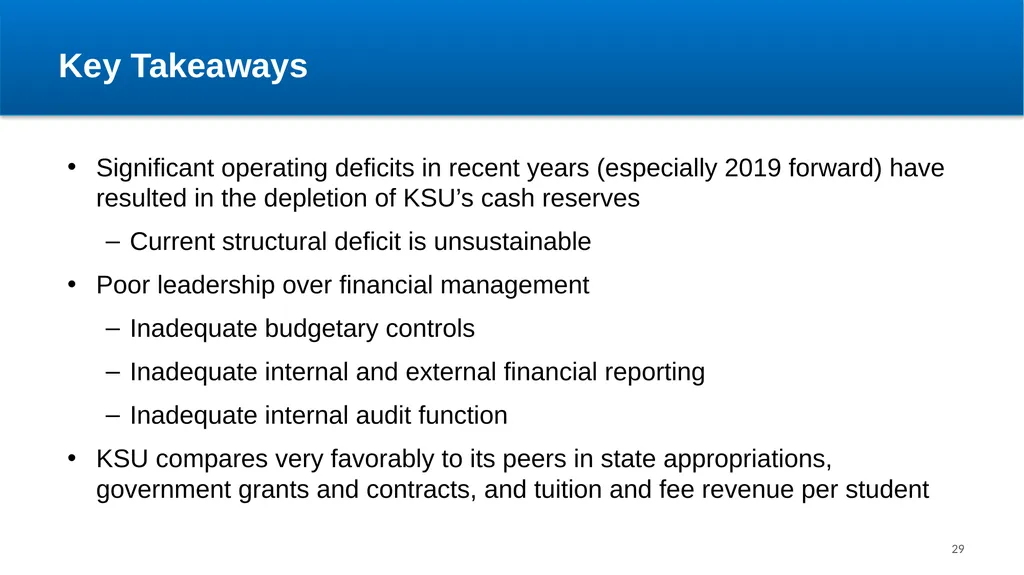
Key Takeaways Significant operating deficits in recent years (especially 2019 forward) have resulted in the depletion of KSU’s cash reserves
Current structural deficit is unsustainable
Poor leadership over financial management
Inadequate budgetary controls
Inadequate internal and external financial reporting
Inadequate internal audit function
KSU compares very favorably to its peers in state appropriations, government grants and contracts, and tuition and fee revenue per student 29<br>
Current structural deficit is unsustainable
Poor leadership over financial management
Inadequate budgetary controls
Inadequate internal and external financial reporting
Inadequate internal audit function
KSU compares very favorably to its peers in state appropriations, government grants and contracts, and tuition and fee revenue per student 29<br>
30
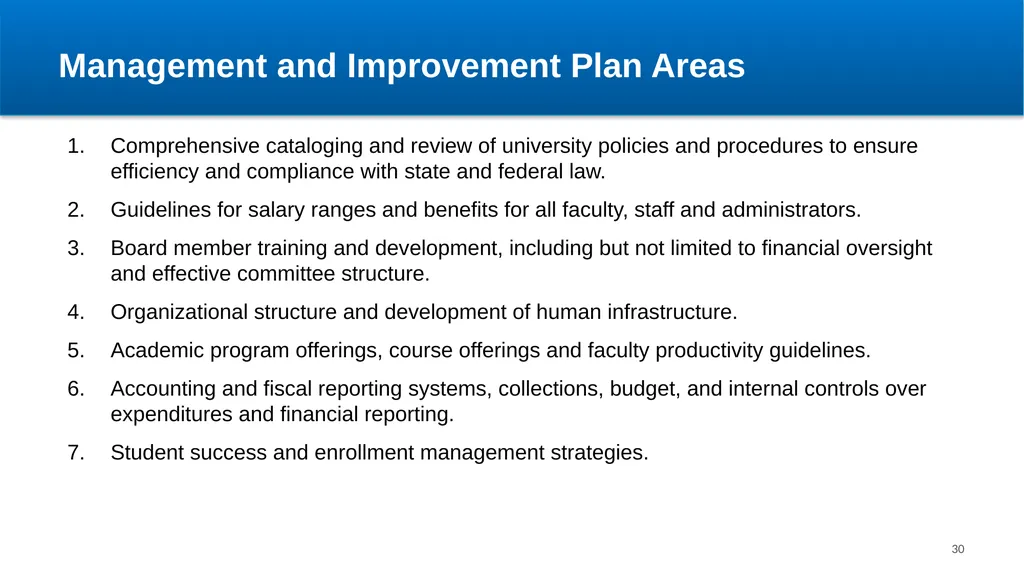
Management and Improvement Plan Areas Comprehensive cataloging and review of university policies and procedures to ensure efficiency and compliance with state and federal law.
Guidelines for salary ranges and benefits for all faculty, staff and administrators.
Board member training and development, including but not limited to financial oversight and effective committee structure.
Organizational structure and development of human infrastructure.
Academic program offerings, course offerings and faculty productivity guidelines.
Accounting and fiscal reporting systems, collections, budget, and internal controls over expenditures and financial reporting.
Student success and enrollment management strategies. 30<br>
Guidelines for salary ranges and benefits for all faculty, staff and administrators.
Board member training and development, including but not limited to financial oversight and effective committee structure.
Organizational structure and development of human infrastructure.
Academic program offerings, course offerings and faculty productivity guidelines.
Accounting and fiscal reporting systems, collections, budget, and internal controls over expenditures and financial reporting.
Student success and enrollment management strategies. 30<br>
31
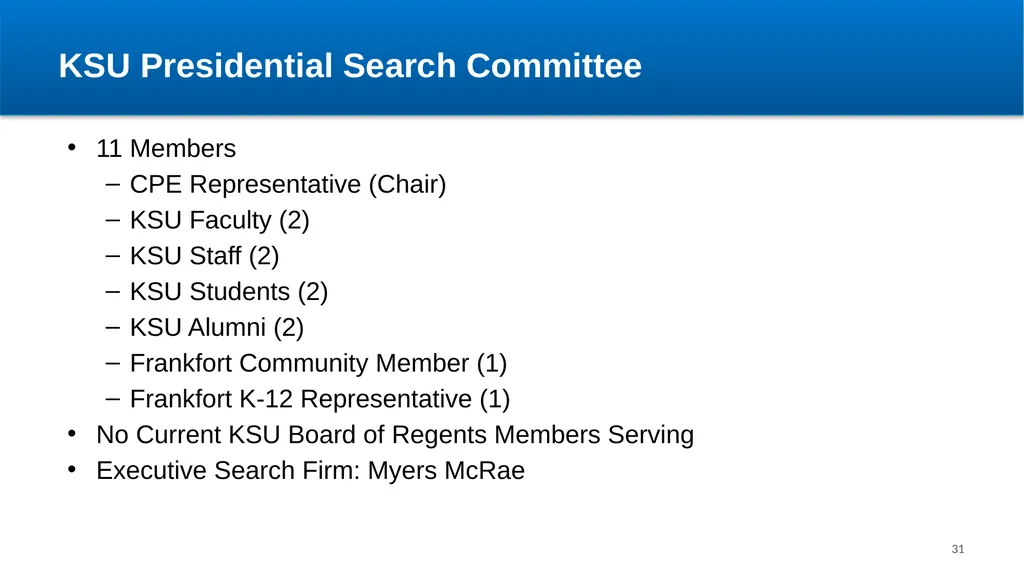
KSU Presidential Search Committee 11 Members
CPE Representative (Chair)
KSU Faculty (2)
KSU Staff (2)
KSU Students (2)
KSU Alumni (2)
Frankfort Community Member (1)
Frankfort K-12 Representative (1)
No Current KSU Board of Regents Members Serving
Executive Search Firm: Myers McRae 31<br>
CPE Representative (Chair)
KSU Faculty (2)
KSU Staff (2)
KSU Students (2)
KSU Alumni (2)
Frankfort Community Member (1)
Frankfort K-12 Representative (1)
No Current KSU Board of Regents Members Serving
Executive Search Firm: Myers McRae 31<br>
32
Questions?<br>