
Lecture 11: island biogeography hypothesis May 8,



Description: Lecture 11: island biogeography hypothesis May 8, 2017 Shannon calculation using Ln (loge) Species area curve observed relationship Hypothesized mechanism, i.e. IBH Preview of application announcements Reading Chap 14 agriculture Chap 11
Related Topics
Download Presentation
"Lecture 11: island biogeography hypothesis May 8," is the property of its rightful owner. Permission is granted to download and print the materials on this website for personal, non-commercial use only, and to display it on your personal computer provided you do not modify the materials and that you retain all copyright notices contained in the materials. By downloading content from our website, you accept the terms of this agreement.
Presentation Transcript
slide1. Lecture 11: island biogeography hypothesis
May 8, 2017 Shannon calculation using Ln (loge)
Species area curve – observed relationship
Hypothesized mechanism, i.e. IBH
Preview of application<br>
slide2. announcements Reading
Chap 14 agriculture
Chap 11 pollution, that follows from ag
Homeworks
#3: stream biodiversity in context (due Wed)
#4: Island biodiversity (due Wed May 17)
Quiz 2 – Mon May 22
Species area curves
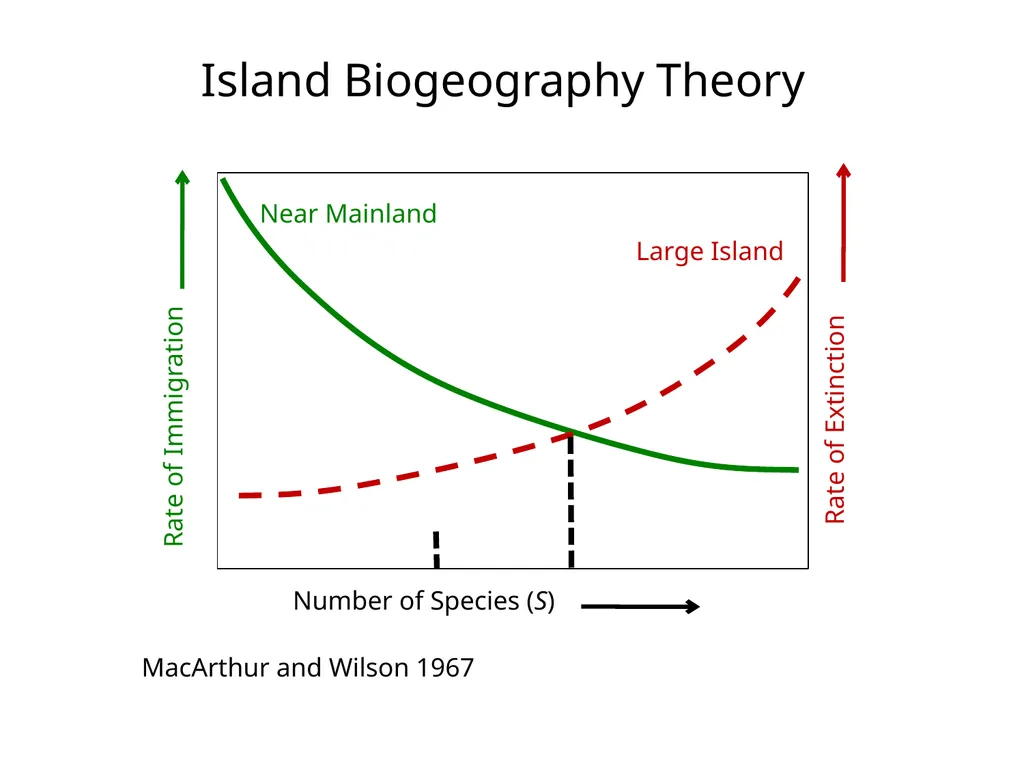
Mechanisms of island biodiversity<br>
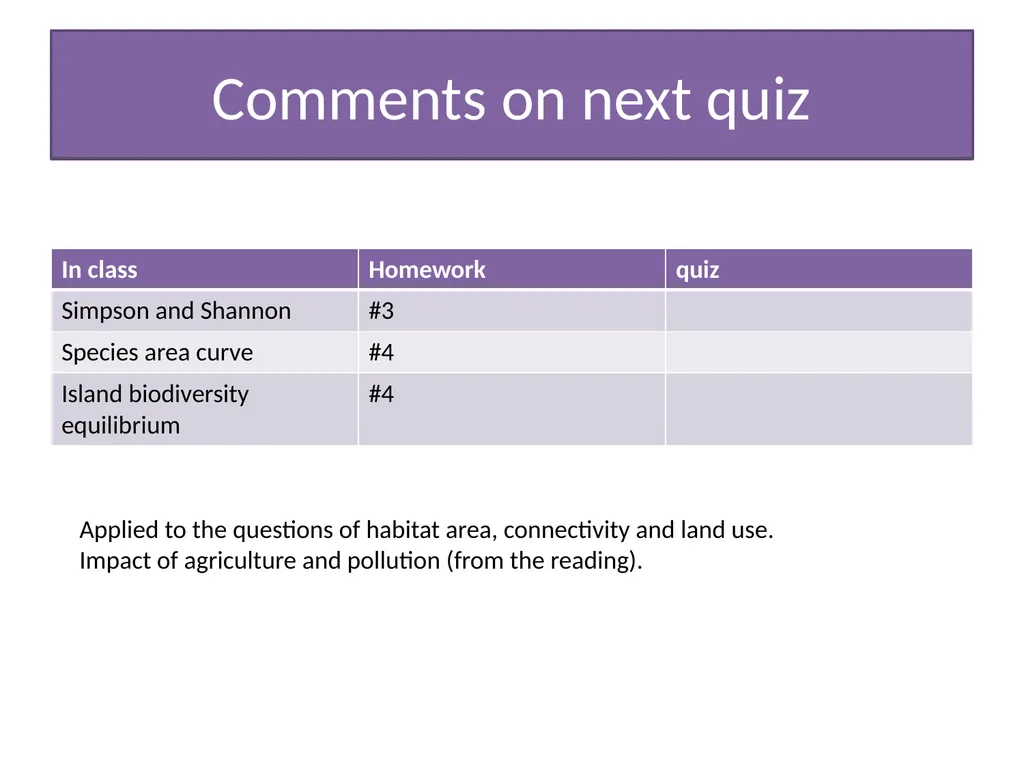
slide3. Comments on next quiz Applied to the questions of habitat area, connectivity and land use.
Impact of agriculture and pollution (from the reading).<br>
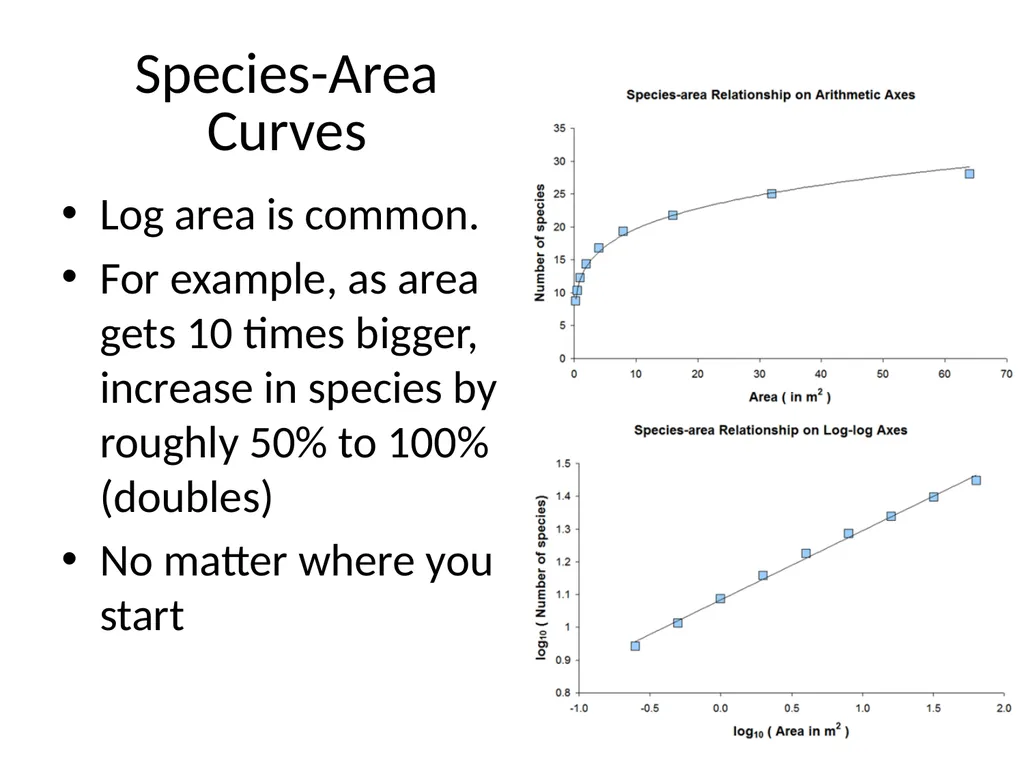
slide4. Species-Area Curves Log area is common.
For example, as area gets 10 times bigger, increase in species by roughly 50% to 100% (doubles)
No matter where you start<br>
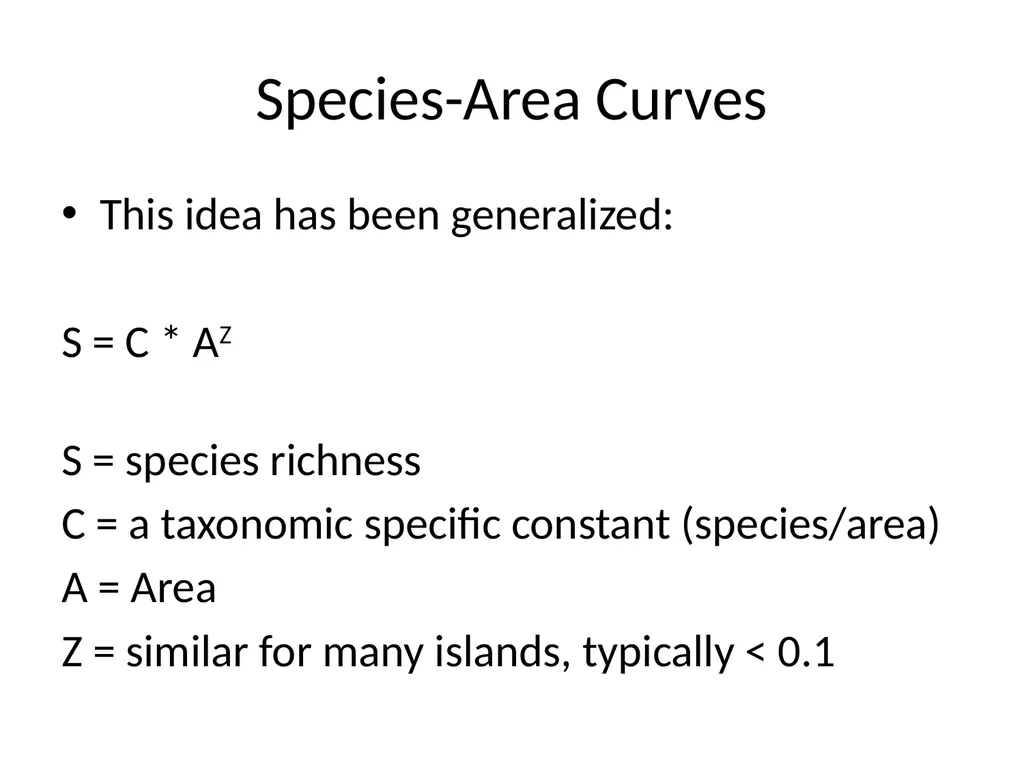
slide5. Species-Area Curves This idea has been generalized:
S = C * AZ
S = species richness
C = a taxonomic specific constant (species/area)
A = Area
Z = similar for many islands, typically < 0.1<br>
slide6. Species area curve S = C*Az C = .2 species/km^2
z = .3
11-1 Plot from 10 km^2 to 1000km^2<br>
slide7. Species area curve S = C*Az C = .2 species/km^2
z = .3
Plot from 10 km^2 to 1000km^2 Curve C 5
z 0.3
10 10.0
30 13.9
50 16.2
100 19.9
300 27.7
500 32.3
1000 39.7<br>
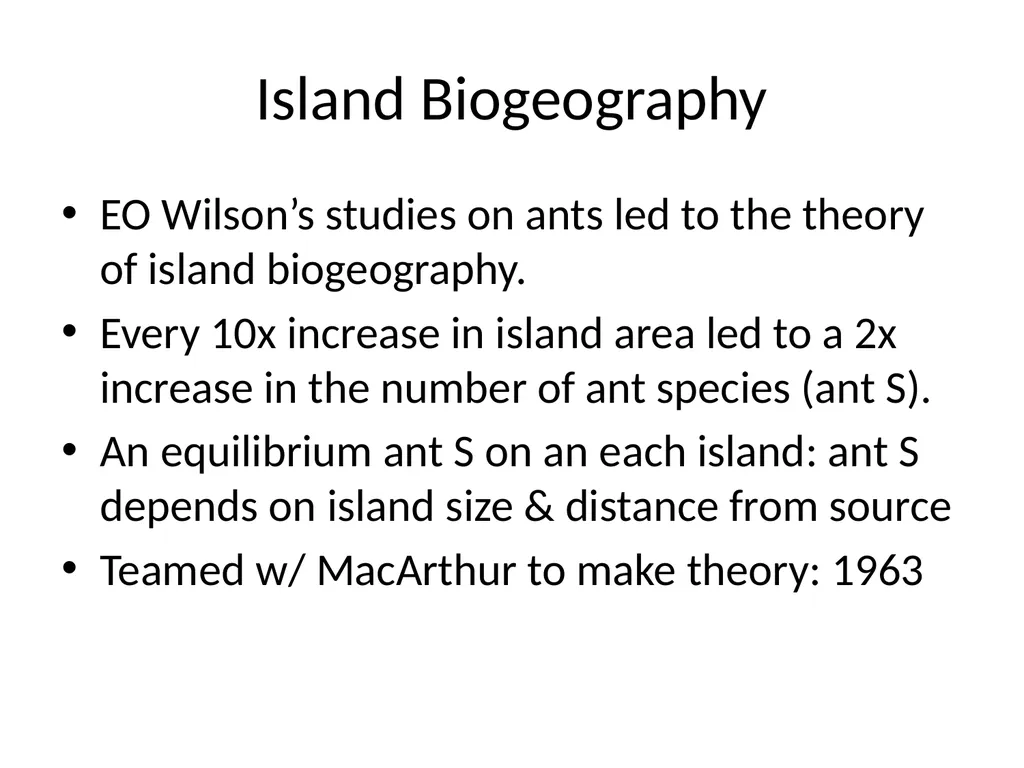
slide8. Island Biogeography EO Wilson’s studies on ants led to the theory of island biogeography.
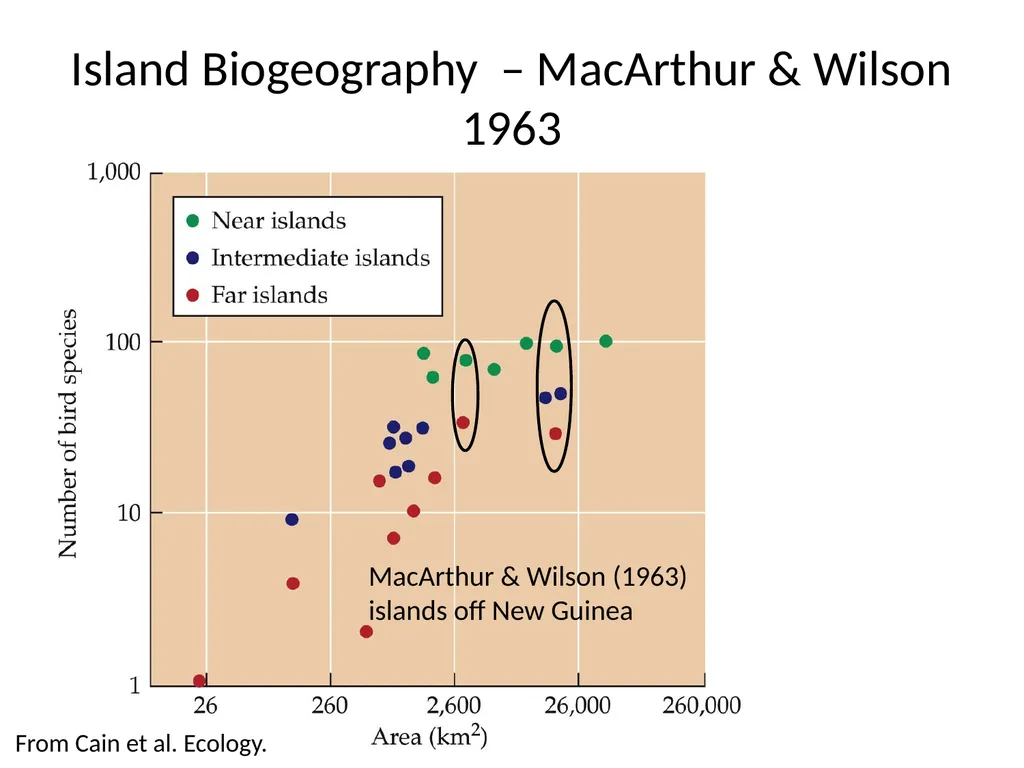
Every 10x increase in island area led to a 2x increase in the number of ant species (ant S).
An equilibrium ant S on an each island: ant S depends on island size & distance from source
Teamed w/ MacArthur to make theory: 1963<br>
slide9. Island Biogeography – MacArthur & Wilson 1963 From Cain et al. Ecology. MacArthur & Wilson (1963) islands off New Guinea<br>
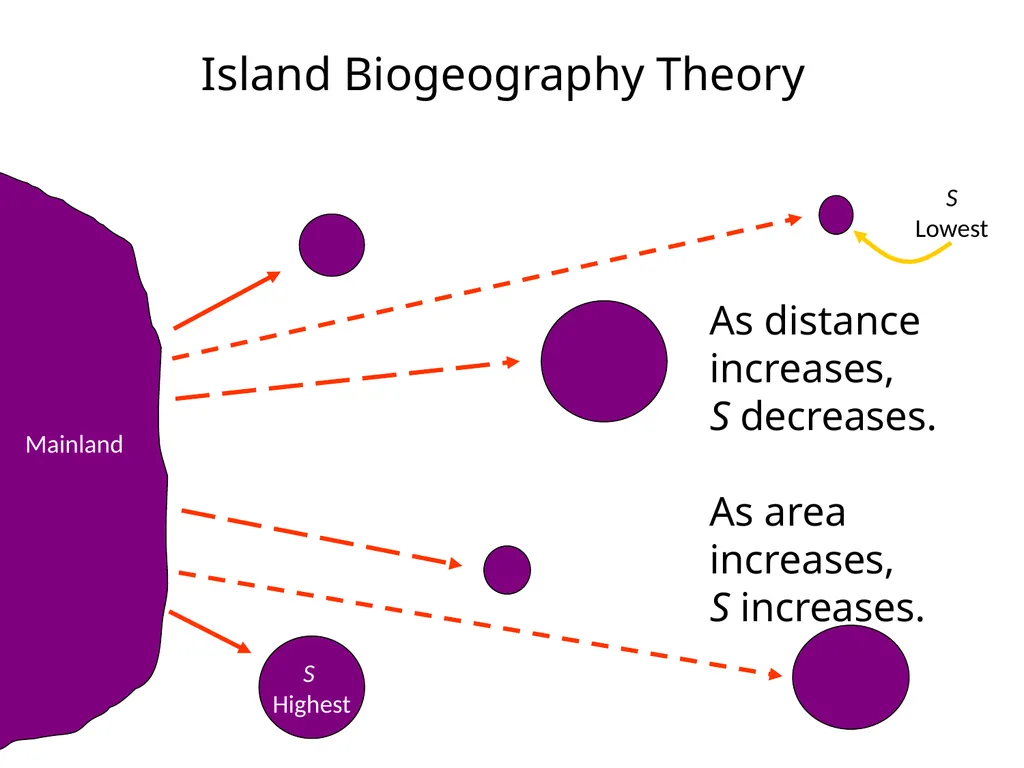
slide10. S
Highest Mainland S
Lowest As distance increases,
S decreases.
As area increases,
S increases. Island Biogeography Theory<br>
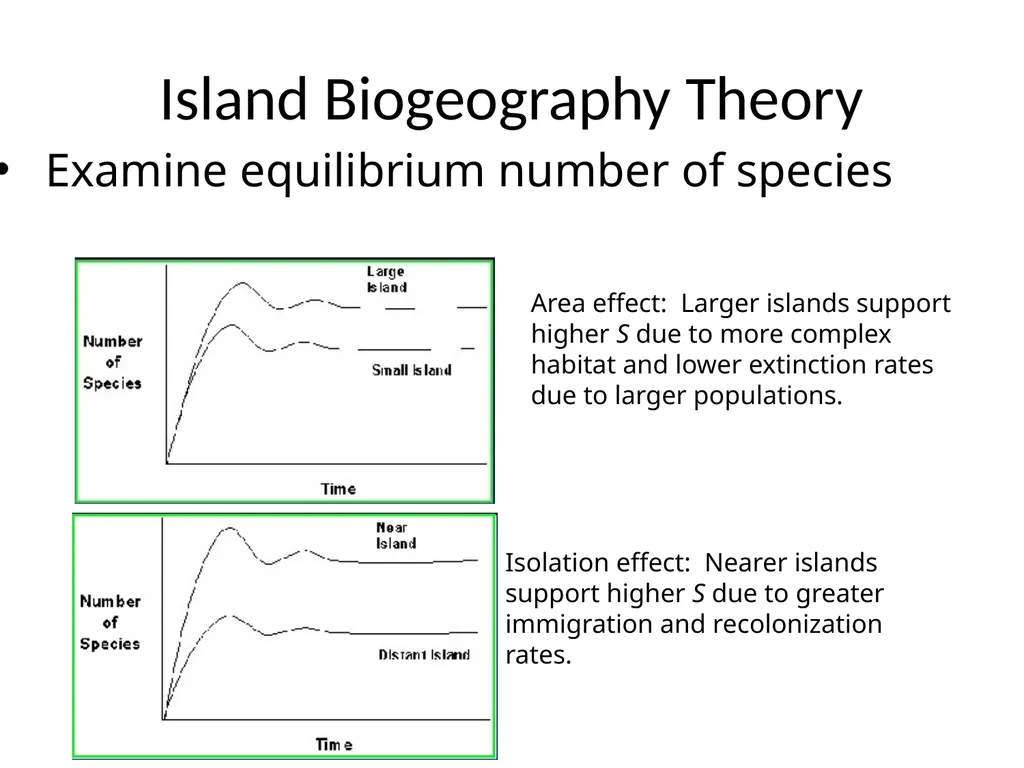
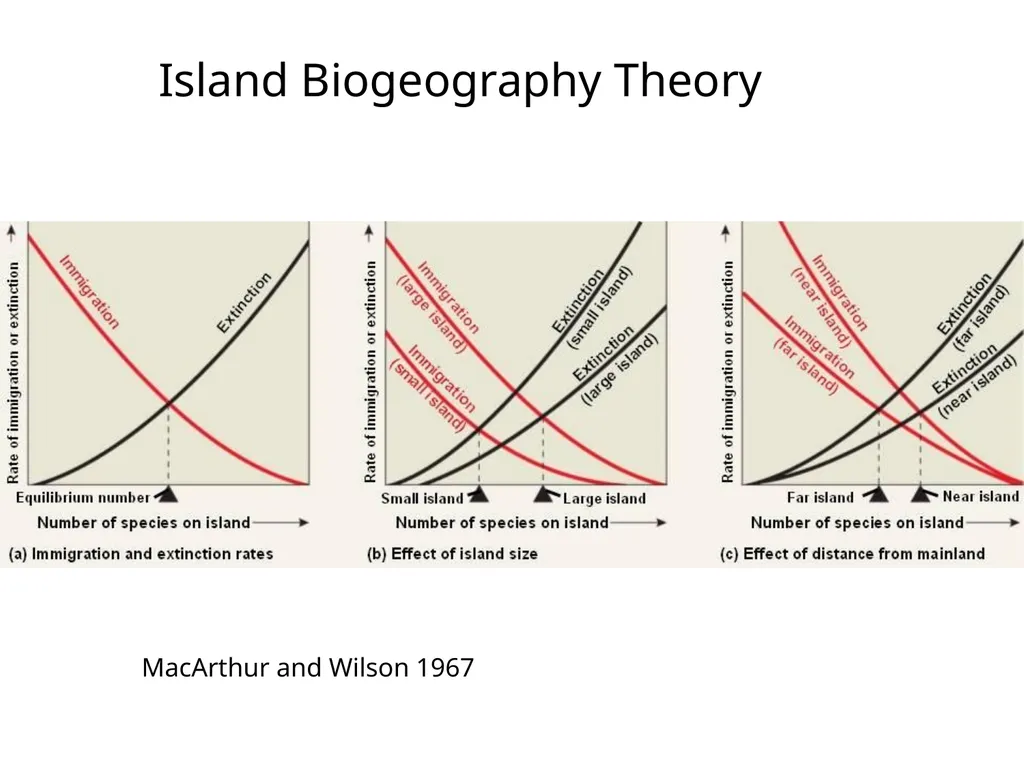
slide11. Island Biogeography Theory Area effect: Larger islands support higher S due to more complex habitat and lower extinction rates due to larger populations. Isolation effect: Nearer islands
support higher S due to greater
immigration and recolonization
rates. Examine equilibrium number of species<br>
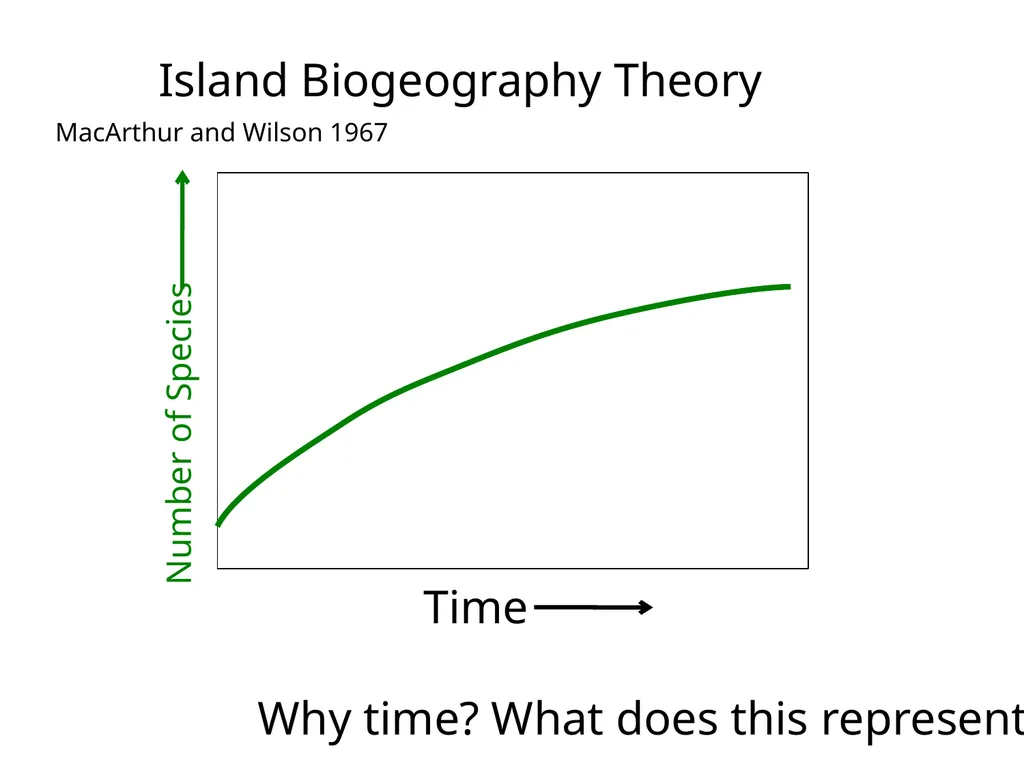
slide12. Island Biogeography Theory Time Number of Species MacArthur and Wilson 1967 Why time? What does this represent?<br>
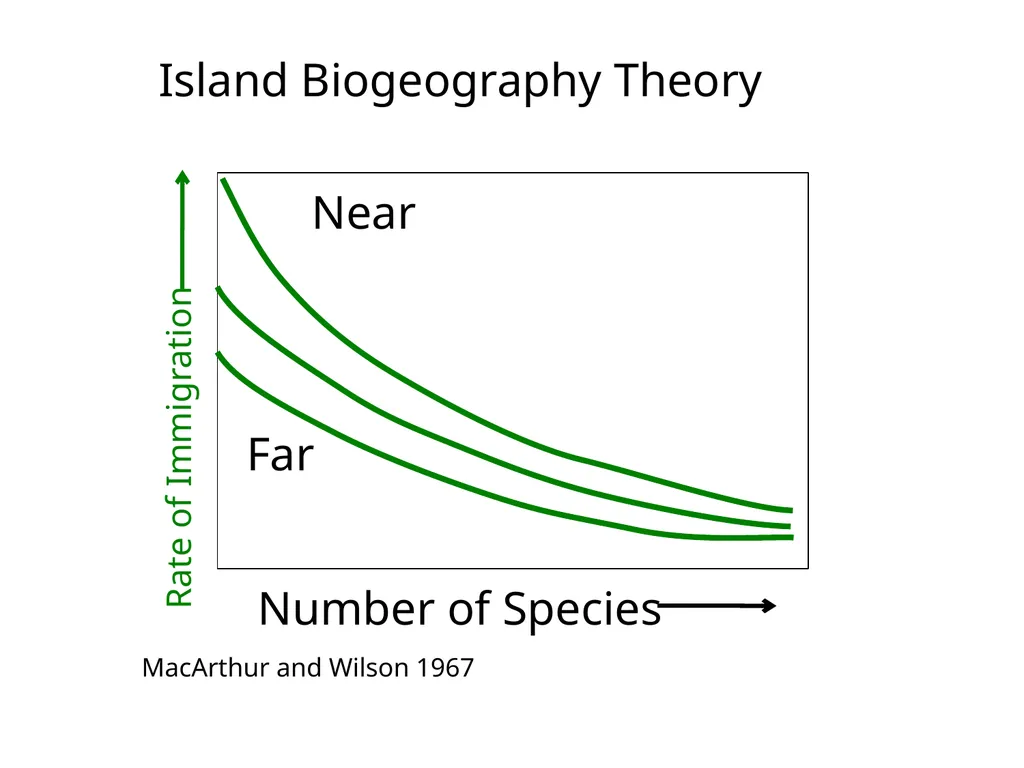
slide13. Island Biogeography Theory Number of Species Rate of Immigration MacArthur and Wilson 1967 Near Far<br>
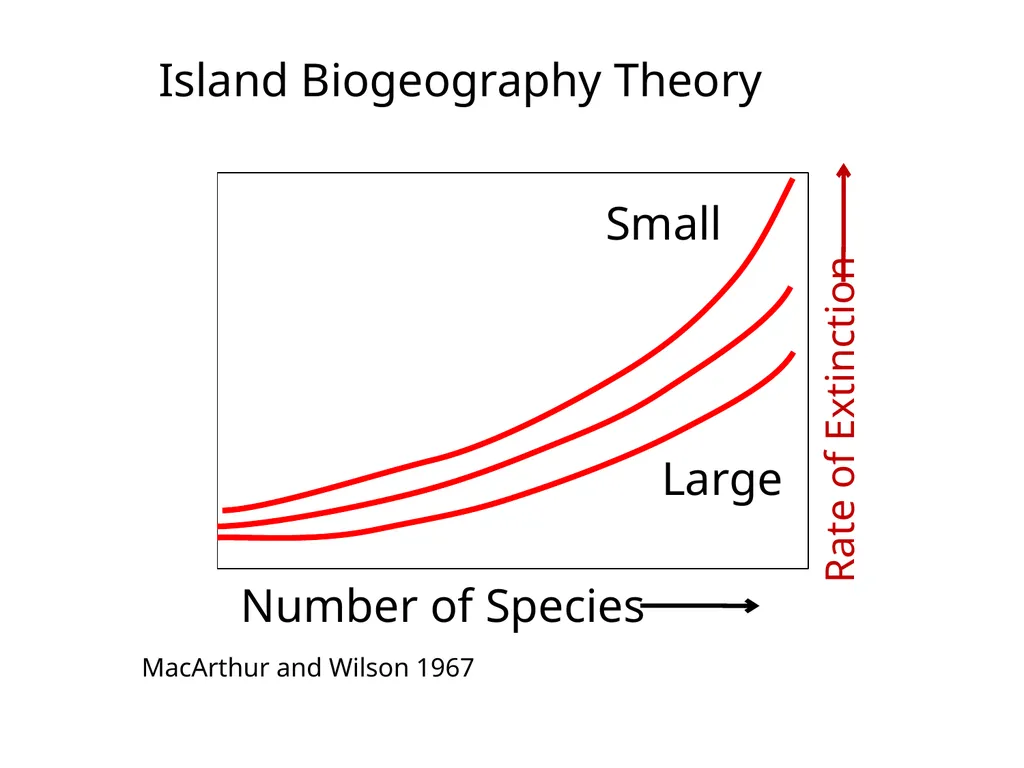
slide14. Island Biogeography Theory Rate of Extinction MacArthur and Wilson 1967 Number of Species Small Large<br>
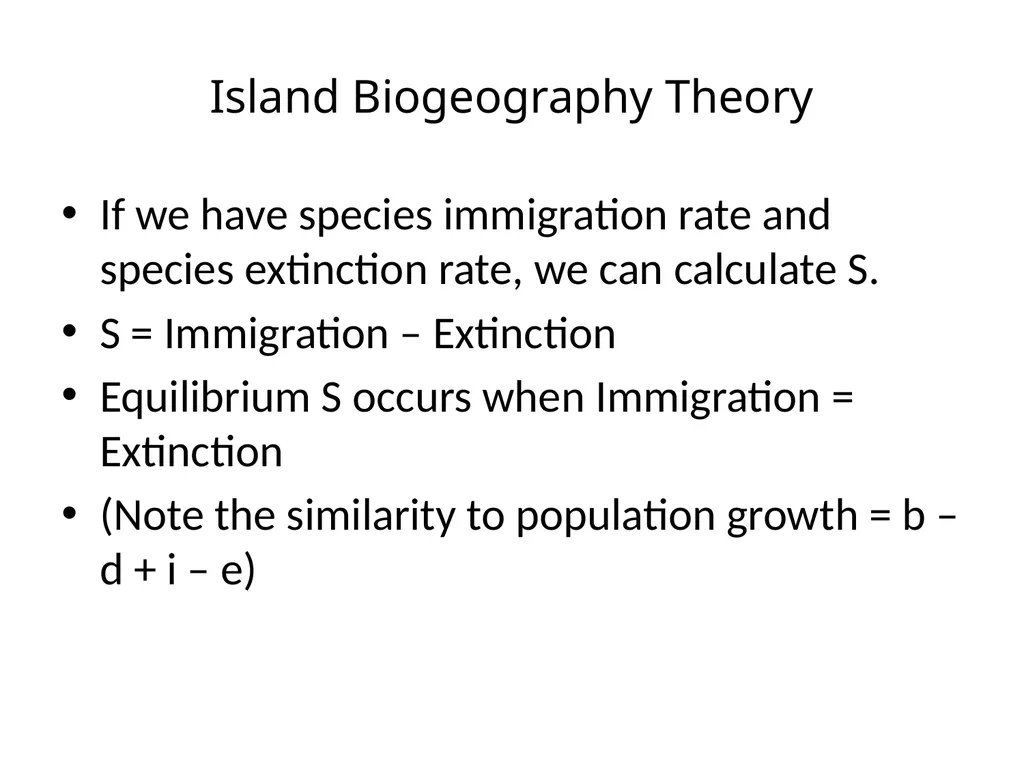
slide15. Island Biogeography Theory If we have species immigration rate and species extinction rate, we can calculate S.
S = Immigration – Extinction
Equilibrium S occurs when Immigration = Extinction
(Note the similarity to population growth = b – d + i – e)<br>
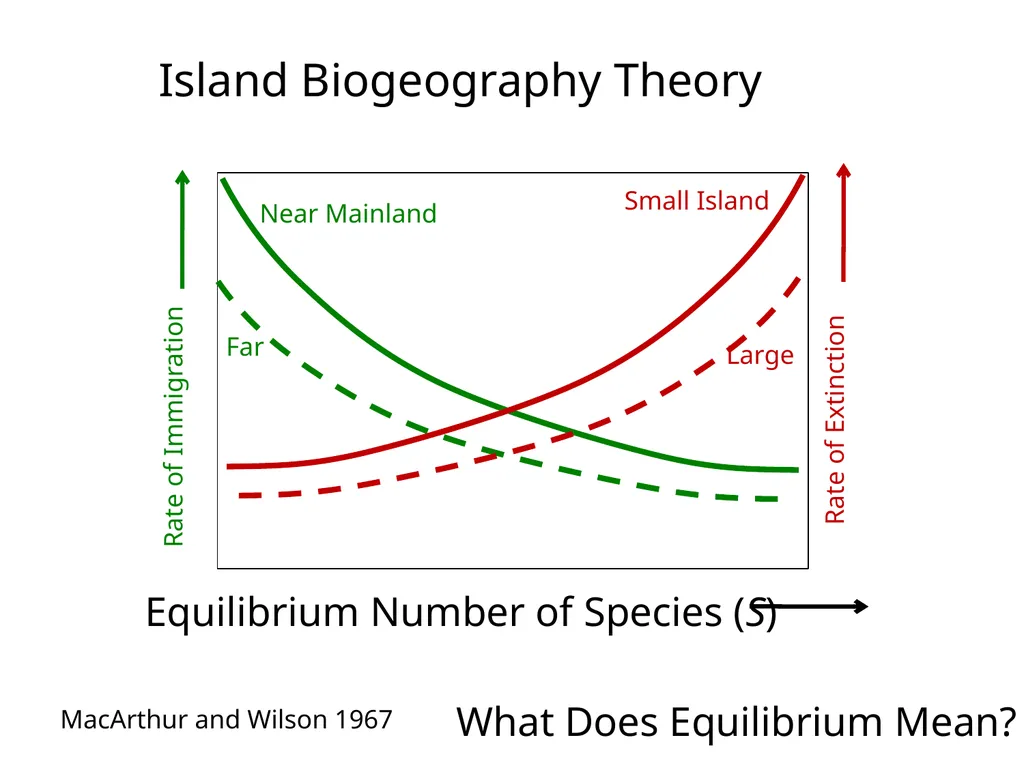
slide16. Island Biogeography Theory Equilibrium Number of Species (S) Rate of Immigration Rate of Extinction Near Mainland Far Small Island Large MacArthur and Wilson 1967 What Does Equilibrium Mean?<br>
slide17. Island Biogeography Theory MacArthur and Wilson 1967<br>
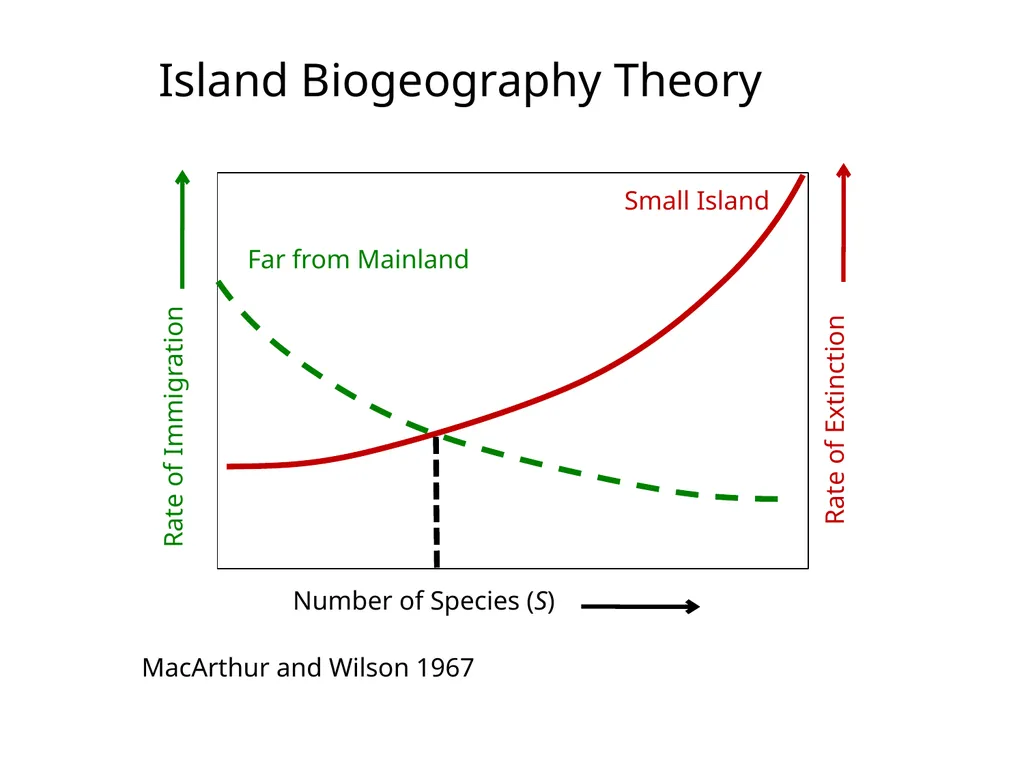
slide18. Island Biogeography Theory Number of Species (S) Rate of Immigration Rate of Extinction Far from Mainland Small Island MacArthur and Wilson 1967<br>
slide19. Island Biogeography Theory Number of Species (S) Rate of Immigration Rate of Extinction Near Mainland Large Island MacArthur and Wilson 1967<br>
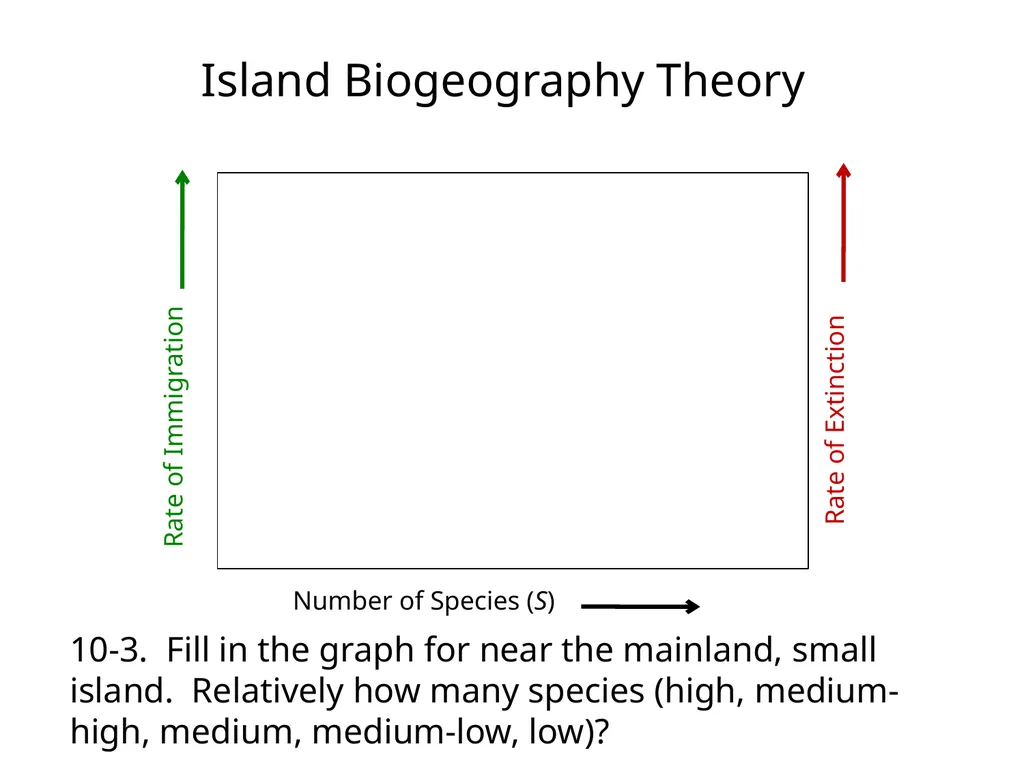
slide20. Island Biogeography Theory Number of Species (S) Rate of Immigration Rate of Extinction 10-3. Fill in the graph for near the mainland, small island. Relatively how many species (high, medium-high, medium, medium-low, low)?<br>
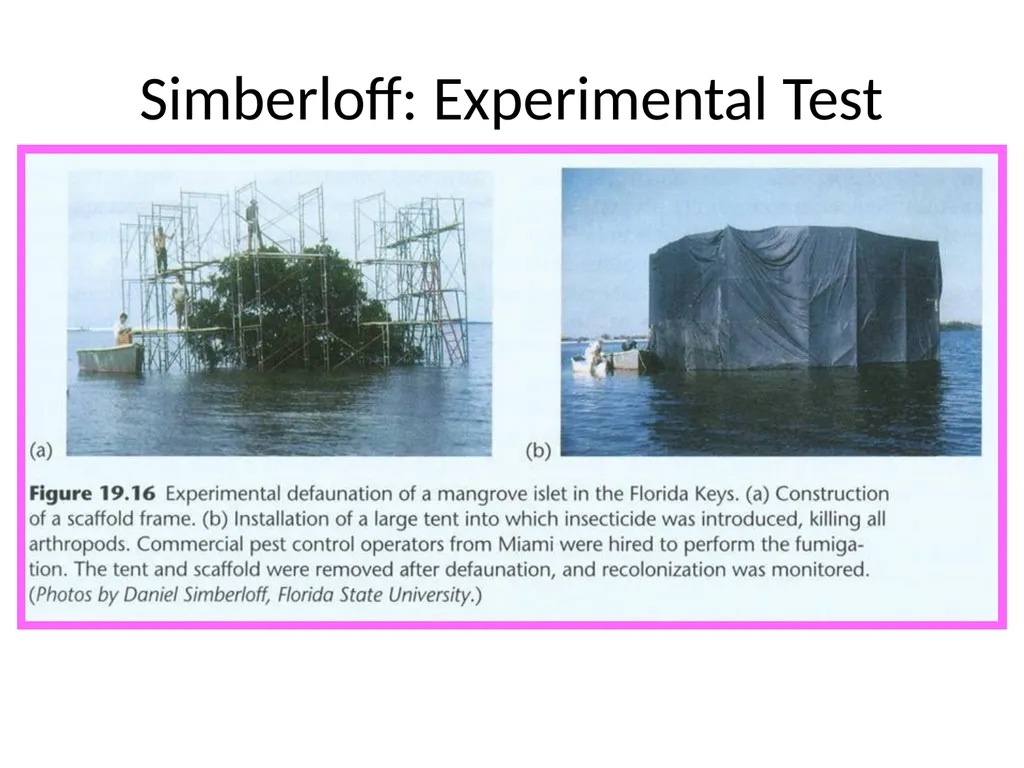
slide21. Simberloff: Experimental Test<br>
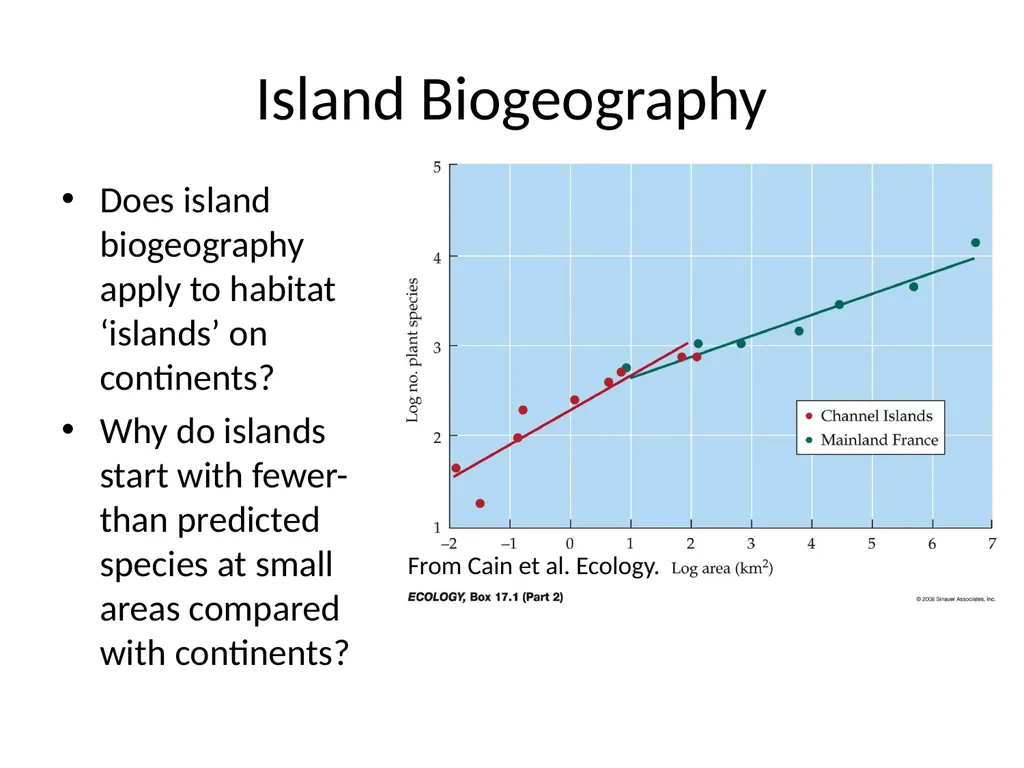
slide22. Island Biogeography Does island biogeography apply to habitat ‘islands’ on continents?
Why do islands start with fewer-than predicted species at small areas compared with continents? From Cain et al. Ecology.<br>
slide23. Island Biogeography Can theory can be applied to habitat ‘islands’ on larger land masses?
Examples?<br>
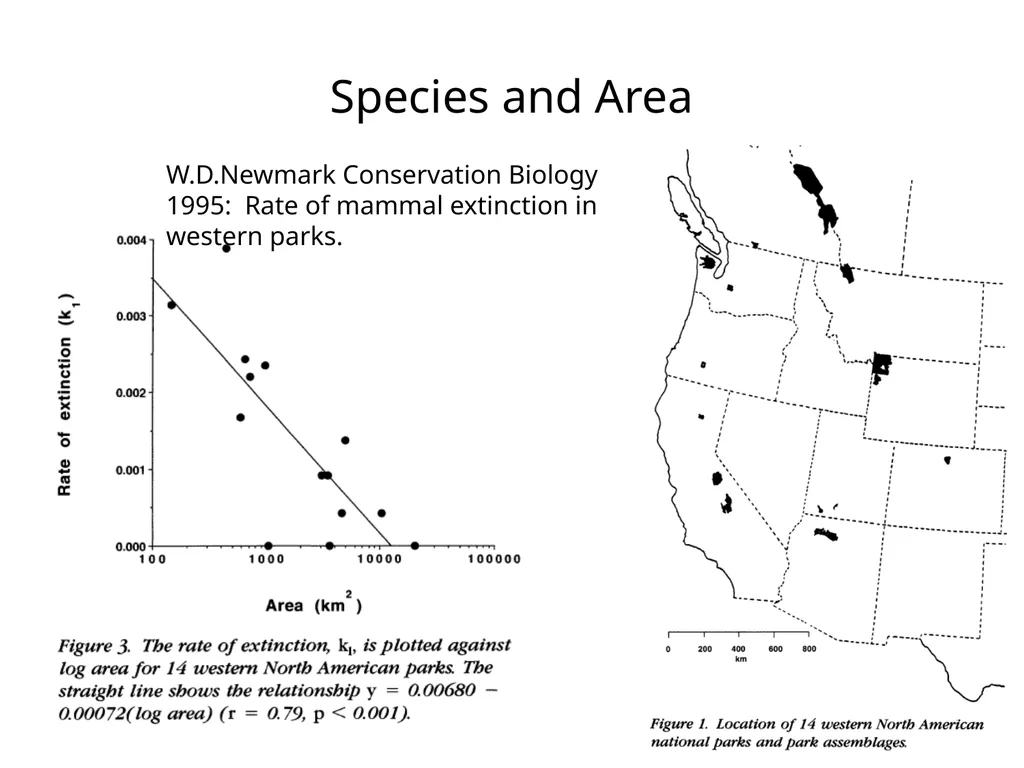
slide24. Species and Area W.D.Newmark Conservation Biology 1995: Rate of mammal extinction in western parks.<br>
Species area curve – observed relationship
Hypothesized mechanism, i.e. IBH
Preview of application<br>
slide2. announcements Reading
Chap 14 agriculture
Chap 11 pollution, that follows from ag
Homeworks
#3: stream biodiversity in context (due Wed)
#4: Island biodiversity (due Wed May 17)
Quiz 2 – Mon May 22
Species area curves
Mechanisms of island biodiversity<br>
slide3. Comments on next quiz Applied to the questions of habitat area, connectivity and land use.
Impact of agriculture and pollution (from the reading).<br>
slide4. Species-Area Curves Log area is common.
For example, as area gets 10 times bigger, increase in species by roughly 50% to 100% (doubles)
No matter where you start<br>
slide5. Species-Area Curves This idea has been generalized:
S = C * AZ
S = species richness
C = a taxonomic specific constant (species/area)
A = Area
Z = similar for many islands, typically < 0.1<br>
slide6. Species area curve S = C*Az C = .2 species/km^2
z = .3
11-1 Plot from 10 km^2 to 1000km^2<br>
slide7. Species area curve S = C*Az C = .2 species/km^2
z = .3
Plot from 10 km^2 to 1000km^2 Curve C 5
z 0.3
10 10.0
30 13.9
50 16.2
100 19.9
300 27.7
500 32.3
1000 39.7<br>
slide8. Island Biogeography EO Wilson’s studies on ants led to the theory of island biogeography.
Every 10x increase in island area led to a 2x increase in the number of ant species (ant S).
An equilibrium ant S on an each island: ant S depends on island size & distance from source
Teamed w/ MacArthur to make theory: 1963<br>
slide9. Island Biogeography – MacArthur & Wilson 1963 From Cain et al. Ecology. MacArthur & Wilson (1963) islands off New Guinea<br>
slide10. S
Highest Mainland S
Lowest As distance increases,
S decreases.
As area increases,
S increases. Island Biogeography Theory<br>
slide11. Island Biogeography Theory Area effect: Larger islands support higher S due to more complex habitat and lower extinction rates due to larger populations. Isolation effect: Nearer islands
support higher S due to greater
immigration and recolonization
rates. Examine equilibrium number of species<br>
slide12. Island Biogeography Theory Time Number of Species MacArthur and Wilson 1967 Why time? What does this represent?<br>
slide13. Island Biogeography Theory Number of Species Rate of Immigration MacArthur and Wilson 1967 Near Far<br>
slide14. Island Biogeography Theory Rate of Extinction MacArthur and Wilson 1967 Number of Species Small Large<br>
slide15. Island Biogeography Theory If we have species immigration rate and species extinction rate, we can calculate S.
S = Immigration – Extinction
Equilibrium S occurs when Immigration = Extinction
(Note the similarity to population growth = b – d + i – e)<br>
slide16. Island Biogeography Theory Equilibrium Number of Species (S) Rate of Immigration Rate of Extinction Near Mainland Far Small Island Large MacArthur and Wilson 1967 What Does Equilibrium Mean?<br>
slide17. Island Biogeography Theory MacArthur and Wilson 1967<br>
slide18. Island Biogeography Theory Number of Species (S) Rate of Immigration Rate of Extinction Far from Mainland Small Island MacArthur and Wilson 1967<br>
slide19. Island Biogeography Theory Number of Species (S) Rate of Immigration Rate of Extinction Near Mainland Large Island MacArthur and Wilson 1967<br>
slide20. Island Biogeography Theory Number of Species (S) Rate of Immigration Rate of Extinction 10-3. Fill in the graph for near the mainland, small island. Relatively how many species (high, medium-high, medium, medium-low, low)?<br>
slide21. Simberloff: Experimental Test<br>
slide22. Island Biogeography Does island biogeography apply to habitat ‘islands’ on continents?
Why do islands start with fewer-than predicted species at small areas compared with continents? From Cain et al. Ecology.<br>
slide23. Island Biogeography Can theory can be applied to habitat ‘islands’ on larger land masses?
Examples?<br>
slide24. Species and Area W.D.Newmark Conservation Biology 1995: Rate of mammal extinction in western parks.<br>