03
Learning Target:
Graph transformations of linear functions. Success Criteria:
I can identify a transformation of a linear graph.
I can graph transformations of linear functions.
I can explain how translations, reflections, stretches, and shrinks affect graphs �of functions.<br>
04
Explore It! Comparing Graphs of Functions Work with a partner.
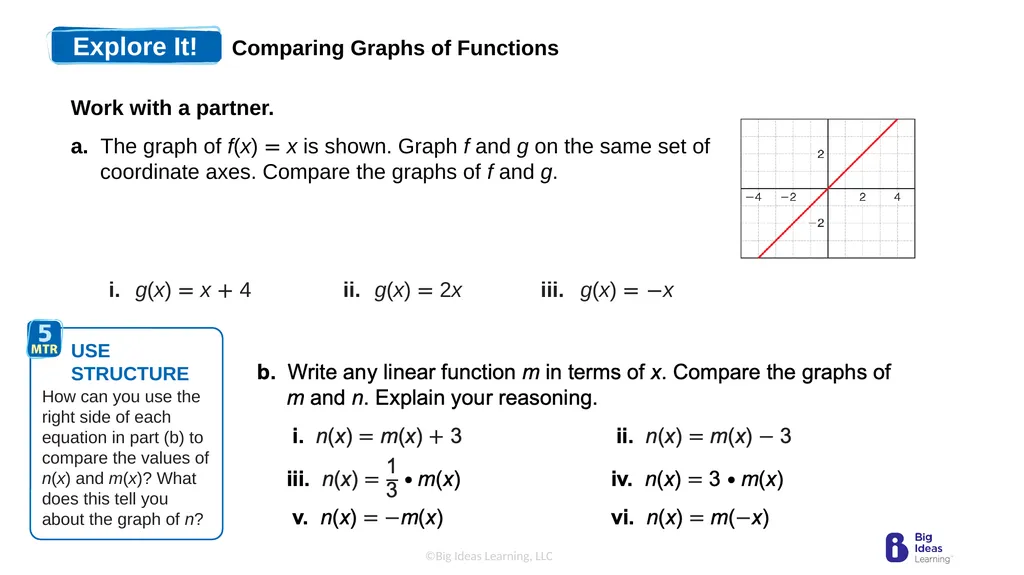
a. The graph of f(x) = x is shown. Graph f and g on the same set of coordinate axes. Compare the graphs of f and g. i. g(x) = x + 4 ii. g(x) = 2x iii. g(x) = −x<br>
05
Explore It! Comparing Graphs of Functions Work with a partner.
c. Discuss your results in part (b) with other students. What do you notice?
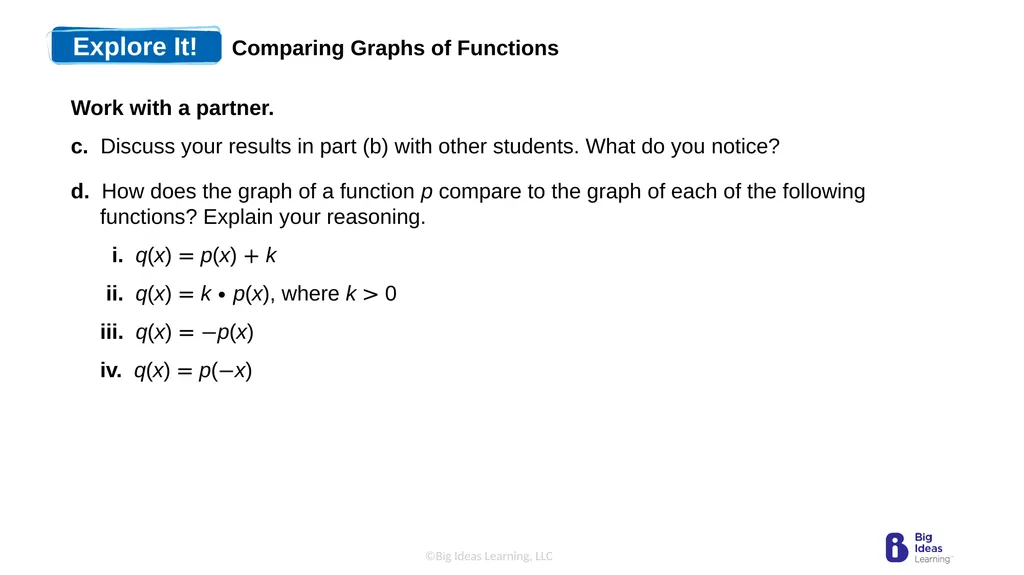
d. How does the graph of a function p compare to the graph of each of the following functions? Explain your reasoning.
i. q(x) = p(x) + k
ii. q(x) = k • p(x), where k > 0
iii. q(x) = −p(x)
iv. q(x) = p(−x)<br>
06
Translations and Reflections
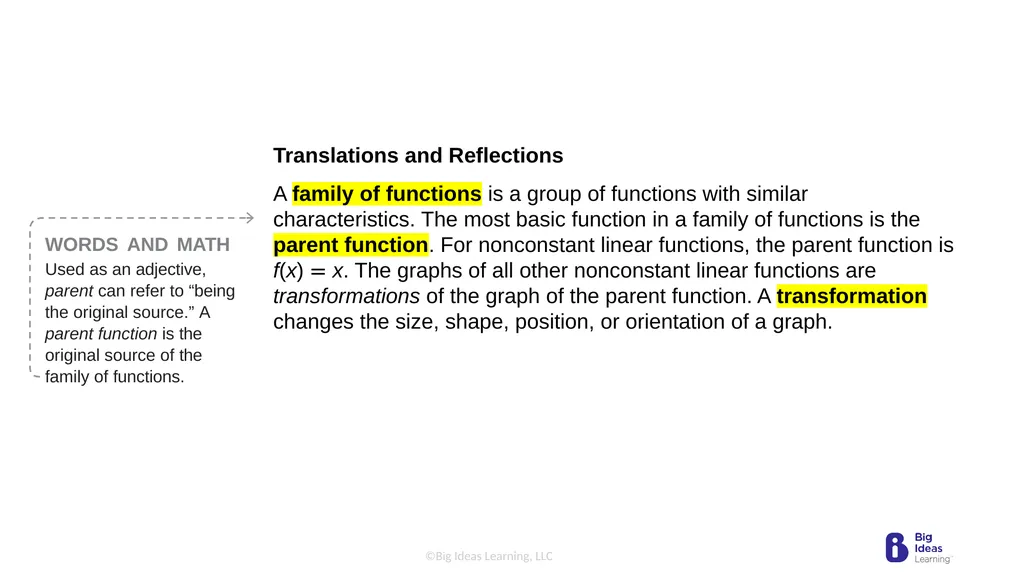
A family of functions is a group of functions with similar characteristics. The most basic function in a family of functions is the parent function. For nonconstant linear functions, the parent function is f(x) = x. The graphs of all other nonconstant linear functions are transformations of the graph of the parent function. A transformation changes the size, shape, position, or orientation of a graph. WORDS AND MATH
Used as an adjective, parent can refer to “being the original source.” A parent function is the original source of the family of functions.<br>
07
Vocabulary
family of functions, p. 148 parent function, p. 148 transformation, p. 148
translation, p. 148
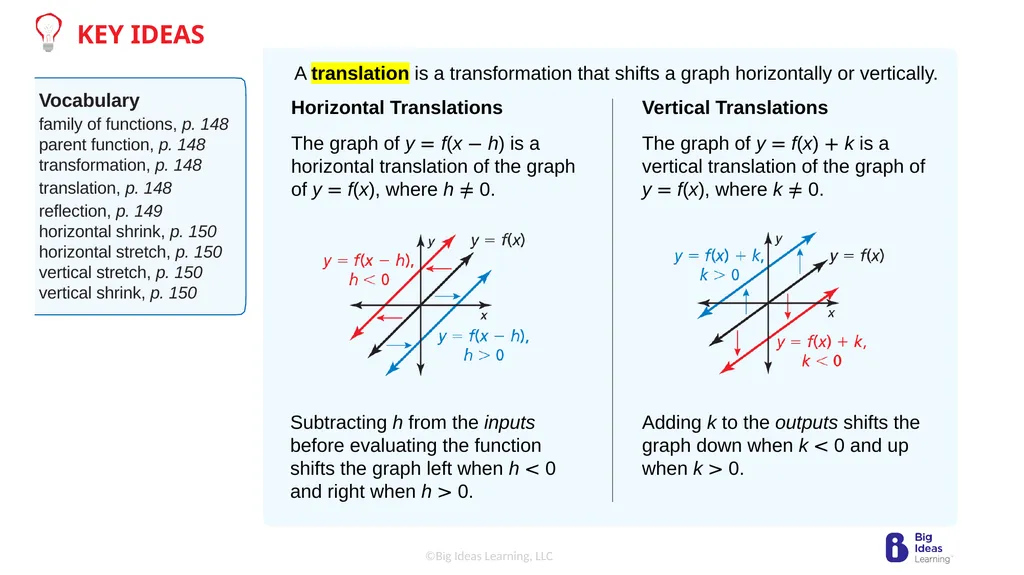
reflection, p. 149 horizontal shrink, p. 150 horizontal stretch, p. 150 vertical stretch, p. 150 vertical shrink, p. 150 KEY IDEAS<br>
08
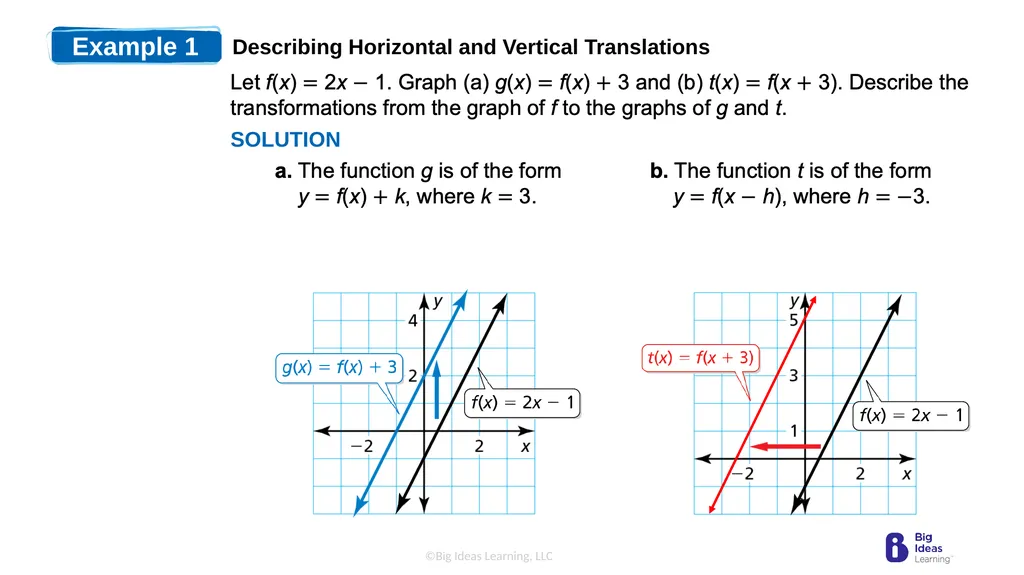
Example 1 Describing Horizontal and Vertical Translations SOLUTION<br>
09
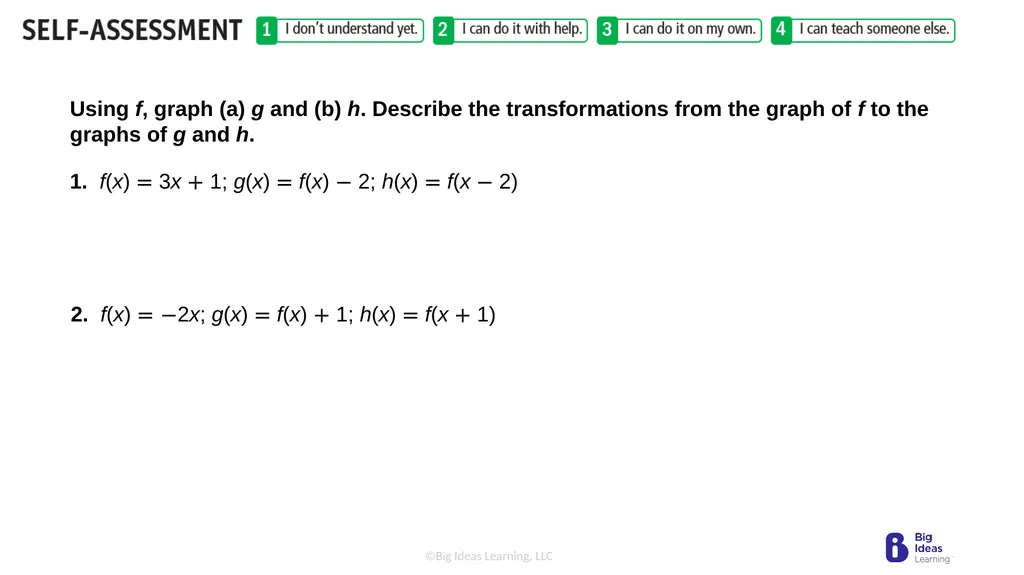
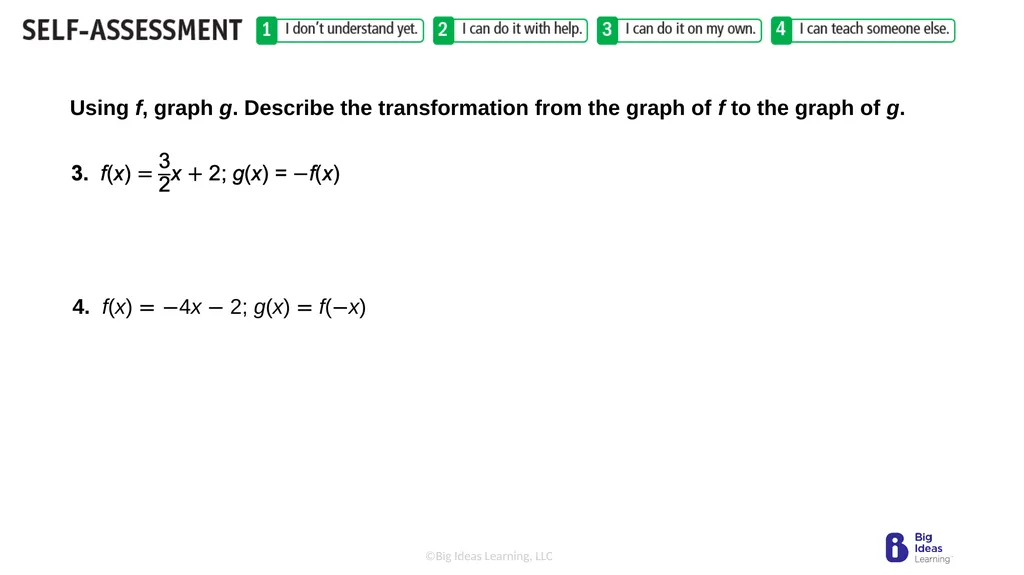
Using f, graph (a) g and (b) h. Describe the transformations from the graph of f to the graphs of g and h. 1. f(x) = 3x + 1; g(x) = f(x) − 2; h(x) = f(x − 2) 2. f(x) = −2x; g(x) = f(x) + 1; h(x) = f(x + 1)<br>
10
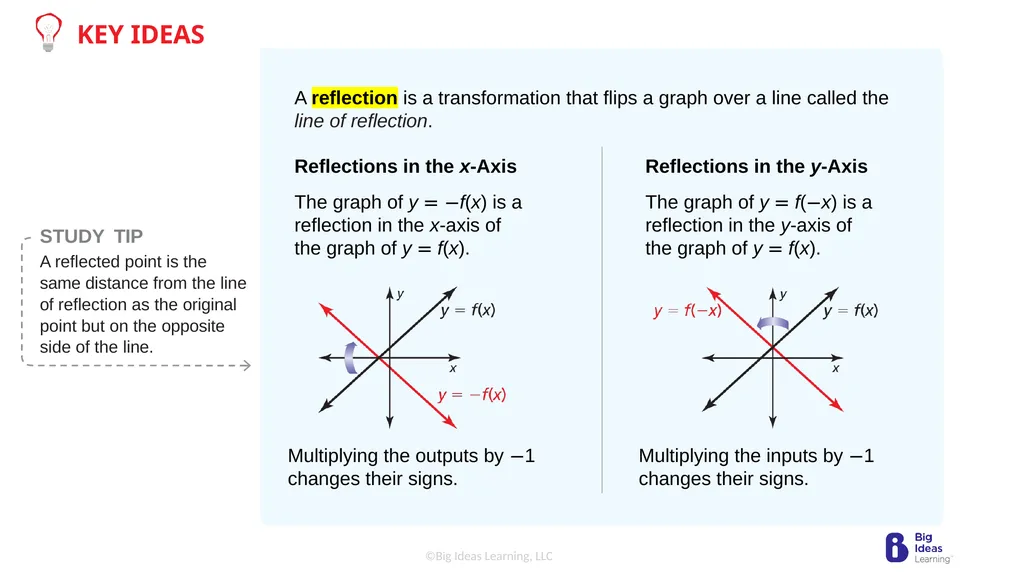
KEY IDEAS STUDY TIP
A reflected point is the same distance from the line of reflection as the original point but on the opposite side of the line.<br>
11
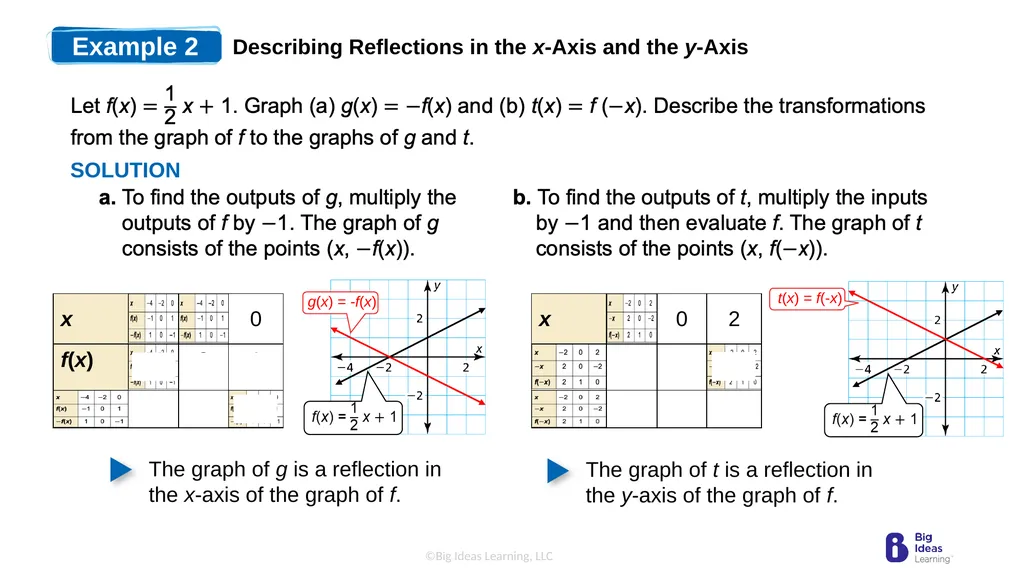
Example 2 Describing Reflections in the x-Axis and the y-Axis The graph of g is a reflection in
the x-axis of the graph of f. The graph of t is a reflection in
the y-axis of the graph of f. SOLUTION<br>
12
Using f, graph g. Describe the transformation from the graph of f to the graph of g. 4. f(x) = −4x − 2; g(x) = f(−x)<br>
13
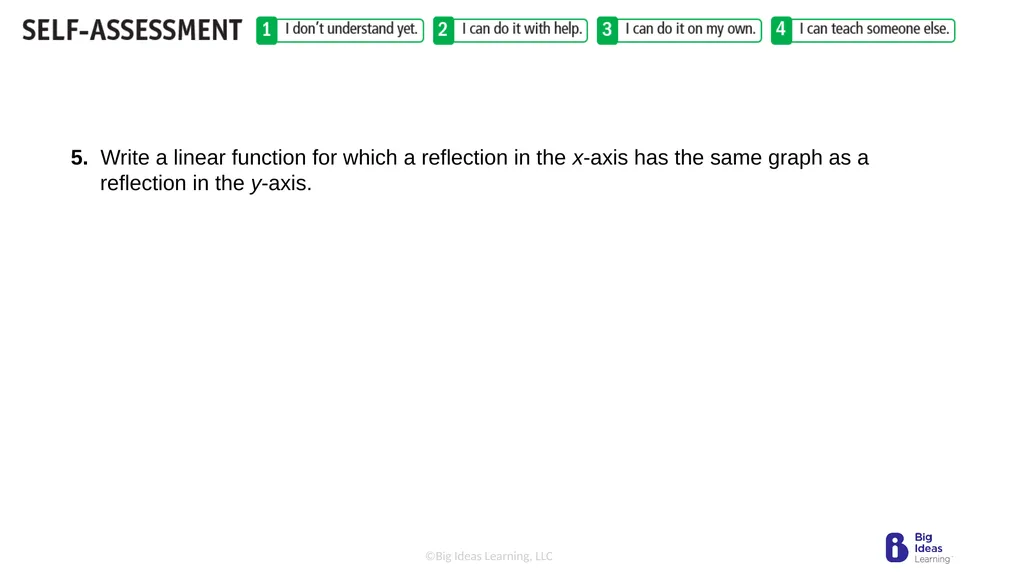
5. Write a linear function for which a reflection in the x-axis has the same graph as a reflection in the y-axis.<br>
14
Stretches and Shrinks
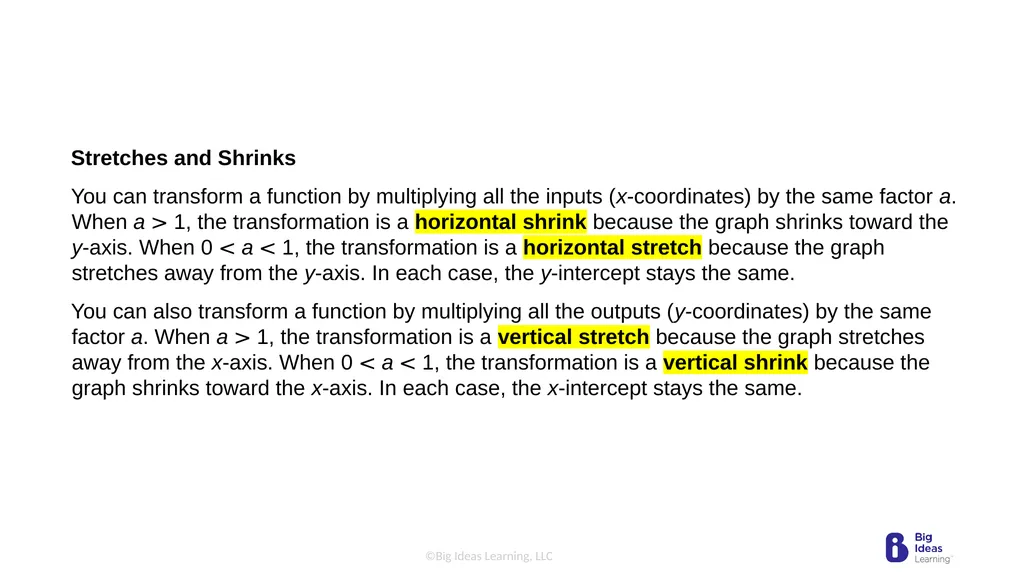
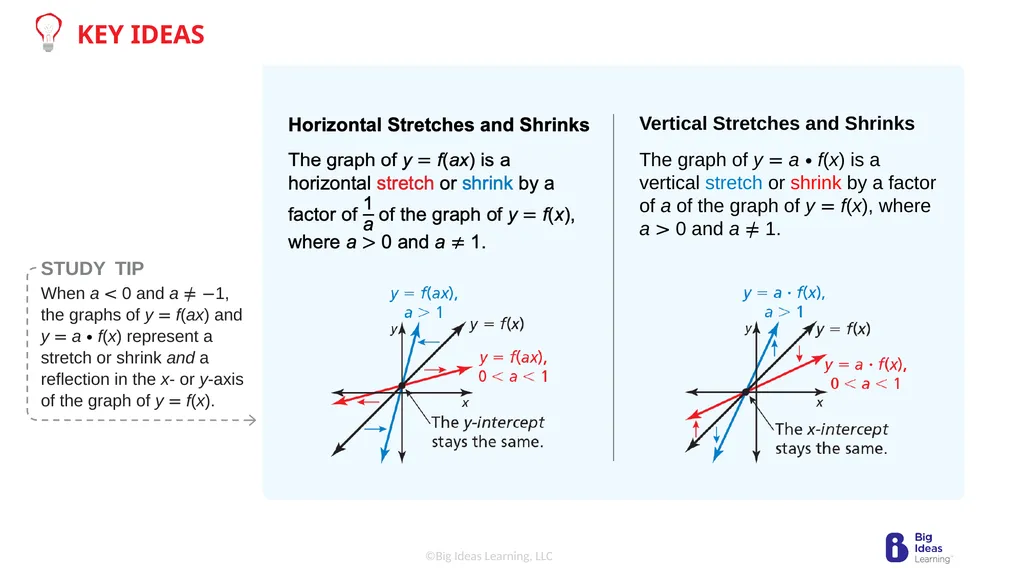
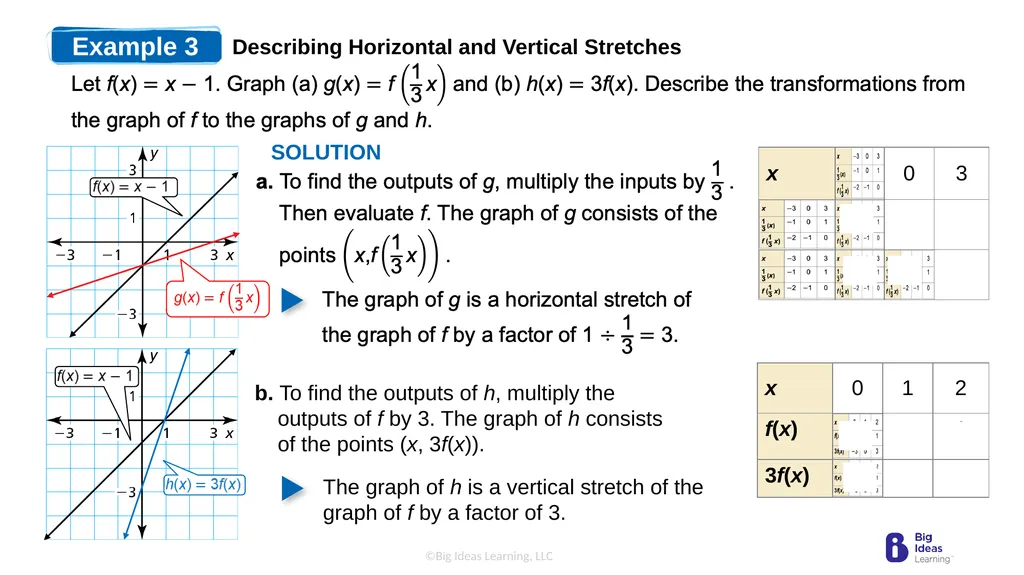
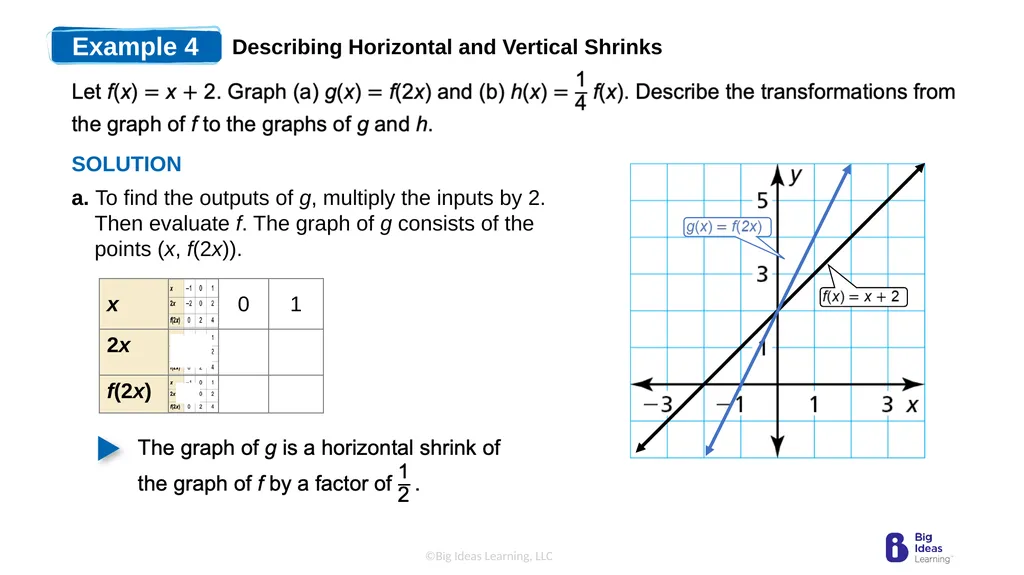
You can transform a function by multiplying all the inputs (x-coordinates) by the same factor a. When a > 1, the transformation is a horizontal shrink because the graph shrinks toward the y-axis. When 0 < a < 1, the transformation is a horizontal stretch because the graph stretches away from the y-axis. In each case, the y-intercept stays the same.
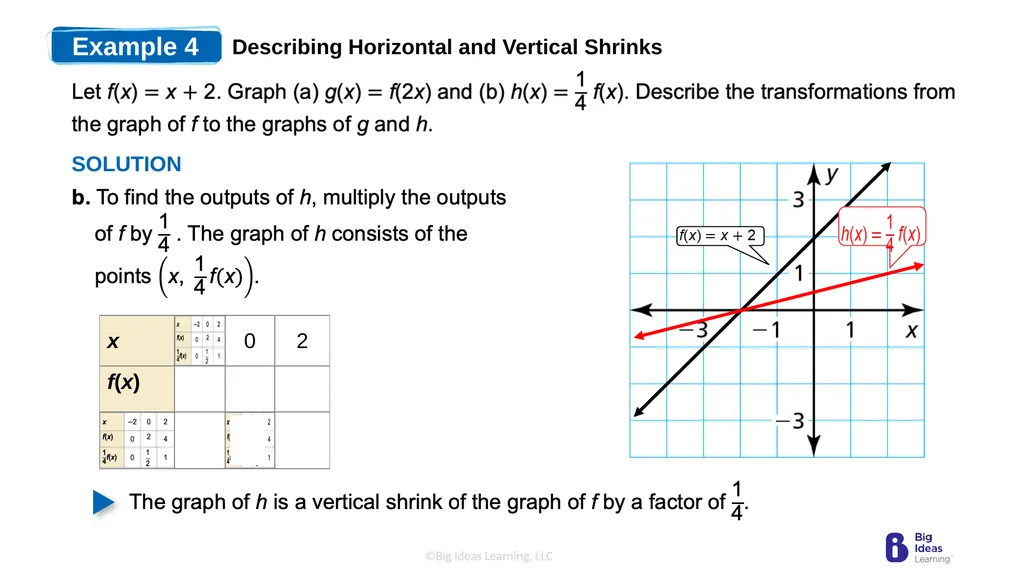
You can also transform a function by multiplying all the outputs (y-coordinates) by the same factor a. When a > 1, the transformation is a vertical stretch because the graph stretches away from the x-axis. When 0 < a < 1, the transformation is a vertical shrink because the graph shrinks toward the x-axis. In each case, the x-intercept stays the same.<br>
16
Example 3 Describing Horizontal and Vertical Stretches b. To find the outputs of h, multiply the outputs of f by 3. The graph of h consists of the points (x, 3f(x)). SOLUTION<br>
17
Example 4 Describing Horizontal and Vertical Shrinks a. To find the outputs of g, multiply the inputs by 2. Then evaluate f. The graph of g consists of the points (x, f(2x)). SOLUTION<br>
18
Example 4 Describing Horizontal and Vertical Shrinks SOLUTION<br>
19
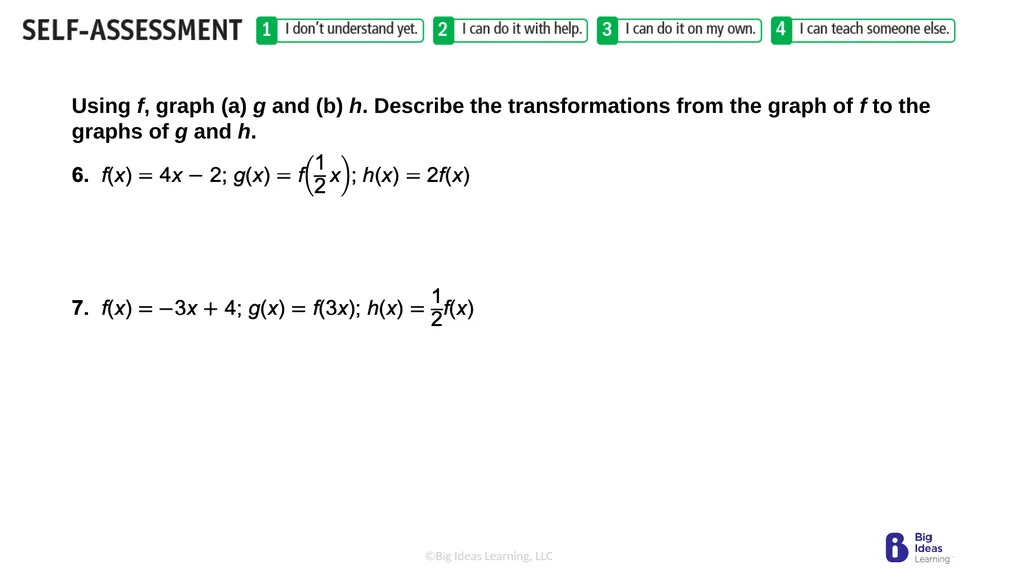
Using f, graph (a) g and (b) h. Describe the transformations from the graph of f to the graphs of g and h.<br>
20
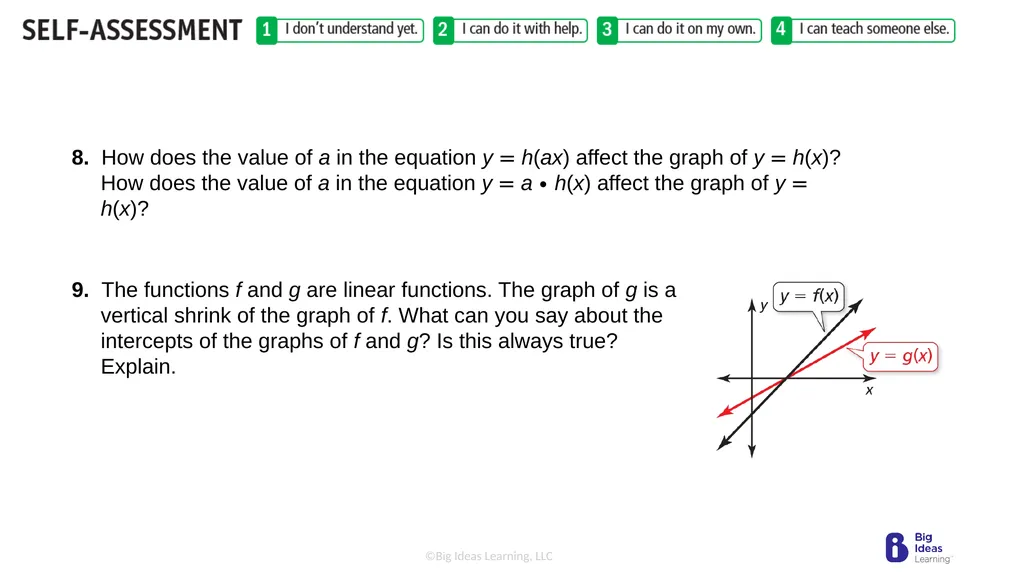
8. How does the value of a in the equation y = h(ax) affect the graph of y = h(x)? How does the value of a in the equation y = a • h(x) affect the graph of y = h(x)? 9. The functions f and g are linear functions. The graph of g is a vertical shrink of the graph of f. What can you say about the intercepts of the graphs of f and g? Is this always true? Explain.<br>
21
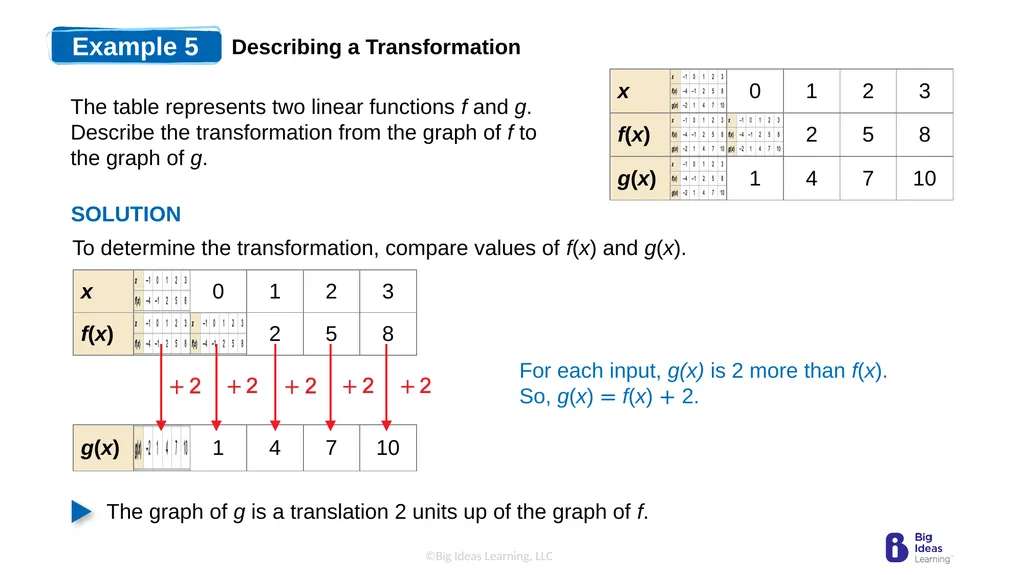
Example 5 Describing a Transformation To determine the transformation, compare values of f(x) and g(x). SOLUTION The table represents two linear functions f and g. Describe the transformation from the graph of f to the graph of g. For each input, g(x) is 2 more than f(x).
So, g(x) = f(x) + 2.<br>
22
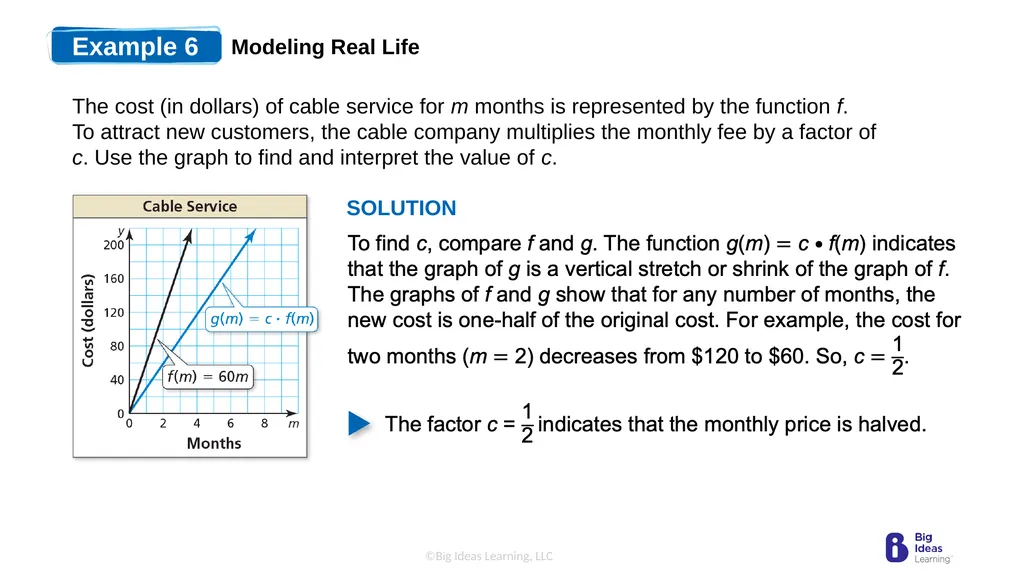
Example 6 Modeling Real Life The cost (in dollars) of cable service for m months is represented by the function f. �To attract new customers, the cable company multiplies the monthly fee by a factor of c. Use the graph to find and interpret the value of c. SOLUTION<br>
23
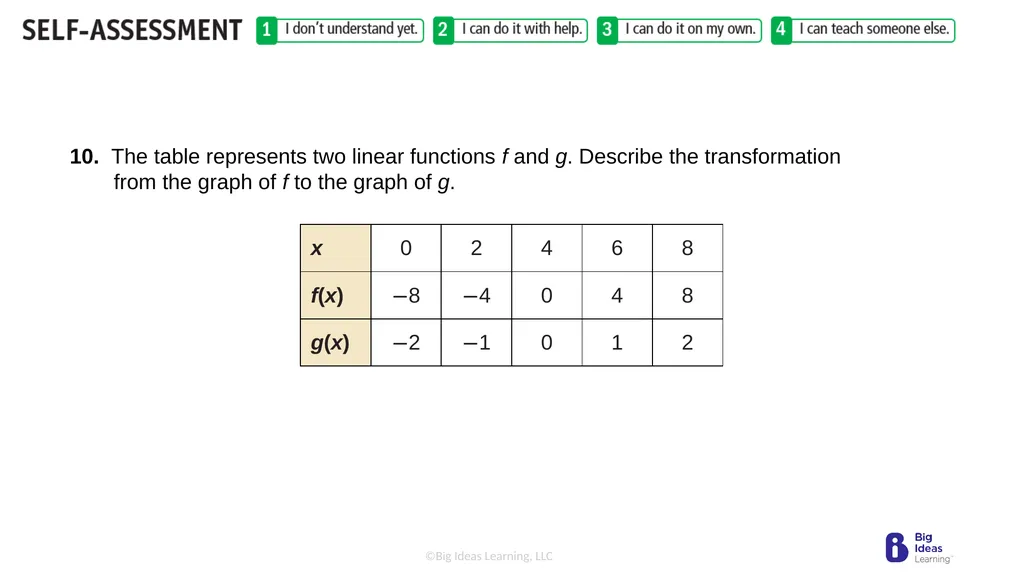
10. The table represents two linear functions f and g. Describe the transformation from the graph of f to the graph of g.<br>
24
11. A company pays x dollars per unit for a product. The selling price is represented by the function p. a. What does f(x) = x represent in this situation? Describe a transformation of the graph of f that results in the graph of p.
b. How does the company determine the selling price of a product?<br>
25
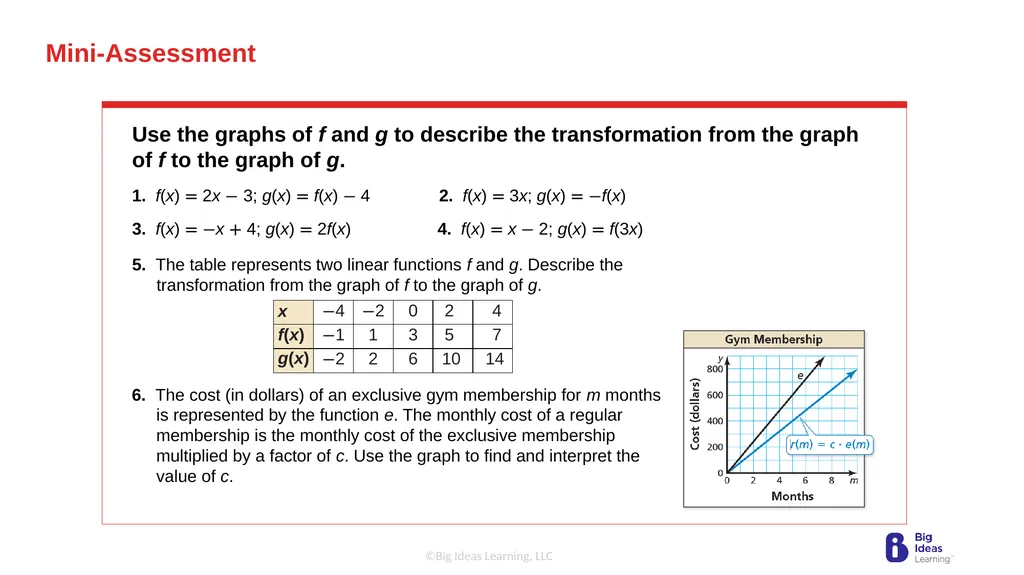
In-Class Practice Mini-Assessment Use the graphs of f and g to describe the transformation from the graph of f to the graph of g.
1. f(x) = 2x − 3; g(x) = f(x) − 4 2. f(x) = 3x; g(x) = −f(x)
3. f(x) = −x + 4; g(x) = 2f(x) 4. f(x) = x − 2; g(x) = f(3x) 6. The cost (in dollars) of an exclusive gym membership for m months is represented by the function e. The monthly cost of a regular membership is the monthly cost of the exclusive membership multiplied by a factor of c. Use the graph to find and interpret the value of c. 5. The table represents two linear functions f and g. Describe the transformation from the graph of f to the graph of g.<br>