
Local Currency Solution for Multilateral





Description: Local Currency Solution for Multilateral Development Bank Portfolio Transfer JULY 2024 Radisson Blu, Mosi-Oa-Tunya, Livingstone, Zambia Friday, 26 July 2024 Dr. Evans Osano Director, Capital Markets (Supply side) Outline In June 2023, FSD
Related Topics
Download Presentation
"Local Currency Solution for Multilateral" is the property of its rightful owner. Permission is granted to download and print the materials on this website for personal, non-commercial use only, and to display it on your personal computer provided you do not modify the materials and that you retain all copyright notices contained in the materials. By downloading content from our website, you accept the terms of this agreement.
Presentation Transcript
slide1. Local Currency Solution for Multilateral Development Bank Portfolio Transfer JULY 2024 Radisson Blu, Mosi-Oa-Tunya, Livingstone, Zambia
Friday, 26 July 2024 Dr. Evans Osano
Director, Capital Markets<br>
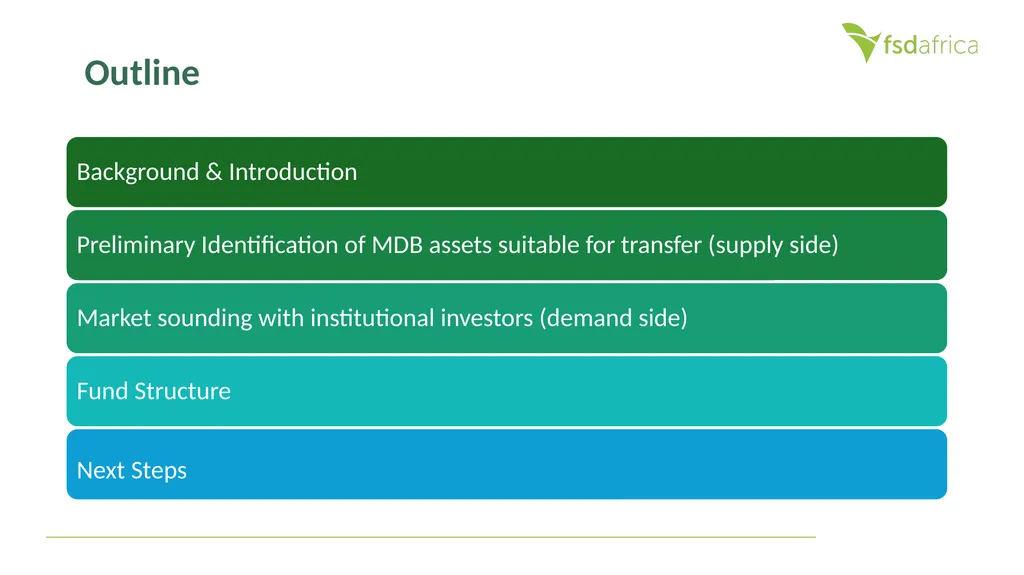
slide2. (Supply side) Outline<br>
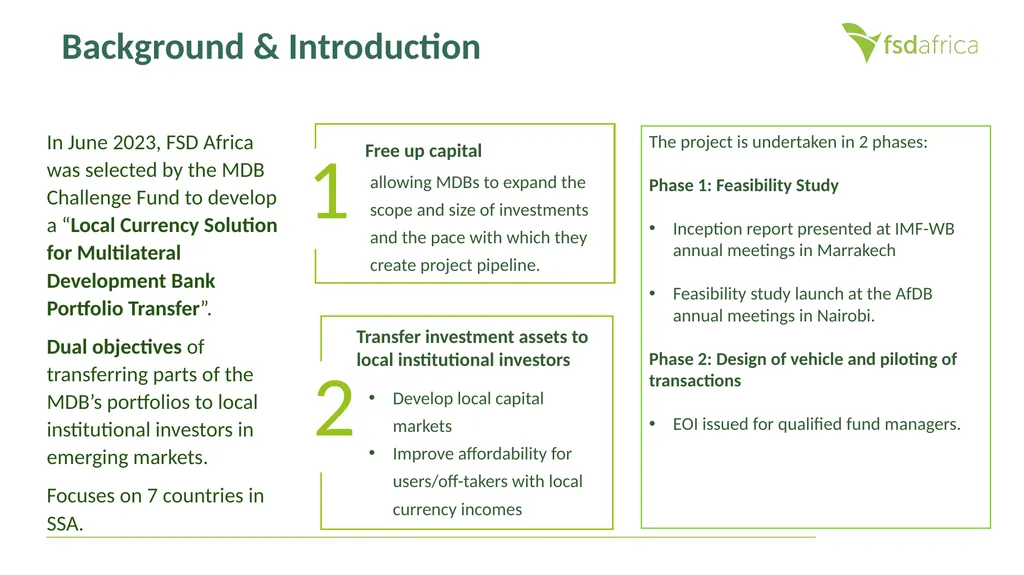
slide3. In June 2023, FSD Africa was selected by the MDB Challenge Fund to develop a “Local Currency Solution for Multilateral Development Bank Portfolio Transfer”.
Dual objectives of transferring parts of the MDB’s portfolios to local institutional investors in emerging markets.
Focuses on 7 countries in SSA. allowing MDBs to expand the scope and size of investments and the pace with which they create project pipeline. Develop local capital markets
Improve affordability for users/off-takers with local currency incomes Background & Introduction Free up capital The project is undertaken in 2 phases:
Phase 1: Feasibility Study
Inception report presented at IMF-WB annual meetings in Marrakech
Feasibility study launch at the AfDB annual meetings in Nairobi.
Phase 2: Design of vehicle and piloting of transactions
EOI issued for qualified fund managers.<br>
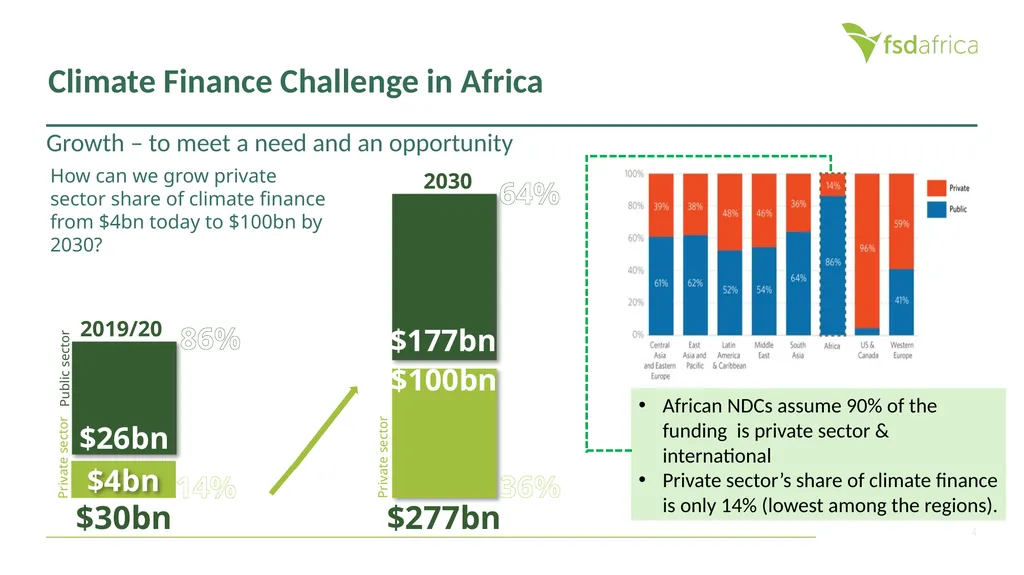
slide4. 4 $26bn $4bn $177bn $100bn Private sector 86% Public sector Private sector 64% 14% 36% 2030 $277bn Growth – to meet a need and an opportunity How can we grow private sector share of climate finance from $4bn today to $100bn by 2030? $30bn 2019/20 African NDCs assume 90% of the funding is private sector & international
Private sector’s share of climate finance is only 14% (lowest among the regions). Climate Finance Challenge in Africa<br>
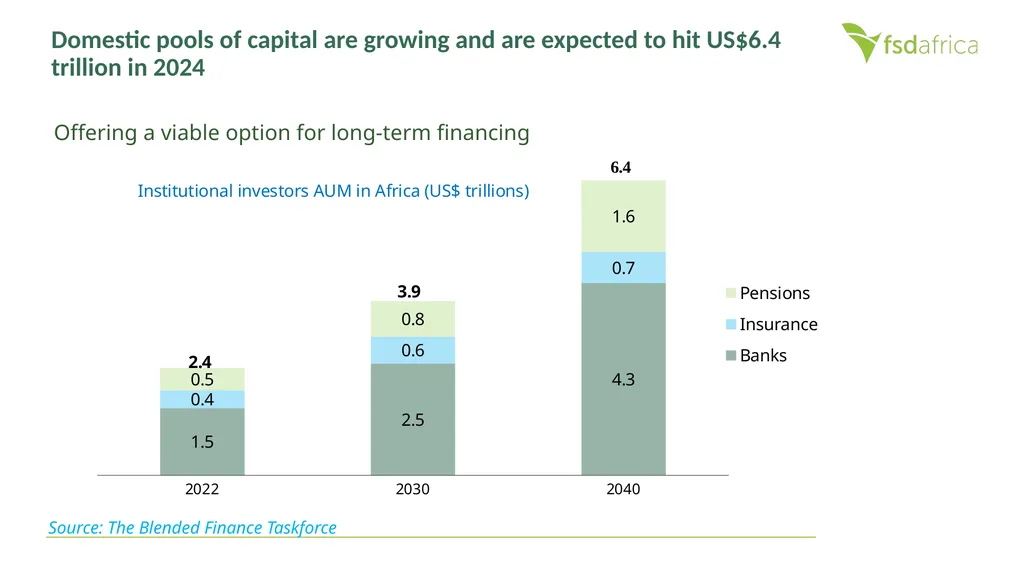
slide5. Offering a viable option for long-term financing Domestic pools of capital are growing and are expected to hit US$6.4 trillion in 2024 Source: The Blended Finance Taskforce<br>
slide6. Clearly, investment regulations are not an impediment to diversification into alternative assets Allocations in alternative assets remain significantly lower than allowable limits Source: National pension investment guidelines and periodic investment reports. Ghana’s 25% combines all alternative investments<br>
slide7. Domestic institutional investors have shied away from alternatives, but why is that changing? Higher “risk-free” interest rates driven by increased sovereign borrowing appetites. Capital markets are undeveloped Alternative investment structures do not align with pension funds’ objectives An enabling regulatory environment Growth in the size of pension assets has increased the appetite for additional risk<br>
slide8. Preliminary Identification of MDB assets suitable for transfer (Supply side)<br>
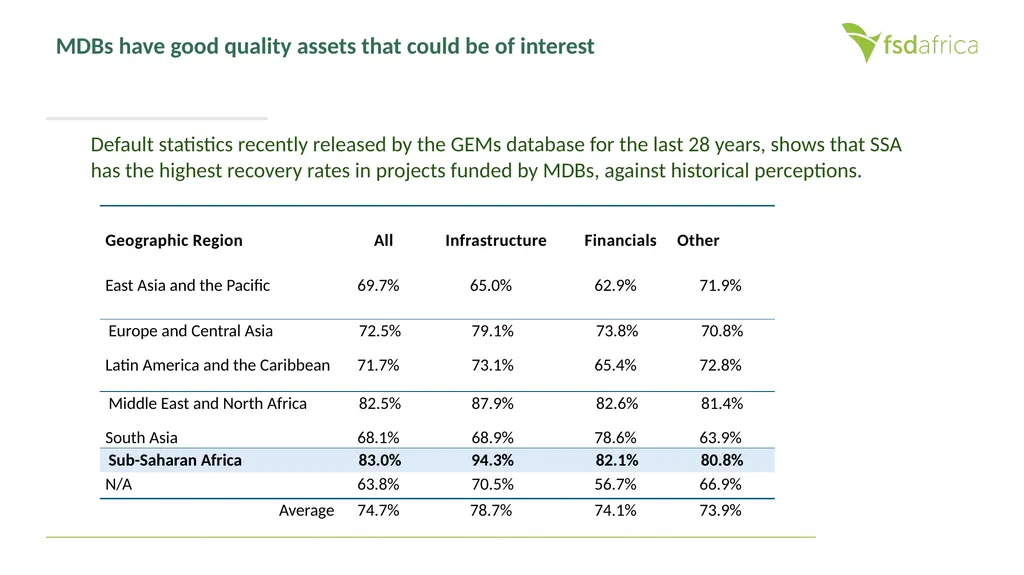
slide9. MDBs have good quality assets that could be of interest Default statistics recently released by the GEMs database for the last 28 years, shows that SSA has the highest recovery rates in projects funded by MDBs, against historical perceptions.<br>
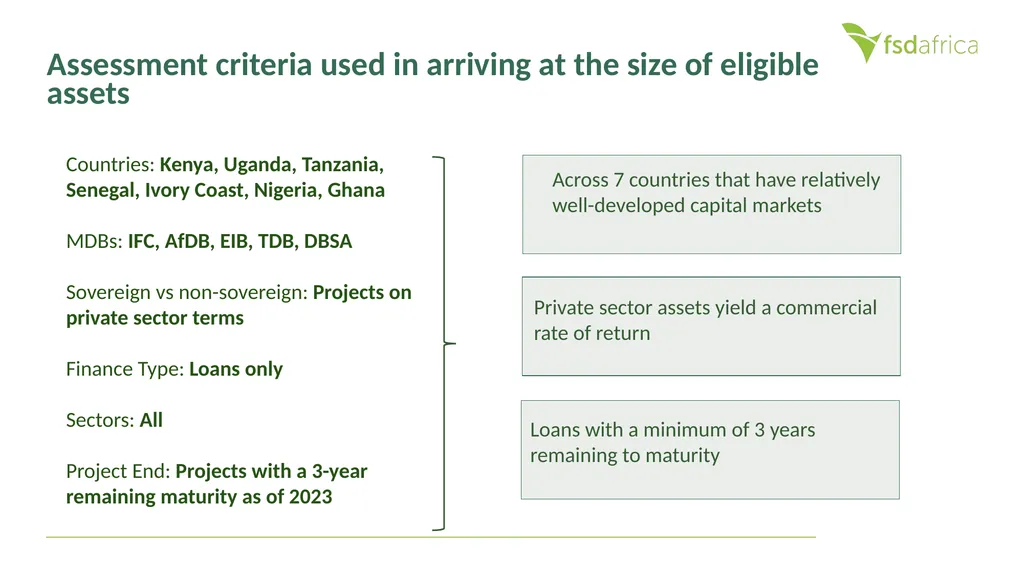
slide10. Assessment criteria used in arriving at the size of eligible assets Countries: Kenya, Uganda, Tanzania, Senegal, Ivory Coast, Nigeria, Ghana
MDBs: IFC, AfDB, EIB, TDB, DBSA
Sovereign vs non-sovereign: Projects on private sector terms
Finance Type: Loans only
Sectors: All
Project End: Projects with a 3-year remaining maturity as of 2023<br>
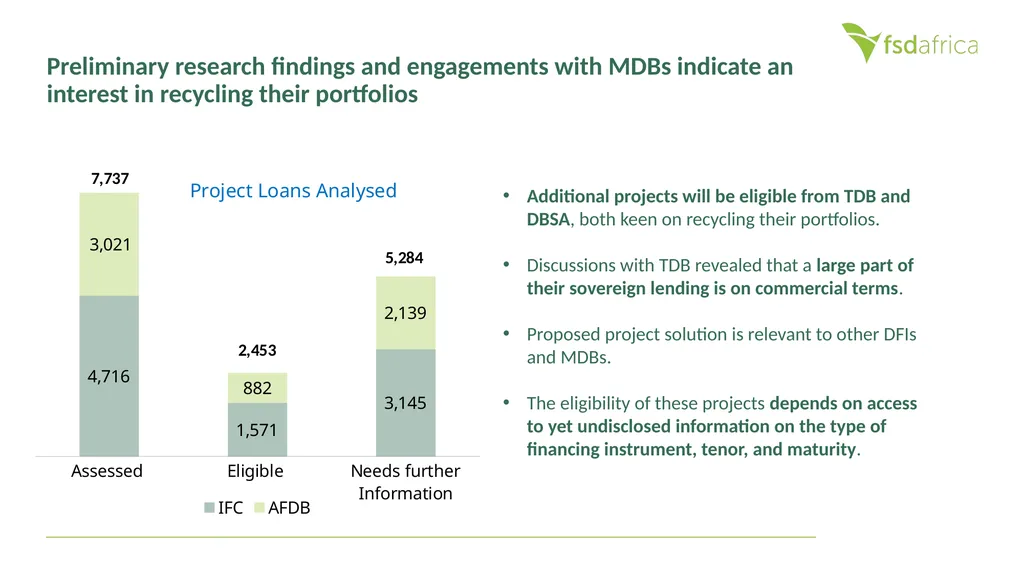
slide11. Preliminary research findings and engagements with MDBs indicate an interest in recycling their portfolios Additional projects will be eligible from TDB and DBSA, both keen on recycling their portfolios.
Discussions with TDB revealed that a large part of their sovereign lending is on commercial terms.
Proposed project solution is relevant to other DFIs and MDBs.
The eligibility of these projects depends on access to yet undisclosed information on the type of financing instrument, tenor, and maturity.<br>
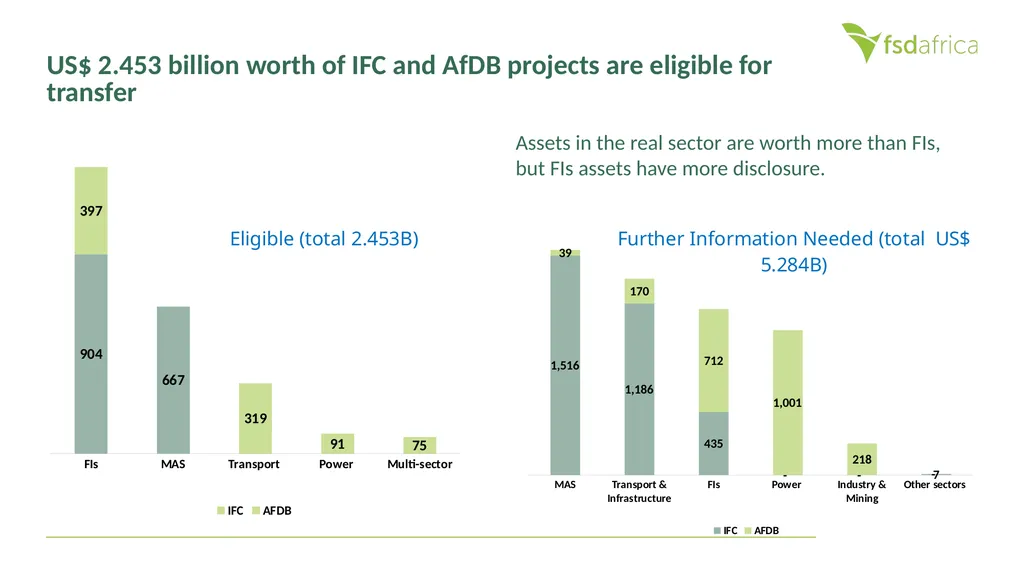
slide12. US$ 2.453 billion worth of IFC and AfDB projects are eligible for transfer Assets in the real sector are worth more than FIs, but FIs assets have more disclosure.<br>
slide13. Market sounding with institutional investors (Demand side)<br>
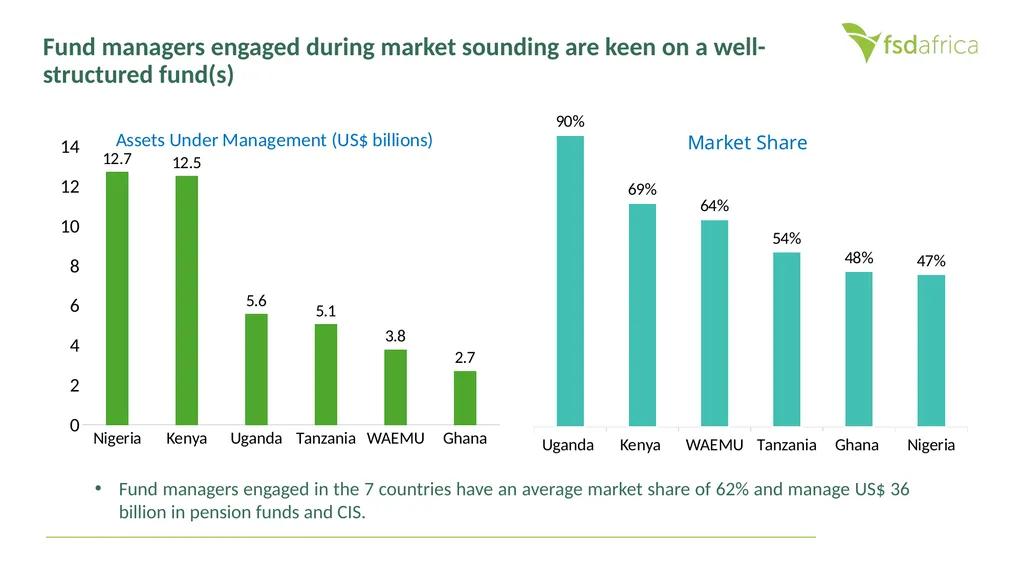
slide14. Fund managers engaged during market sounding are keen on a well-structured fund(s) Fund managers engaged in the 7 countries have an average market share of 62% and manage US$ 36 billion in pension funds and CIS.<br>
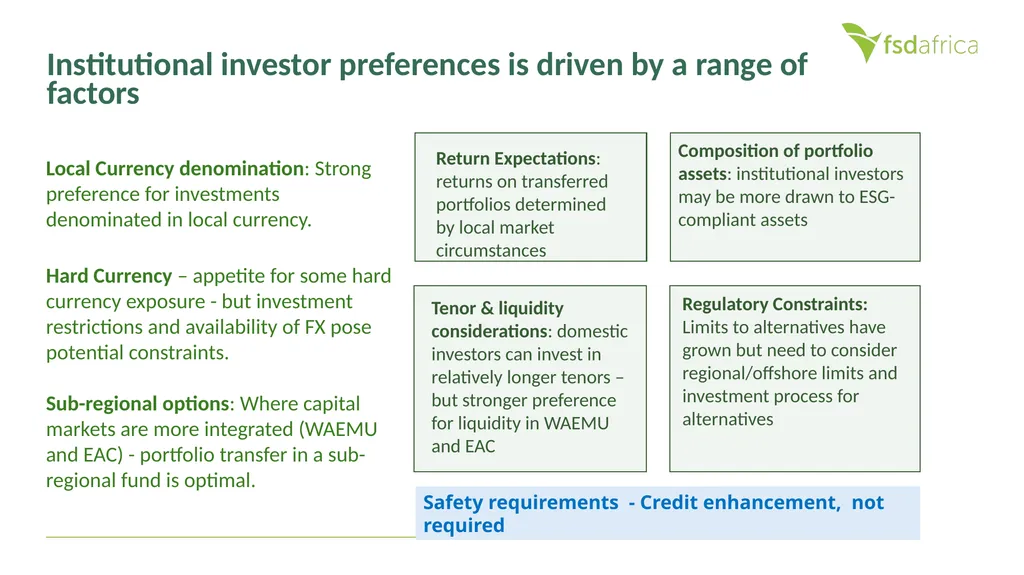
slide15. Institutional investor preferences is driven by a range of factors Local Currency denomination: Strong preference for investments denominated in local currency. Sub-regional options: Where capital markets are more integrated (WAEMU and EAC) - portfolio transfer in a sub-regional fund is optimal. Return Expectations: returns on transferred portfolios determined by local market circumstances Tenor & liquidity considerations: domestic investors can invest in relatively longer tenors – but stronger preference for liquidity in WAEMU and EAC Composition of portfolio assets: institutional investors may be more drawn to ESG-compliant assets Regulatory Constraints: Limits to alternatives have grown but need to consider regional/offshore limits and investment process for alternatives Hard Currency – appetite for some hard currency exposure - but investment restrictions and availability of FX pose potential constraints. Safety requirements - Credit enhancement, not required<br>
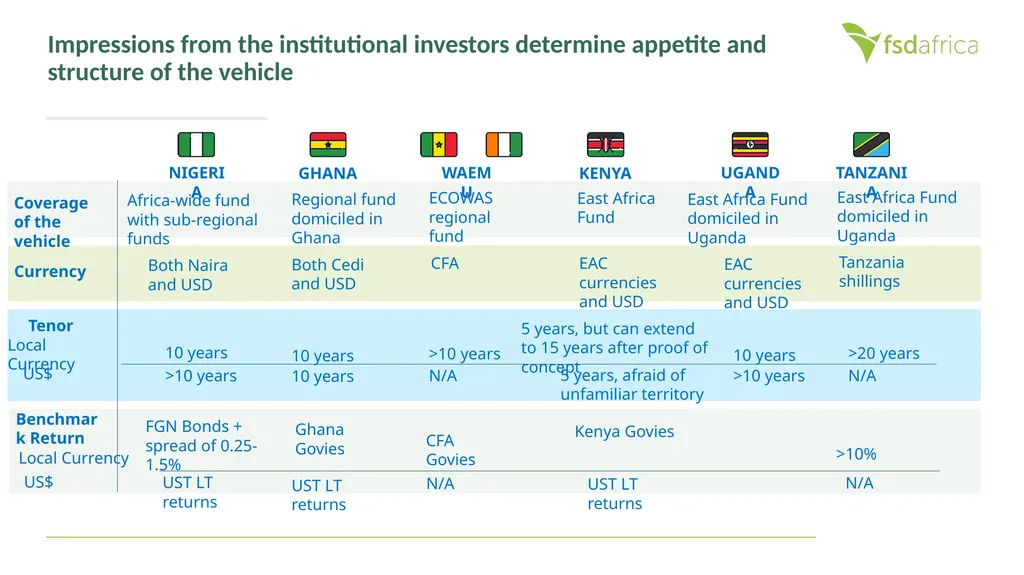
slide16. Impressions from the institutional investors determine appetite and structure of the vehicle NIGERIA GHANA WAEMU KENYA UGANDA TANZANIA Africa-wide fund with sub-regional funds Coverage of the vehicle Currency Tenor
Local Currency US$ Benchmark Return Local Currency US$ Both Naira and USD 10 years >10 years FGN Bonds + spread of 0.25-1.5% UST LT returns Regional fund domiciled in Ghana Both Cedi and USD 10 years 10 years Ghana Govies UST LT returns ECOWAS regional fund CFA >10 years N/A CFA Govies N/A East Africa
Fund EAC currencies and USD 5 years, but can extend to 15 years after proof of concept 5 years, afraid of unfamiliar territory Kenya Govies UST LT returns East Africa Fund domiciled in Uganda EAC currencies and USD 10 years >10 years East Africa Fund domiciled in Uganda Tanzania shillings >20 years N/A >10% N/A<br>
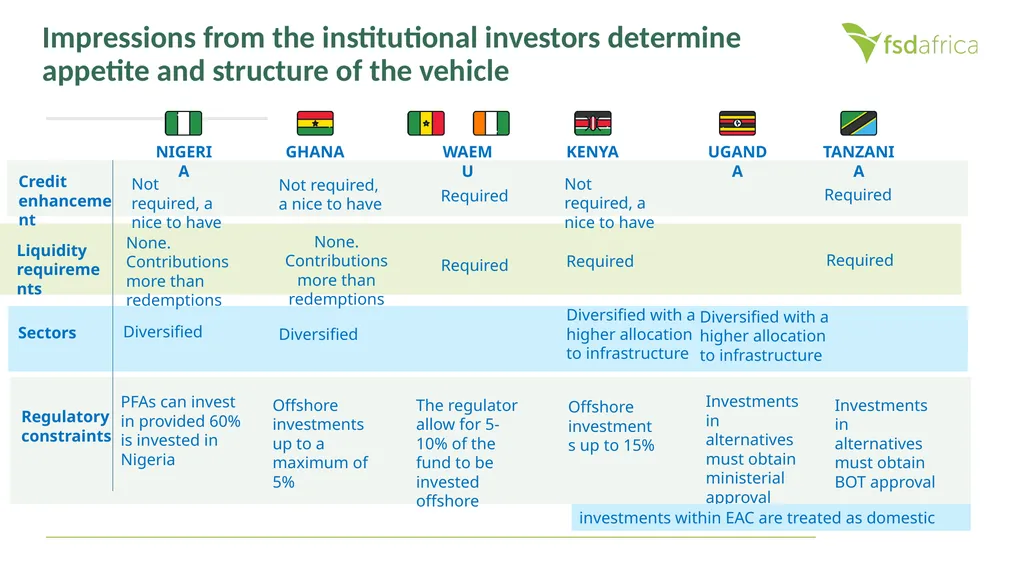
slide17. Impressions from the institutional investors determine appetite and structure of the vehicle NIGERIA GHANA WAEMU KENYA UGANDA TANZANIA Not required, a nice to have Credit enhancement Liquidity requirements Sectors Regulatory constraints None. Contributions more than redemptions Diversified PFAs can invest in provided 60% is invested in Nigeria Not required, a nice to have None. Contributions more than redemptions Diversified Offshore investments up to a maximum of 5% Required Required The regulator allow for 5-10% of the fund to be invested offshore Not required, a nice to have Required Diversified with a higher allocation to infrastructure Offshore investments up to 15% Required Required Investments in alternatives must obtain BOT approval Investments in alternatives must obtain ministerial approval Diversified with a higher allocation to infrastructure investments within EAC are treated as domestic<br>
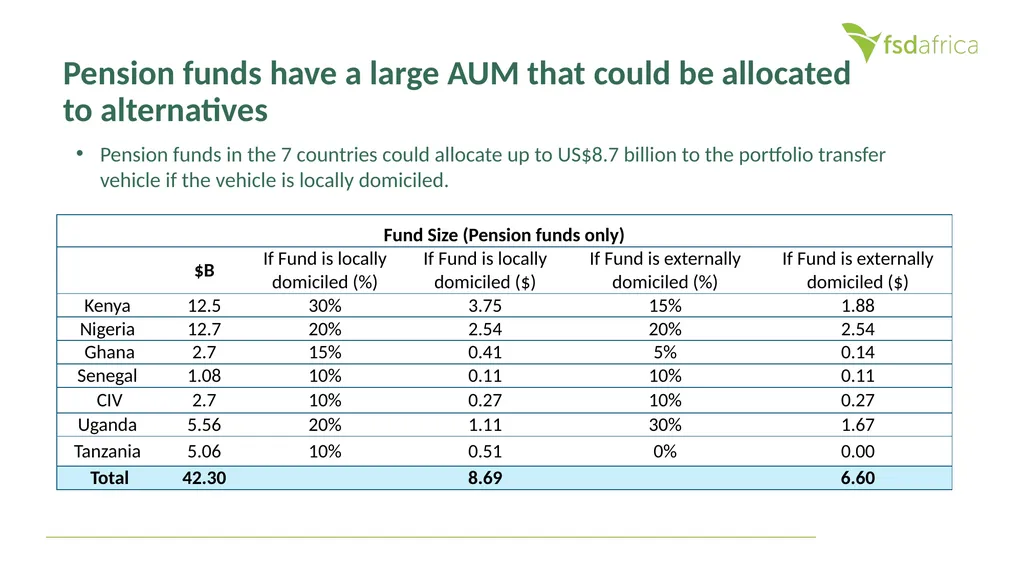
slide18. Pension funds have a large AUM that could be allocated to alternatives Pension funds in the 7 countries could allocate up to US$8.7 billion to the portfolio transfer vehicle if the vehicle is locally domiciled.<br>
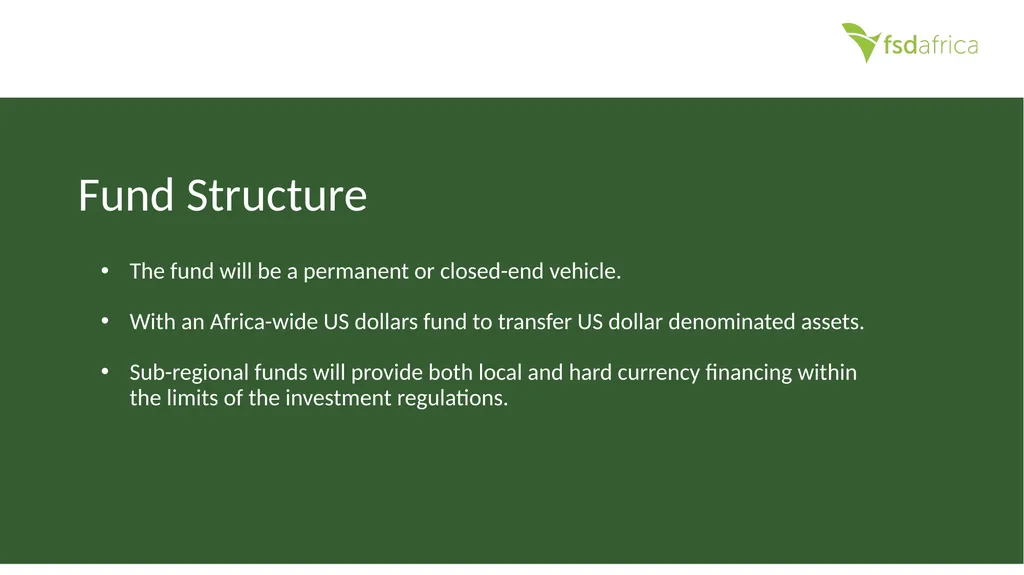
slide19. Fund Structure The fund will be a permanent or closed-end vehicle.
With an Africa-wide US dollars fund to transfer US dollar denominated assets.
Sub-regional funds will provide both local and hard currency financing within the limits of the investment regulations.<br>
slide20. An African-wide US$ fund and local currency driven sub-funds will be optimal given regulatory limits on offshore investments Investment regulations are more stringent on external investments but allow 10-30% in local domiciled alternative investment funds. Investment Committee Investors Anchor Investors
FSDAi
DFIs Other Investors
Pension Funds
Insurers
Investment Funds
Sovereign Funds
HNWIs Guarantors Fund Manager Umbrella Fund MDB Portfolio Transfer Fund Structure (Draft) Key: Africa Fund East Africa Sub-Fund West Africa Sub-Funds WAEMU Sub-Fund USD KES NGN CFA GHC KE, UG, YZ, NG, GH, CI, SN portfolios KE, UG, TZ portfolios NG
portfolio CI, SN portfolios GH
portfolio Fund Type Flow of Fund Direction Flow of Capital and Returns Flow of Management Fees Currency Eligible Assets<br>
slide21. The project builds on prior experiences where MDBs have leveraged on the private sector to mobilise finance IFC’s Managed Co-Lending Program
Syndication allows investors to participate in private placements alongside IFC.
Syndications totaling $11 billion since 2013.
Investors benefit from IFC’s diversified portfolio of investments and First-loss coverage provided by SIDA. AfDB’s Room-To-Run (R2R)
Securitized 45 well-performing brownfield, non-sovereign loans totaling $1 billion.
No single obligor >5% of transferred portfolio
AFDB retained first-loss tranche
Mezzanine tranche anchored by 2 investors
Senior tranche guaranteed by EU
AfDB maintained A- rating on senior tranche. ILX private sector initiative
ILX co-invests with MDBs and DFIs.
75% in newly originated loans
25% are refinancing<br>
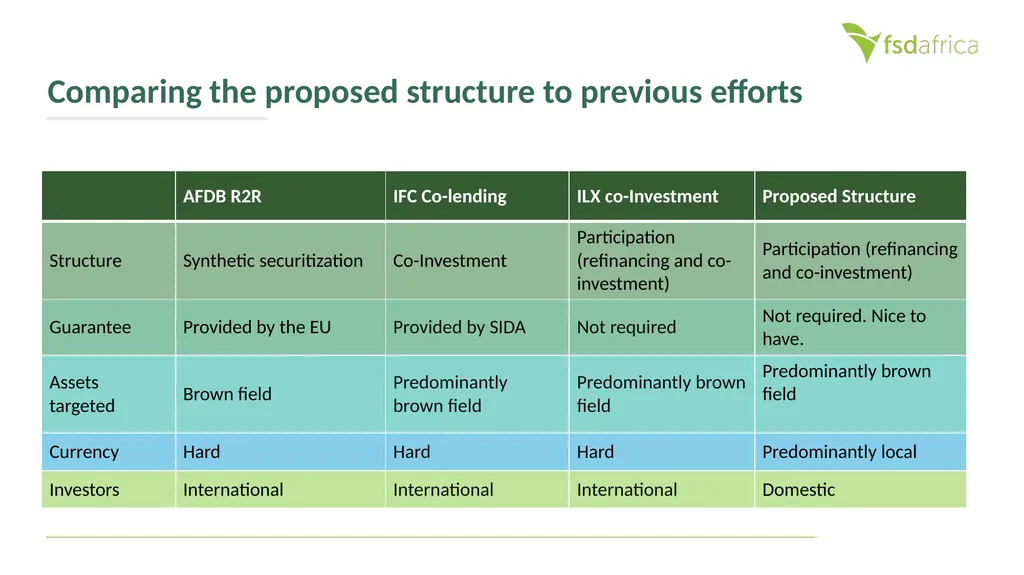
slide22. Comparing the proposed structure to previous efforts<br>
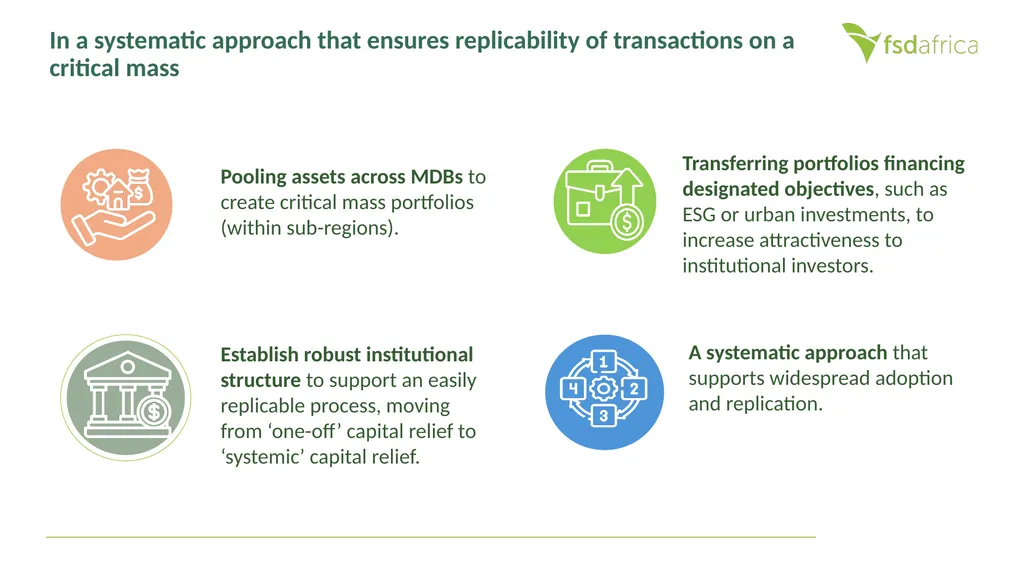
slide23. In a systematic approach that ensures replicability of transactions on a critical mass Pooling assets across MDBs to create critical mass portfolios (within sub-regions). Establish robust institutional structure to support an easily replicable process, moving from ‘one-off’ capital relief to ‘systemic’ capital relief. Transferring portfolios financing designated objectives, such as ESG or urban investments, to increase attractiveness to institutional investors. A systematic approach that supports widespread adoption and replication.<br>
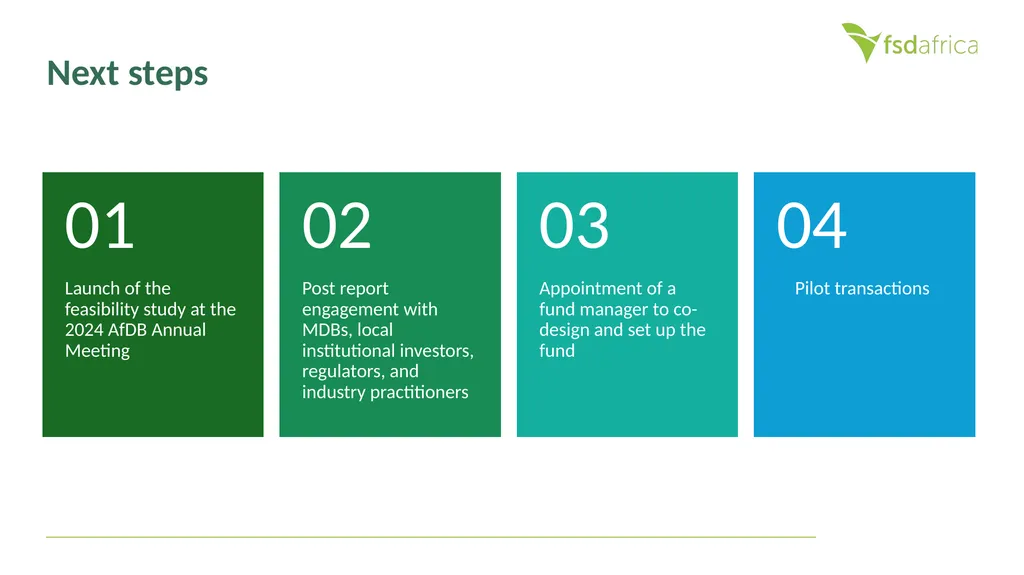
slide24. Next steps<br>
slide25. Thank You
FSD Africa contacts: evans@fsdafrica.org<br>
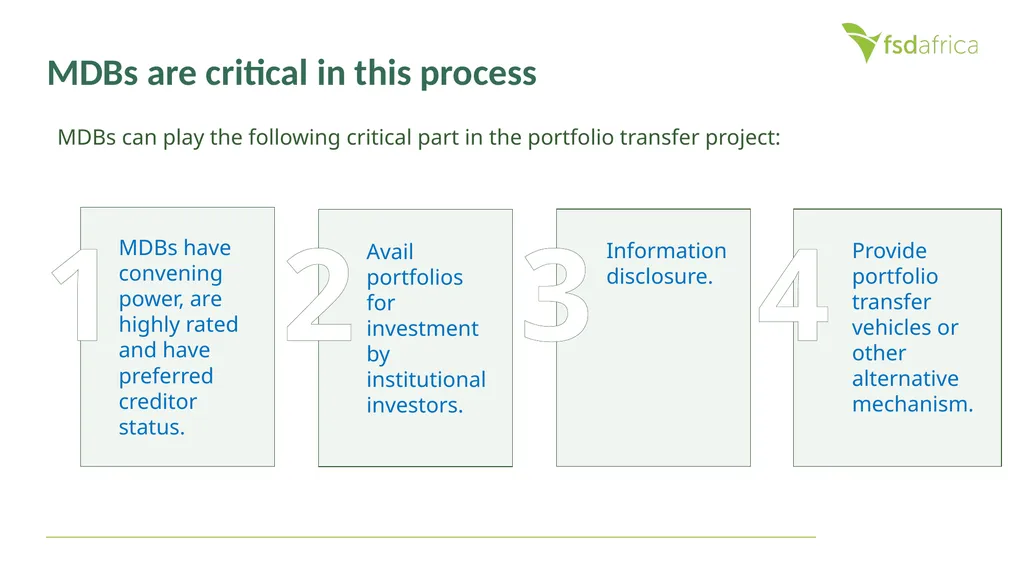
slide26. MDBs are critical in this process MDBs can play the following critical part in the portfolio transfer project: 1 2 3 4 MDBs have convening power, are highly rated and have preferred creditor status. Avail portfolios for investment by institutional investors. Information disclosure. Provide portfolio transfer vehicles or other alternative mechanism.<br>
Friday, 26 July 2024 Dr. Evans Osano
Director, Capital Markets<br>
slide2. (Supply side) Outline<br>
slide3. In June 2023, FSD Africa was selected by the MDB Challenge Fund to develop a “Local Currency Solution for Multilateral Development Bank Portfolio Transfer”.
Dual objectives of transferring parts of the MDB’s portfolios to local institutional investors in emerging markets.
Focuses on 7 countries in SSA. allowing MDBs to expand the scope and size of investments and the pace with which they create project pipeline. Develop local capital markets
Improve affordability for users/off-takers with local currency incomes Background & Introduction Free up capital The project is undertaken in 2 phases:
Phase 1: Feasibility Study
Inception report presented at IMF-WB annual meetings in Marrakech
Feasibility study launch at the AfDB annual meetings in Nairobi.
Phase 2: Design of vehicle and piloting of transactions
EOI issued for qualified fund managers.<br>
slide4. 4 $26bn $4bn $177bn $100bn Private sector 86% Public sector Private sector 64% 14% 36% 2030 $277bn Growth – to meet a need and an opportunity How can we grow private sector share of climate finance from $4bn today to $100bn by 2030? $30bn 2019/20 African NDCs assume 90% of the funding is private sector & international
Private sector’s share of climate finance is only 14% (lowest among the regions). Climate Finance Challenge in Africa<br>
slide5. Offering a viable option for long-term financing Domestic pools of capital are growing and are expected to hit US$6.4 trillion in 2024 Source: The Blended Finance Taskforce<br>
slide6. Clearly, investment regulations are not an impediment to diversification into alternative assets Allocations in alternative assets remain significantly lower than allowable limits Source: National pension investment guidelines and periodic investment reports. Ghana’s 25% combines all alternative investments<br>
slide7. Domestic institutional investors have shied away from alternatives, but why is that changing? Higher “risk-free” interest rates driven by increased sovereign borrowing appetites. Capital markets are undeveloped Alternative investment structures do not align with pension funds’ objectives An enabling regulatory environment Growth in the size of pension assets has increased the appetite for additional risk<br>
slide8. Preliminary Identification of MDB assets suitable for transfer (Supply side)<br>
slide9. MDBs have good quality assets that could be of interest Default statistics recently released by the GEMs database for the last 28 years, shows that SSA has the highest recovery rates in projects funded by MDBs, against historical perceptions.<br>
slide10. Assessment criteria used in arriving at the size of eligible assets Countries: Kenya, Uganda, Tanzania, Senegal, Ivory Coast, Nigeria, Ghana
MDBs: IFC, AfDB, EIB, TDB, DBSA
Sovereign vs non-sovereign: Projects on private sector terms
Finance Type: Loans only
Sectors: All
Project End: Projects with a 3-year remaining maturity as of 2023<br>
slide11. Preliminary research findings and engagements with MDBs indicate an interest in recycling their portfolios Additional projects will be eligible from TDB and DBSA, both keen on recycling their portfolios.
Discussions with TDB revealed that a large part of their sovereign lending is on commercial terms.
Proposed project solution is relevant to other DFIs and MDBs.
The eligibility of these projects depends on access to yet undisclosed information on the type of financing instrument, tenor, and maturity.<br>
slide12. US$ 2.453 billion worth of IFC and AfDB projects are eligible for transfer Assets in the real sector are worth more than FIs, but FIs assets have more disclosure.<br>
slide13. Market sounding with institutional investors (Demand side)<br>
slide14. Fund managers engaged during market sounding are keen on a well-structured fund(s) Fund managers engaged in the 7 countries have an average market share of 62% and manage US$ 36 billion in pension funds and CIS.<br>
slide15. Institutional investor preferences is driven by a range of factors Local Currency denomination: Strong preference for investments denominated in local currency. Sub-regional options: Where capital markets are more integrated (WAEMU and EAC) - portfolio transfer in a sub-regional fund is optimal. Return Expectations: returns on transferred portfolios determined by local market circumstances Tenor & liquidity considerations: domestic investors can invest in relatively longer tenors – but stronger preference for liquidity in WAEMU and EAC Composition of portfolio assets: institutional investors may be more drawn to ESG-compliant assets Regulatory Constraints: Limits to alternatives have grown but need to consider regional/offshore limits and investment process for alternatives Hard Currency – appetite for some hard currency exposure - but investment restrictions and availability of FX pose potential constraints. Safety requirements - Credit enhancement, not required<br>
slide16. Impressions from the institutional investors determine appetite and structure of the vehicle NIGERIA GHANA WAEMU KENYA UGANDA TANZANIA Africa-wide fund with sub-regional funds Coverage of the vehicle Currency Tenor
Local Currency US$ Benchmark Return Local Currency US$ Both Naira and USD 10 years >10 years FGN Bonds + spread of 0.25-1.5% UST LT returns Regional fund domiciled in Ghana Both Cedi and USD 10 years 10 years Ghana Govies UST LT returns ECOWAS regional fund CFA >10 years N/A CFA Govies N/A East Africa
Fund EAC currencies and USD 5 years, but can extend to 15 years after proof of concept 5 years, afraid of unfamiliar territory Kenya Govies UST LT returns East Africa Fund domiciled in Uganda EAC currencies and USD 10 years >10 years East Africa Fund domiciled in Uganda Tanzania shillings >20 years N/A >10% N/A<br>
slide17. Impressions from the institutional investors determine appetite and structure of the vehicle NIGERIA GHANA WAEMU KENYA UGANDA TANZANIA Not required, a nice to have Credit enhancement Liquidity requirements Sectors Regulatory constraints None. Contributions more than redemptions Diversified PFAs can invest in provided 60% is invested in Nigeria Not required, a nice to have None. Contributions more than redemptions Diversified Offshore investments up to a maximum of 5% Required Required The regulator allow for 5-10% of the fund to be invested offshore Not required, a nice to have Required Diversified with a higher allocation to infrastructure Offshore investments up to 15% Required Required Investments in alternatives must obtain BOT approval Investments in alternatives must obtain ministerial approval Diversified with a higher allocation to infrastructure investments within EAC are treated as domestic<br>
slide18. Pension funds have a large AUM that could be allocated to alternatives Pension funds in the 7 countries could allocate up to US$8.7 billion to the portfolio transfer vehicle if the vehicle is locally domiciled.<br>
slide19. Fund Structure The fund will be a permanent or closed-end vehicle.
With an Africa-wide US dollars fund to transfer US dollar denominated assets.
Sub-regional funds will provide both local and hard currency financing within the limits of the investment regulations.<br>
slide20. An African-wide US$ fund and local currency driven sub-funds will be optimal given regulatory limits on offshore investments Investment regulations are more stringent on external investments but allow 10-30% in local domiciled alternative investment funds. Investment Committee Investors Anchor Investors
FSDAi
DFIs Other Investors
Pension Funds
Insurers
Investment Funds
Sovereign Funds
HNWIs Guarantors Fund Manager Umbrella Fund MDB Portfolio Transfer Fund Structure (Draft) Key: Africa Fund East Africa Sub-Fund West Africa Sub-Funds WAEMU Sub-Fund USD KES NGN CFA GHC KE, UG, YZ, NG, GH, CI, SN portfolios KE, UG, TZ portfolios NG
portfolio CI, SN portfolios GH
portfolio Fund Type Flow of Fund Direction Flow of Capital and Returns Flow of Management Fees Currency Eligible Assets<br>
slide21. The project builds on prior experiences where MDBs have leveraged on the private sector to mobilise finance IFC’s Managed Co-Lending Program
Syndication allows investors to participate in private placements alongside IFC.
Syndications totaling $11 billion since 2013.
Investors benefit from IFC’s diversified portfolio of investments and First-loss coverage provided by SIDA. AfDB’s Room-To-Run (R2R)
Securitized 45 well-performing brownfield, non-sovereign loans totaling $1 billion.
No single obligor >5% of transferred portfolio
AFDB retained first-loss tranche
Mezzanine tranche anchored by 2 investors
Senior tranche guaranteed by EU
AfDB maintained A- rating on senior tranche. ILX private sector initiative
ILX co-invests with MDBs and DFIs.
75% in newly originated loans
25% are refinancing<br>
slide22. Comparing the proposed structure to previous efforts<br>
slide23. In a systematic approach that ensures replicability of transactions on a critical mass Pooling assets across MDBs to create critical mass portfolios (within sub-regions). Establish robust institutional structure to support an easily replicable process, moving from ‘one-off’ capital relief to ‘systemic’ capital relief. Transferring portfolios financing designated objectives, such as ESG or urban investments, to increase attractiveness to institutional investors. A systematic approach that supports widespread adoption and replication.<br>
slide24. Next steps<br>
slide25. Thank You
FSD Africa contacts: evans@fsdafrica.org<br>
slide26. MDBs are critical in this process MDBs can play the following critical part in the portfolio transfer project: 1 2 3 4 MDBs have convening power, are highly rated and have preferred creditor status. Avail portfolios for investment by institutional investors. Information disclosure. Provide portfolio transfer vehicles or other alternative mechanism.<br>