LS Means web example http:onbiostatistics.blogspot.com200904least-squares-means-marginal-means-vs.html Data Model with only main effects (JMP output): Center Level Least Sq Mean Mean 1 4.00 4.00 2 6.00 6.00 Model with only main effects
"LS Means web example" is the property of its rightful owner. Permission is granted to
download and print the materials on this website for personal, non-commercial use only, and to display it
on your personal computer provided you do not modify the materials and that you retain all copyright
notices contained in the materials. By downloading content from our website, you accept the terms of this
agreement.
Presentation Transcript
01
LS Means web example
http://onbiostatistics.blogspot.com/2009/04/least-squares-means-marginal-means-vs.html<br>
02
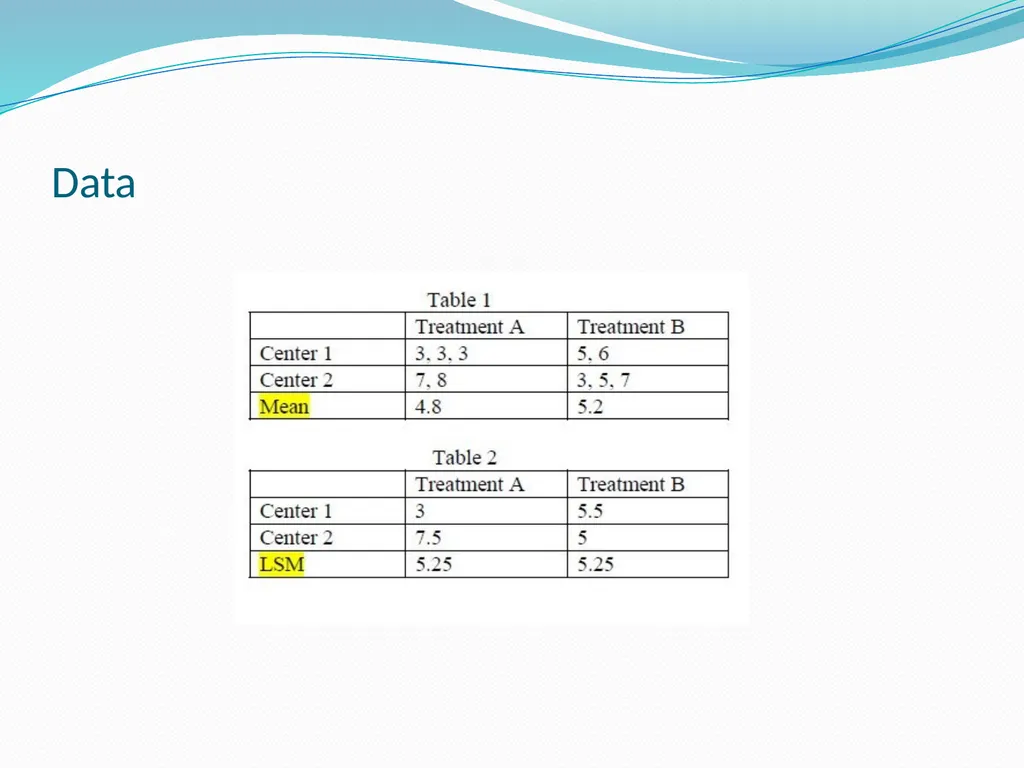
Data<br>
03
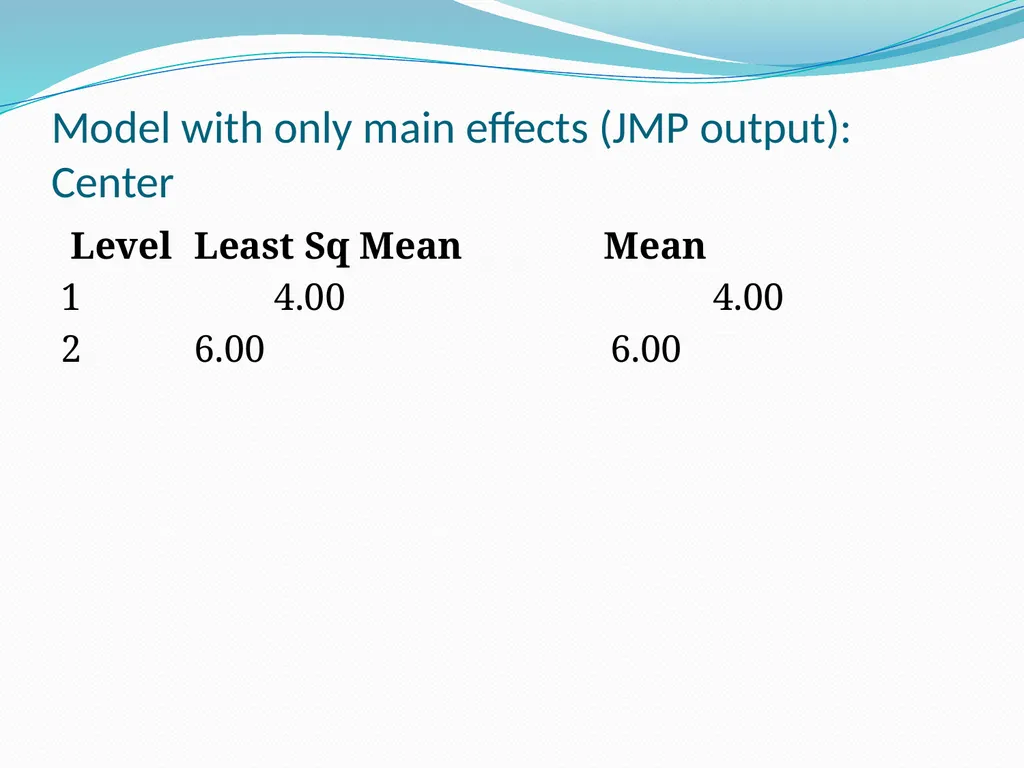
Model with only main effects (JMP output): Center Level Least Sq Mean Mean
1 4.00 4.00
2 6.00 6.00<br>
04
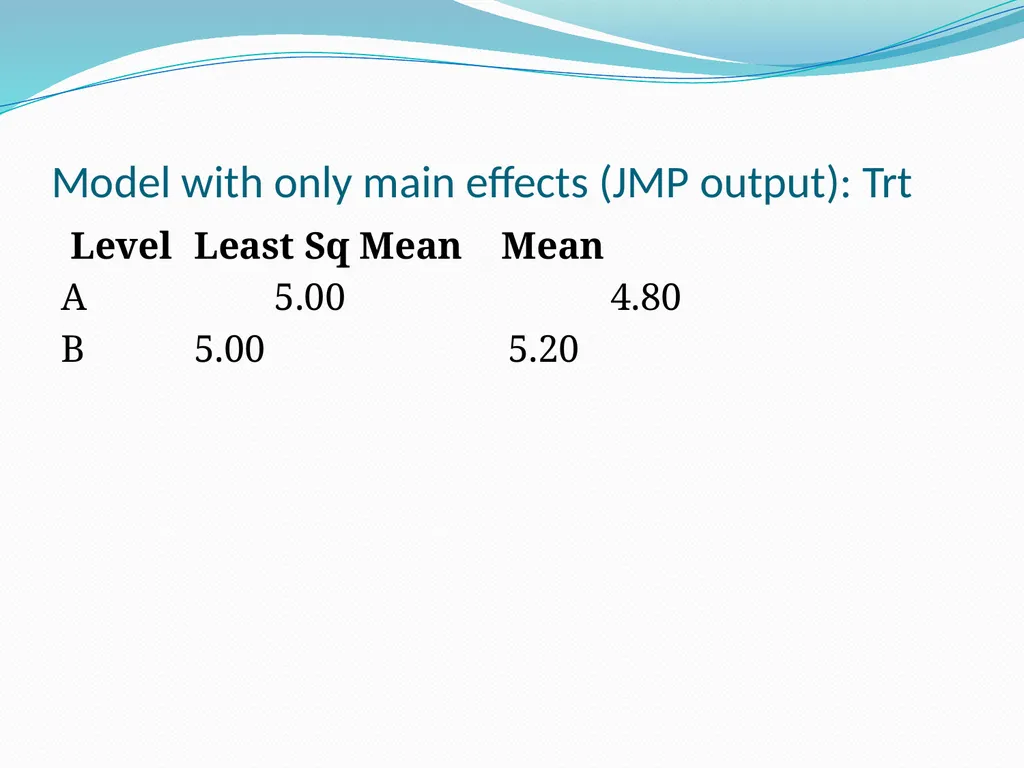
Model with only main effects (JMP output): Trt Level Least Sq Mean Mean
A 5.00 4.80
B 5.00 5.20<br>
05
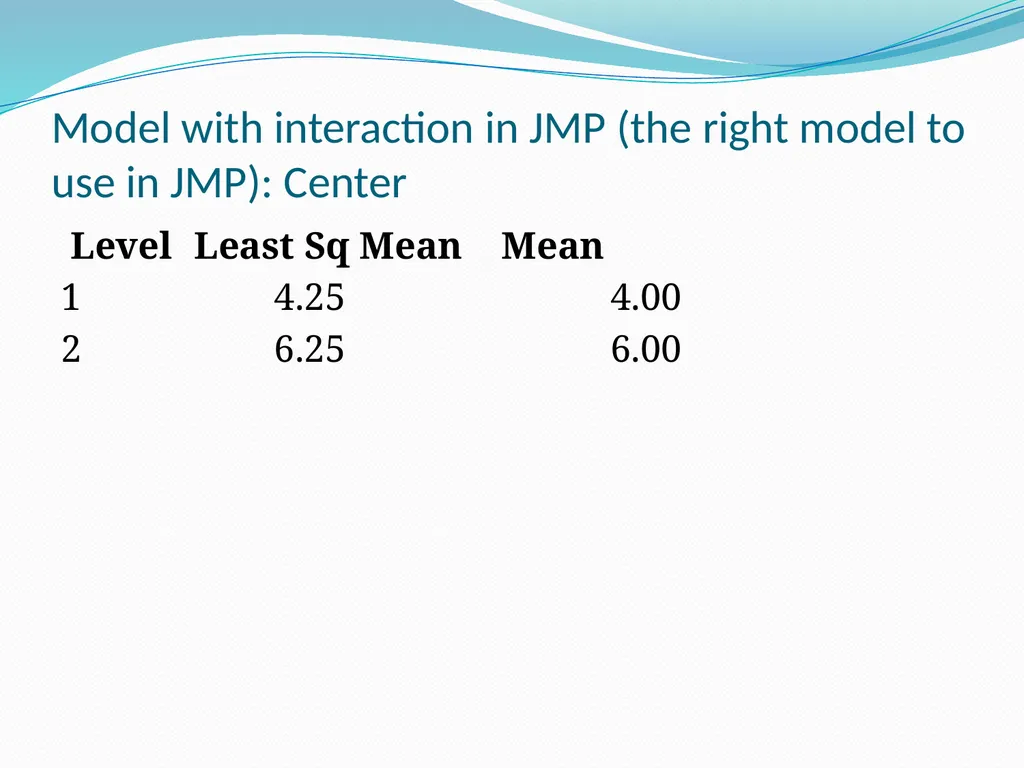
Model with interaction in JMP (the right model to use in JMP): Center Level Least Sq Mean Mean
1 4.25 4.00
2 6.25 6.00<br>
06
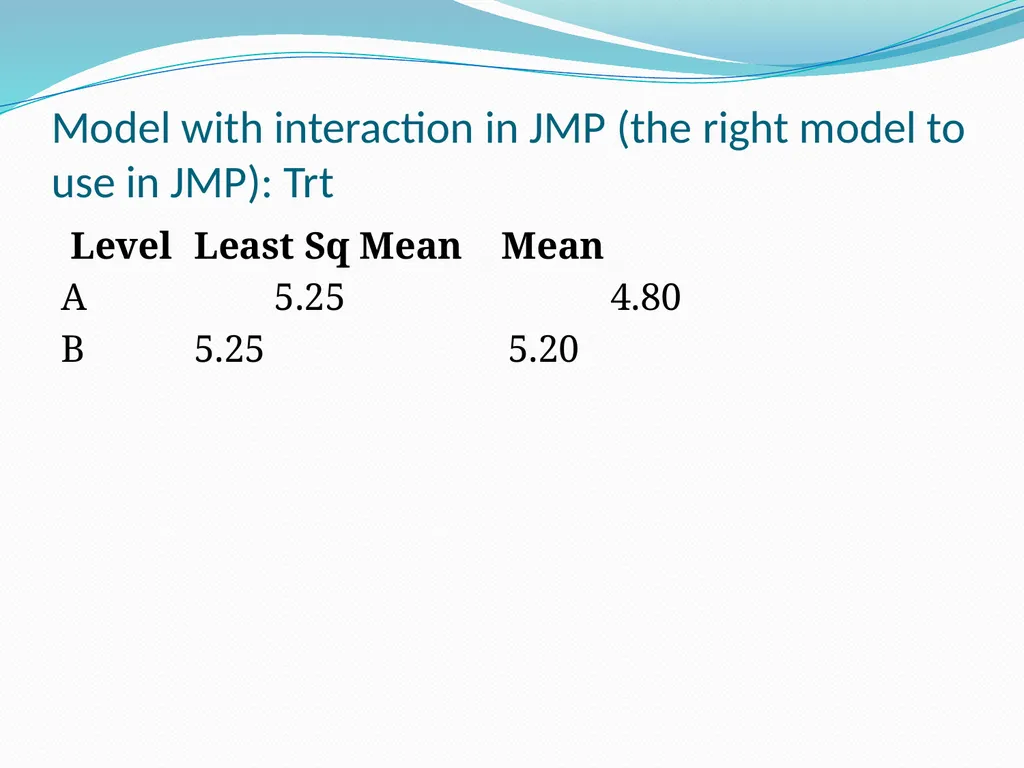
Model with interaction in JMP (the right model to use in JMP): Trt Level Least Sq Mean Mean
A 5.25 4.80
B 5.25 5.20<br>
07
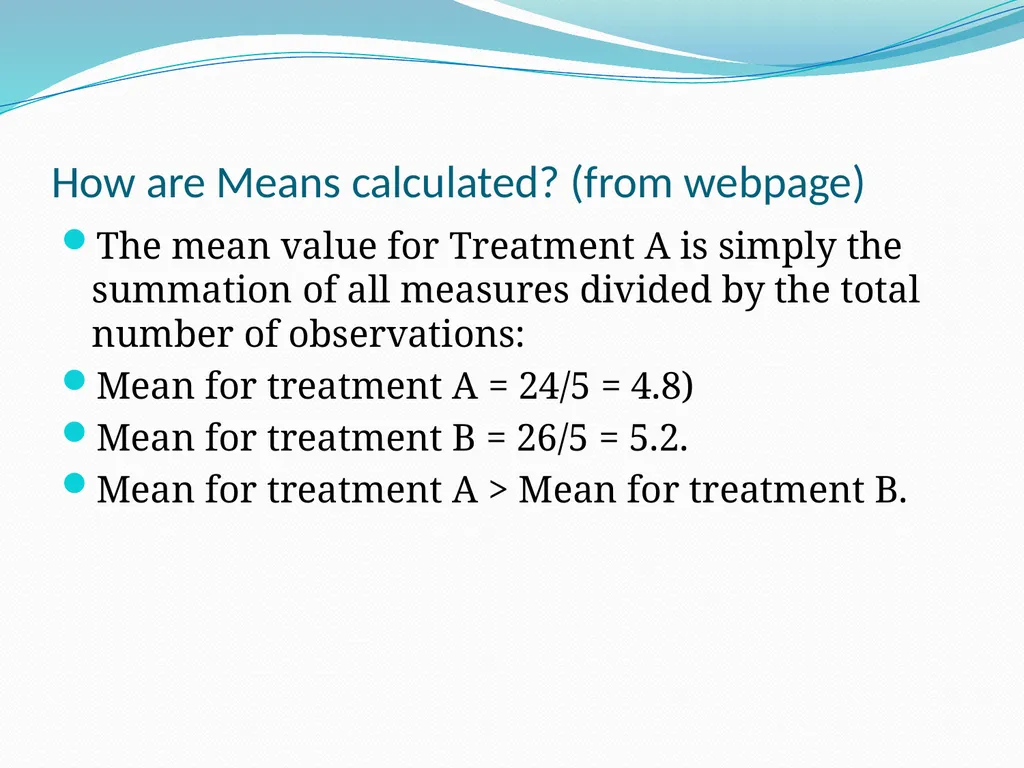
How are Means calculated? (from webpage) The mean value for Treatment A is simply the summation of all measures divided by the total number of observations:
Mean for treatment A = 24/5 = 4.8)
Mean for treatment B = 26/5 = 5.2.
Mean for treatment A > Mean for treatment B.<br>
08
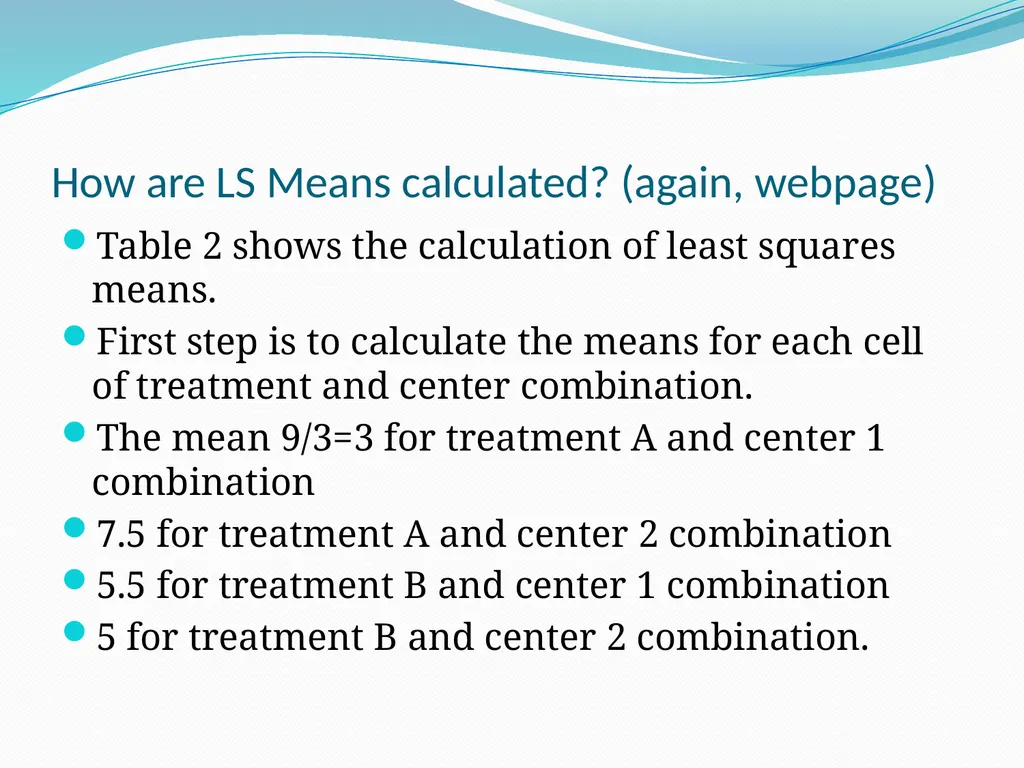
How are LS Means calculated? (again, webpage) Table 2 shows the calculation of least squares means.
First step is to calculate the means for each cell of treatment and center combination.
The mean 9/3=3 for treatment A and center 1 combination
7.5 for treatment A and center 2 combination
5.5 for treatment B and center 1 combination
5 for treatment B and center 2 combination.<br>
09
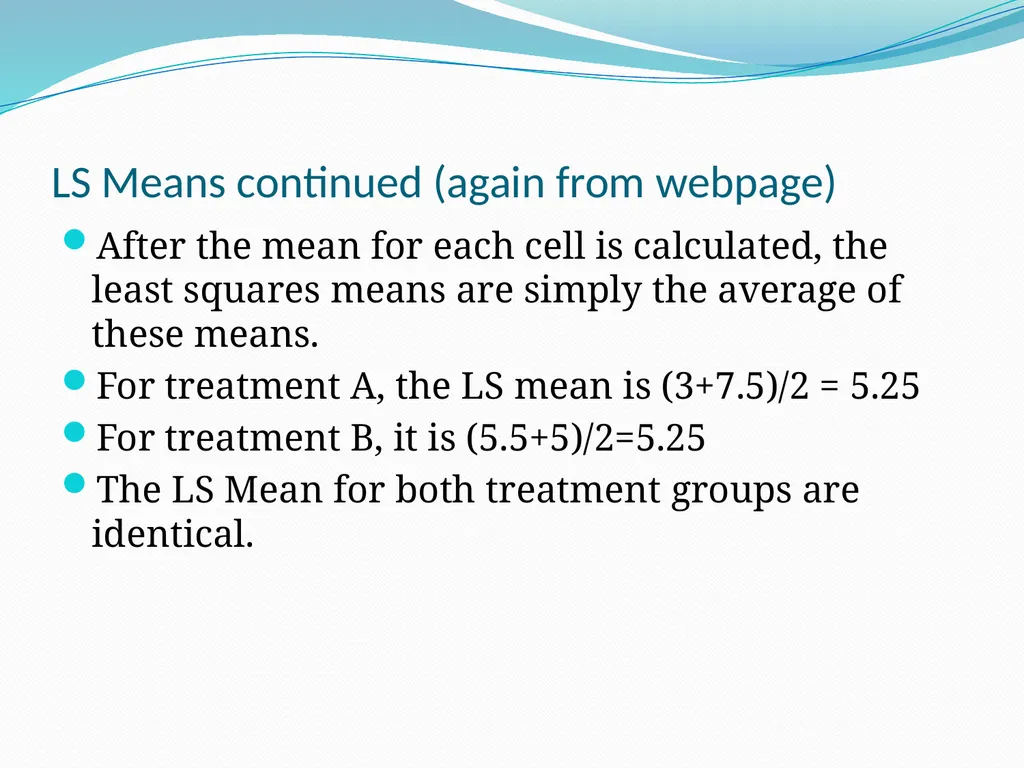
LS Means continued (again from webpage) After the mean for each cell is calculated, the least squares means are simply the average of these means.
For treatment A, the LS mean is (3+7.5)/2 = 5.25
For treatment B, it is (5.5+5)/2=5.25
The LS Mean for both treatment groups are identical.<br>
10
Ahh, that’s fine, but what about empty cells? First fit a two-way model with least squares
Then estimate the predicted value for that empty cell
Put that value in as though it were “real” data, this is called “imputing” the value
Redo the analysis and voila, you get the LS Means!!!
One can do this iteratively and this is called “multiple imputation”, but that gets used elsewhere in Statistics (i.e. you don’t have to worry about it)<br>
11
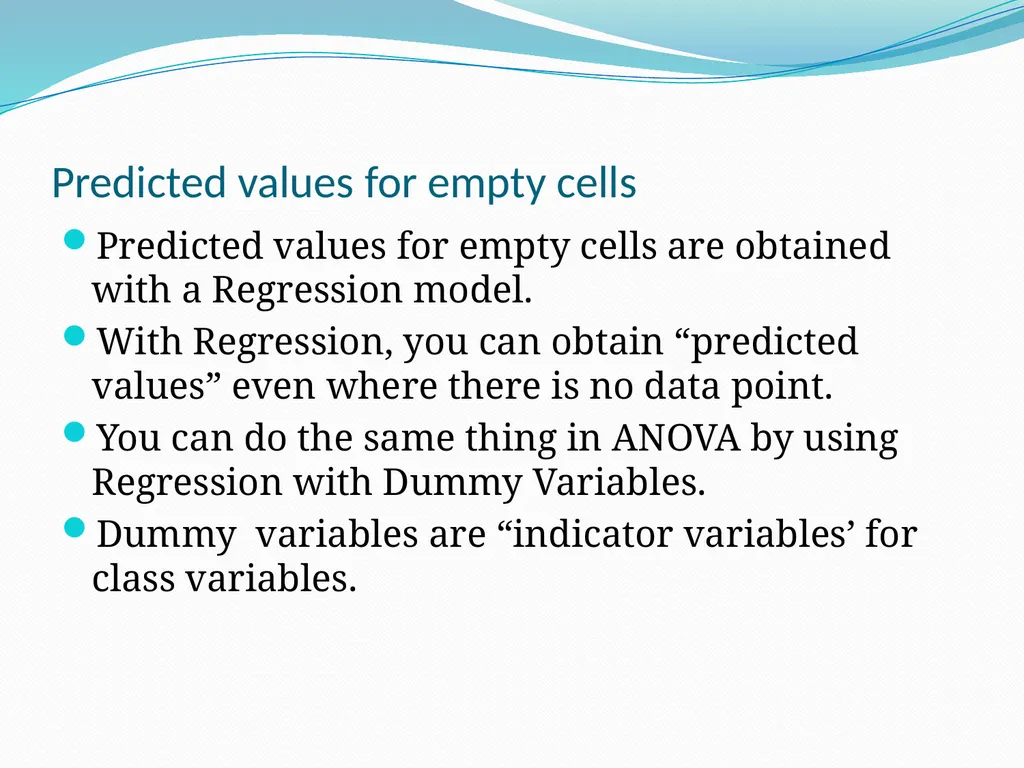
Predicted values for empty cells Predicted values for empty cells are obtained with a Regression model.
With Regression, you can obtain “predicted values” even where there is no data point.
You can do the same thing in ANOVA by using Regression with Dummy Variables.
Dummy variables are “indicator variables’ for class variables.<br>