04
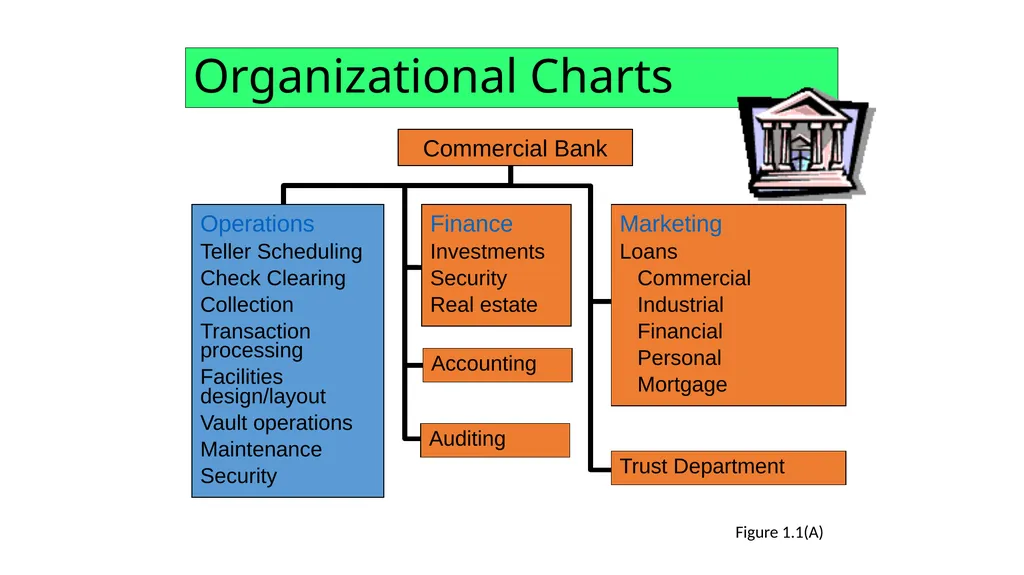
Organizational Charts Commercial Bank Figure 1.1(A)<br>
05
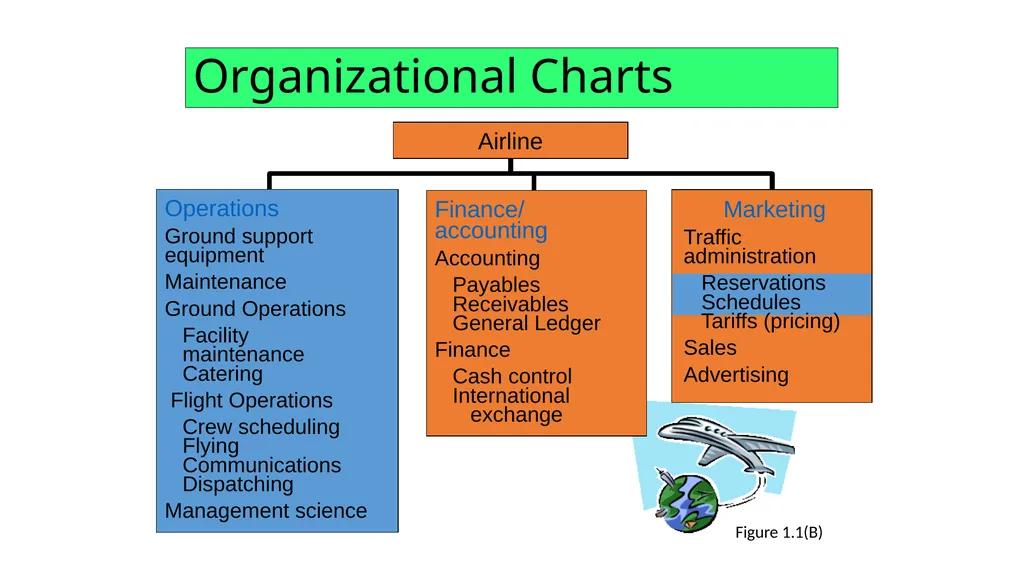
Organizational Charts Airline Figure 1.1(B)<br>
06
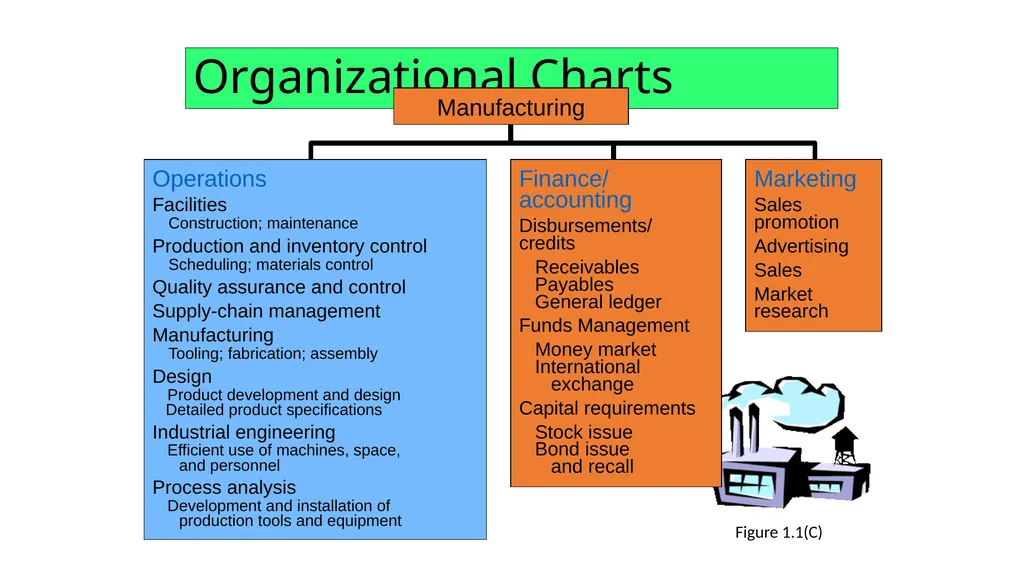
Organizational Charts Manufacturing Figure 1.1(C)<br>
07
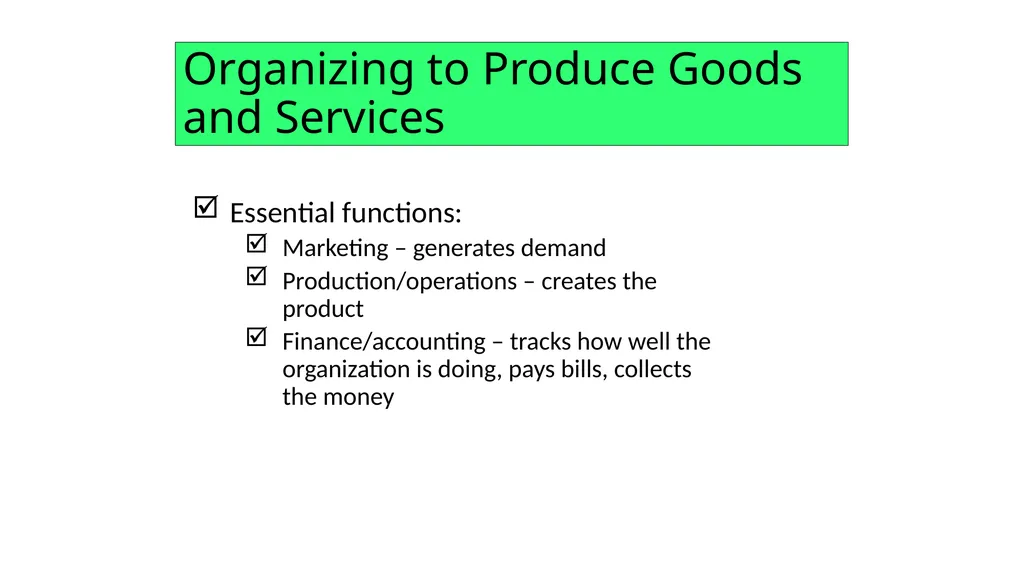
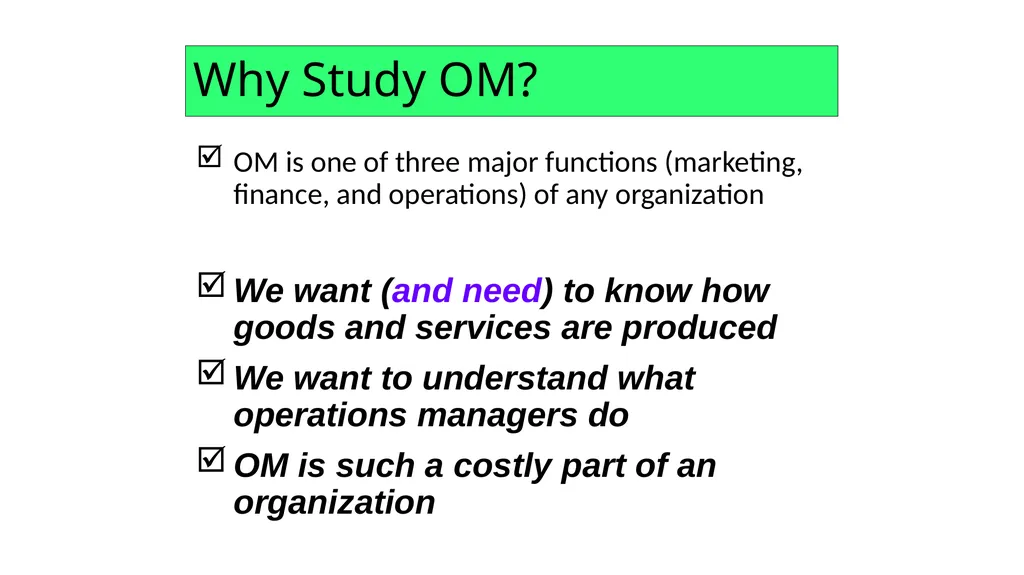
Why Study OM? OM is one of three major functions (marketing, finance, and operations) of any organization We want (and need) to know how goods and services are produced
We want to understand what operations managers do
OM is such a costly part of an organization<br>
08
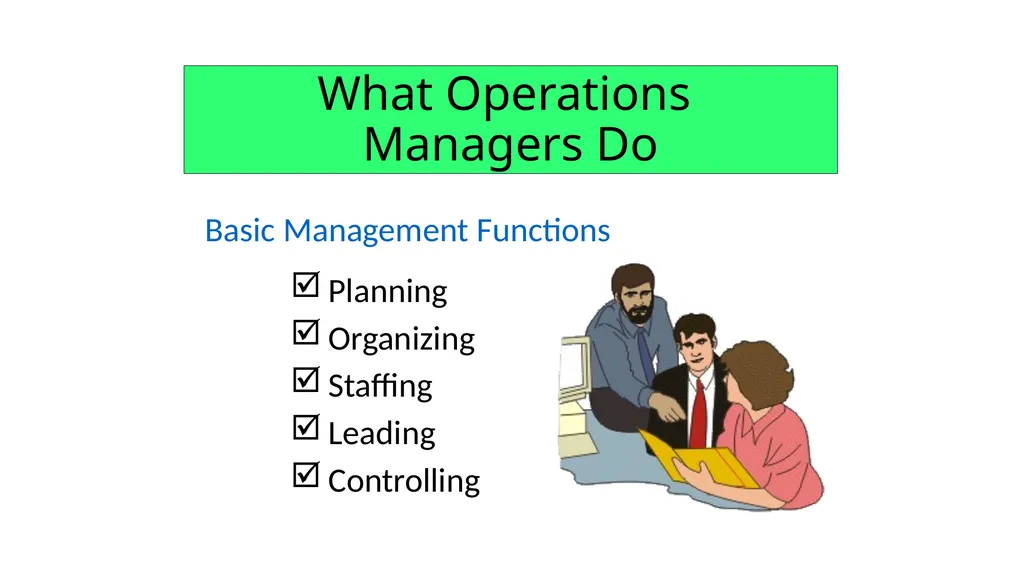
What Operations �Managers Do Planning
Organizing
Staffing
Leading
Controlling Basic Management Functions<br>
09
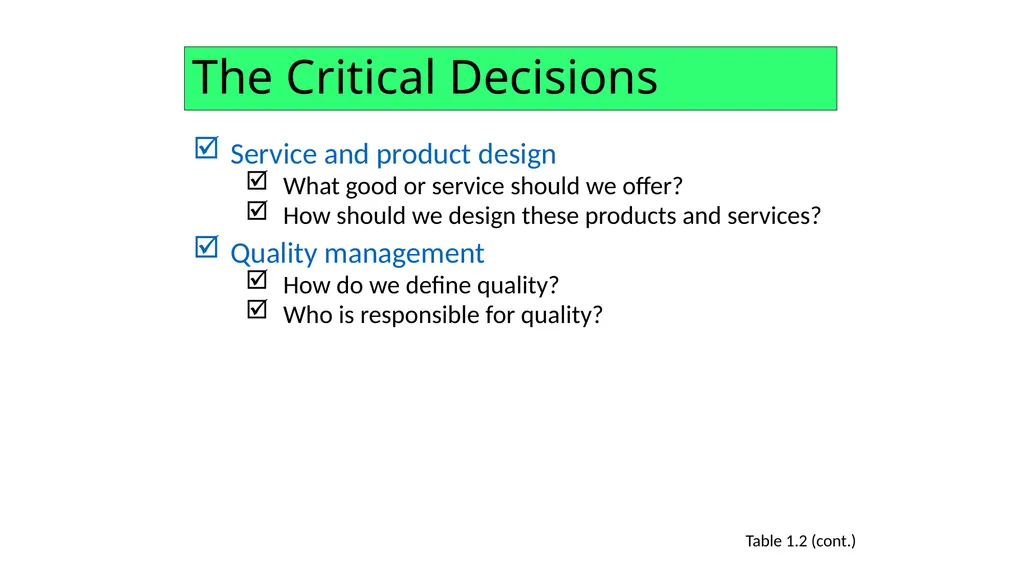
The Critical Decisions Service and product design
What good or service should we offer?
How should we design these products and services?
Quality management
How do we define quality?
Who is responsible for quality? Table 1.2 (cont.)<br>
10
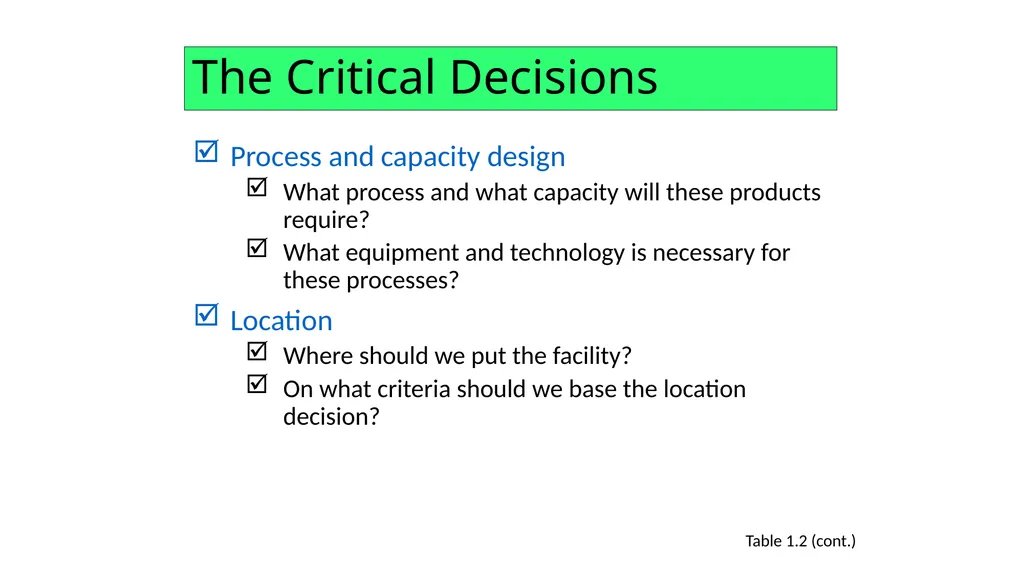
The Critical Decisions Process and capacity design
What process and what capacity will these products require?
What equipment and technology is necessary for these processes?
Location
Where should we put the facility?
On what criteria should we base the location decision? Table 1.2 (cont.)<br>
11
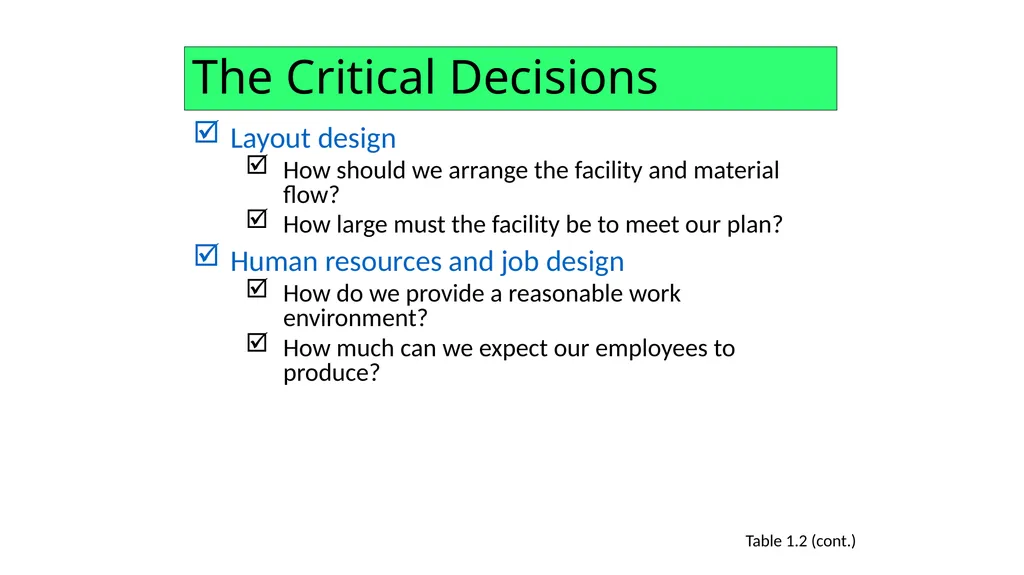
The Critical Decisions Layout design
How should we arrange the facility and material flow?
How large must the facility be to meet our plan?
Human resources and job design
How do we provide a reasonable work environment?
How much can we expect our employees to produce? Table 1.2 (cont.)<br>
12
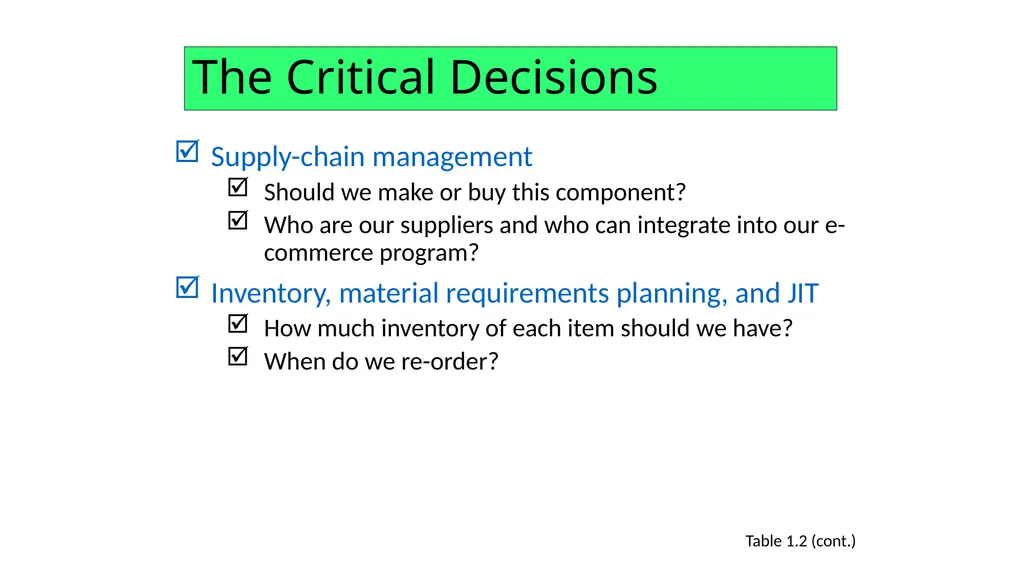
The Critical Decisions Supply-chain management
Should we make or buy this component?
Who are our suppliers and who can integrate into our e-commerce program?
Inventory, material requirements planning, and JIT
How much inventory of each item should we have?
When do we re-order? Table 1.2 (cont.)<br>
13
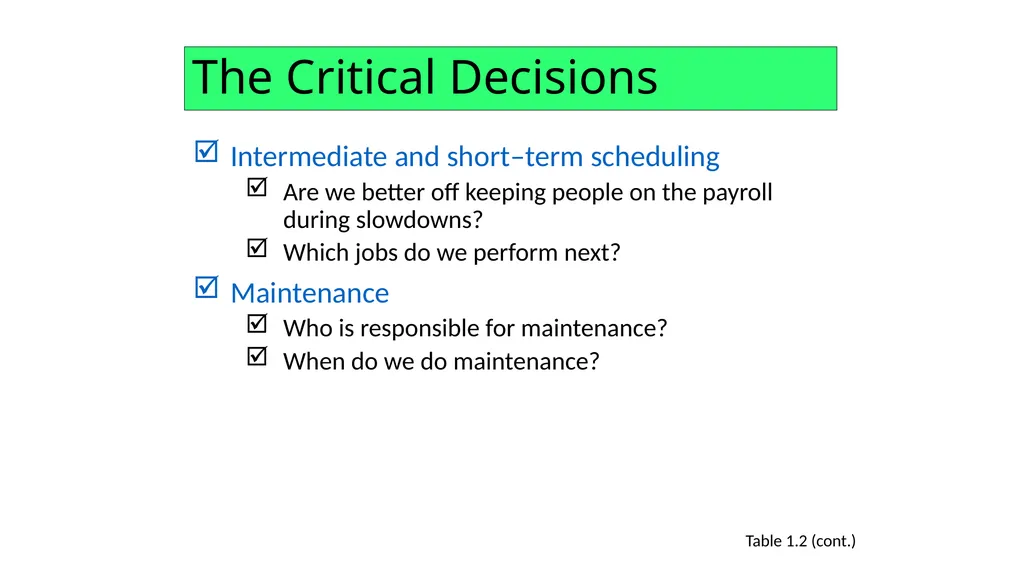
The Critical Decisions Intermediate and short–term scheduling
Are we better off keeping people on the payroll during slowdowns?
Which jobs do we perform next?
Maintenance
Who is responsible for maintenance?
When do we do maintenance? Table 1.2 (cont.)<br>
14
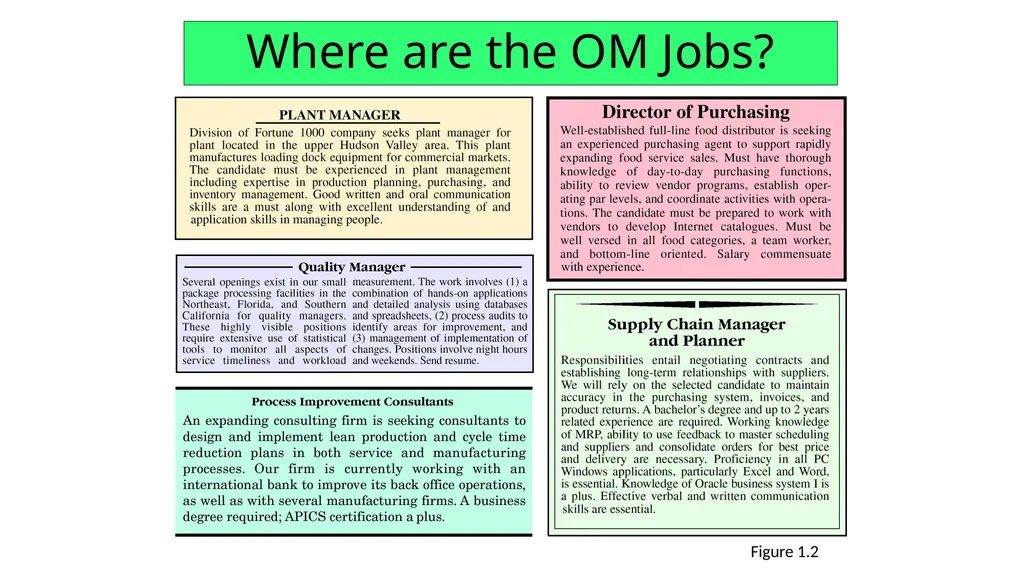
Where are the OM Jobs? Figure 1.2<br>
15
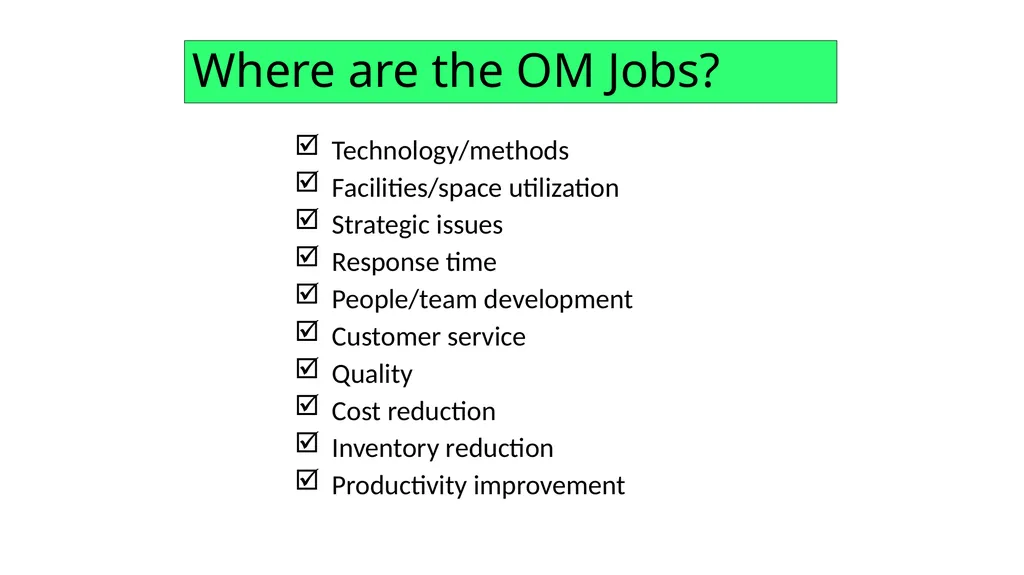
Where are the OM Jobs? Technology/methods
Facilities/space utilization
Strategic issues
Response time
People/team development
Customer service
Quality
Cost reduction
Inventory reduction
Productivity improvement<br>
16
Contributions From Human factors
Industrial engineering
Management science
Biological science
Physical sciences
Information science<br>
17
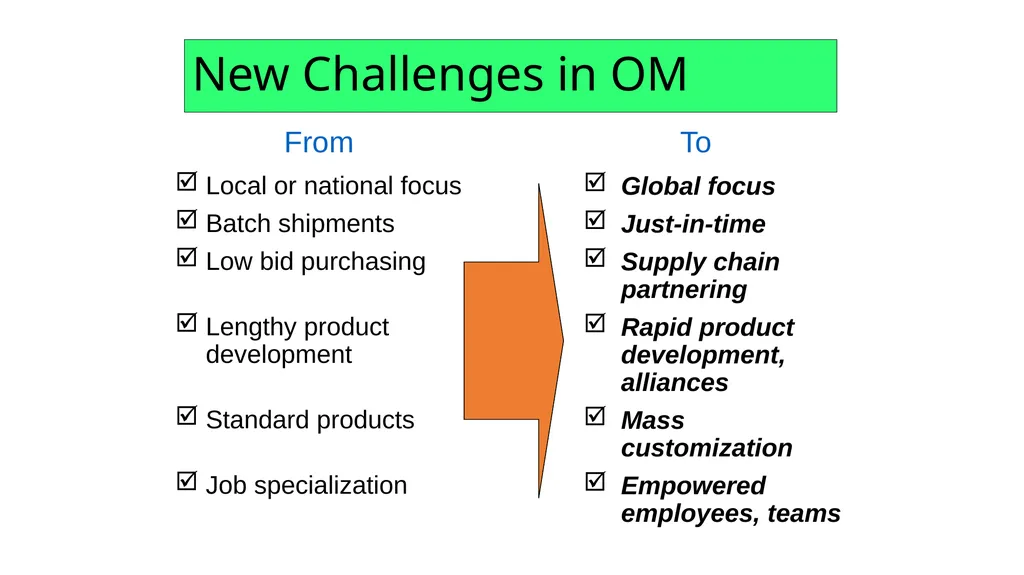
New Challenges in OM<br>
18
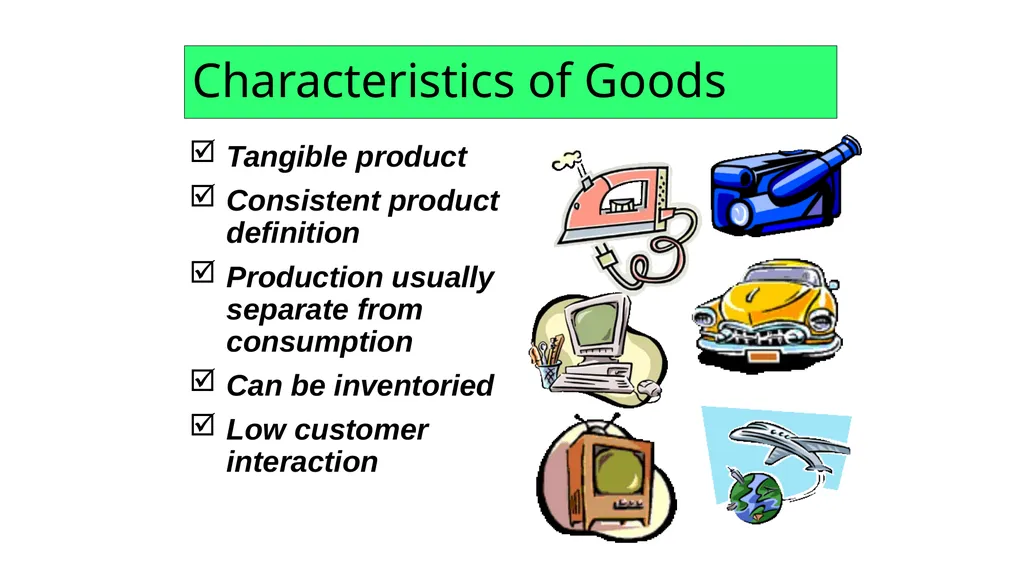
Characteristics of Goods Tangible product
Consistent product definition
Production usually separate from consumption
Can be inventoried
Low customer interaction<br>
19
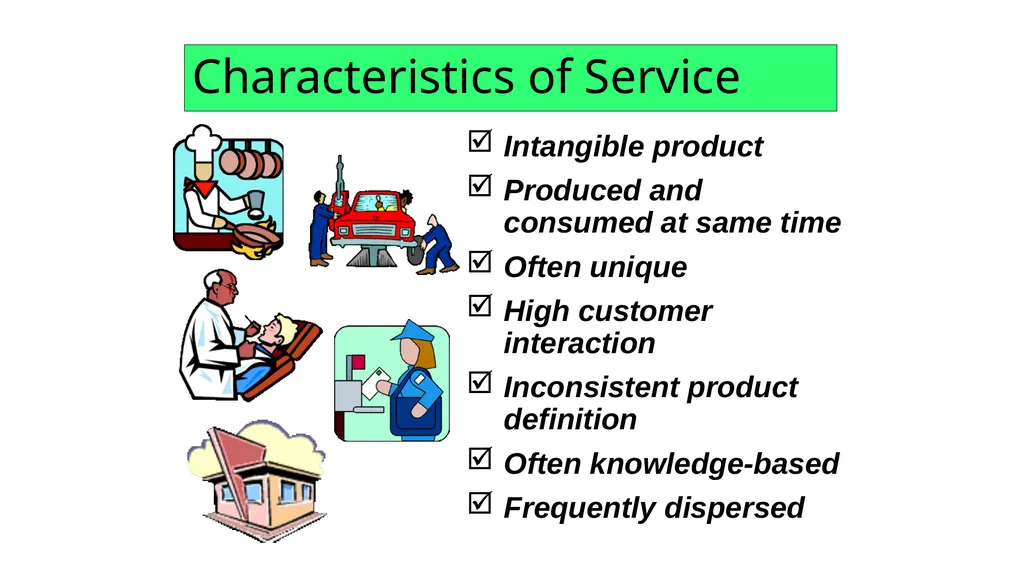
Characteristics of Service Intangible product
Produced and consumed at same time
Often unique
High customer interaction
Inconsistent product definition
Often knowledge-based
Frequently dispersed<br>
20
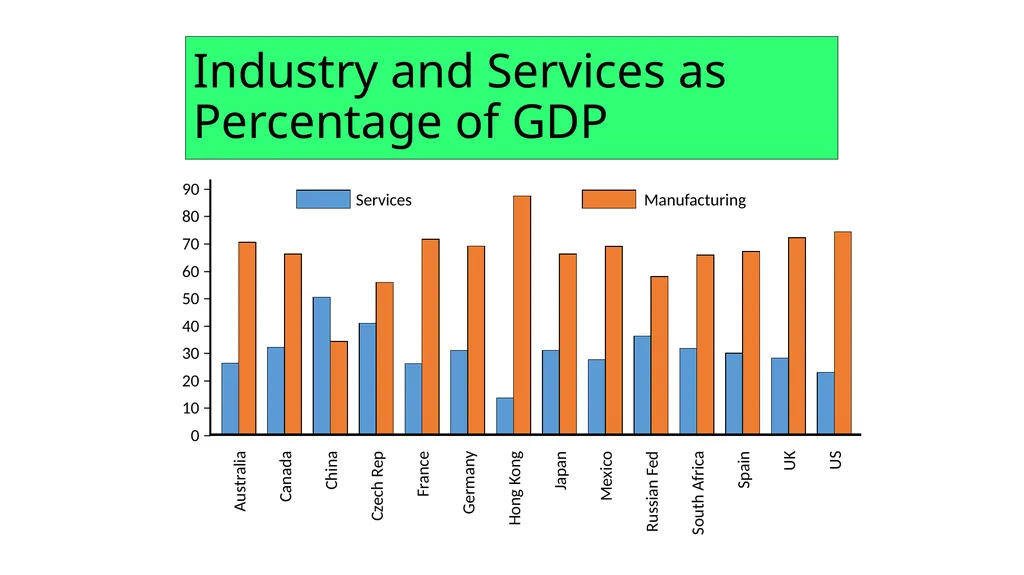
Industry and Services as Percentage of GDP<br>
21
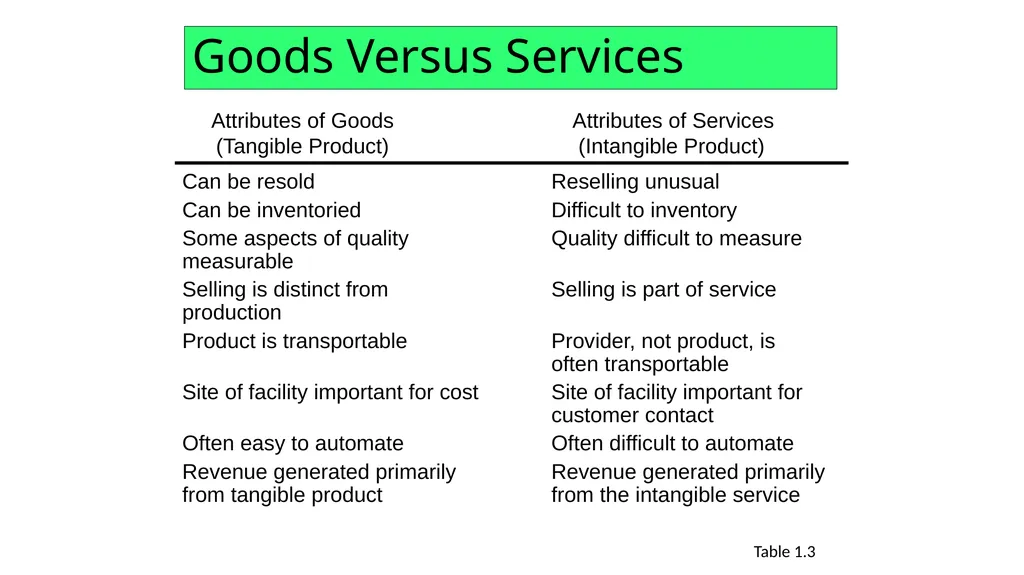
Goods Versus Services Table 1.3<br>
22
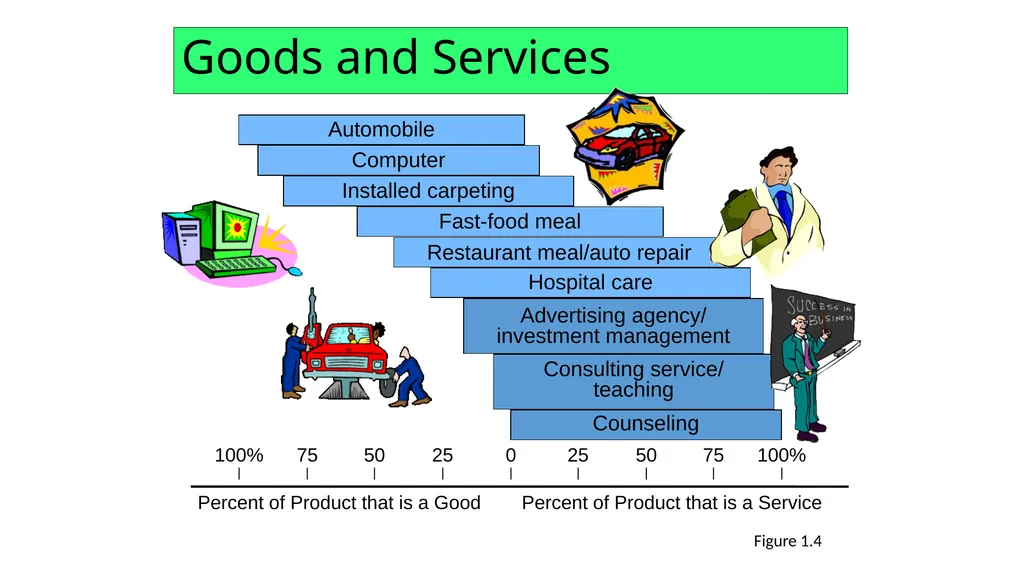
Goods and Services Figure 1.4<br>
23
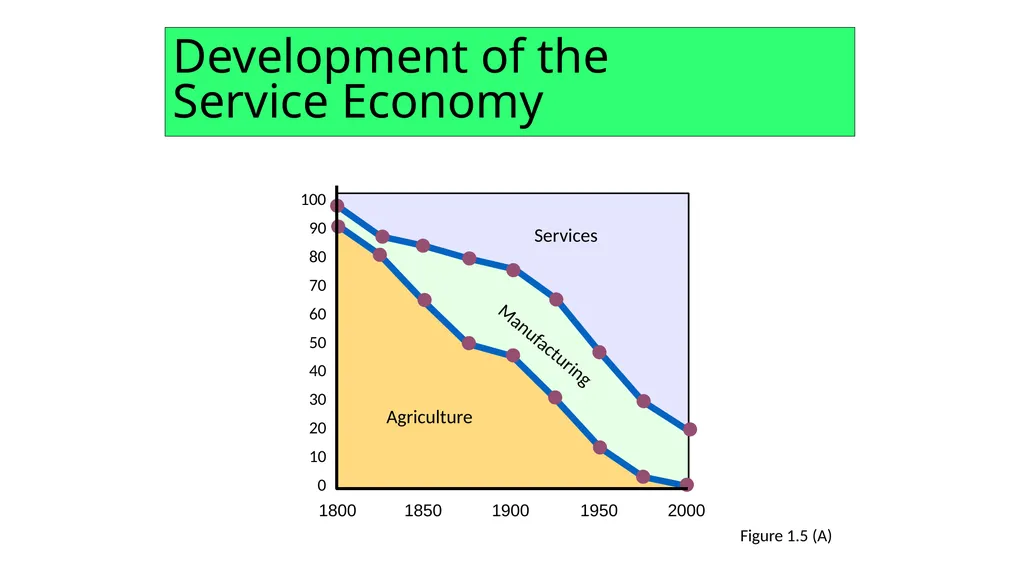
Development of the �Service Economy Figure 1.5 (A)<br>
24
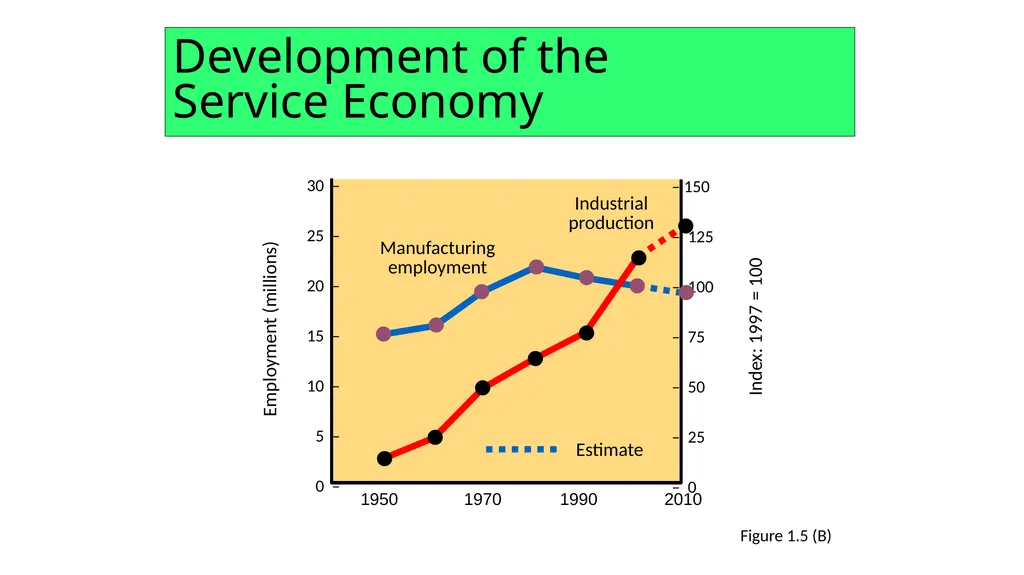
Development of the �Service Economy Figure 1.5 (B)<br>
25
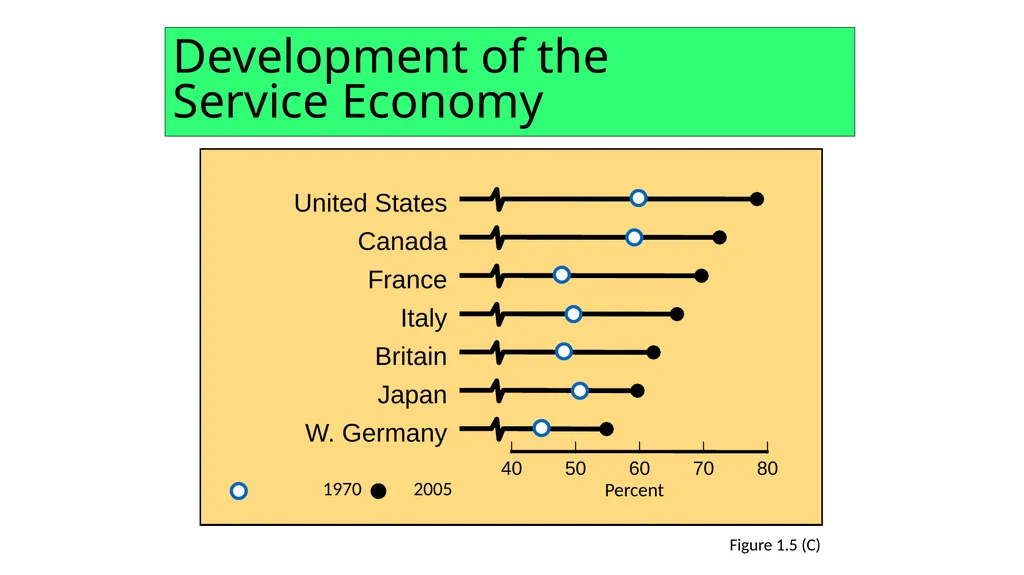
Development of the �Service Economy Figure 1.5 (C)<br>
26
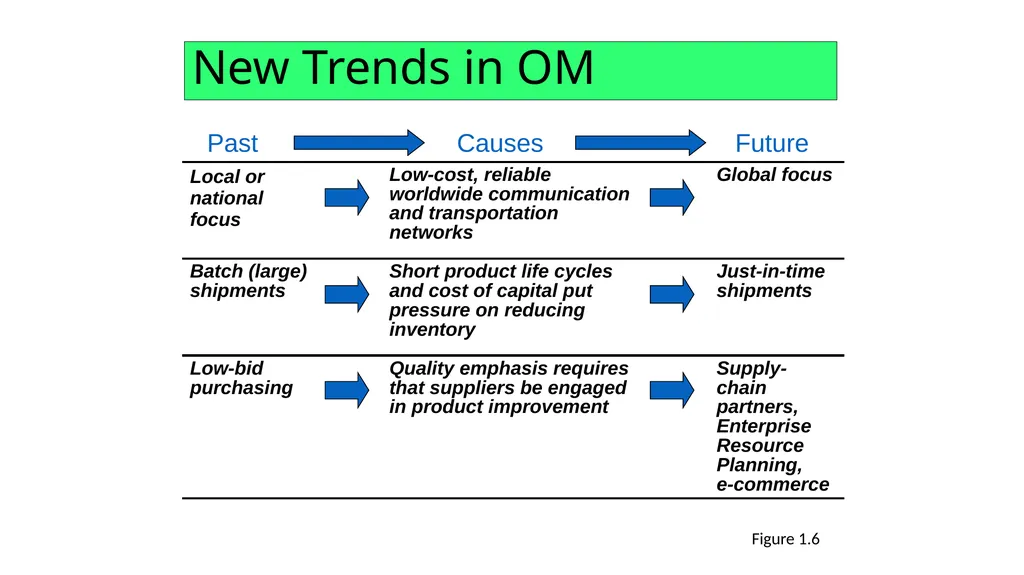
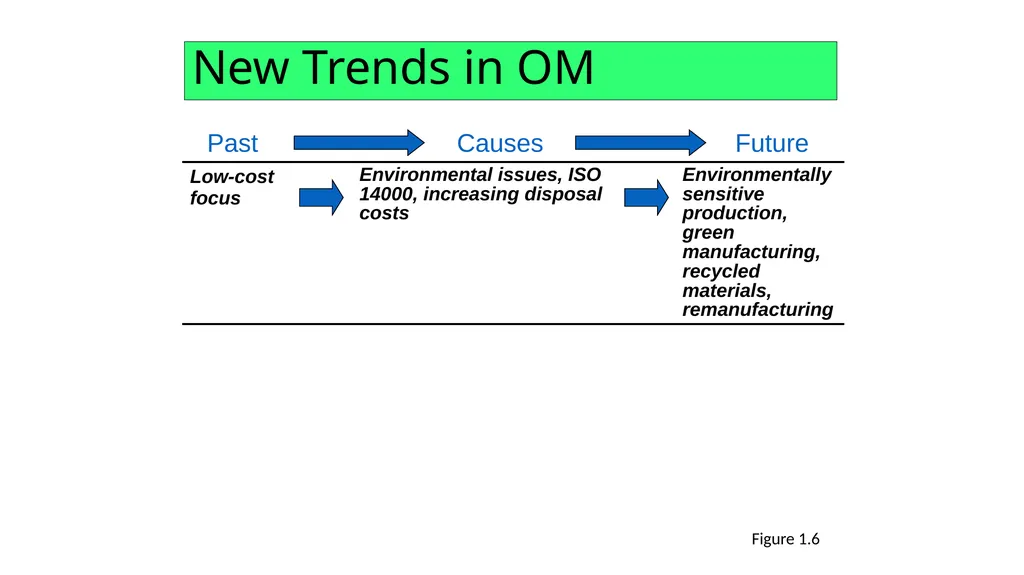
New Trends in OM Figure 1.6<br>
27
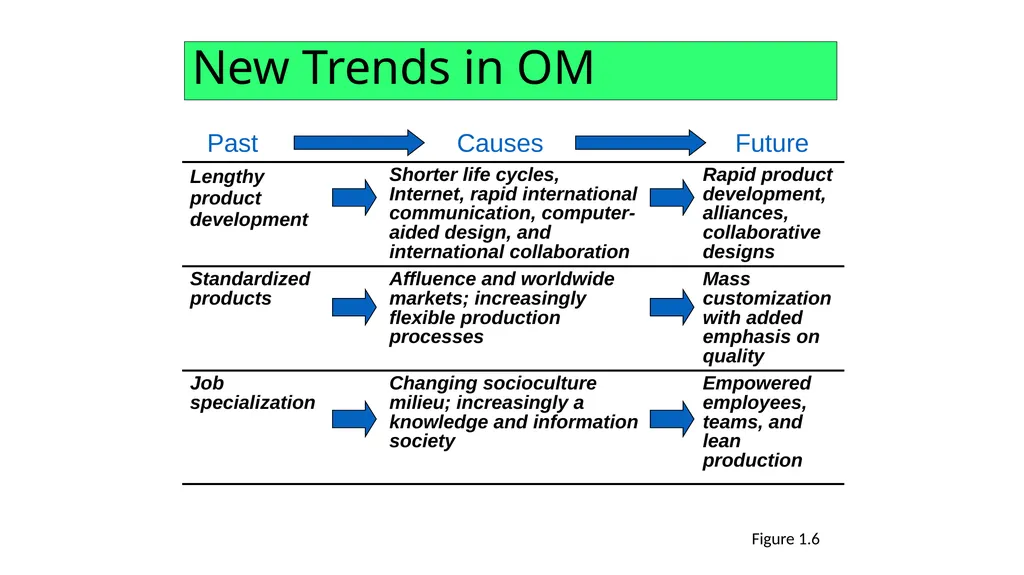
New Trends in OM Figure 1.6<br>
28
New Trends in OM Figure 1.6<br>
29
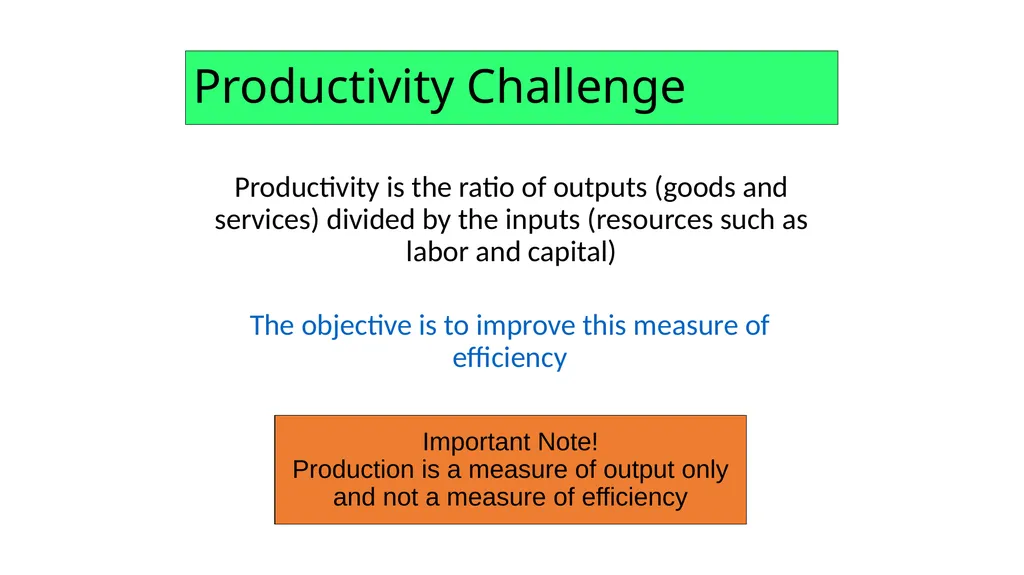
Productivity Challenge Productivity is the ratio of outputs (goods and services) divided by the inputs (resources such as labor and capital) The objective is to improve this measure of efficiency Important Note!
Production is a measure of output only and not a measure of efficiency<br>
30
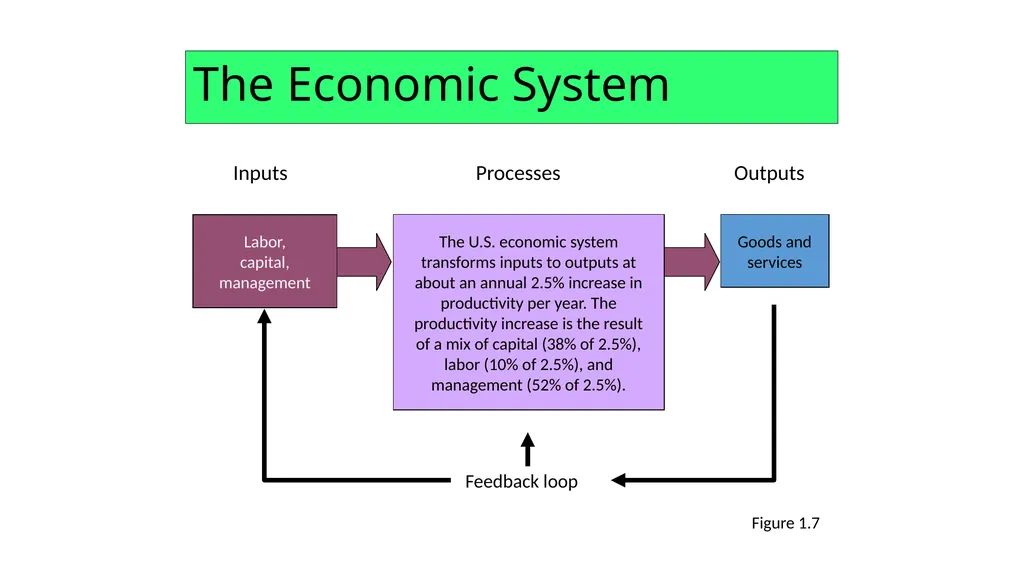
The Economic System Figure 1.7<br>
31
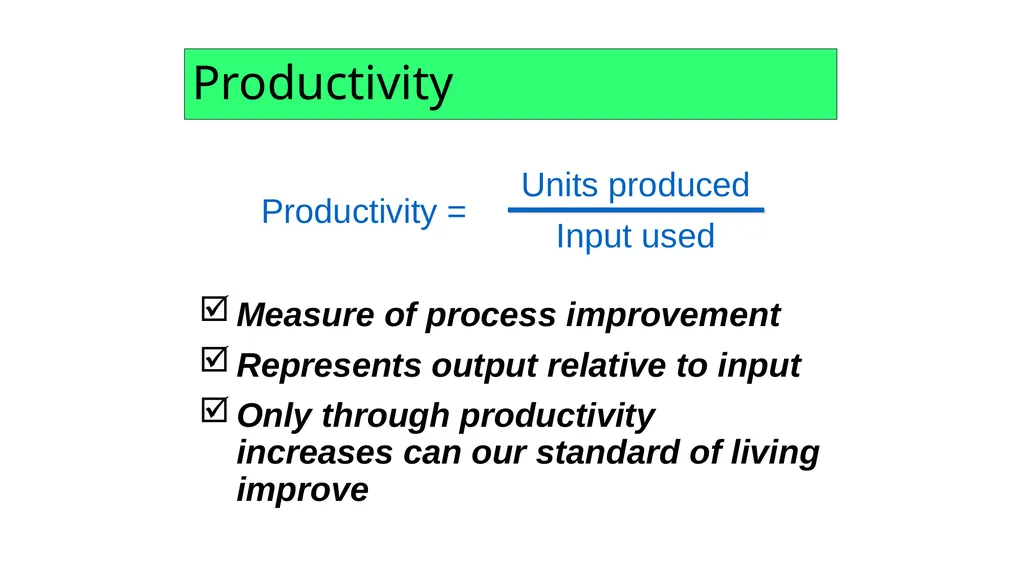
Measure of process improvement
Represents output relative to input
Only through productivity increases can our standard of living improve Productivity<br>
32
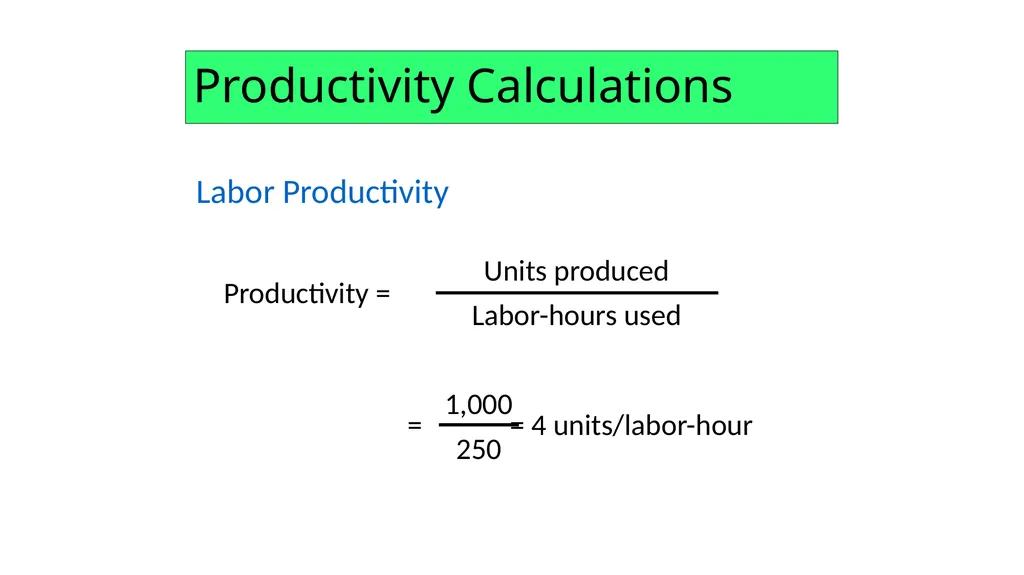
Productivity Calculations Labor Productivity<br>
33
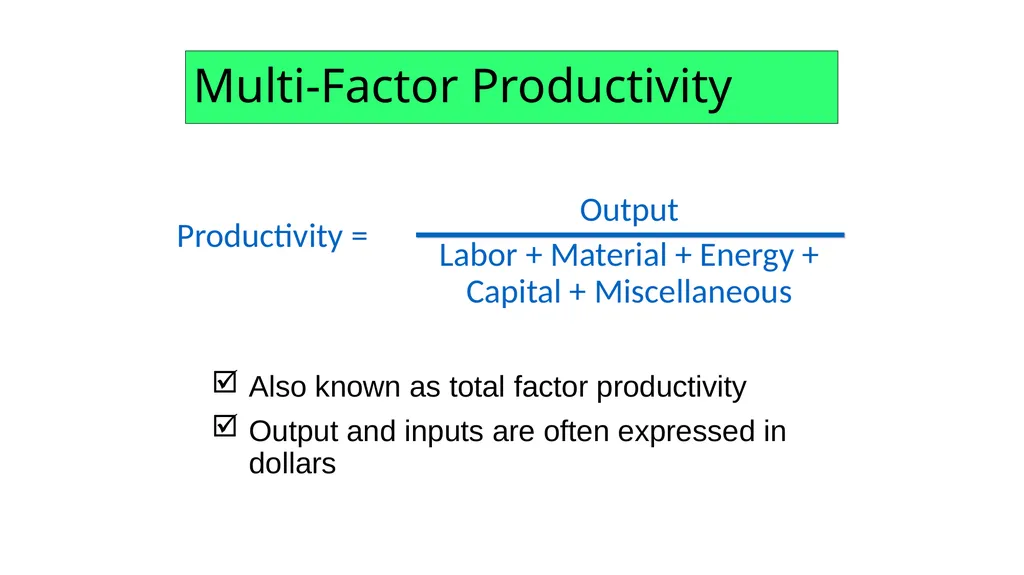
Multi-Factor Productivity Also known as total factor productivity
Output and inputs are often expressed in dollars<br>
34
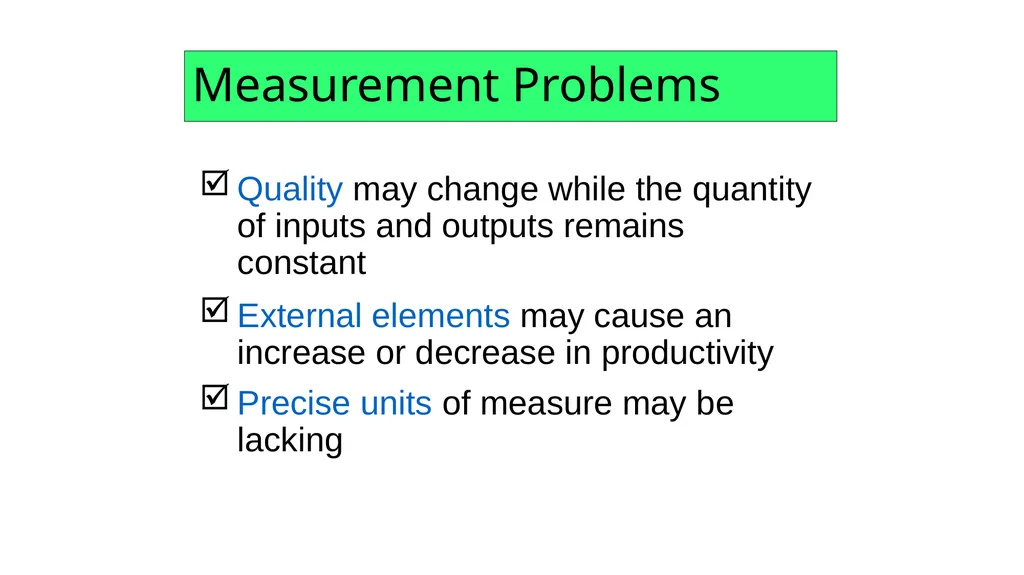
Measurement Problems Quality may change while the quantity of inputs and outputs remains constant External elements may cause an increase or decrease in productivity
Precise units of measure may be lacking<br>
35
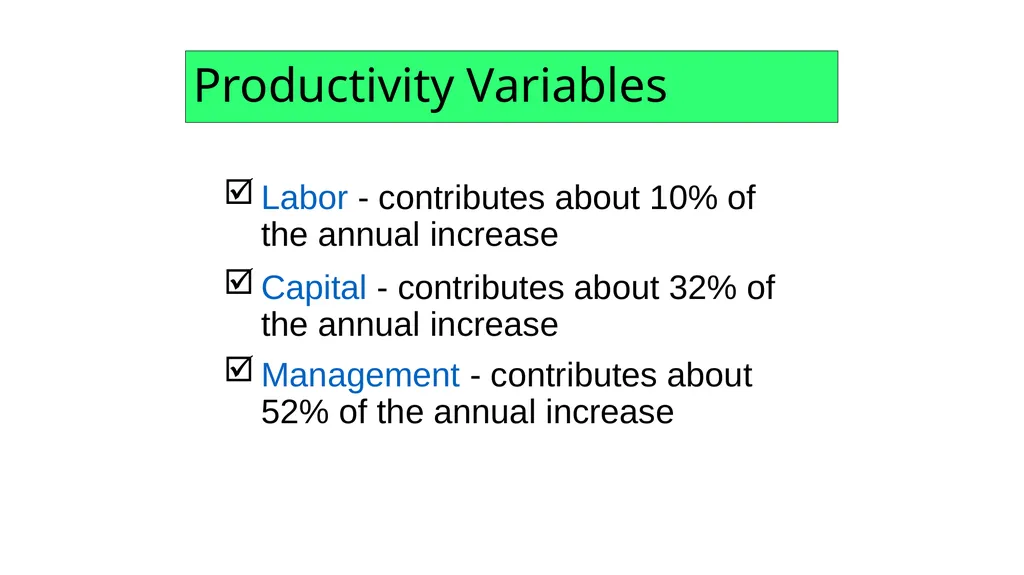
Productivity Variables Labor - contributes about 10% of the annual increase Capital - contributes about 32% of the annual increase
Management - contributes about 52% of the annual increase<br>
36
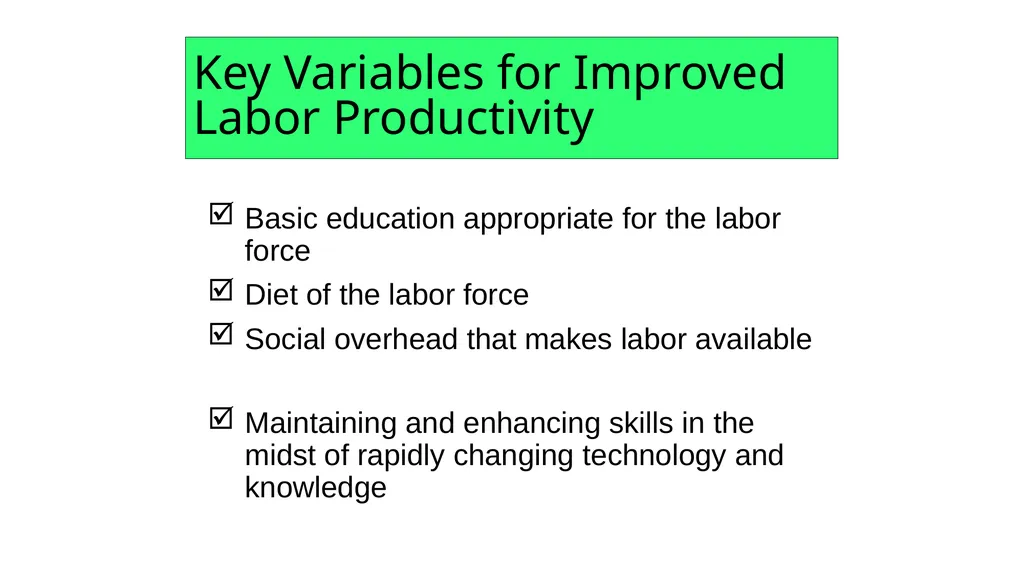
Key Variables for Improved Labor Productivity<br>
37
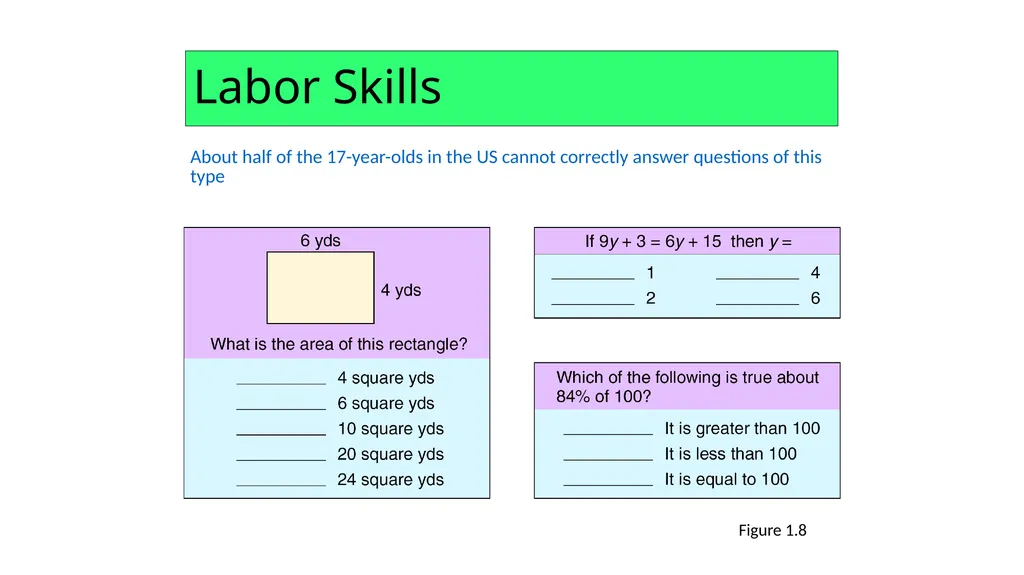
Labor Skills About half of the 17-year-olds in the US cannot correctly answer questions of this type Figure 1.8<br>
38
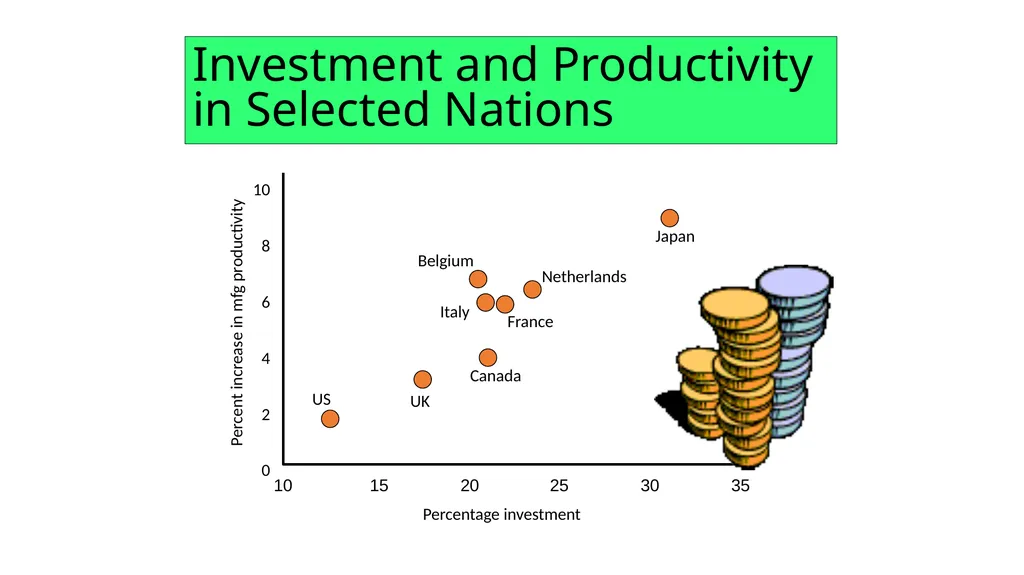
Investment and Productivity in Selected Nations<br>
39
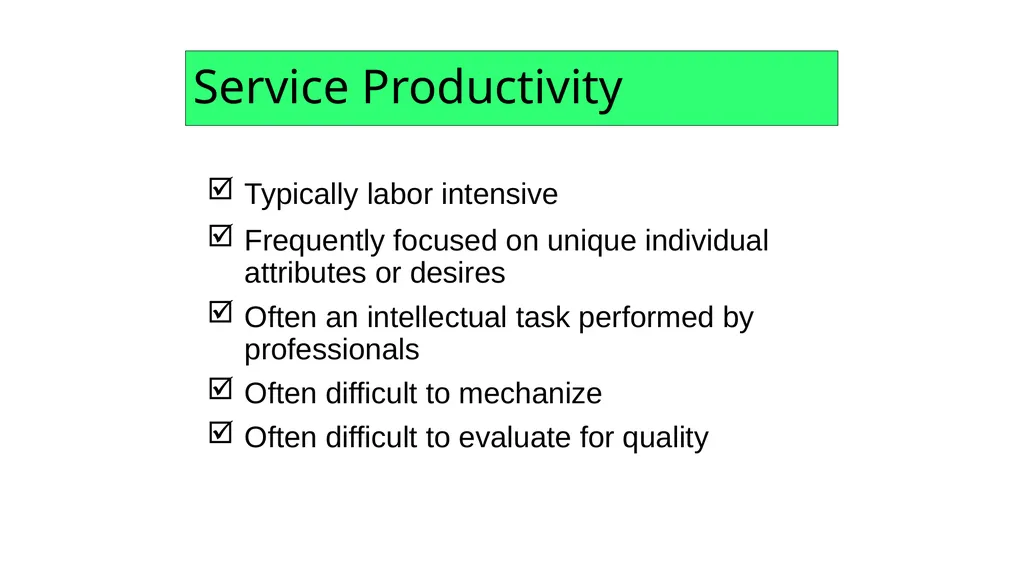
Service Productivity Typically labor intensive Frequently focused on unique individual attributes or desires
Often an intellectual task performed by professionals
Often difficult to mechanize
Often difficult to evaluate for quality<br>
40
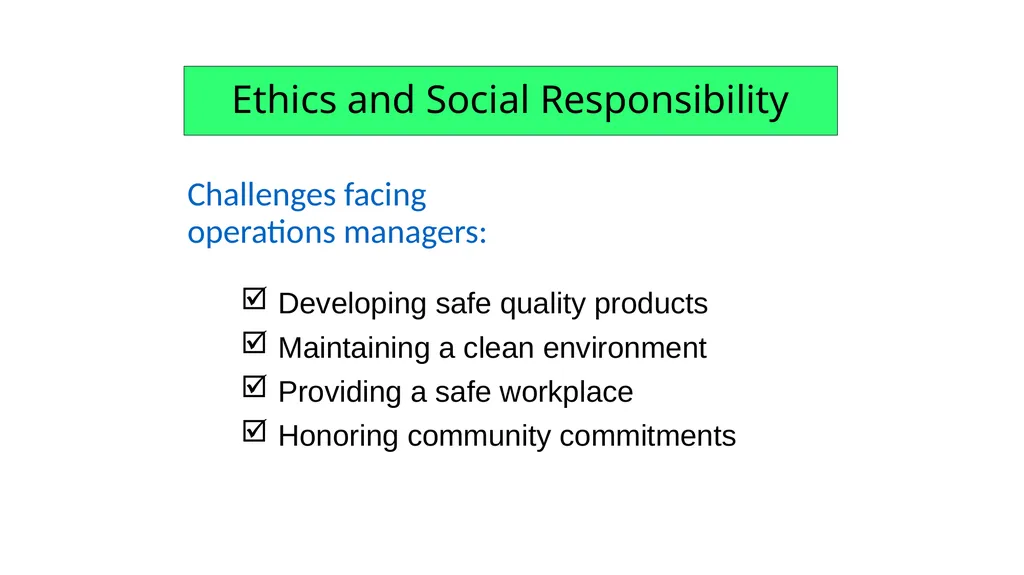
Ethics and Social Responsibility Challenges facing operations managers: Developing safe quality products
Maintaining a clean environment
Providing a safe workplace
Honoring community commitments<br>