
Module 3 – Advanced Example Walkthrough Workshop



Description: Module 3 Advanced Example Walkthrough Workshop for Public-Investment Management Cost Benefit Analysis (December 8-10, 2025) 1 Training Schedule Workshop for Public-Investment Management Cost Benefit Analysis (December 8-10, 2025) 2
Related Topics
Download Presentation
"Module 3 – Advanced Example Walkthrough Workshop" is the property of its rightful owner. Permission is granted to download and print the materials on this website for personal, non-commercial use only, and to display it on your personal computer provided you do not modify the materials and that you retain all copyright notices contained in the materials. By downloading content from our website, you accept the terms of this agreement.
Presentation Transcript
slide1. Module 3 – Advanced Example Walkthrough Workshop for Public-Investment Management – Cost Benefit Analysis (December 8-10, 2025) 1<br>
slide2. Training Schedule Workshop for Public-Investment Management – Cost Benefit Analysis (December 8-10, 2025) 2<br>
slide3. Training Schedule Workshop for Public-Investment Management – Cost Benefit Analysis (December 8-10, 2025) 3<br>
slide4. Activity Workshop for Public-Investment Management – Cost Benefit Analysis (December 8-10, 2025) 4 Individually (3-5 minutes)
One insight or concept from Day 1 that stood out to you
One challenge or uncertainty you are still thinking about
One way you might apply something they learned in their work Small Group Discussion (10–15 minutes)
Share your reflections. Groups should discuss:
Common themes or patterns
Differences in takeaways
Can add to your example from yesterday Whole Group Share-Back (10–15 minutes)<br>
slide5. Module 3 - Learning Objectives Apply the 9-step CBA framework to evaluate the feasibility and societal value of a school investment project.
Identify the BAU and Variants, including key assumptions for service delivery.
Understand the research process for identifying costs and benefits, including capital expenditure, health outcomes, and non-market impacts.
Conduct sensitivity analysis using discount rates and best-worst case
Interpret and communicate CBA outcomes (e.g. ENPV, EIRR and BCR) to inform evidence-based decision-making under uncertainty. Workshop for Public-Investment Management – Cost Benefit Analysis (December 8-10, 2025) 5<br>
slide6. Disclaimer This report has been prepared by The University of Queensland (UQ) for the teaching and learning purposes of Bhutan Government officers. It is based on a project funded and prepared for the World Bank Group. Workshop for Public-Investment Management – Cost Benefit Analysis (December 8-10, 2025) 6<br>
slide7. Context of this Module In this module, we will look at an example including implementing in the eCBA tool, following the 9 steps.
An example provides a concrete context for applying abstract concepts like NPV, IRR, and BCR.
We will cover the step-by-step process of quantifying costs and benefits, discounting over time, and interpreting results.
Process will encourage critical thinking about data gaps, ethical considerations, and judgements involved in real-world CBA applications. Workshop for Public-Investment Management – Cost Benefit Analysis (December 8-10, 2025) 7<br>
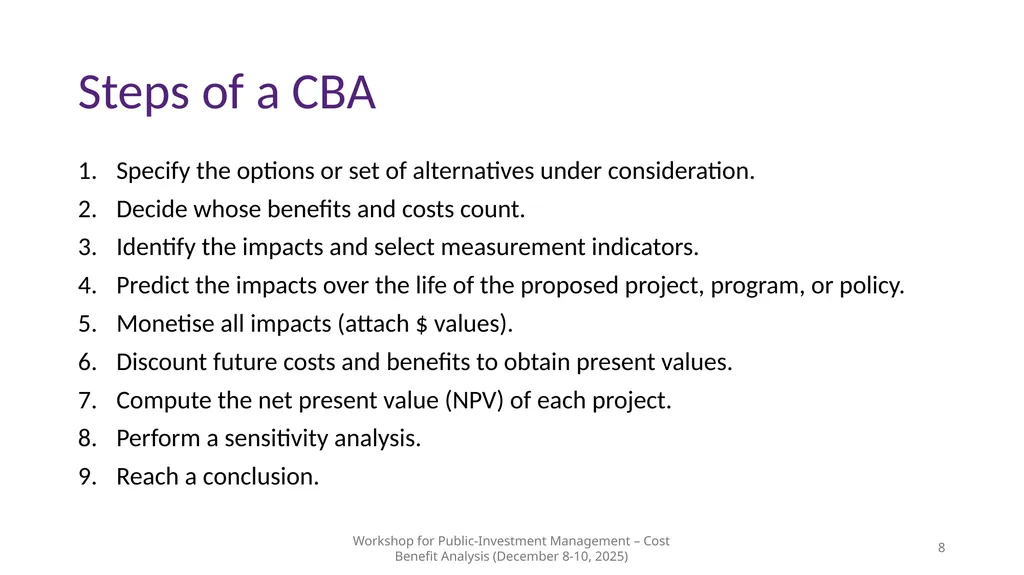
slide8. Steps of a CBA Specify the options or set of alternatives under consideration.
Decide whose benefits and costs count.
Identify the impacts and select measurement indicators.
Predict the impacts over the life of the proposed project, program, or policy.
Monetise all impacts (attach $ values).
Discount future costs and benefits to obtain present values.
Compute the net present value (NPV) of each project.
Perform a sensitivity analysis.
Reach a conclusion. Workshop for Public-Investment Management – Cost Benefit Analysis (December 8-10, 2025) 8<br>
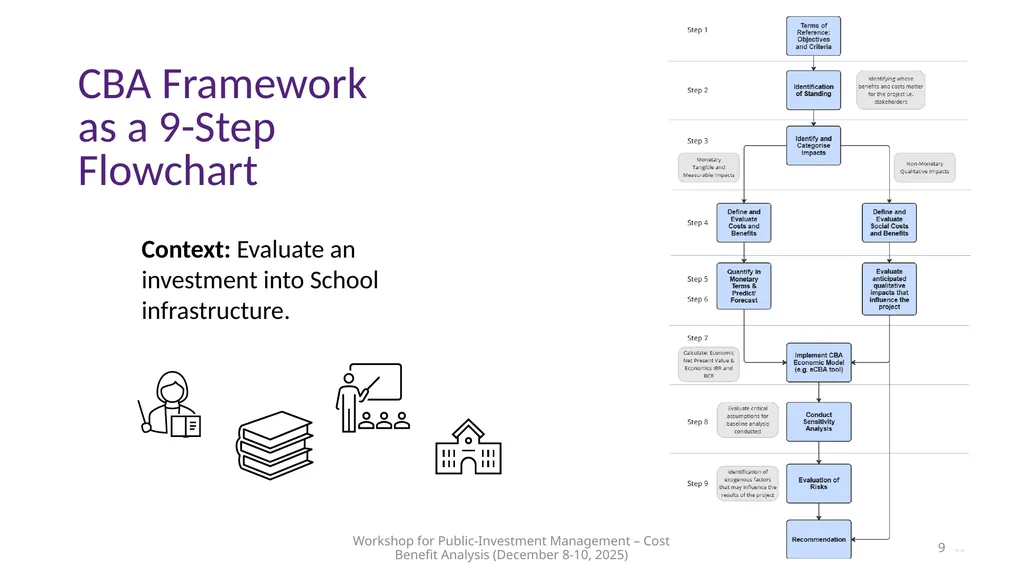
slide9. CBA Framework as a 9-Step Flowchart Workshop for Public-Investment Management – Cost Benefit Analysis (December 8-10, 2025) 9 Context: Evaluate an investment into School infrastructure.<br>
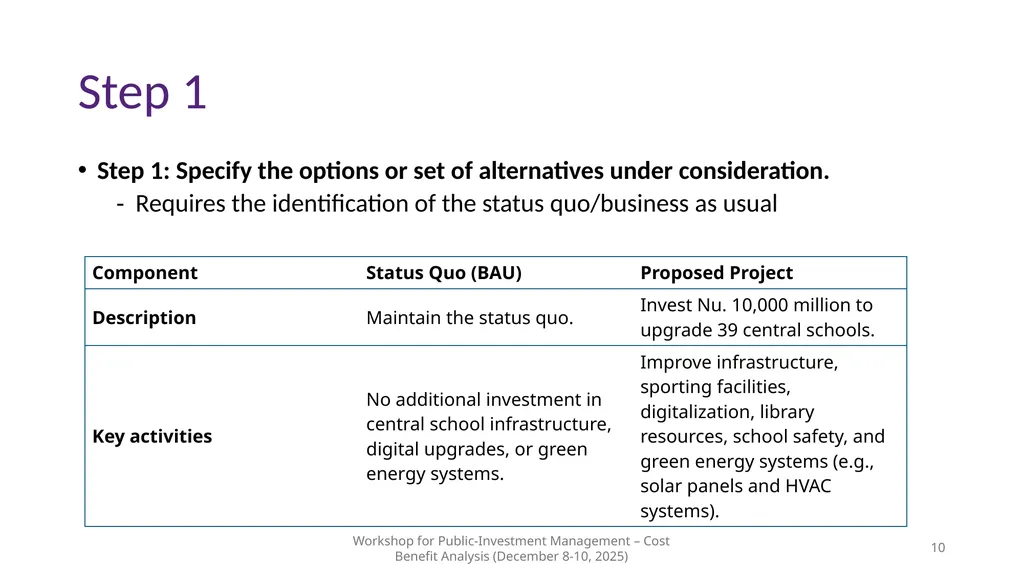
slide10. Step 1 Step 1: Specify the options or set of alternatives under consideration.
Requires the identification of the status quo/business as usual Workshop for Public-Investment Management – Cost Benefit Analysis (December 8-10, 2025) 10<br>
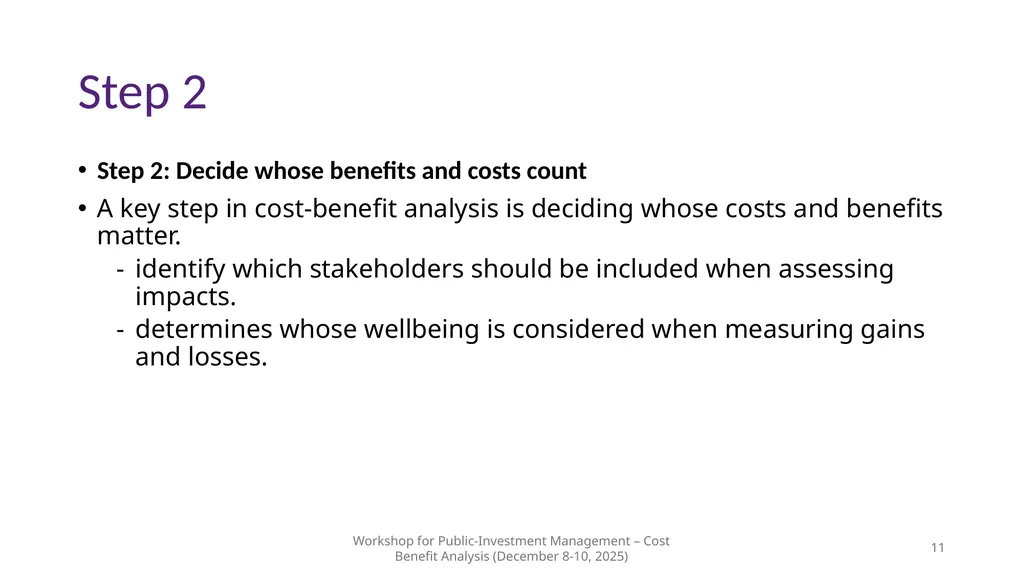
slide11. Step 2 Step 2: Decide whose benefits and costs count
A key step in cost-benefit analysis is deciding whose costs and benefits matter.
identify which stakeholders should be included when assessing impacts.
determines whose wellbeing is considered when measuring gains and losses. Workshop for Public-Investment Management – Cost Benefit Analysis (December 8-10, 2025) 11<br>
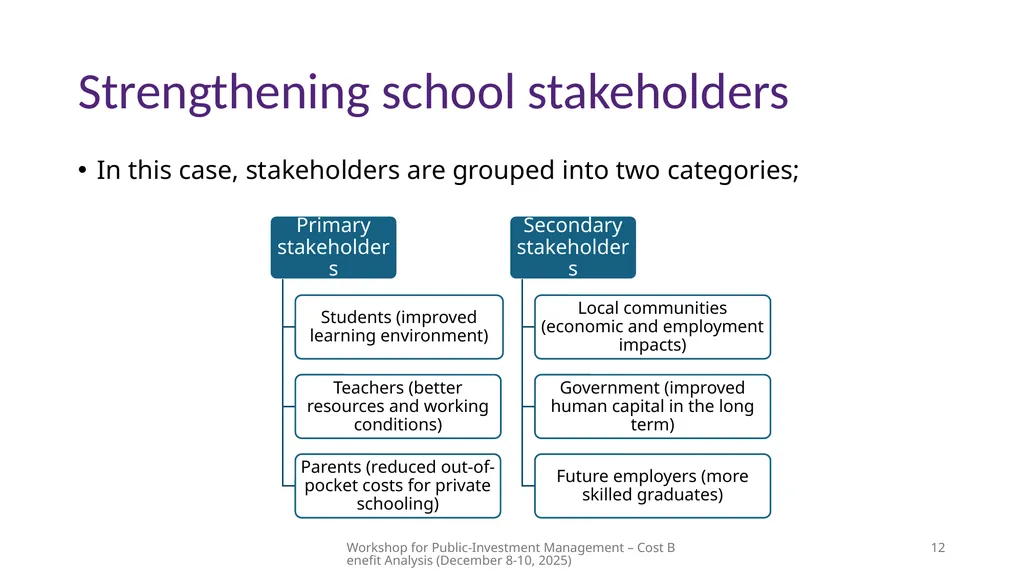
slide12. Strengthening school stakeholders In this case, stakeholders are grouped into two categories; Workshop for Public-Investment Management – Cost Benefit Analysis (December 8-10, 2025) 12<br>
slide13. Step 3 Step 3: Identify the impacts and select measurement indicators.
Identify all relevant impacts, including direct, indirect, tangible, and intangible – What can already be measured?
Then reviewing existing research including:
Reports and publications Workshop for Public-Investment Management – Cost Benefit Analysis (December 8-10, 2025) 13 Start by Brainstorming<br>
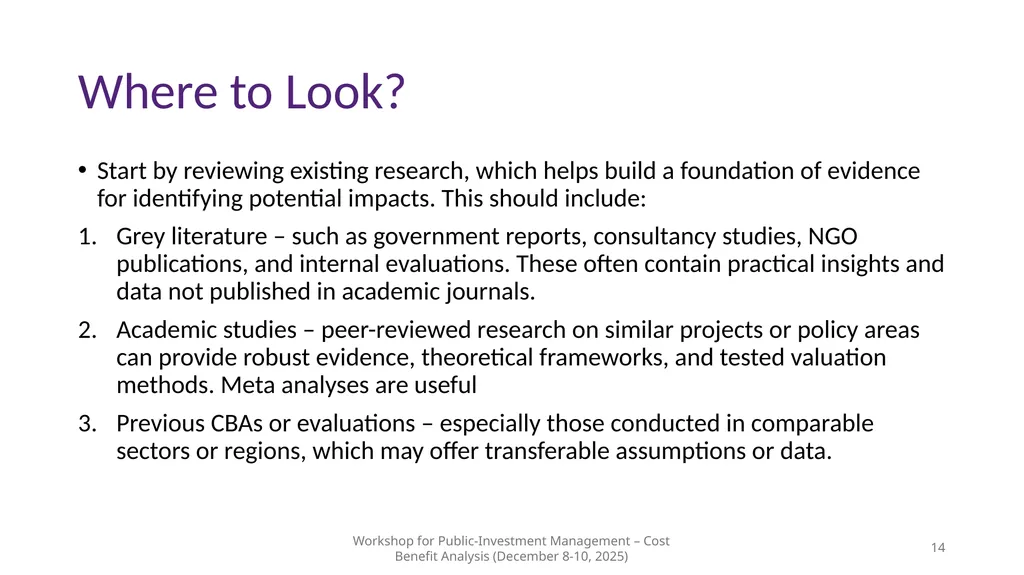
slide14. Where to Look? Start by reviewing existing research, which helps build a foundation of evidence for identifying potential impacts. This should include:
Grey literature – such as government reports, consultancy studies, NGO publications, and internal evaluations. These often contain practical insights and data not published in academic journals.
Academic studies – peer-reviewed research on similar projects or policy areas can provide robust evidence, theoretical frameworks, and tested valuation methods. Meta analyses are useful
Previous CBAs or evaluations – especially those conducted in comparable sectors or regions, which may offer transferable assumptions or data. Workshop for Public-Investment Management – Cost Benefit Analysis (December 8-10, 2025) 14<br>
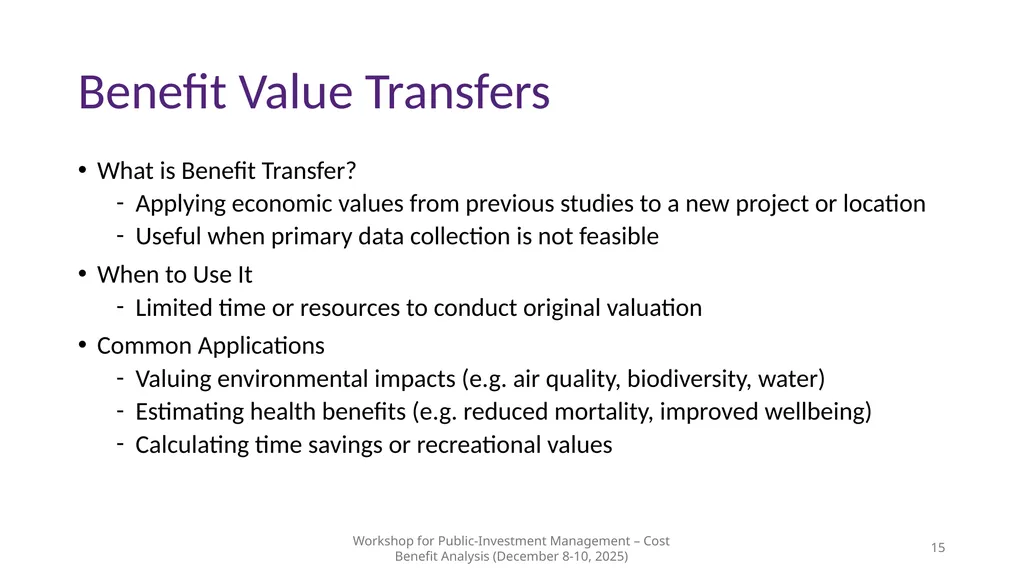
slide15. Benefit Value Transfers What is Benefit Transfer?
Applying economic values from previous studies to a new project or location
Useful when primary data collection is not feasible
When to Use It
Limited time or resources to conduct original valuation
Common Applications
Valuing environmental impacts (e.g. air quality, biodiversity, water)
Estimating health benefits (e.g. reduced mortality, improved wellbeing)
Calculating time savings or recreational values Workshop for Public-Investment Management – Cost Benefit Analysis (December 8-10, 2025) 15<br>
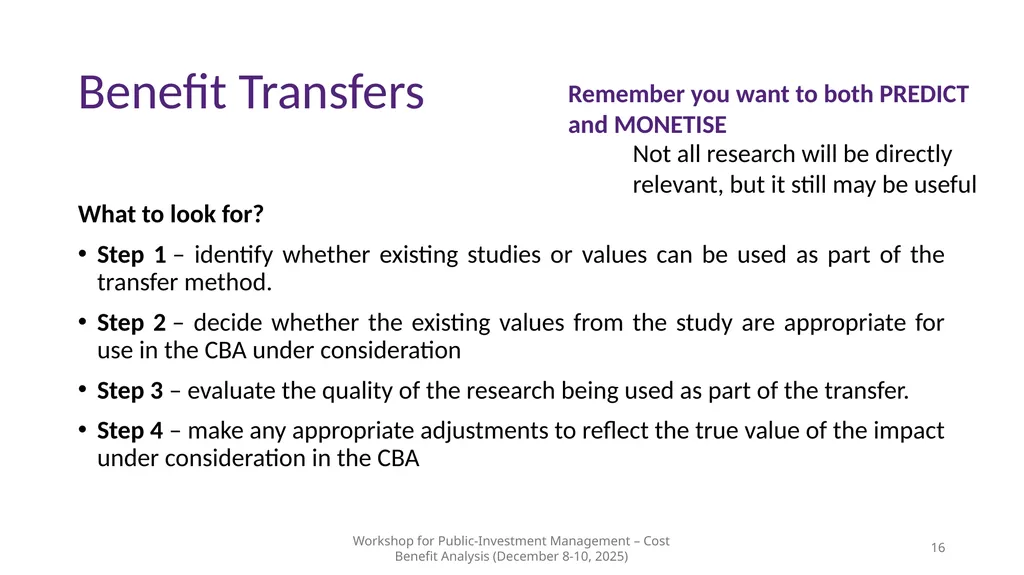
slide16. Benefit Transfers What to look for?
Step 1 – identify whether existing studies or values can be used as part of the transfer method.
Step 2 – decide whether the existing values from the study are appropriate for use in the CBA under consideration
Step 3 – evaluate the quality of the research being used as part of the transfer.
Step 4 – make any appropriate adjustments to reflect the true value of the impact under consideration in the CBA Workshop for Public-Investment Management – Cost Benefit Analysis (December 8-10, 2025) 16 Remember you want to both PREDICT and MONETISE Not all research will be directly relevant, but it still may be useful<br>
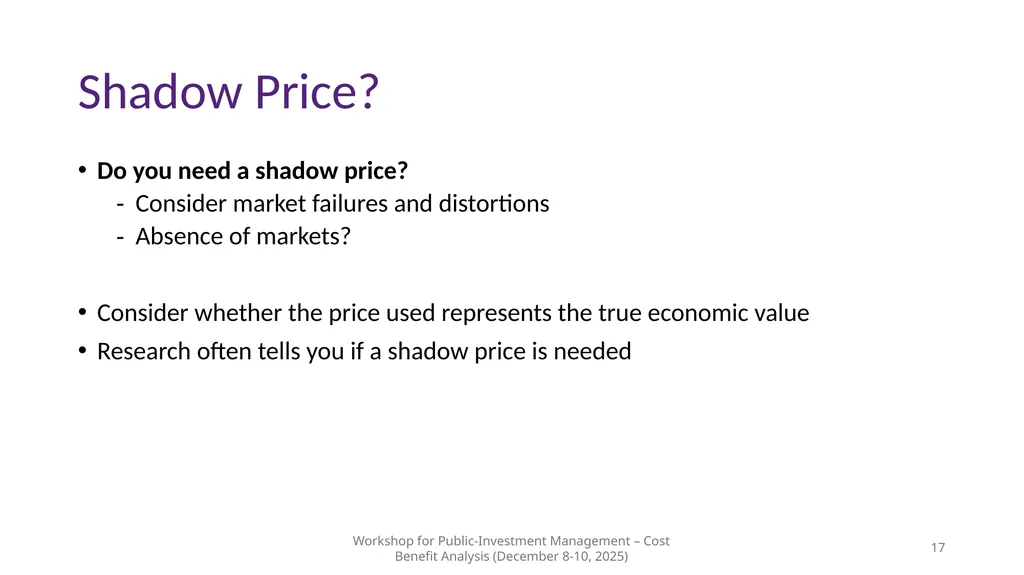
slide17. Shadow Price? Do you need a shadow price?
Consider market failures and distortions
Absence of markets?
Consider whether the price used represents the true economic value
Research often tells you if a shadow price is needed Workshop for Public-Investment Management – Cost Benefit Analysis (December 8-10, 2025) 17<br>
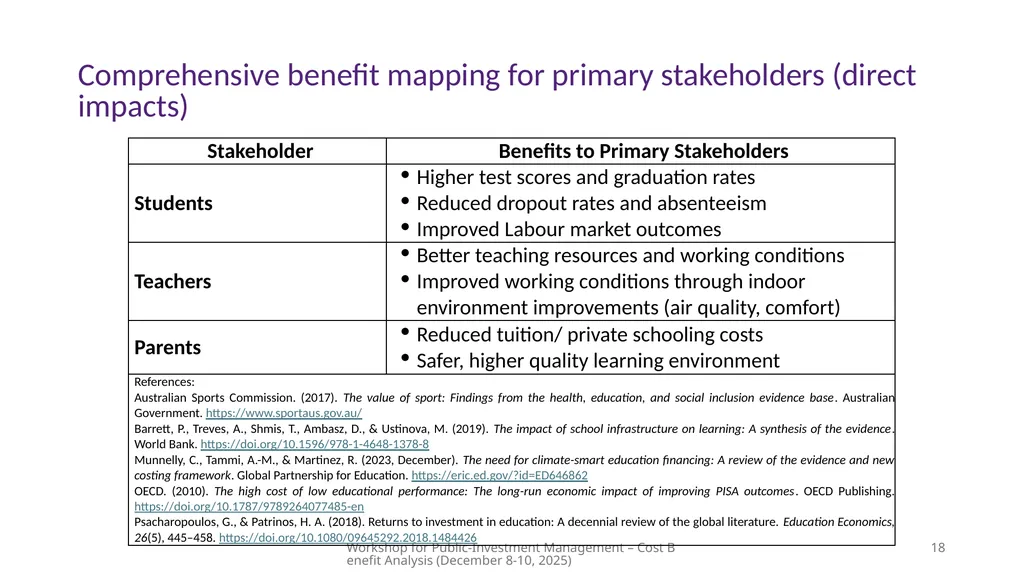
slide18. Comprehensive benefit mapping for primary stakeholders (direct impacts) Workshop for Public-Investment Management – Cost Benefit Analysis (December 8-10, 2025) 18<br>
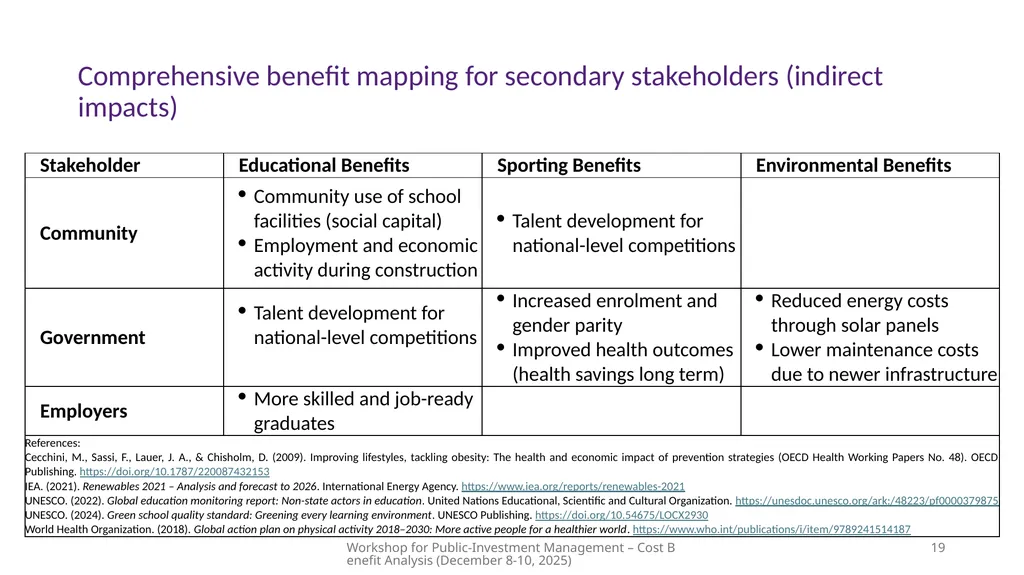
slide19. Comprehensive benefit mapping for secondary stakeholders (indirect impacts) Workshop for Public-Investment Management – Cost Benefit Analysis (December 8-10, 2025) 19<br>
slide20. Questions? 20 Workshop for Public-Investment Management – Cost Benefit Analysis (July 13-19, 2025) Workshop for Public-Investment Management – Cost Benefit Analysis (December 8-10, 2025)<br>
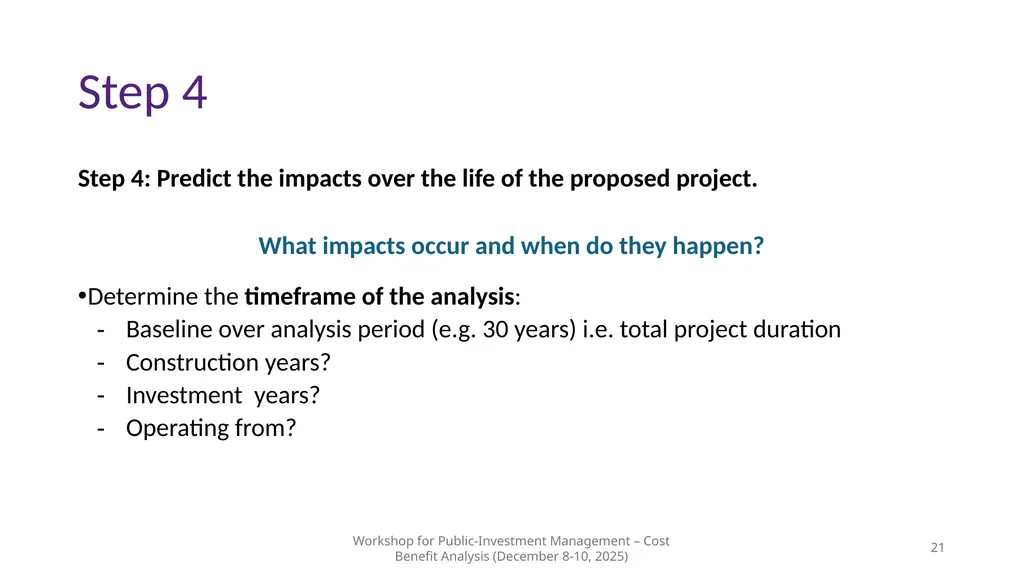
slide21. Step 4 Step 4: Predict the impacts over the life of the proposed project.
What impacts occur and when do they happen?
Determine the timeframe of the analysis:
Baseline over analysis period (e.g. 30 years) i.e. total project duration
Construction years?
Investment years?
Operating from? Workshop for Public-Investment Management – Cost Benefit Analysis (December 8-10, 2025) 21<br>
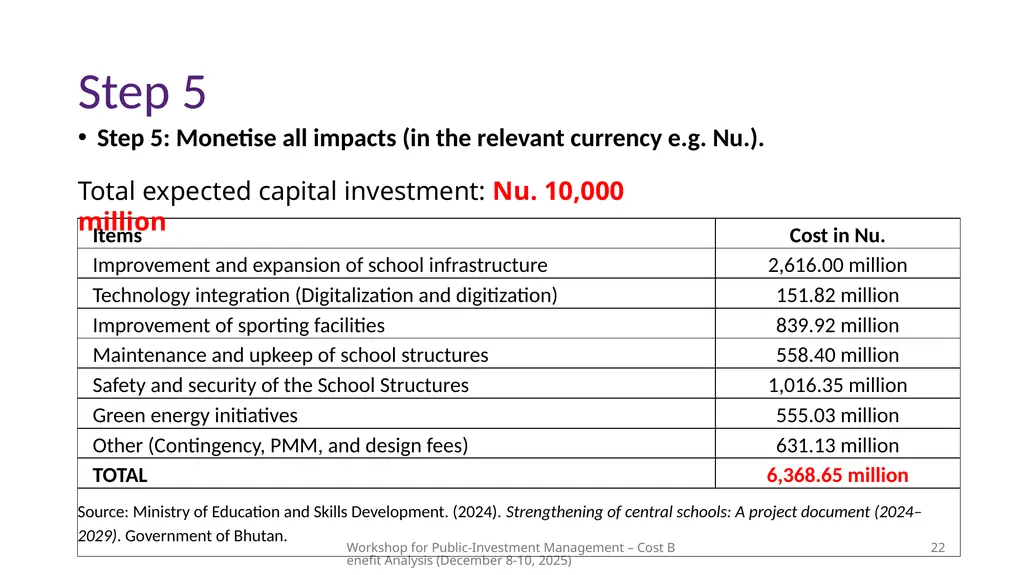
slide22. Step 5 Step 5: Monetise all impacts (in the relevant currency e.g. Nu.). Workshop for Public-Investment Management – Cost Benefit Analysis (December 8-10, 2025) 22 Total expected capital investment: Nu. 10,000 million<br>
slide23. Summarise of economic benefit / non-market impact Workshop for Public-Investment Management – Cost Benefit Analysis (December 8-10, 2025) 23<br>
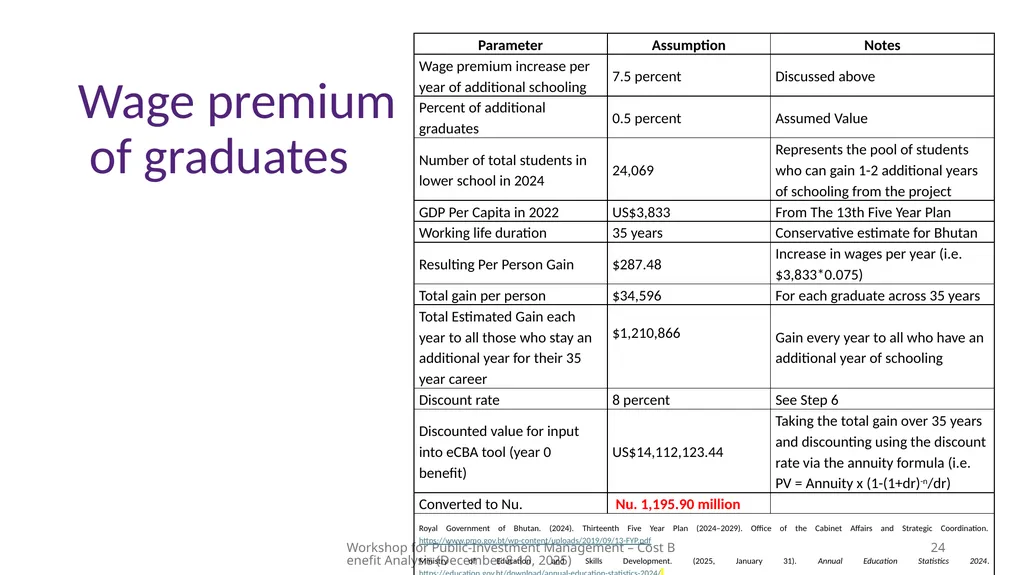
slide24. Wage premium of graduates Workshop for Public-Investment Management – Cost Benefit Analysis (December 8-10, 2025) 24<br>
slide25. Lower dropout-related social costs Workshop for Public-Investment Management – Cost Benefit Analysis (December 8-10, 2025) 25<br>
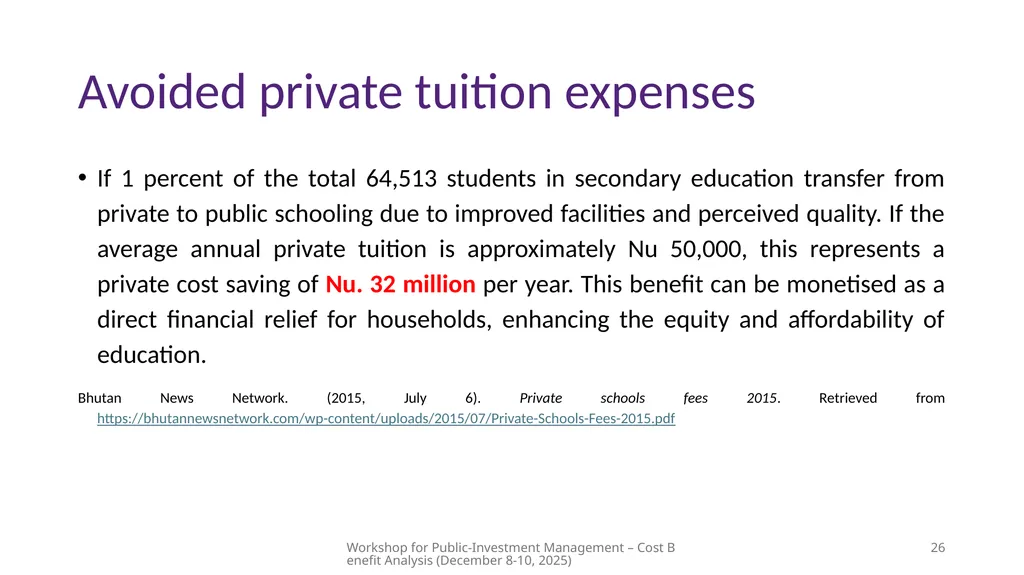
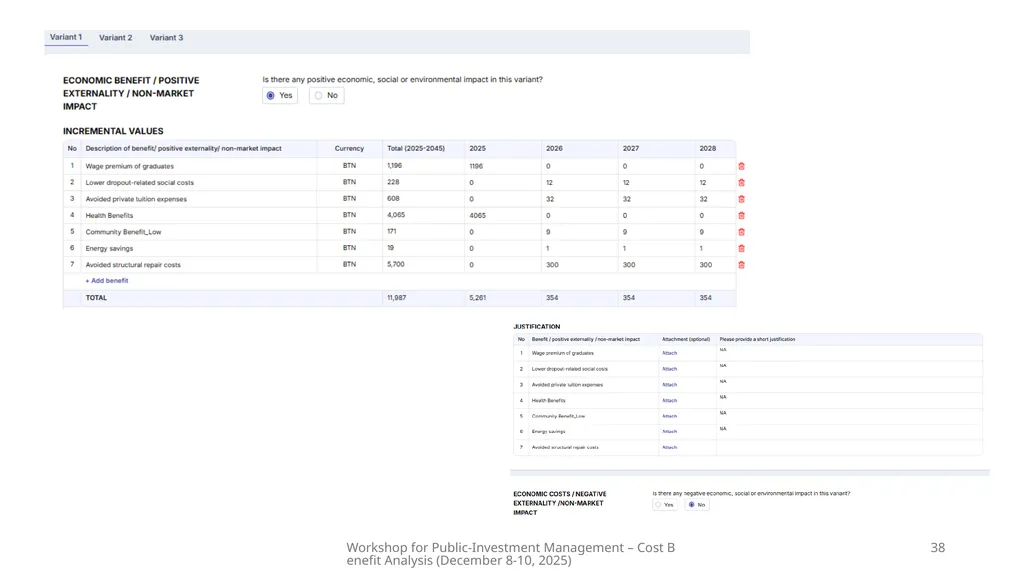
slide26. Avoided private tuition expenses If 1 percent of the total 64,513 students in secondary education transfer from private to public schooling due to improved facilities and perceived quality. If the average annual private tuition is approximately Nu 50,000, this represents a private cost saving of Nu. 32 million per year. This benefit can be monetised as a direct financial relief for households, enhancing the equity and affordability of education.
Bhutan News Network. (2015, July 6). Private schools fees 2015. Retrieved from https://bhutannewsnetwork.com/wp-content/uploads/2015/07/Private-Schools-Fees-2015.pdf Workshop for Public-Investment Management – Cost Benefit Analysis (December 8-10, 2025) 26<br>
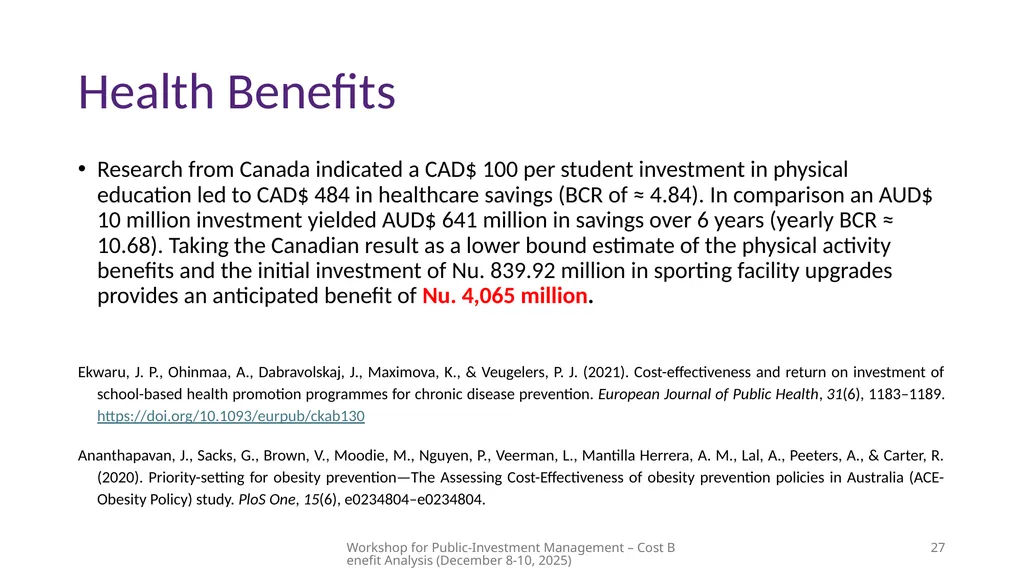
slide27. Health Benefits Research from Canada indicated a CAD$ 100 per student investment in physical education led to CAD$ 484 in healthcare savings (BCR of ≈ 4.84). In comparison an AUD$ 10 million investment yielded AUD$ 641 million in savings over 6 years (yearly BCR ≈ 10.68). Taking the Canadian result as a lower bound estimate of the physical activity benefits and the initial investment of Nu. 839.92 million in sporting facility upgrades provides an anticipated benefit of Nu. 4,065 million.
Ekwaru, J. P., Ohinmaa, A., Dabravolskaj, J., Maximova, K., & Veugelers, P. J. (2021). Cost-effectiveness and return on investment of school-based health promotion programmes for chronic disease prevention. European Journal of Public Health, 31(6), 1183–1189. https://doi.org/10.1093/eurpub/ckab130
Ananthapavan, J., Sacks, G., Brown, V., Moodie, M., Nguyen, P., Veerman, L., Mantilla Herrera, A. M., Lal, A., Peeters, A., & Carter, R. (2020). Priority-setting for obesity prevention—The Assessing Cost-Effectiveness of obesity prevention policies in Australia (ACE-Obesity Policy) study. PloS One, 15(6), e0234804–e0234804. Workshop for Public-Investment Management – Cost Benefit Analysis (December 8-10, 2025) 27<br>
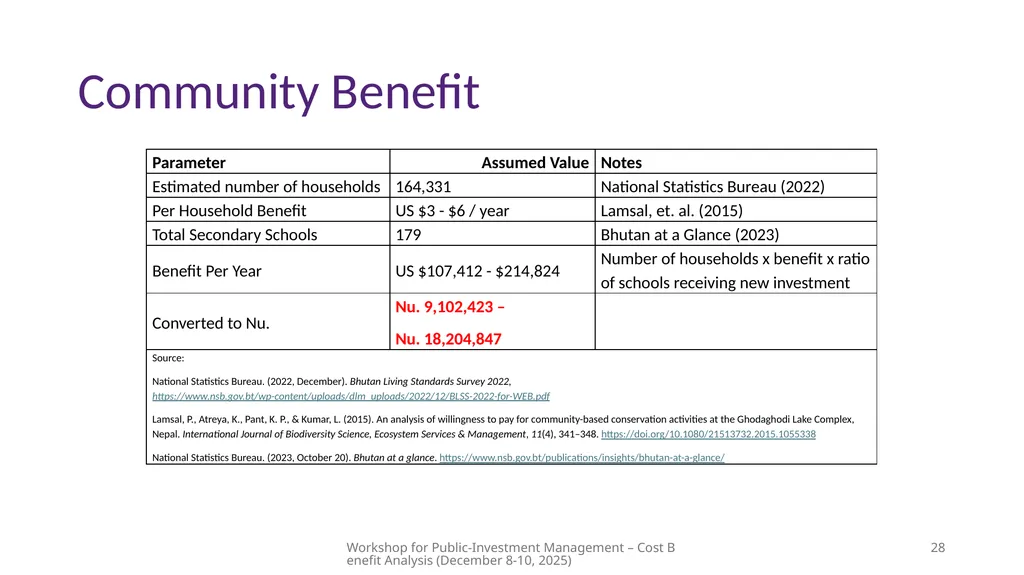
slide28. Community Benefit Workshop for Public-Investment Management – Cost Benefit Analysis (December 8-10, 2025) 28<br>
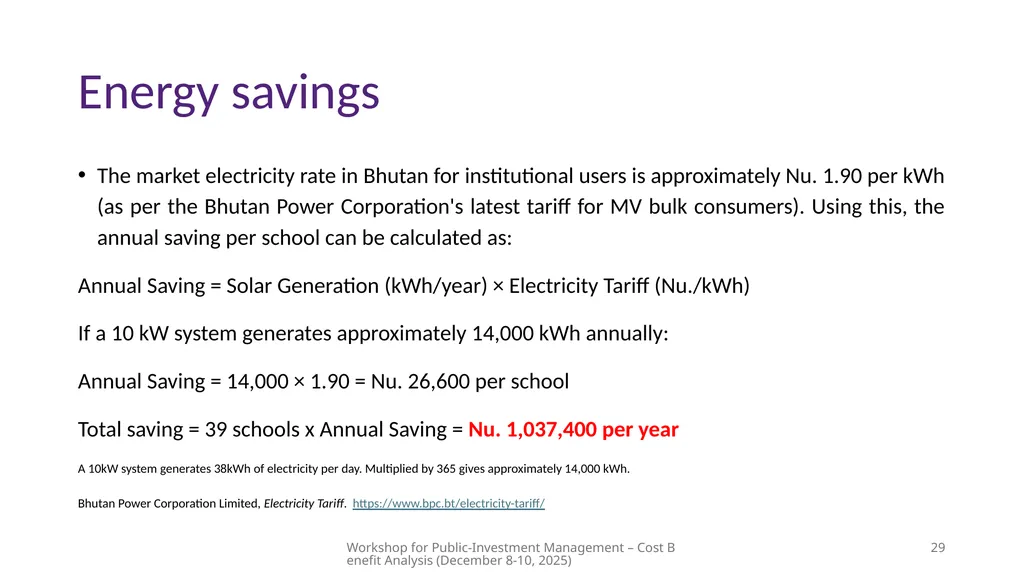
slide29. Energy savings The market electricity rate in Bhutan for institutional users is approximately Nu. 1.90 per kWh (as per the Bhutan Power Corporation's latest tariff for MV bulk consumers). Using this, the annual saving per school can be calculated as:
Annual Saving = Solar Generation (kWh/year) × Electricity Tariff (Nu./kWh)
If a 10 kW system generates approximately 14,000 kWh annually:
Annual Saving = 14,000 × 1.90 = Nu. 26,600 per school
Total saving = 39 schools x Annual Saving = Nu. 1,037,400 per year
A 10kW system generates 38kWh of electricity per day. Multiplied by 365 gives approximately 14,000 kWh.
Bhutan Power Corporation Limited, Electricity Tariff. https://www.bpc.bt/electricity-tariff/ Workshop for Public-Investment Management – Cost Benefit Analysis (December 8-10, 2025) 29<br>
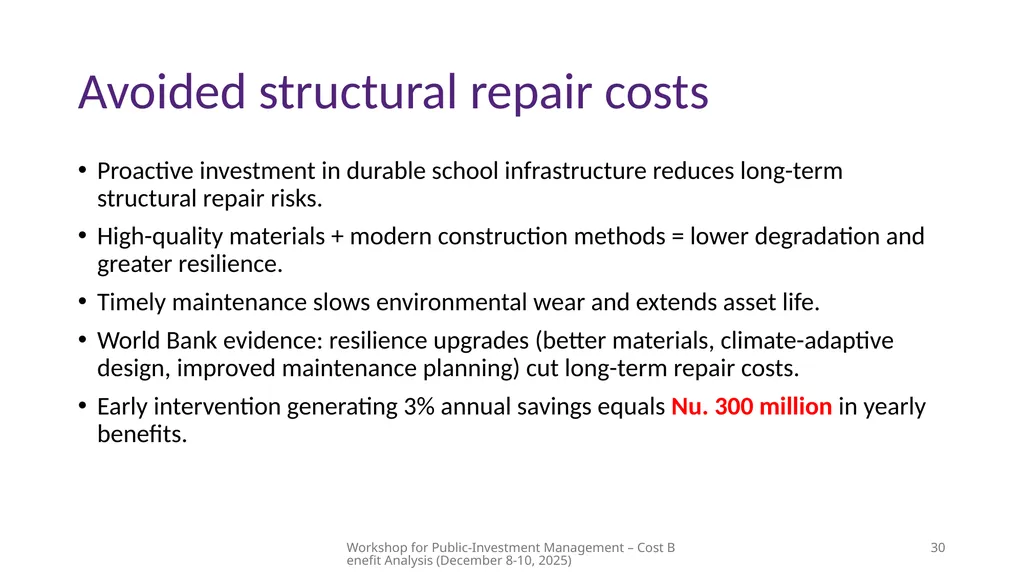
slide30. Avoided structural repair costs Proactive investment in durable school infrastructure reduces long-term structural repair risks.
High-quality materials + modern construction methods = lower degradation and greater resilience.
Timely maintenance slows environmental wear and extends asset life.
World Bank evidence: resilience upgrades (better materials, climate-adaptive design, improved maintenance planning) cut long-term repair costs.
Early intervention generating 3% annual savings equals Nu. 300 million in yearly benefits. Workshop for Public-Investment Management – Cost Benefit Analysis (December 8-10, 2025) 30<br>
slide31. Questions? 31 Workshop for Public-Investment Management – Cost Benefit Analysis (July 13-19, 2025) Workshop for Public-Investment Management – Cost Benefit Analysis (December 8-10, 2025)<br>
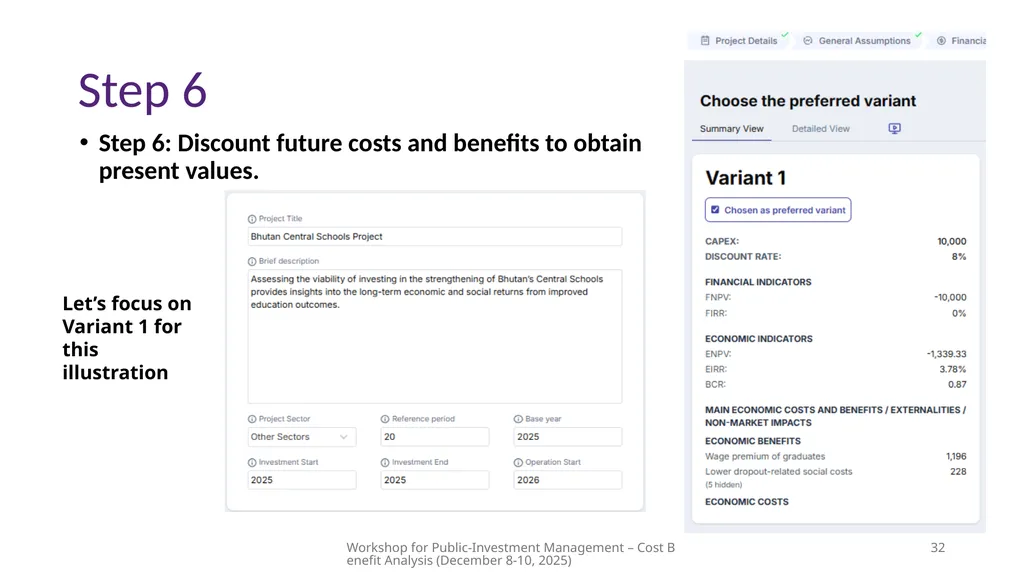
slide32. Step 6 Step 6: Discount future costs and benefits to obtain present values. Workshop for Public-Investment Management – Cost Benefit Analysis (December 8-10, 2025) 32 Let’s focus on Variant 1 for this illustration<br>
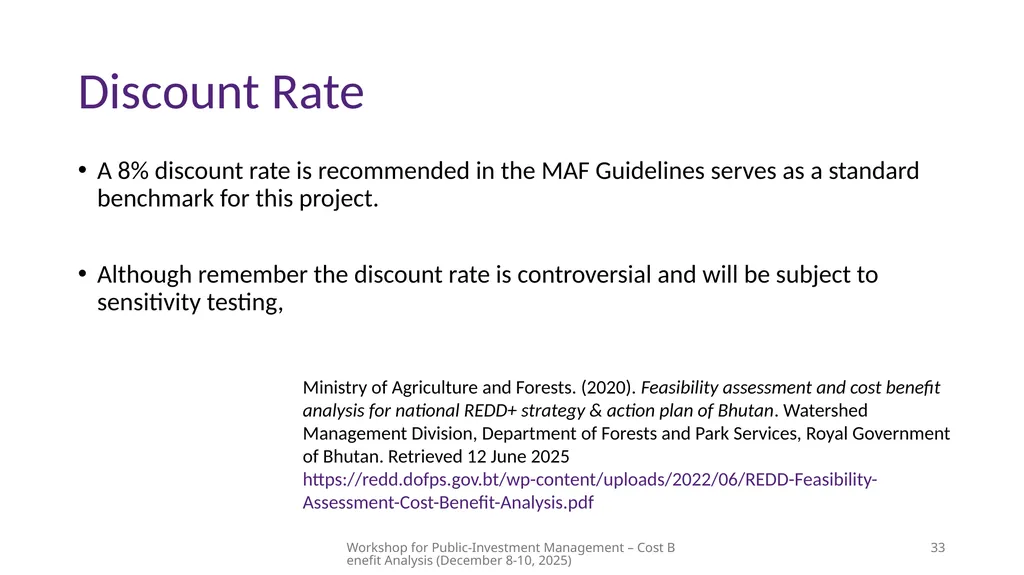
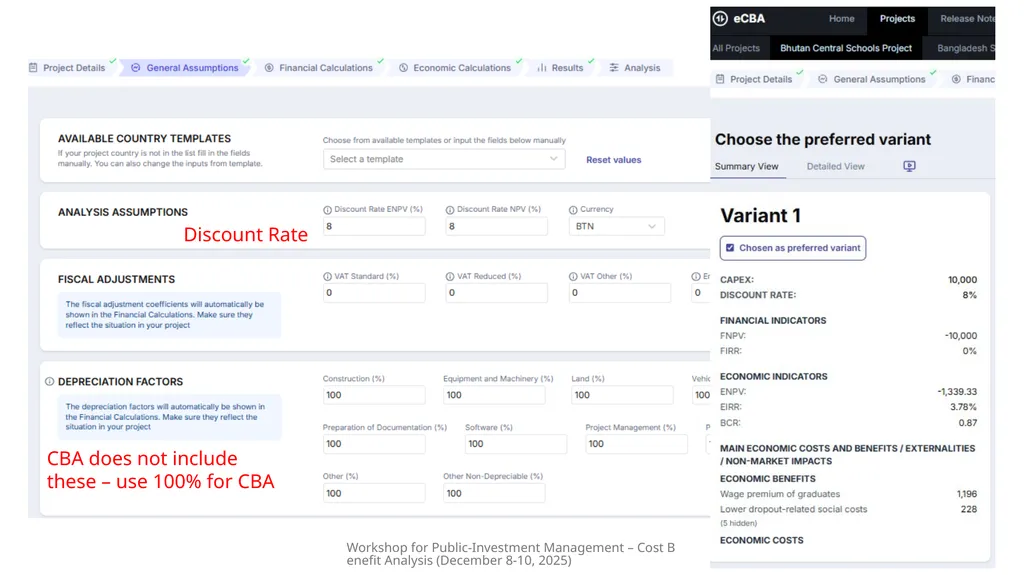
slide33. Discount Rate A 8% discount rate is recommended in the MAF Guidelines serves as a standard benchmark for this project.
Although remember the discount rate is controversial and will be subject to sensitivity testing, Workshop for Public-Investment Management – Cost Benefit Analysis (December 8-10, 2025) 33 Ministry of Agriculture and Forests. (2020). Feasibility assessment and cost benefit analysis for national REDD+ strategy & action plan of Bhutan. Watershed Management Division, Department of Forests and Park Services, Royal Government of Bhutan. Retrieved 12 June 2025 https://redd.dofps.gov.bt/wp-content/uploads/2022/06/REDD-Feasibility-Assessment-Cost-Benefit-Analysis.pdf<br>
slide34. Workshop for Public-Investment Management – Cost Benefit Analysis (December 8-10, 2025) 34 Discount Rate CBA does not include these – use 100% for CBA<br>
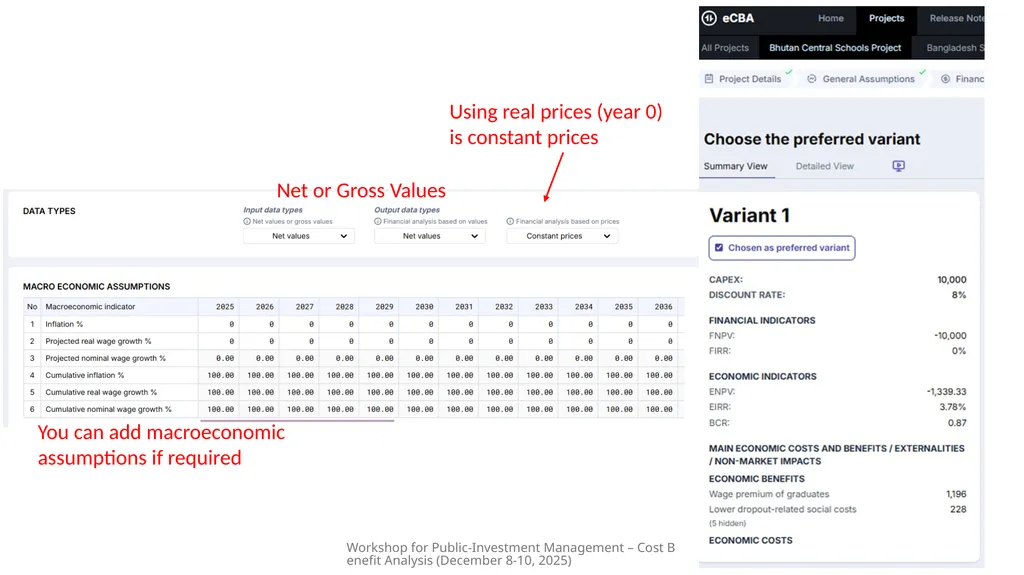
slide35. Workshop for Public-Investment Management – Cost Benefit Analysis (December 8-10, 2025) 35 Net or Gross Values Using real prices (year 0) is constant prices You can add macroeconomic assumptions if required<br>
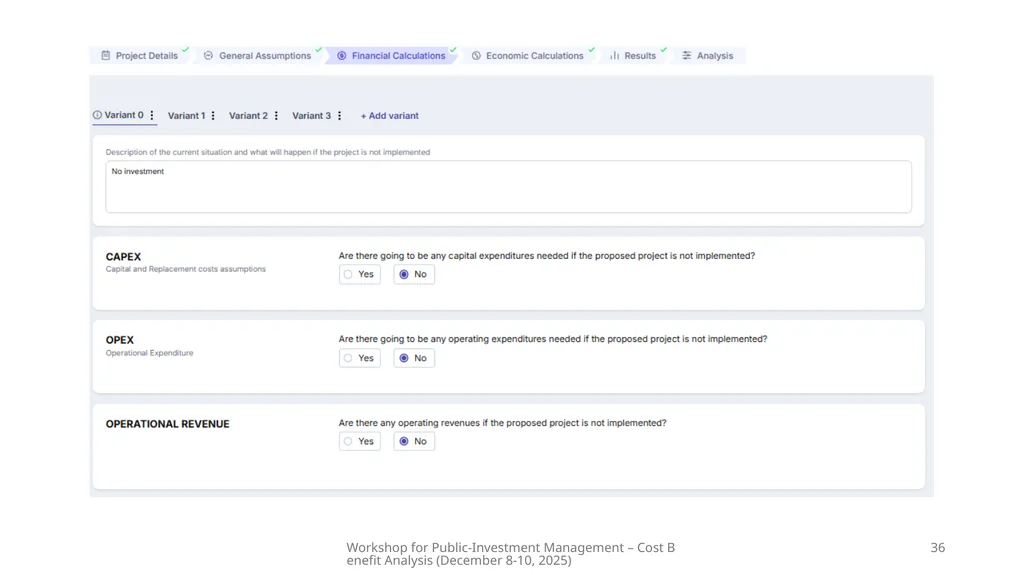
slide36. Workshop for Public-Investment Management – Cost Benefit Analysis (December 8-10, 2025) 36<br>
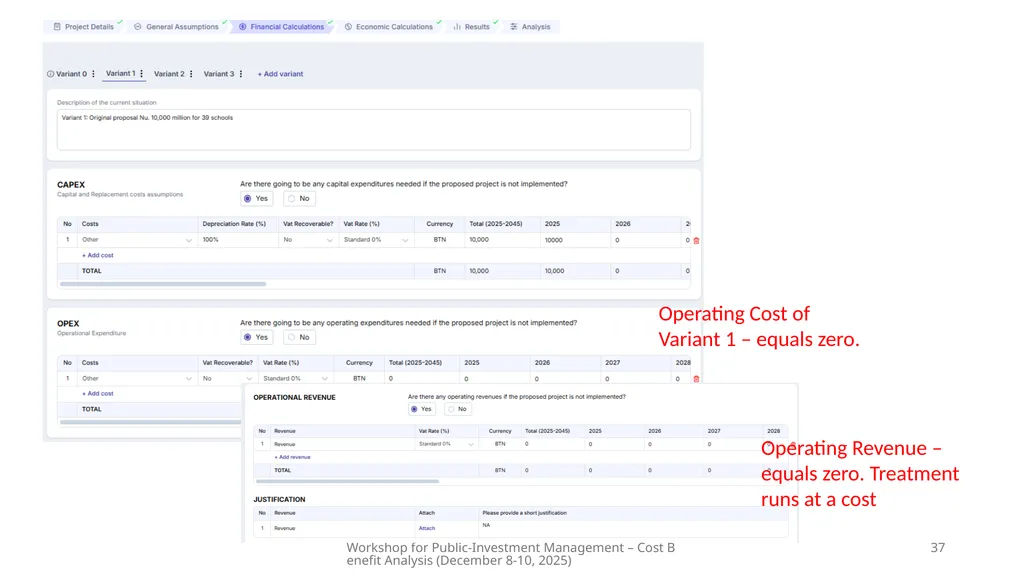
slide37. Workshop for Public-Investment Management – Cost Benefit Analysis (December 8-10, 2025) 37 Operating Revenue – equals zero. Treatment runs at a cost Operating Cost of Variant 1 – equals zero.<br>
slide38. Workshop for Public-Investment Management – Cost Benefit Analysis (December 8-10, 2025) 38<br>
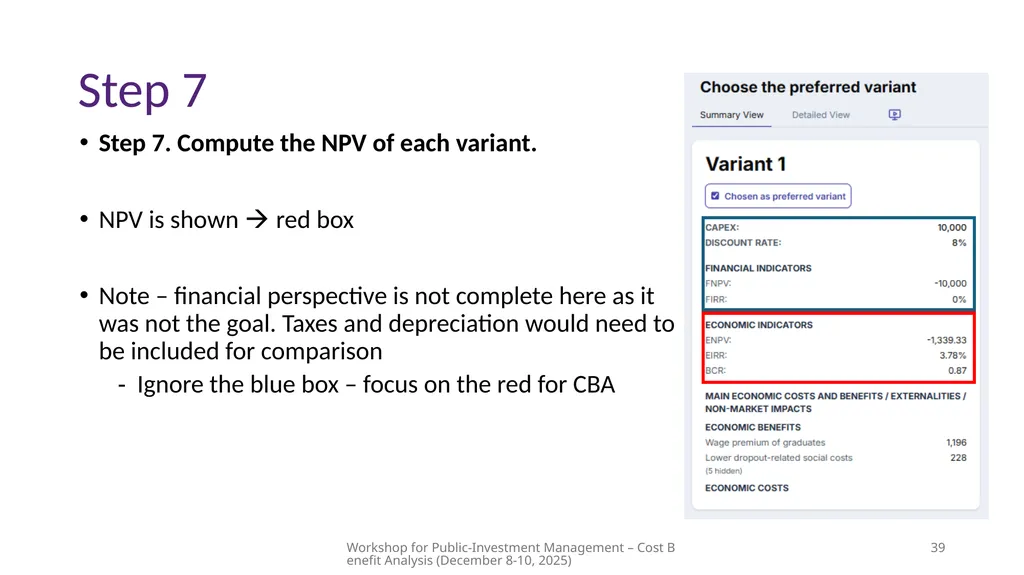
slide39. Step 7 Step 7. Compute the NPV of each variant.
NPV is shown red box
Note – financial perspective is not complete here as it was not the goal. Taxes and depreciation would need to be included for comparison
Ignore the blue box – focus on the red for CBA Workshop for Public-Investment Management – Cost Benefit Analysis (December 8-10, 2025) 39<br>
slide40. Input the Other Variant Information Workshop for Public-Investment Management – Cost Benefit Analysis (December 8-10, 2025) 40<br>
slide41. Questions? 41 Workshop for Public-Investment Management – Cost Benefit Analysis (July 13-19, 2025) Workshop for Public-Investment Management – Cost Benefit Analysis (December 8-10, 2025)<br>
slide42. Step 8 Step 8: Perform a sensitivity analysis. Workshop for Public-Investment Management – Cost Benefit Analysis (December 8-10, 2025) 42<br>
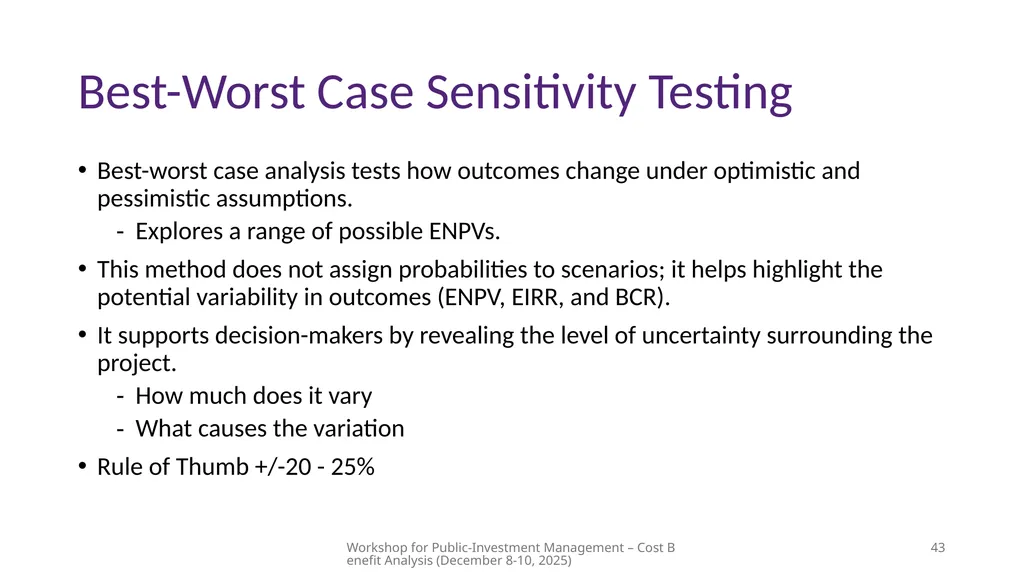
slide43. Best-Worst Case Sensitivity Testing Best-worst case analysis tests how outcomes change under optimistic and pessimistic assumptions.
Explores a range of possible ENPVs.
This method does not assign probabilities to scenarios; it helps highlight the potential variability in outcomes (ENPV, EIRR, and BCR).
It supports decision-makers by revealing the level of uncertainty surrounding the project.
How much does it vary
What causes the variation
Rule of Thumb +/-20 - 25% Workshop for Public-Investment Management – Cost Benefit Analysis (December 8-10, 2025) 43<br>
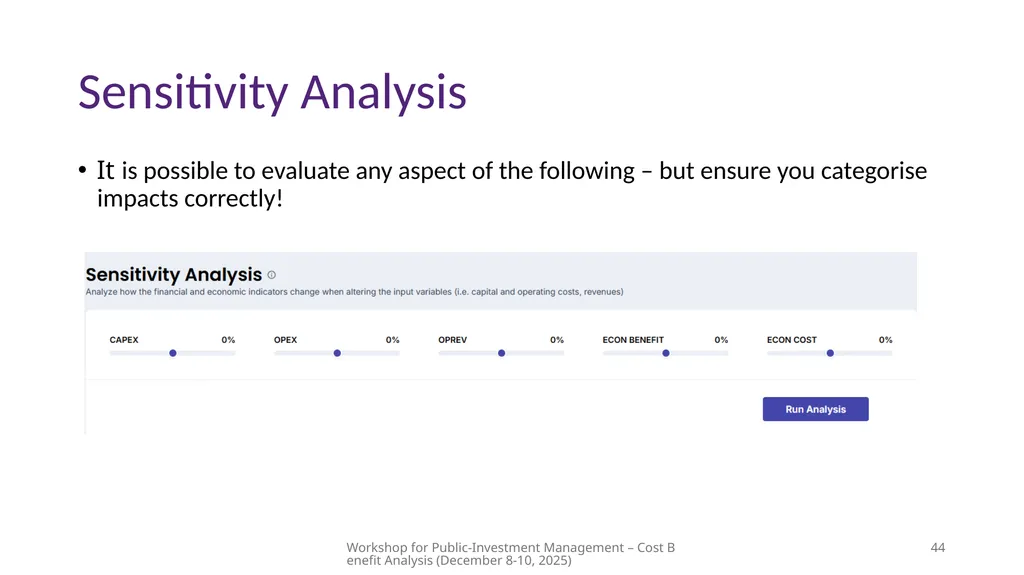
slide44. Sensitivity Analysis It is possible to evaluate any aspect of the following – but ensure you categorise impacts correctly! Workshop for Public-Investment Management – Cost Benefit Analysis (December 8-10, 2025) 44<br>
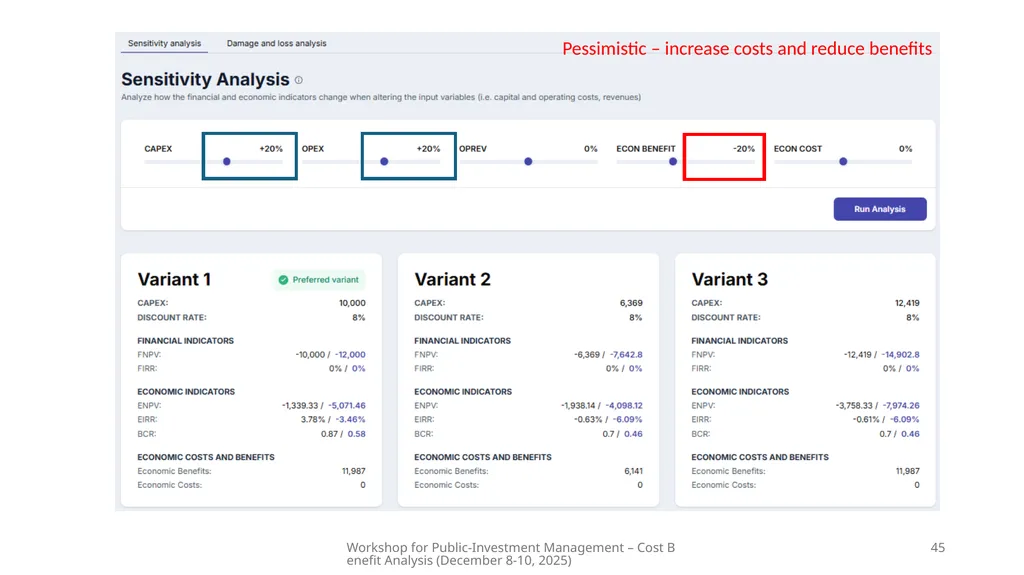
slide45. Workshop for Public-Investment Management – Cost Benefit Analysis (December 8-10, 2025) 45 Pessimistic – increase costs and reduce benefits<br>
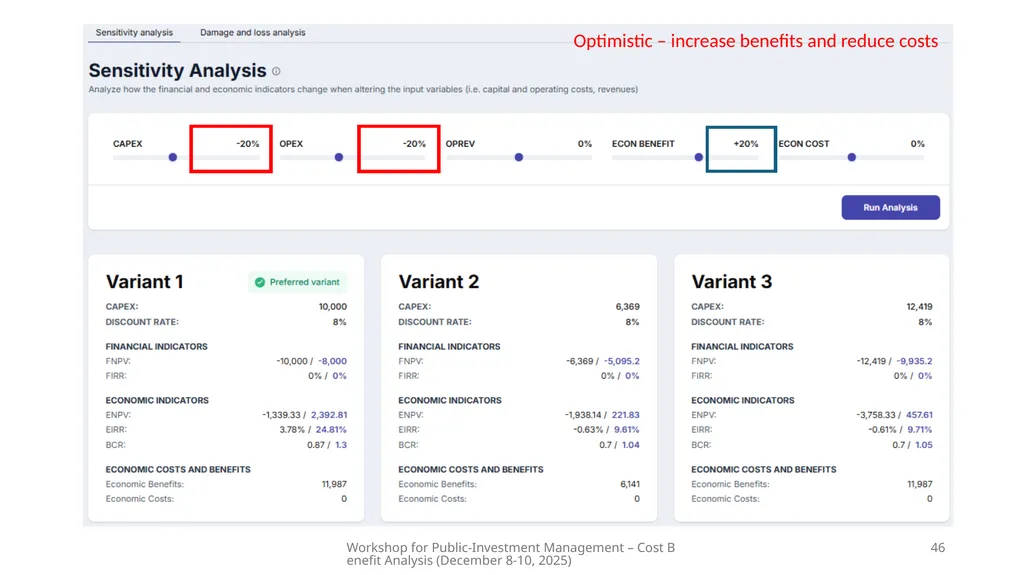
slide46. Workshop for Public-Investment Management – Cost Benefit Analysis (December 8-10, 2025) 46 Optimistic – increase benefits and reduce costs<br>
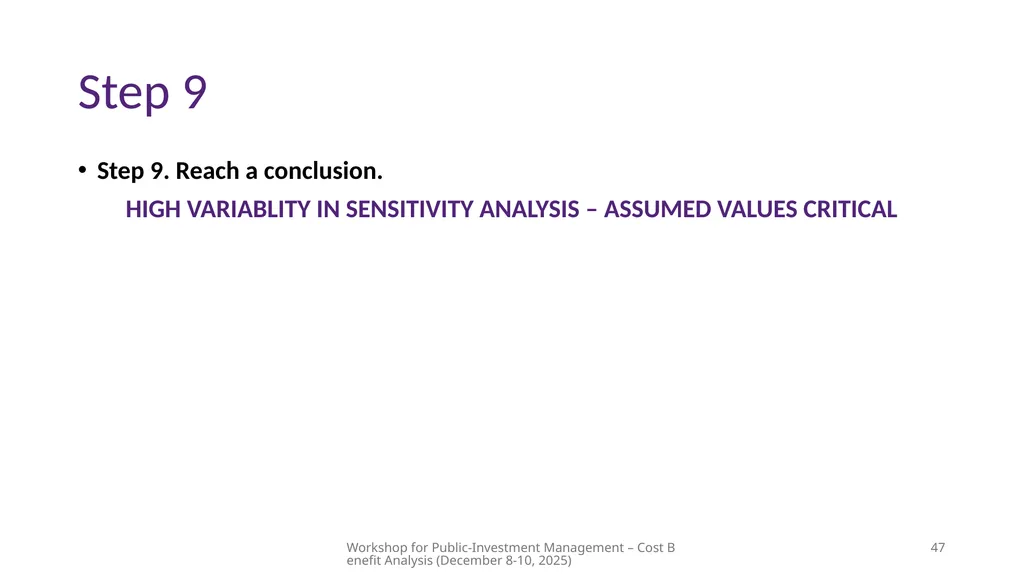
slide47. Step 9 Step 9. Reach a conclusion.
HIGH VARIABLITY IN SENSITIVITY ANALYSIS – ASSUMED VALUES CRITICAL Workshop for Public-Investment Management – Cost Benefit Analysis (December 8-10, 2025) 47<br>
slide48. Questions? 48 Workshop for Public-Investment Management – Cost Benefit Analysis (July 13-19, 2025) Workshop for Public-Investment Management – Cost Benefit Analysis (December 8-10, 2025)<br>
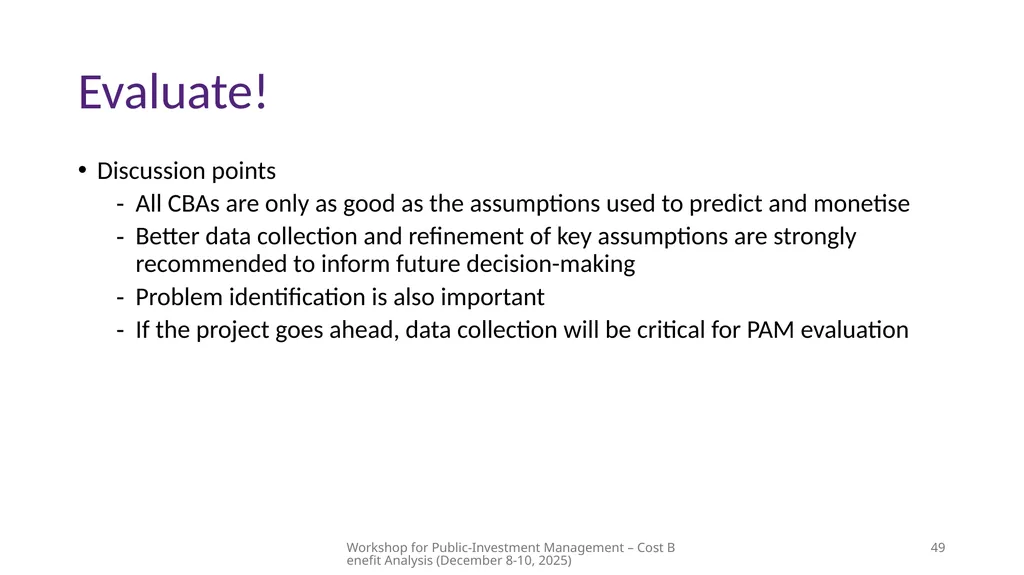
slide49. Evaluate! Discussion points
All CBAs are only as good as the assumptions used to predict and monetise
Better data collection and refinement of key assumptions are strongly recommended to inform future decision-making
Problem identification is also important
If the project goes ahead, data collection will be critical for PAM evaluation Workshop for Public-Investment Management – Cost Benefit Analysis (December 8-10, 2025) 49<br>
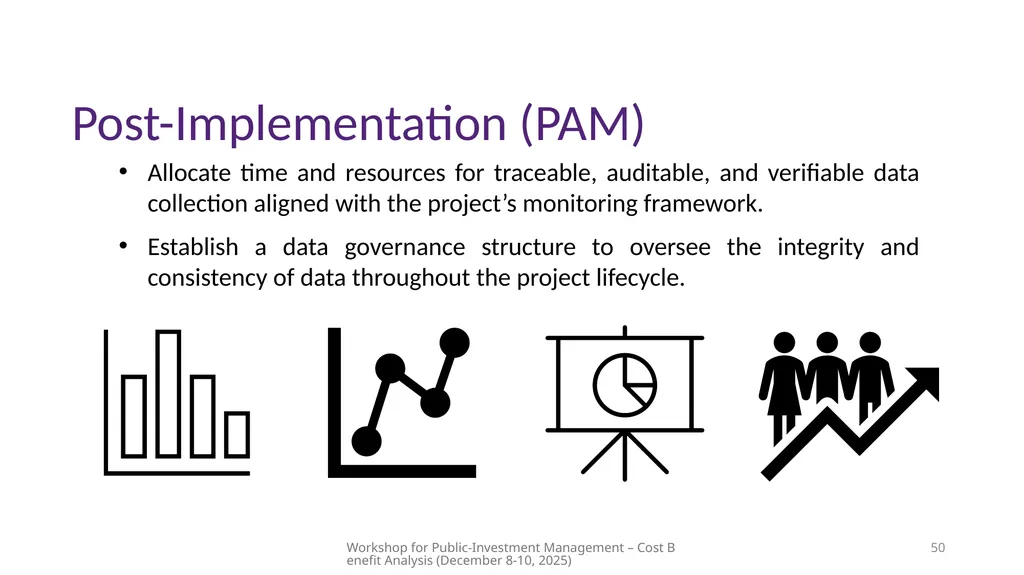
slide50. Post-Implementation (PAM) Workshop for Public-Investment Management – Cost Benefit Analysis (December 8-10, 2025) 50 Allocate time and resources for traceable, auditable, and verifiable data collection aligned with the project’s monitoring framework.
Establish a data governance structure to oversee the integrity and consistency of data throughout the project lifecycle.<br>
slide51. Post-Implementation (PAM) Workshop for Public-Investment Management – Cost Benefit Analysis (December 8-10, 2025) 51 Use standardised indicators to enable comparison across projects and track progress against baseline conditions.
Implement monitoring and evaluation during and after implementation to inform operational management and future decision-making.<br>
slide52. Module 3 - Learning Objectives Apply the 9-step CBA framework to evaluate the feasibility and societal value of a specialist hospital investment.
Identify the BAU and Variants, including key assumptions about service delivery.
Understand the research process for identifying costs and benefits, including capital expenditure, health outcomes, and non-market impacts.
Conduct sensitivity analysis using discount rates and best-worst case
Interpret and communicate CBA outcomes (e.g. ENPV, EIRR and BCR) to inform evidence-based decision-making under uncertainty. Workshop for Public-Investment Management – Cost Benefit Analysis (December 8-10, 2025) 52<br>
slide53. Suzanne Bonner Contact Senior Lecturer, School of Economics suzanne.bonner@uq.edu.au CRICOS 00025B • TEQSA PRV12080<br>
slide2. Training Schedule Workshop for Public-Investment Management – Cost Benefit Analysis (December 8-10, 2025) 2<br>
slide3. Training Schedule Workshop for Public-Investment Management – Cost Benefit Analysis (December 8-10, 2025) 3<br>
slide4. Activity Workshop for Public-Investment Management – Cost Benefit Analysis (December 8-10, 2025) 4 Individually (3-5 minutes)
One insight or concept from Day 1 that stood out to you
One challenge or uncertainty you are still thinking about
One way you might apply something they learned in their work Small Group Discussion (10–15 minutes)
Share your reflections. Groups should discuss:
Common themes or patterns
Differences in takeaways
Can add to your example from yesterday Whole Group Share-Back (10–15 minutes)<br>
slide5. Module 3 - Learning Objectives Apply the 9-step CBA framework to evaluate the feasibility and societal value of a school investment project.
Identify the BAU and Variants, including key assumptions for service delivery.
Understand the research process for identifying costs and benefits, including capital expenditure, health outcomes, and non-market impacts.
Conduct sensitivity analysis using discount rates and best-worst case
Interpret and communicate CBA outcomes (e.g. ENPV, EIRR and BCR) to inform evidence-based decision-making under uncertainty. Workshop for Public-Investment Management – Cost Benefit Analysis (December 8-10, 2025) 5<br>
slide6. Disclaimer This report has been prepared by The University of Queensland (UQ) for the teaching and learning purposes of Bhutan Government officers. It is based on a project funded and prepared for the World Bank Group. Workshop for Public-Investment Management – Cost Benefit Analysis (December 8-10, 2025) 6<br>
slide7. Context of this Module In this module, we will look at an example including implementing in the eCBA tool, following the 9 steps.
An example provides a concrete context for applying abstract concepts like NPV, IRR, and BCR.
We will cover the step-by-step process of quantifying costs and benefits, discounting over time, and interpreting results.
Process will encourage critical thinking about data gaps, ethical considerations, and judgements involved in real-world CBA applications. Workshop for Public-Investment Management – Cost Benefit Analysis (December 8-10, 2025) 7<br>
slide8. Steps of a CBA Specify the options or set of alternatives under consideration.
Decide whose benefits and costs count.
Identify the impacts and select measurement indicators.
Predict the impacts over the life of the proposed project, program, or policy.
Monetise all impacts (attach $ values).
Discount future costs and benefits to obtain present values.
Compute the net present value (NPV) of each project.
Perform a sensitivity analysis.
Reach a conclusion. Workshop for Public-Investment Management – Cost Benefit Analysis (December 8-10, 2025) 8<br>
slide9. CBA Framework as a 9-Step Flowchart Workshop for Public-Investment Management – Cost Benefit Analysis (December 8-10, 2025) 9 Context: Evaluate an investment into School infrastructure.<br>
slide10. Step 1 Step 1: Specify the options or set of alternatives under consideration.
Requires the identification of the status quo/business as usual Workshop for Public-Investment Management – Cost Benefit Analysis (December 8-10, 2025) 10<br>
slide11. Step 2 Step 2: Decide whose benefits and costs count
A key step in cost-benefit analysis is deciding whose costs and benefits matter.
identify which stakeholders should be included when assessing impacts.
determines whose wellbeing is considered when measuring gains and losses. Workshop for Public-Investment Management – Cost Benefit Analysis (December 8-10, 2025) 11<br>
slide12. Strengthening school stakeholders In this case, stakeholders are grouped into two categories; Workshop for Public-Investment Management – Cost Benefit Analysis (December 8-10, 2025) 12<br>
slide13. Step 3 Step 3: Identify the impacts and select measurement indicators.
Identify all relevant impacts, including direct, indirect, tangible, and intangible – What can already be measured?
Then reviewing existing research including:
Reports and publications Workshop for Public-Investment Management – Cost Benefit Analysis (December 8-10, 2025) 13 Start by Brainstorming<br>
slide14. Where to Look? Start by reviewing existing research, which helps build a foundation of evidence for identifying potential impacts. This should include:
Grey literature – such as government reports, consultancy studies, NGO publications, and internal evaluations. These often contain practical insights and data not published in academic journals.
Academic studies – peer-reviewed research on similar projects or policy areas can provide robust evidence, theoretical frameworks, and tested valuation methods. Meta analyses are useful
Previous CBAs or evaluations – especially those conducted in comparable sectors or regions, which may offer transferable assumptions or data. Workshop for Public-Investment Management – Cost Benefit Analysis (December 8-10, 2025) 14<br>
slide15. Benefit Value Transfers What is Benefit Transfer?
Applying economic values from previous studies to a new project or location
Useful when primary data collection is not feasible
When to Use It
Limited time or resources to conduct original valuation
Common Applications
Valuing environmental impacts (e.g. air quality, biodiversity, water)
Estimating health benefits (e.g. reduced mortality, improved wellbeing)
Calculating time savings or recreational values Workshop for Public-Investment Management – Cost Benefit Analysis (December 8-10, 2025) 15<br>
slide16. Benefit Transfers What to look for?
Step 1 – identify whether existing studies or values can be used as part of the transfer method.
Step 2 – decide whether the existing values from the study are appropriate for use in the CBA under consideration
Step 3 – evaluate the quality of the research being used as part of the transfer.
Step 4 – make any appropriate adjustments to reflect the true value of the impact under consideration in the CBA Workshop for Public-Investment Management – Cost Benefit Analysis (December 8-10, 2025) 16 Remember you want to both PREDICT and MONETISE Not all research will be directly relevant, but it still may be useful<br>
slide17. Shadow Price? Do you need a shadow price?
Consider market failures and distortions
Absence of markets?
Consider whether the price used represents the true economic value
Research often tells you if a shadow price is needed Workshop for Public-Investment Management – Cost Benefit Analysis (December 8-10, 2025) 17<br>
slide18. Comprehensive benefit mapping for primary stakeholders (direct impacts) Workshop for Public-Investment Management – Cost Benefit Analysis (December 8-10, 2025) 18<br>
slide19. Comprehensive benefit mapping for secondary stakeholders (indirect impacts) Workshop for Public-Investment Management – Cost Benefit Analysis (December 8-10, 2025) 19<br>
slide20. Questions? 20 Workshop for Public-Investment Management – Cost Benefit Analysis (July 13-19, 2025) Workshop for Public-Investment Management – Cost Benefit Analysis (December 8-10, 2025)<br>
slide21. Step 4 Step 4: Predict the impacts over the life of the proposed project.
What impacts occur and when do they happen?
Determine the timeframe of the analysis:
Baseline over analysis period (e.g. 30 years) i.e. total project duration
Construction years?
Investment years?
Operating from? Workshop for Public-Investment Management – Cost Benefit Analysis (December 8-10, 2025) 21<br>
slide22. Step 5 Step 5: Monetise all impacts (in the relevant currency e.g. Nu.). Workshop for Public-Investment Management – Cost Benefit Analysis (December 8-10, 2025) 22 Total expected capital investment: Nu. 10,000 million<br>
slide23. Summarise of economic benefit / non-market impact Workshop for Public-Investment Management – Cost Benefit Analysis (December 8-10, 2025) 23<br>
slide24. Wage premium of graduates Workshop for Public-Investment Management – Cost Benefit Analysis (December 8-10, 2025) 24<br>
slide25. Lower dropout-related social costs Workshop for Public-Investment Management – Cost Benefit Analysis (December 8-10, 2025) 25<br>
slide26. Avoided private tuition expenses If 1 percent of the total 64,513 students in secondary education transfer from private to public schooling due to improved facilities and perceived quality. If the average annual private tuition is approximately Nu 50,000, this represents a private cost saving of Nu. 32 million per year. This benefit can be monetised as a direct financial relief for households, enhancing the equity and affordability of education.
Bhutan News Network. (2015, July 6). Private schools fees 2015. Retrieved from https://bhutannewsnetwork.com/wp-content/uploads/2015/07/Private-Schools-Fees-2015.pdf Workshop for Public-Investment Management – Cost Benefit Analysis (December 8-10, 2025) 26<br>
slide27. Health Benefits Research from Canada indicated a CAD$ 100 per student investment in physical education led to CAD$ 484 in healthcare savings (BCR of ≈ 4.84). In comparison an AUD$ 10 million investment yielded AUD$ 641 million in savings over 6 years (yearly BCR ≈ 10.68). Taking the Canadian result as a lower bound estimate of the physical activity benefits and the initial investment of Nu. 839.92 million in sporting facility upgrades provides an anticipated benefit of Nu. 4,065 million.
Ekwaru, J. P., Ohinmaa, A., Dabravolskaj, J., Maximova, K., & Veugelers, P. J. (2021). Cost-effectiveness and return on investment of school-based health promotion programmes for chronic disease prevention. European Journal of Public Health, 31(6), 1183–1189. https://doi.org/10.1093/eurpub/ckab130
Ananthapavan, J., Sacks, G., Brown, V., Moodie, M., Nguyen, P., Veerman, L., Mantilla Herrera, A. M., Lal, A., Peeters, A., & Carter, R. (2020). Priority-setting for obesity prevention—The Assessing Cost-Effectiveness of obesity prevention policies in Australia (ACE-Obesity Policy) study. PloS One, 15(6), e0234804–e0234804. Workshop for Public-Investment Management – Cost Benefit Analysis (December 8-10, 2025) 27<br>
slide28. Community Benefit Workshop for Public-Investment Management – Cost Benefit Analysis (December 8-10, 2025) 28<br>
slide29. Energy savings The market electricity rate in Bhutan for institutional users is approximately Nu. 1.90 per kWh (as per the Bhutan Power Corporation's latest tariff for MV bulk consumers). Using this, the annual saving per school can be calculated as:
Annual Saving = Solar Generation (kWh/year) × Electricity Tariff (Nu./kWh)
If a 10 kW system generates approximately 14,000 kWh annually:
Annual Saving = 14,000 × 1.90 = Nu. 26,600 per school
Total saving = 39 schools x Annual Saving = Nu. 1,037,400 per year
A 10kW system generates 38kWh of electricity per day. Multiplied by 365 gives approximately 14,000 kWh.
Bhutan Power Corporation Limited, Electricity Tariff. https://www.bpc.bt/electricity-tariff/ Workshop for Public-Investment Management – Cost Benefit Analysis (December 8-10, 2025) 29<br>
slide30. Avoided structural repair costs Proactive investment in durable school infrastructure reduces long-term structural repair risks.
High-quality materials + modern construction methods = lower degradation and greater resilience.
Timely maintenance slows environmental wear and extends asset life.
World Bank evidence: resilience upgrades (better materials, climate-adaptive design, improved maintenance planning) cut long-term repair costs.
Early intervention generating 3% annual savings equals Nu. 300 million in yearly benefits. Workshop for Public-Investment Management – Cost Benefit Analysis (December 8-10, 2025) 30<br>
slide31. Questions? 31 Workshop for Public-Investment Management – Cost Benefit Analysis (July 13-19, 2025) Workshop for Public-Investment Management – Cost Benefit Analysis (December 8-10, 2025)<br>
slide32. Step 6 Step 6: Discount future costs and benefits to obtain present values. Workshop for Public-Investment Management – Cost Benefit Analysis (December 8-10, 2025) 32 Let’s focus on Variant 1 for this illustration<br>
slide33. Discount Rate A 8% discount rate is recommended in the MAF Guidelines serves as a standard benchmark for this project.
Although remember the discount rate is controversial and will be subject to sensitivity testing, Workshop for Public-Investment Management – Cost Benefit Analysis (December 8-10, 2025) 33 Ministry of Agriculture and Forests. (2020). Feasibility assessment and cost benefit analysis for national REDD+ strategy & action plan of Bhutan. Watershed Management Division, Department of Forests and Park Services, Royal Government of Bhutan. Retrieved 12 June 2025 https://redd.dofps.gov.bt/wp-content/uploads/2022/06/REDD-Feasibility-Assessment-Cost-Benefit-Analysis.pdf<br>
slide34. Workshop for Public-Investment Management – Cost Benefit Analysis (December 8-10, 2025) 34 Discount Rate CBA does not include these – use 100% for CBA<br>
slide35. Workshop for Public-Investment Management – Cost Benefit Analysis (December 8-10, 2025) 35 Net or Gross Values Using real prices (year 0) is constant prices You can add macroeconomic assumptions if required<br>
slide36. Workshop for Public-Investment Management – Cost Benefit Analysis (December 8-10, 2025) 36<br>
slide37. Workshop for Public-Investment Management – Cost Benefit Analysis (December 8-10, 2025) 37 Operating Revenue – equals zero. Treatment runs at a cost Operating Cost of Variant 1 – equals zero.<br>
slide38. Workshop for Public-Investment Management – Cost Benefit Analysis (December 8-10, 2025) 38<br>
slide39. Step 7 Step 7. Compute the NPV of each variant.
NPV is shown red box
Note – financial perspective is not complete here as it was not the goal. Taxes and depreciation would need to be included for comparison
Ignore the blue box – focus on the red for CBA Workshop for Public-Investment Management – Cost Benefit Analysis (December 8-10, 2025) 39<br>
slide40. Input the Other Variant Information Workshop for Public-Investment Management – Cost Benefit Analysis (December 8-10, 2025) 40<br>
slide41. Questions? 41 Workshop for Public-Investment Management – Cost Benefit Analysis (July 13-19, 2025) Workshop for Public-Investment Management – Cost Benefit Analysis (December 8-10, 2025)<br>
slide42. Step 8 Step 8: Perform a sensitivity analysis. Workshop for Public-Investment Management – Cost Benefit Analysis (December 8-10, 2025) 42<br>
slide43. Best-Worst Case Sensitivity Testing Best-worst case analysis tests how outcomes change under optimistic and pessimistic assumptions.
Explores a range of possible ENPVs.
This method does not assign probabilities to scenarios; it helps highlight the potential variability in outcomes (ENPV, EIRR, and BCR).
It supports decision-makers by revealing the level of uncertainty surrounding the project.
How much does it vary
What causes the variation
Rule of Thumb +/-20 - 25% Workshop for Public-Investment Management – Cost Benefit Analysis (December 8-10, 2025) 43<br>
slide44. Sensitivity Analysis It is possible to evaluate any aspect of the following – but ensure you categorise impacts correctly! Workshop for Public-Investment Management – Cost Benefit Analysis (December 8-10, 2025) 44<br>
slide45. Workshop for Public-Investment Management – Cost Benefit Analysis (December 8-10, 2025) 45 Pessimistic – increase costs and reduce benefits<br>
slide46. Workshop for Public-Investment Management – Cost Benefit Analysis (December 8-10, 2025) 46 Optimistic – increase benefits and reduce costs<br>
slide47. Step 9 Step 9. Reach a conclusion.
HIGH VARIABLITY IN SENSITIVITY ANALYSIS – ASSUMED VALUES CRITICAL Workshop for Public-Investment Management – Cost Benefit Analysis (December 8-10, 2025) 47<br>
slide48. Questions? 48 Workshop for Public-Investment Management – Cost Benefit Analysis (July 13-19, 2025) Workshop for Public-Investment Management – Cost Benefit Analysis (December 8-10, 2025)<br>
slide49. Evaluate! Discussion points
All CBAs are only as good as the assumptions used to predict and monetise
Better data collection and refinement of key assumptions are strongly recommended to inform future decision-making
Problem identification is also important
If the project goes ahead, data collection will be critical for PAM evaluation Workshop for Public-Investment Management – Cost Benefit Analysis (December 8-10, 2025) 49<br>
slide50. Post-Implementation (PAM) Workshop for Public-Investment Management – Cost Benefit Analysis (December 8-10, 2025) 50 Allocate time and resources for traceable, auditable, and verifiable data collection aligned with the project’s monitoring framework.
Establish a data governance structure to oversee the integrity and consistency of data throughout the project lifecycle.<br>
slide51. Post-Implementation (PAM) Workshop for Public-Investment Management – Cost Benefit Analysis (December 8-10, 2025) 51 Use standardised indicators to enable comparison across projects and track progress against baseline conditions.
Implement monitoring and evaluation during and after implementation to inform operational management and future decision-making.<br>
slide52. Module 3 - Learning Objectives Apply the 9-step CBA framework to evaluate the feasibility and societal value of a specialist hospital investment.
Identify the BAU and Variants, including key assumptions about service delivery.
Understand the research process for identifying costs and benefits, including capital expenditure, health outcomes, and non-market impacts.
Conduct sensitivity analysis using discount rates and best-worst case
Interpret and communicate CBA outcomes (e.g. ENPV, EIRR and BCR) to inform evidence-based decision-making under uncertainty. Workshop for Public-Investment Management – Cost Benefit Analysis (December 8-10, 2025) 52<br>
slide53. Suzanne Bonner Contact Senior Lecturer, School of Economics suzanne.bonner@uq.edu.au CRICOS 00025B • TEQSA PRV12080<br>