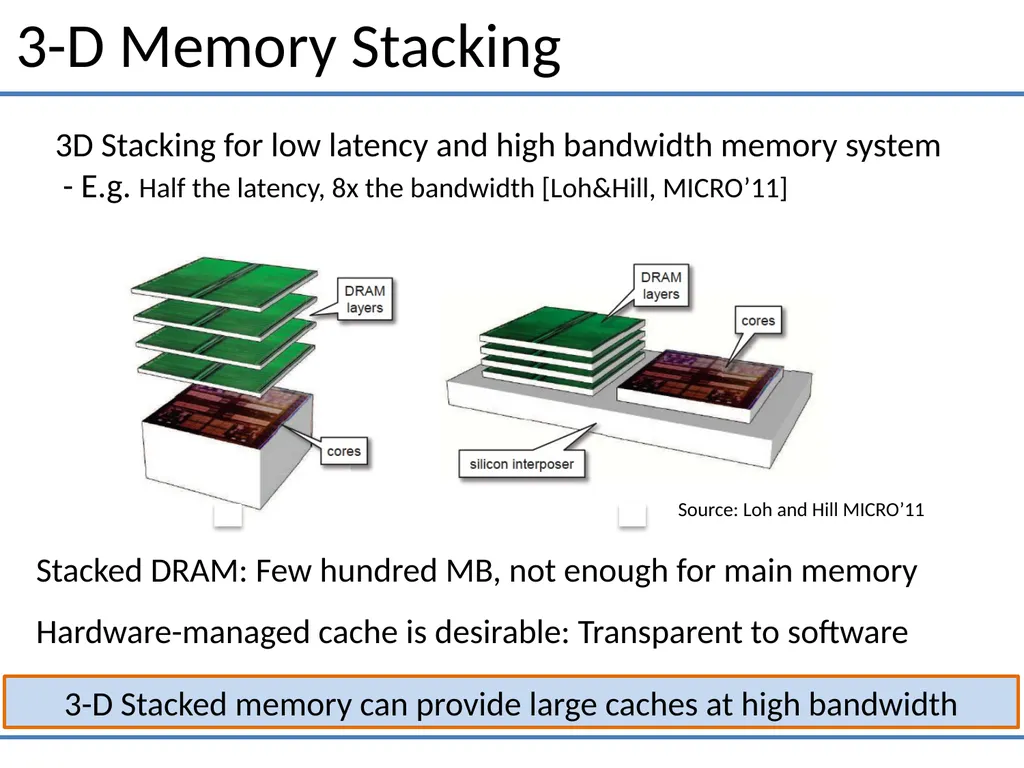
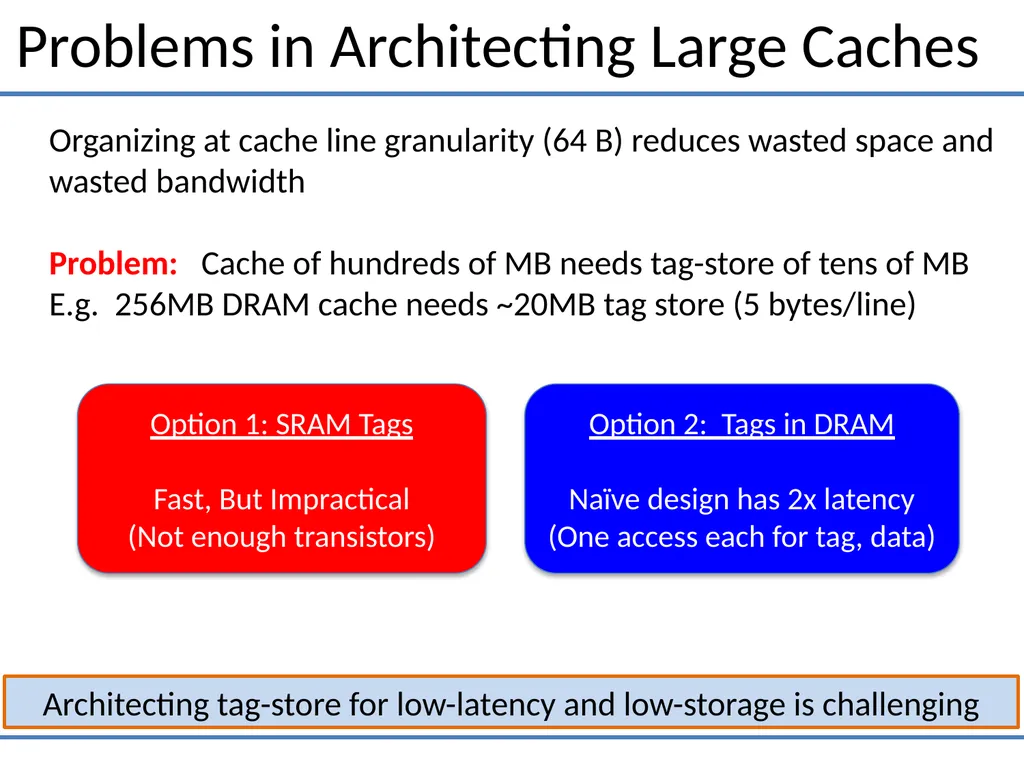
04
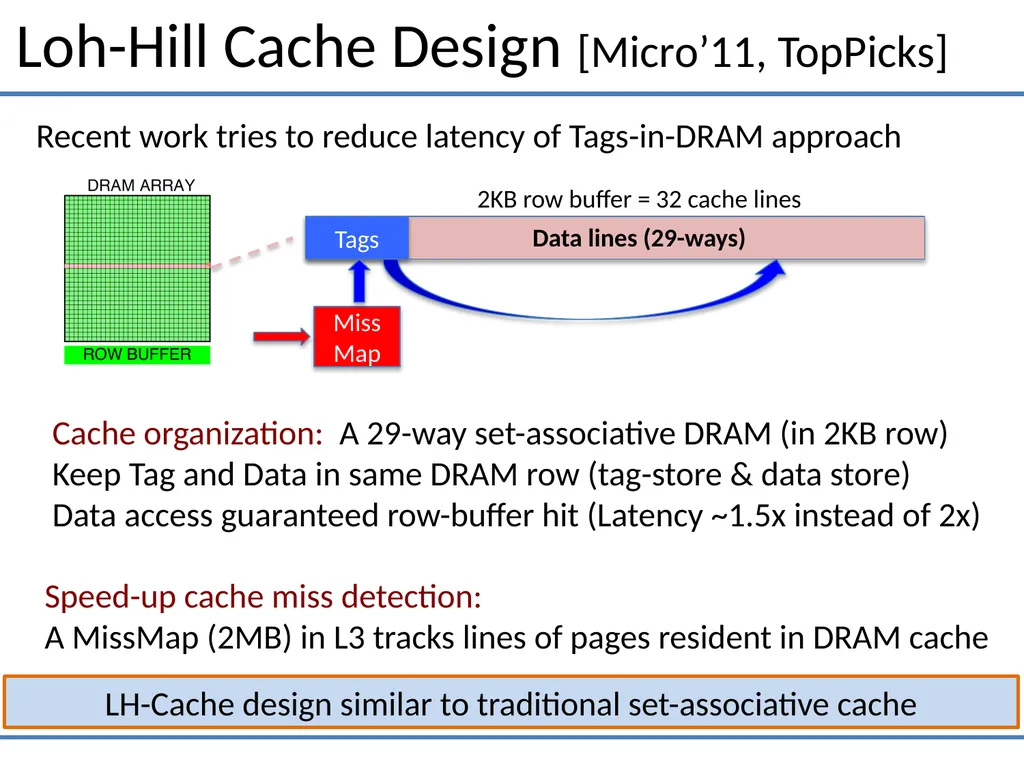
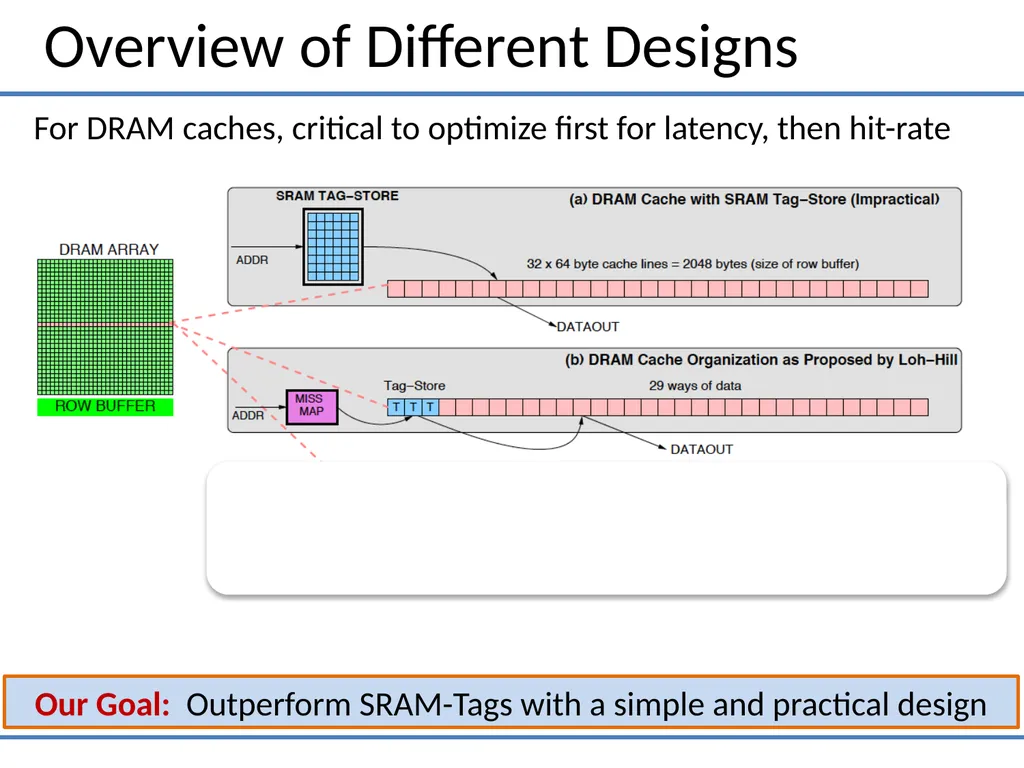
Loh-Hill Cache Design [Micro’11, TopPicks] Recent work tries to reduce latency of Tags-in-DRAM approach LH-Cache design similar to traditional set-associative cache 2KB row buffer = 32 cache lines<br>
05
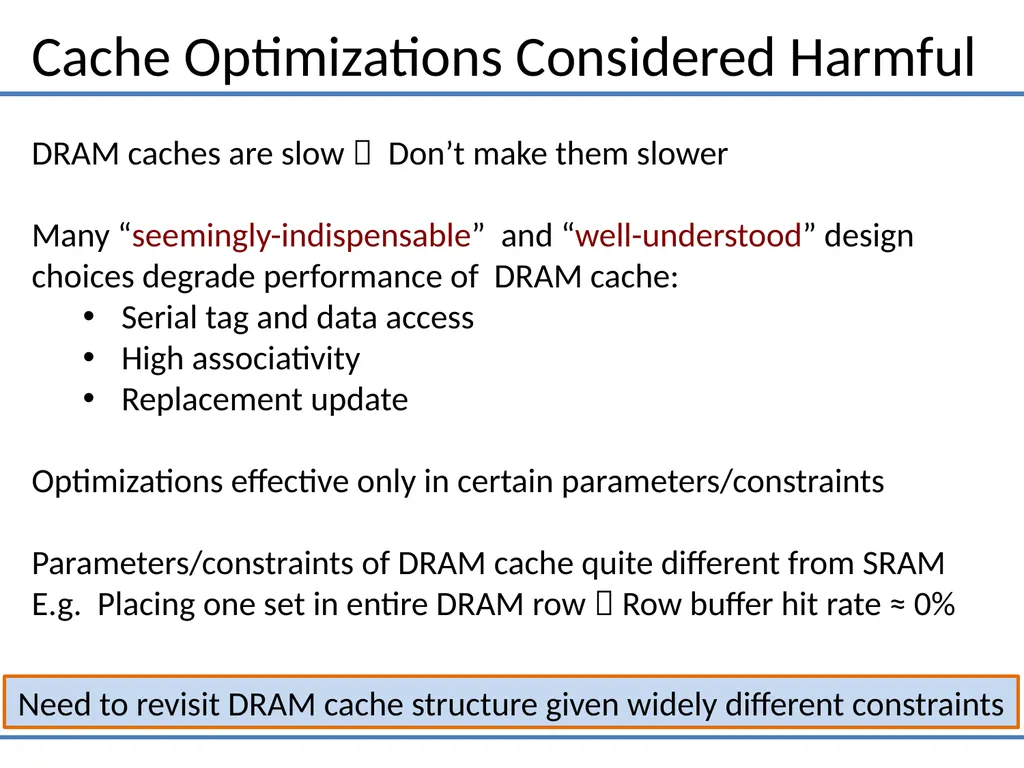
Cache Optimizations Considered Harmful Need to revisit DRAM cache structure given widely different constraints DRAM caches are slow Don’t make them slower
Many “seemingly-indispensable” and “well-understood” design choices degrade performance of DRAM cache:
Serial tag and data access
High associativity
Replacement update
Optimizations effective only in certain parameters/constraints
Parameters/constraints of DRAM cache quite different from SRAM
E.g. Placing one set in entire DRAM row Row buffer hit rate ≈ 0%<br>
06
Outline Introduction & Background
Insight: Optimize First for Latency
Proposal: Alloy Cache
Memory Access Prediction
Summary<br>
07
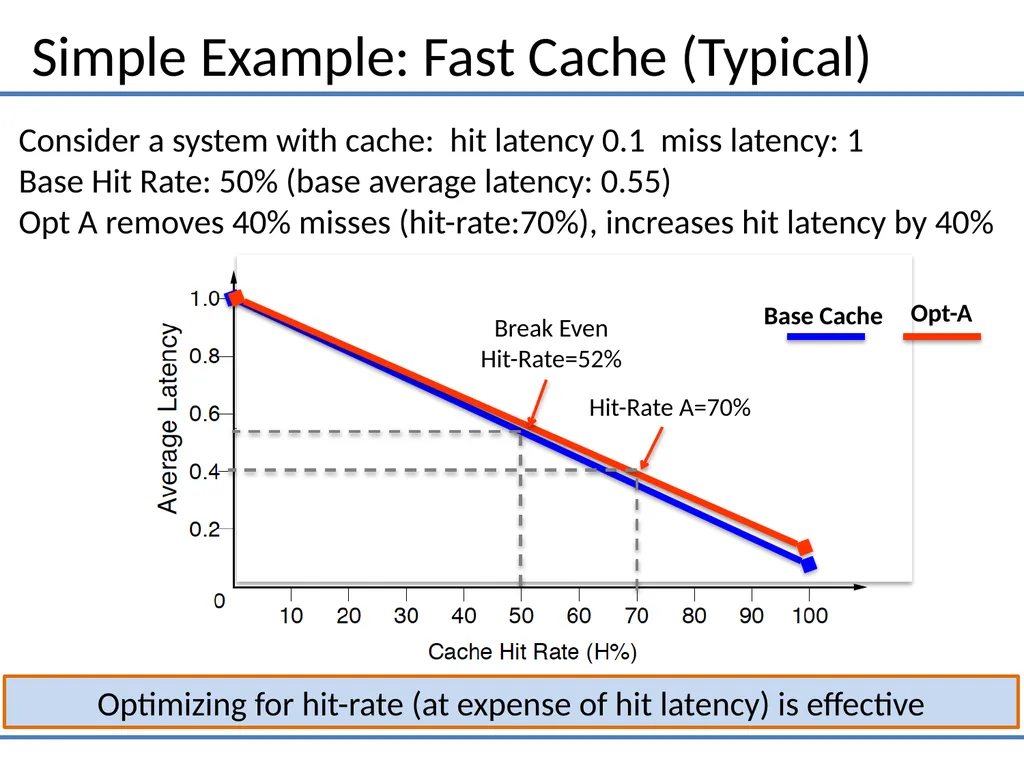
Simple Example: Fast Cache (Typical) Optimizing for hit-rate (at expense of hit latency) is effective Consider a system with cache: hit latency 0.1 miss latency: 1
Base Hit Rate: 50% (base average latency: 0.55)
Opt A removes 40% misses (hit-rate:70%), increases hit latency by 40%<br>
08
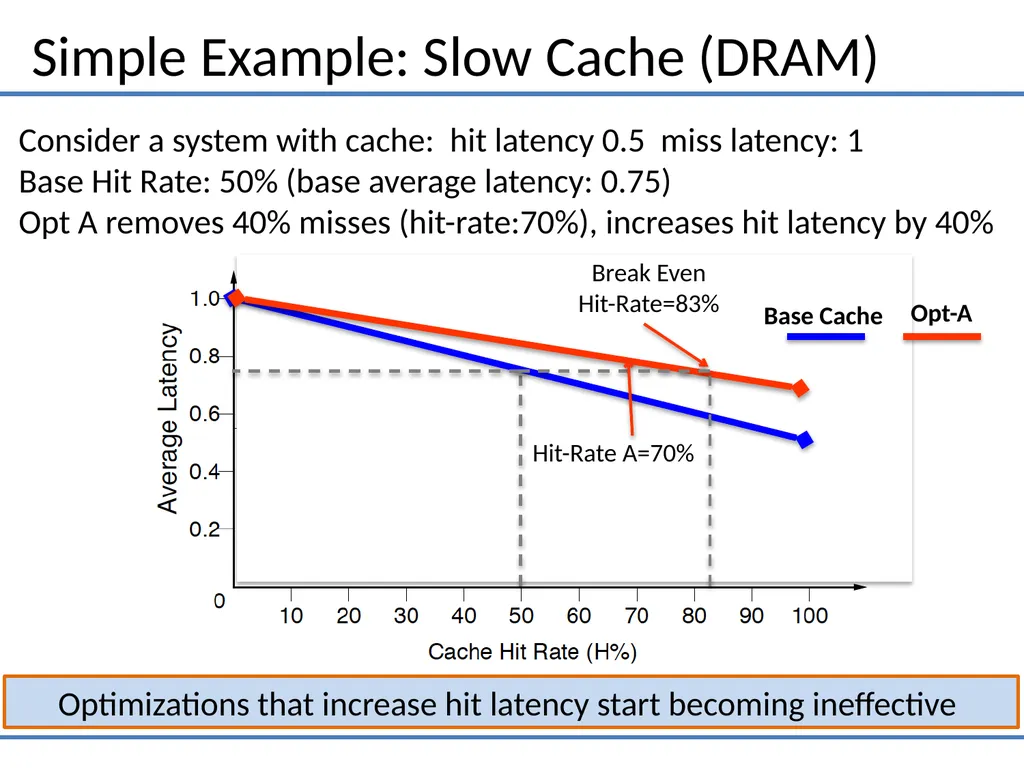
Simple Example: Slow Cache (DRAM) Consider a system with cache: hit latency 0.5 miss latency: 1
Base Hit Rate: 50% (base average latency: 0.75)
Opt A removes 40% misses (hit-rate:70%), increases hit latency by 40% Optimizations that increase hit latency start becoming ineffective<br>
09
Overview of Different Designs Our Goal: Outperform SRAM-Tags with a simple and practical design For DRAM caches, critical to optimize first for latency, then hit-rate<br>
10
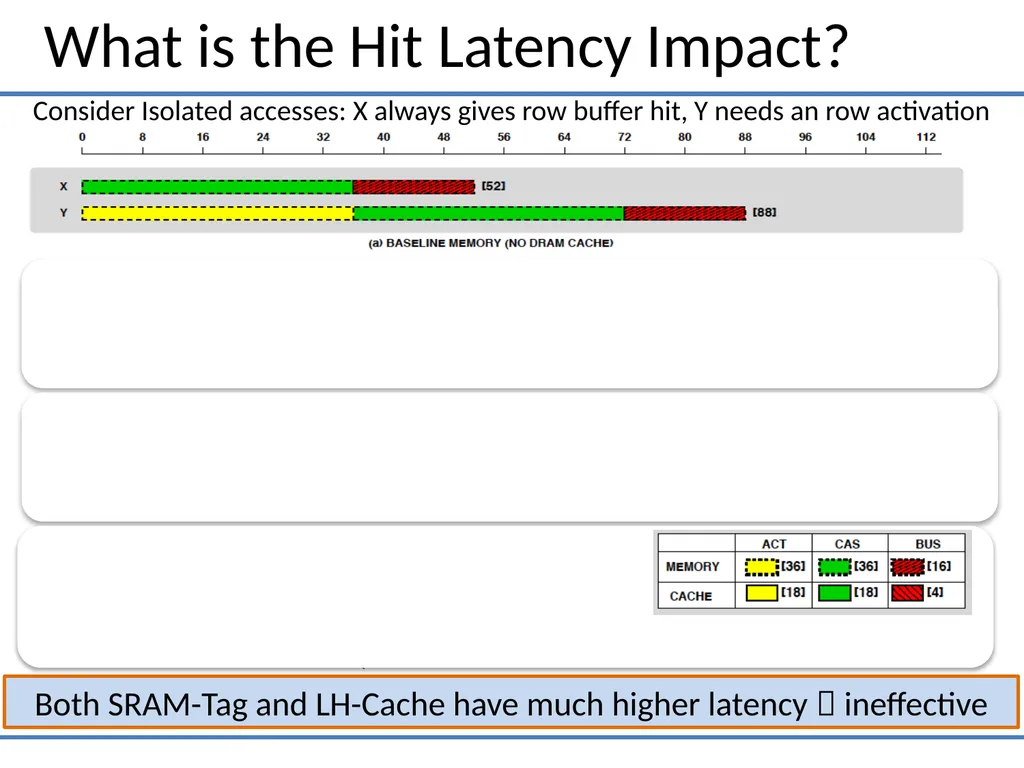
What is the Hit Latency Impact? Both SRAM-Tag and LH-Cache have much higher latency ineffective Consider Isolated accesses: X always gives row buffer hit, Y needs an row activation<br>
11
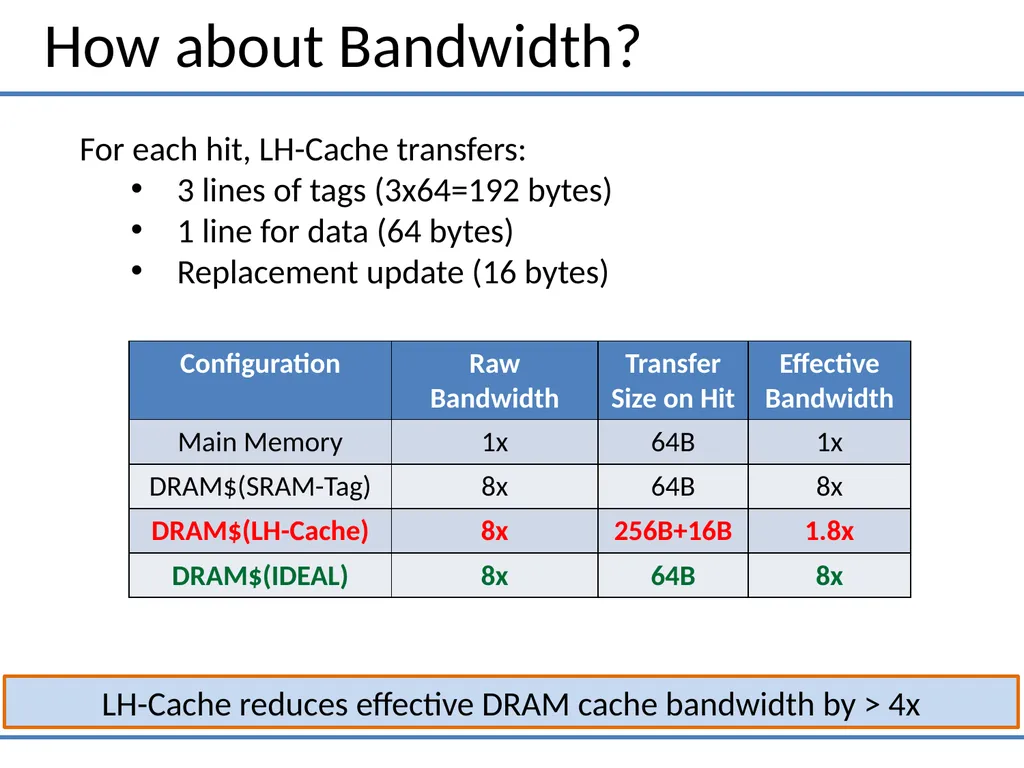
How about Bandwidth? LH-Cache reduces effective DRAM cache bandwidth by > 4x For each hit, LH-Cache transfers:
3 lines of tags (3x64=192 bytes)
1 line for data (64 bytes)
Replacement update (16 bytes)<br>
12
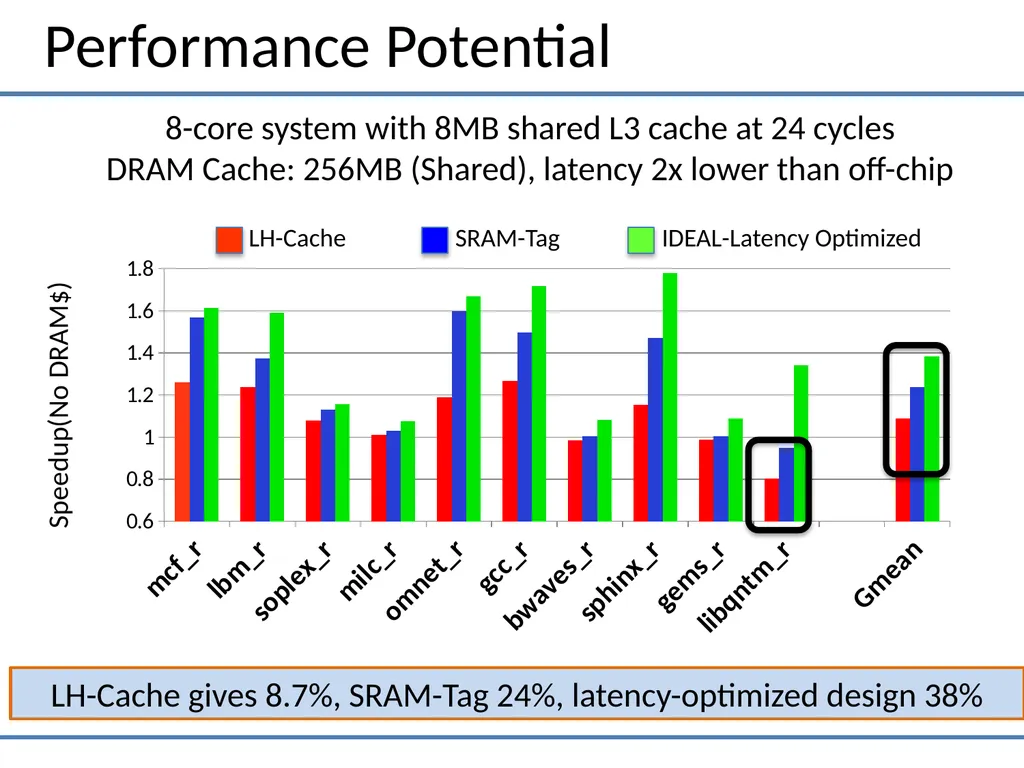
Performance Potential LH-Cache gives 8.7%, SRAM-Tag 24%, latency-optimized design 38% 8-core system with 8MB shared L3 cache at 24 cycles
DRAM Cache: 256MB (Shared), latency 2x lower than off-chip Speedup(No DRAM$) LH-Cache SRAM-Tag IDEAL-Latency Optimized<br>
13
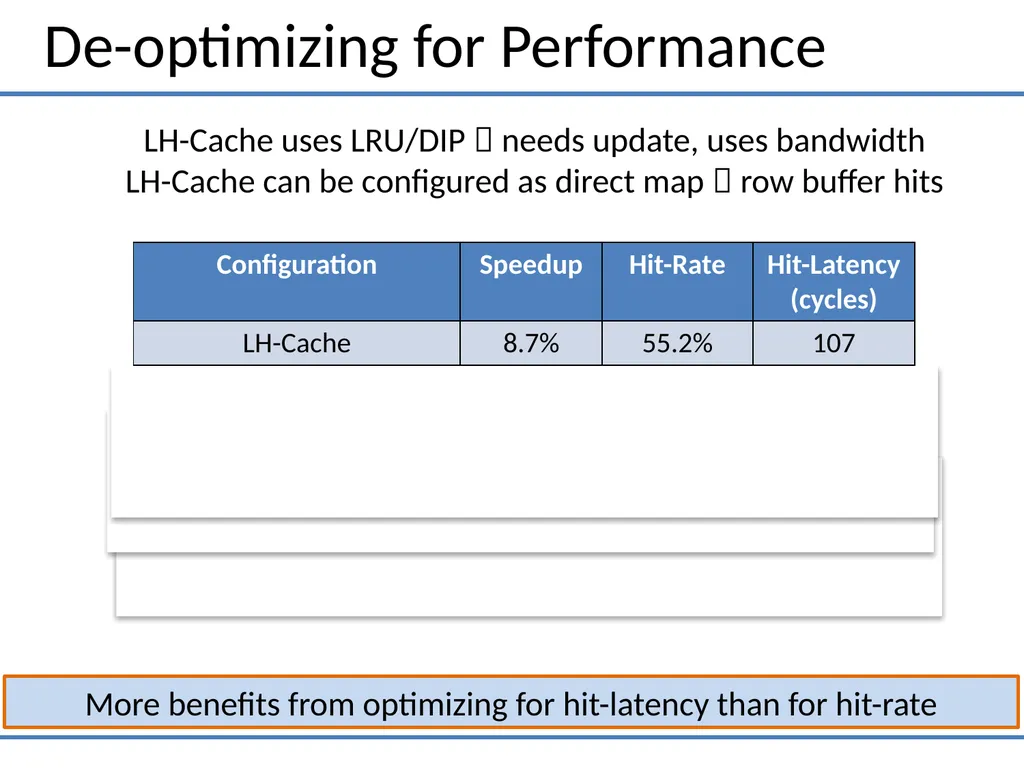
De-optimizing for Performance More benefits from optimizing for hit-latency than for hit-rate LH-Cache uses LRU/DIP needs update, uses bandwidth
LH-Cache can be configured as direct map row buffer hits<br>
14
Outline Introduction & Background
Insight: Optimize First for Latency
Proposal: Alloy Cache
Memory Access Prediction
Summary<br>
15
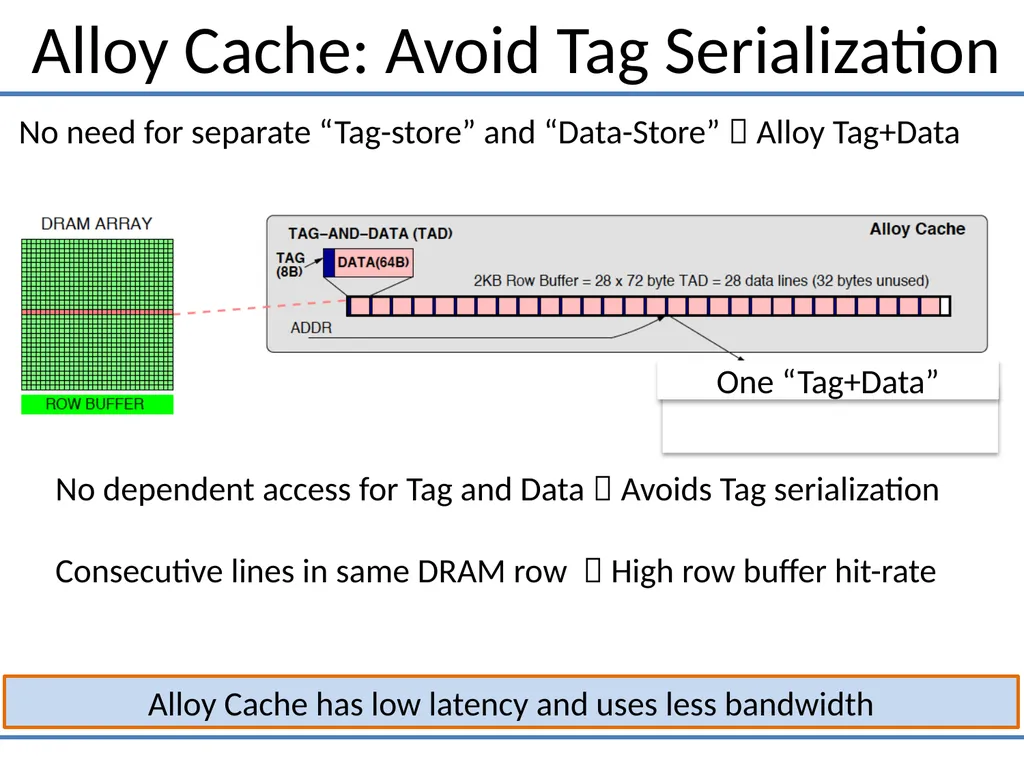
Alloy Cache: Avoid Tag Serialization Alloy Cache has low latency and uses less bandwidth No dependent access for Tag and Data Avoids Tag serialization
Consecutive lines in same DRAM row High row buffer hit-rate No need for separate “Tag-store” and “Data-Store” Alloy Tag+Data One “Tag+Data”<br>
16
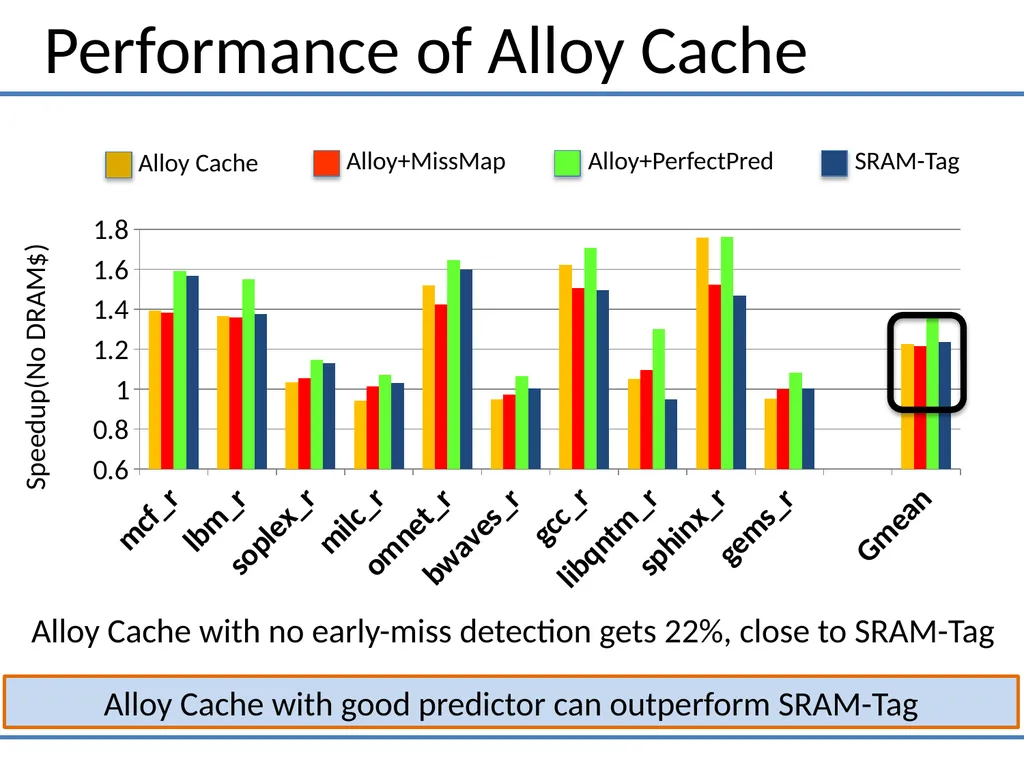
Performance of Alloy Cache Alloy Cache with good predictor can outperform SRAM-Tag Alloy+MissMap Alloy Cache Speedup(No DRAM$) Alloy Cache with no early-miss detection gets 22%, close to SRAM-Tag<br>
17
Outline Introduction & Background
Insight: Optimize First for Latency
Proposal: Alloy Cache
Memory Access Prediction
Summary<br>
18
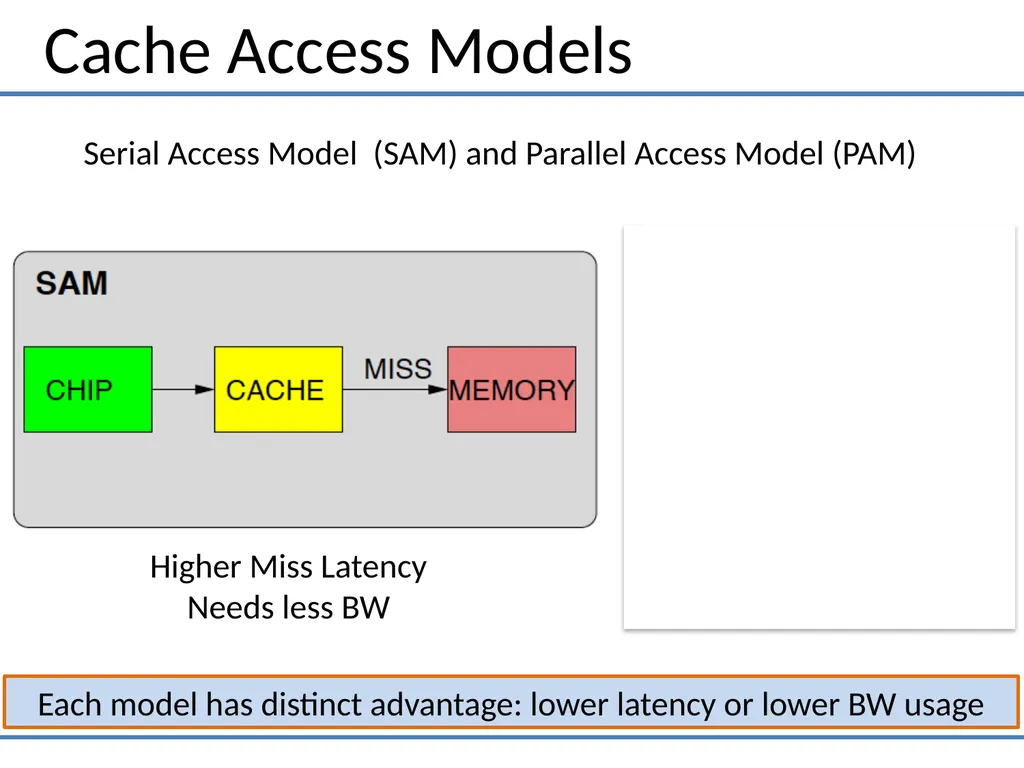
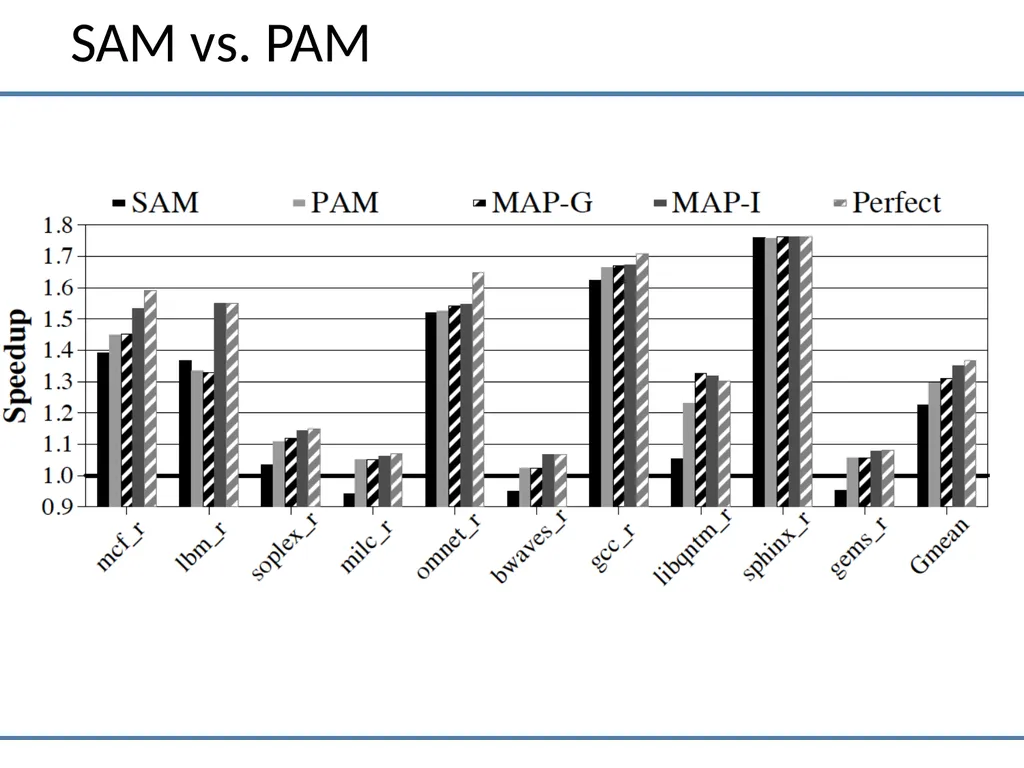
Cache Access Models Each model has distinct advantage: lower latency or lower BW usage Serial Access Model (SAM) and Parallel Access Model (PAM) Higher Miss Latency
Needs less BW Lower Miss Latency
Needs more BW<br>
19
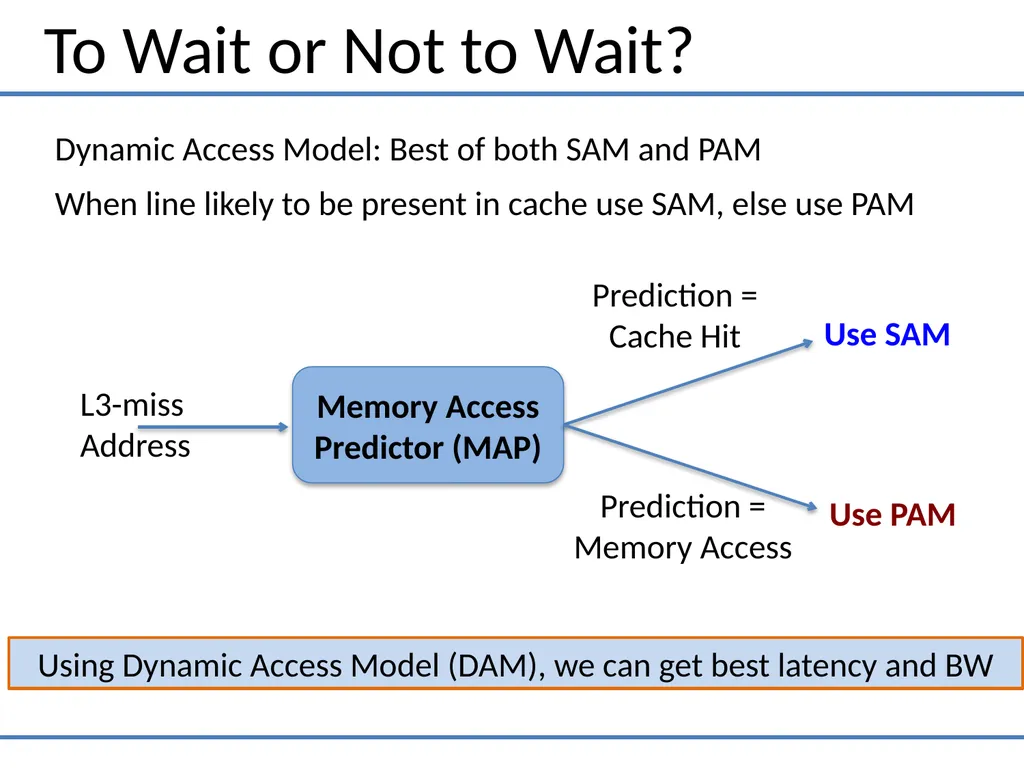
To Wait or Not to Wait? Using Dynamic Access Model (DAM), we can get best latency and BW Dynamic Access Model: Best of both SAM and PAM
When line likely to be present in cache use SAM, else use PAM Memory Access
Predictor (MAP) L3-miss
Address Prediction =
Cache Hit Prediction =
Memory Access Use PAM Use SAM<br>
20
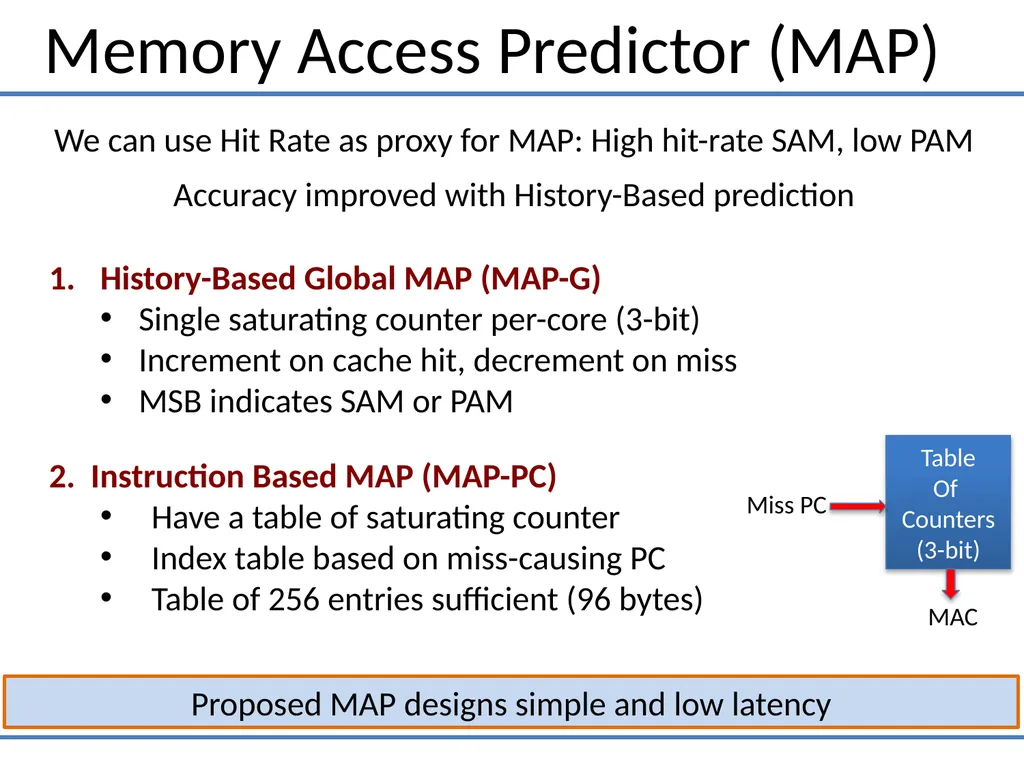
Memory Access Predictor (MAP) Proposed MAP designs simple and low latency We can use Hit Rate as proxy for MAP: High hit-rate SAM, low PAM
Accuracy improved with History-Based prediction History-Based Global MAP (MAP-G)
Single saturating counter per-core (3-bit)
Increment on cache hit, decrement on miss
MSB indicates SAM or PAM<br>
21
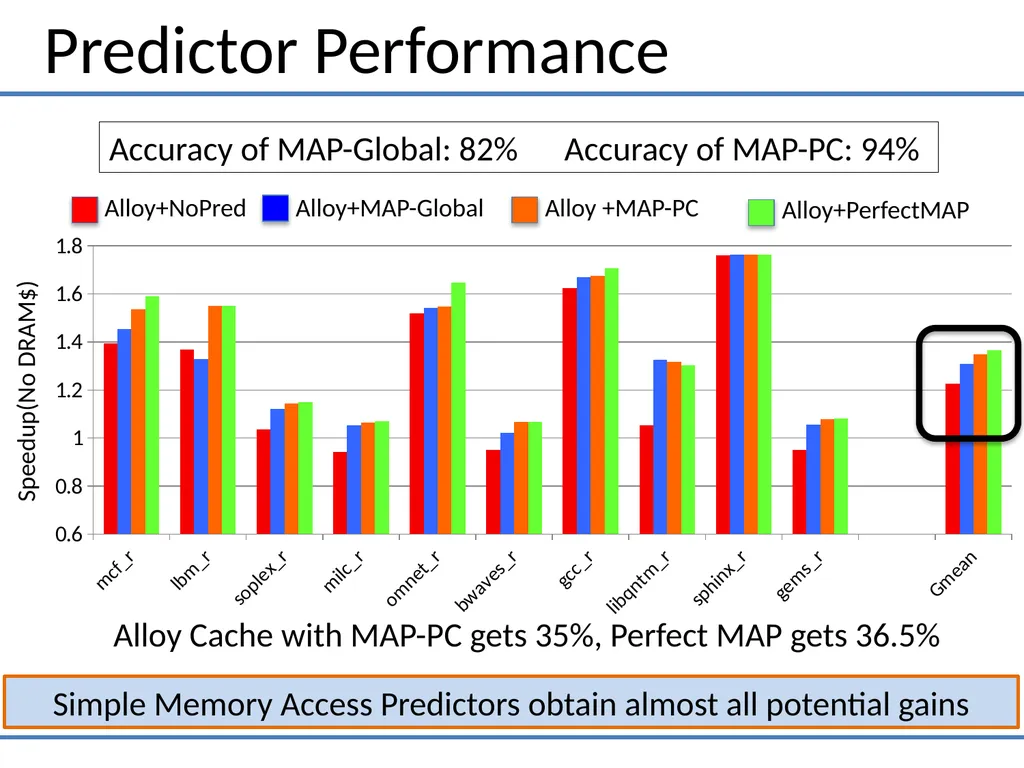
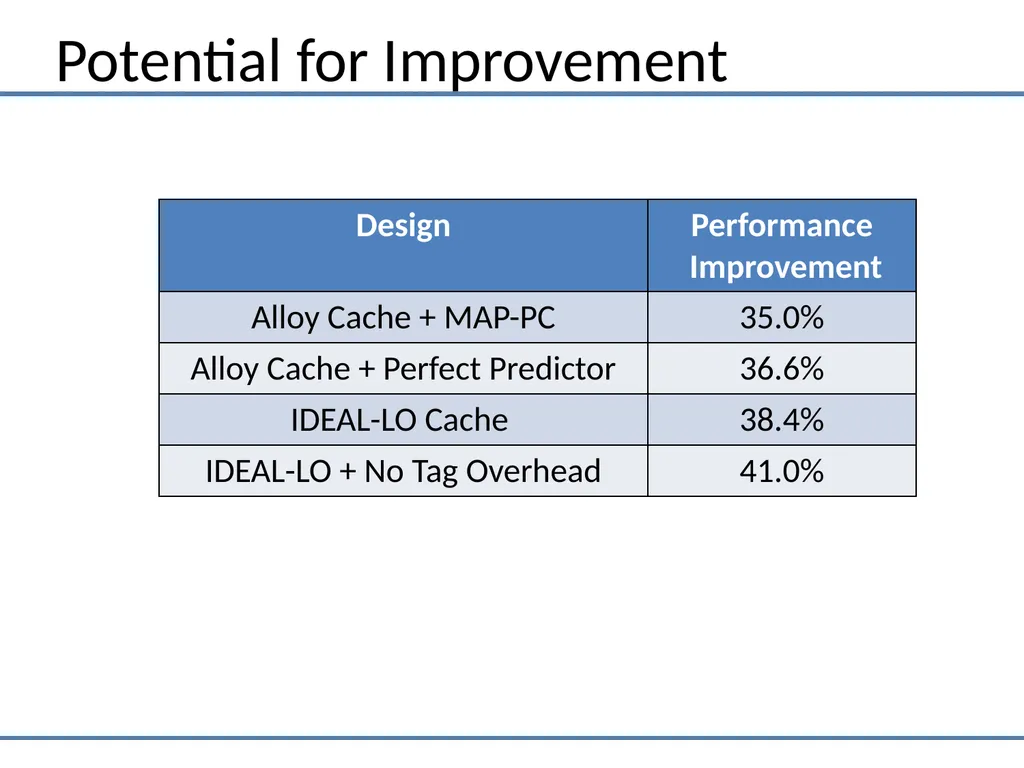
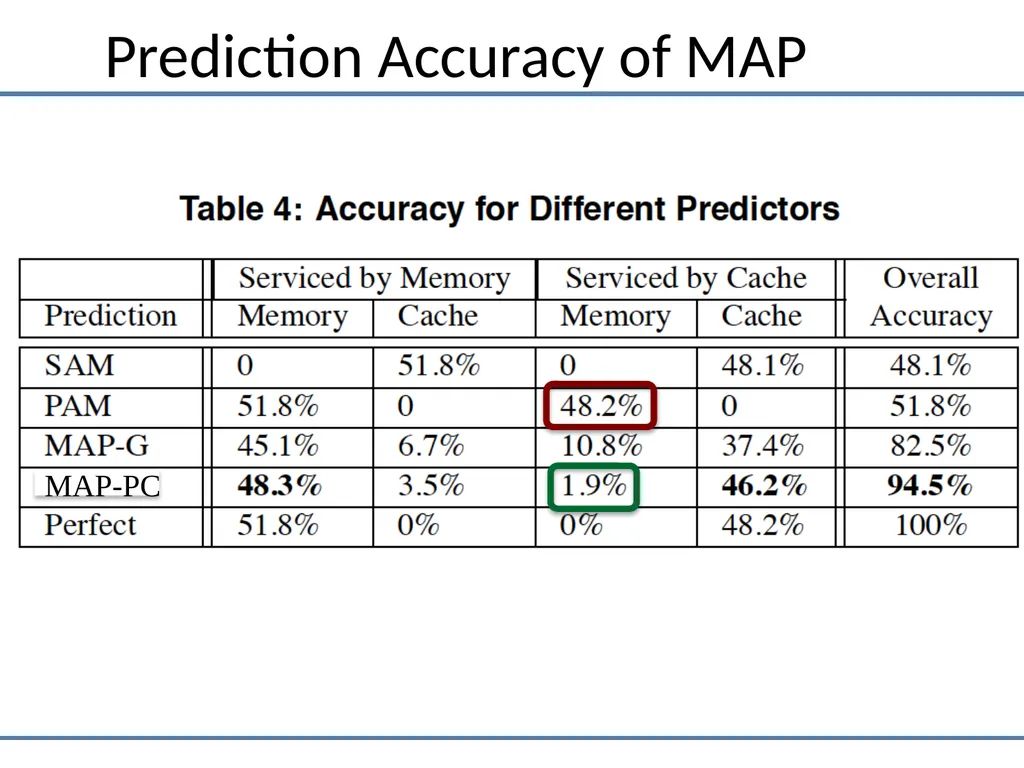
Predictor Performance Simple Memory Access Predictors obtain almost all potential gains Speedup(No DRAM$) Alloy+MAP-Global Alloy+NoPred Accuracy of MAP-Global: 82% Accuracy of MAP-PC: 94% Alloy Cache with MAP-PC gets 35%, Perfect MAP gets 36.5%<br>
22
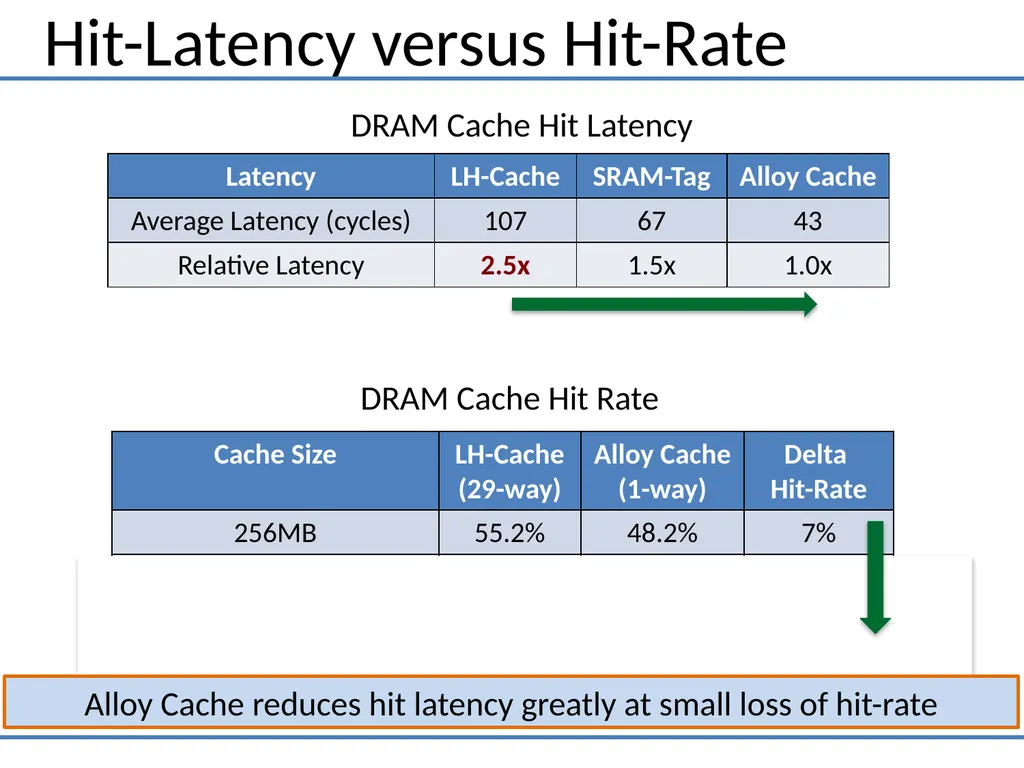
Hit-Latency versus Hit-Rate Alloy Cache Improves Hit Latency greatly at small loss of Hit Rate DRAM Cache Hit Rate Alloy Cache reduces hit latency greatly at small loss of hit-rate DRAM Cache Hit Latency<br>
23
Outline Introduction & Background
Insight: Optimize First for Latency
Proposal: Alloy Cache
Memory Access Prediction
Summary<br>
24
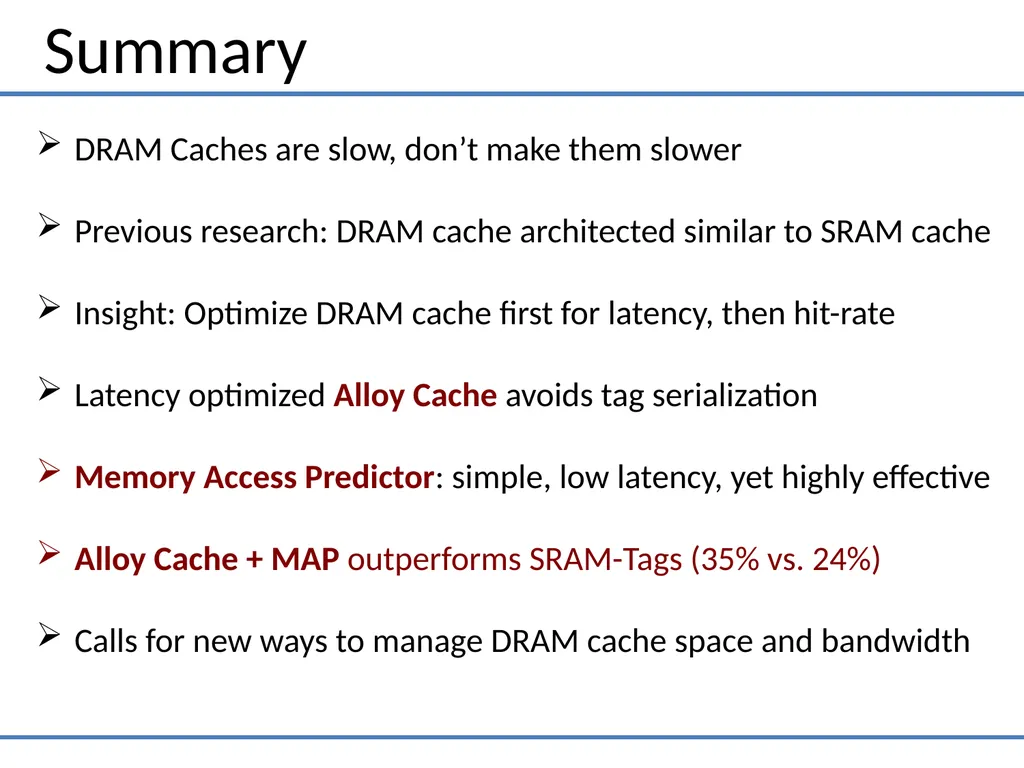
Summary DRAM Caches are slow, don’t make them slower
Previous research: DRAM cache architected similar to SRAM cache
Insight: Optimize DRAM cache first for latency, then hit-rate
Latency optimized Alloy Cache avoids tag serialization
Memory Access Predictor: simple, low latency, yet highly effective
Alloy Cache + MAP outperforms SRAM-Tags (35% vs. 24%)
Calls for new ways to manage DRAM cache space and bandwidth<br>
25
Questions Acknowledgement:
Work on “Memory Access Prediction” done while at IBM Research.
(Patent application filed Feb 2010, published Aug 2011)<br>
26
Potential for Improvement<br>
27
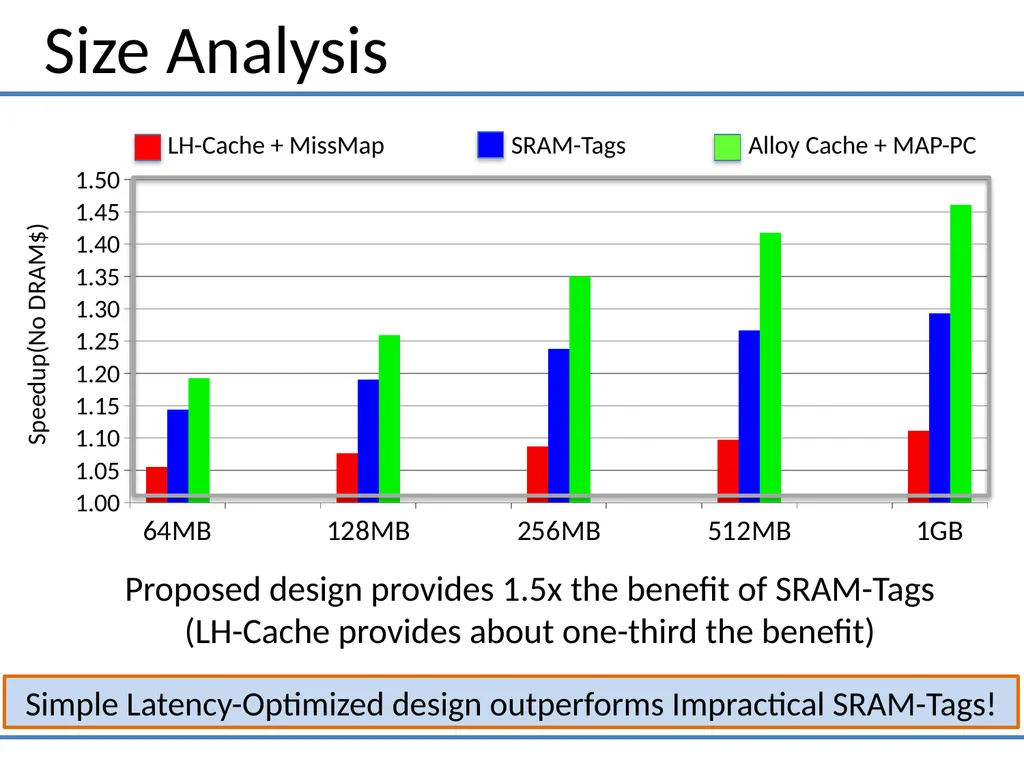
Size Analysis Simple Latency-Optimized design outperforms Impractical SRAM-Tags! SRAM-Tags LH-Cache + MissMap Proposed design provides 1.5x the benefit of SRAM-Tags
(LH-Cache provides about one-third the benefit) Speedup(No DRAM$)<br>
28
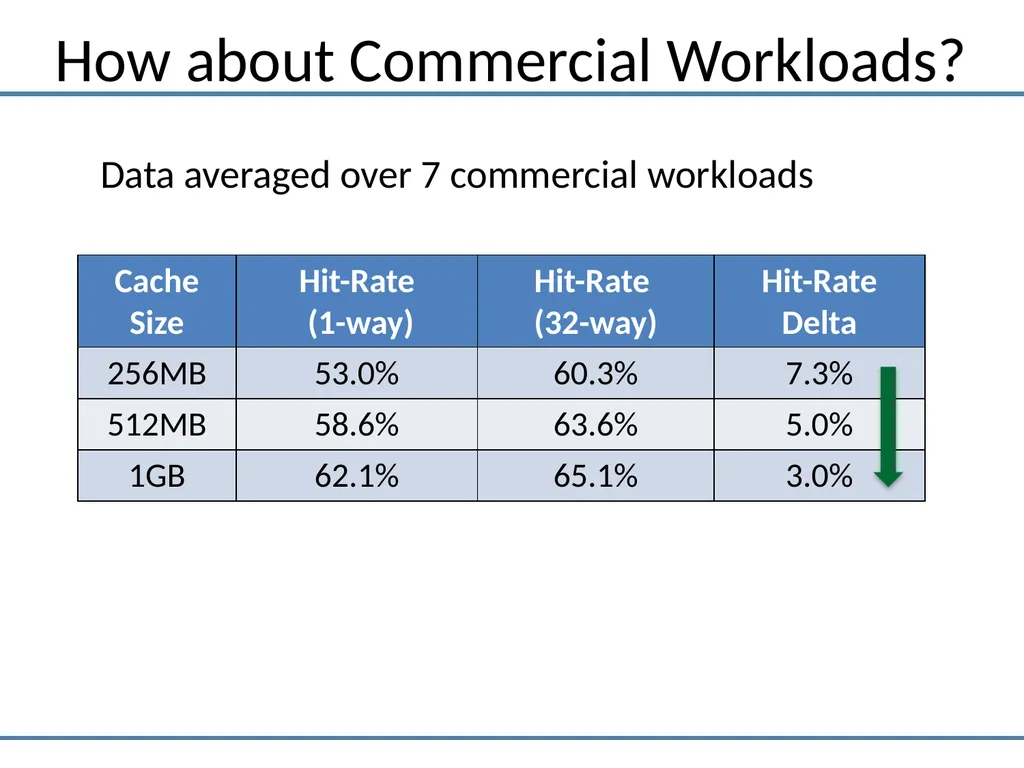
How about Commercial Workloads? Data averaged over 7 commercial workloads<br>
29
Prediction Accuracy of MAP MAP-PC<br>
30
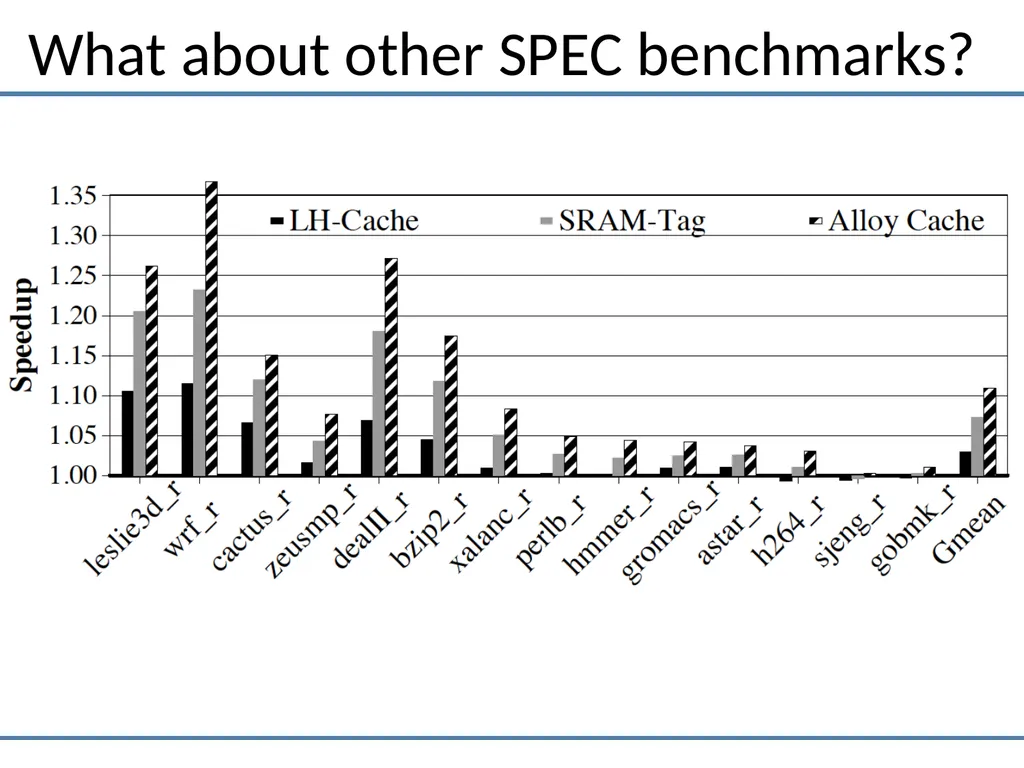
What about other SPEC benchmarks?<br>
31
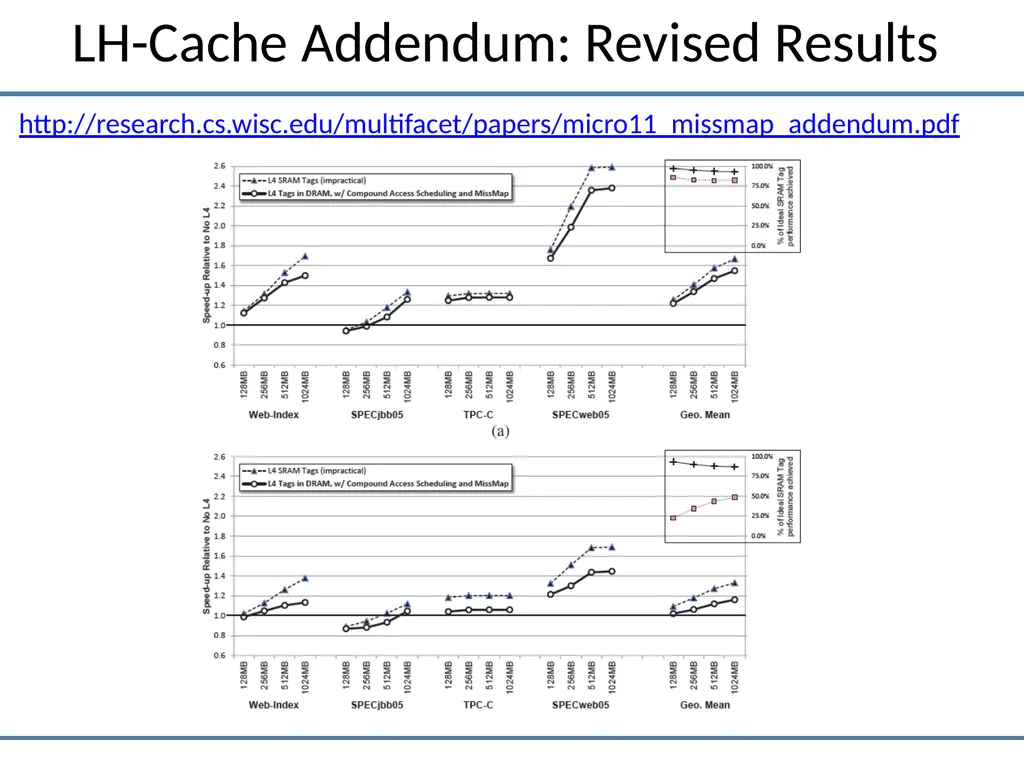
http://research.cs.wisc.edu/multifacet/papers/micro11_missmap_addendum.pdf LH-Cache Addendum: Revised Results<br>