
Multiple Vulnerabilities: The Effects of
MS
Published · 20 slides · 0 views
1 / 1

Description
Multiple Vulnerabilities: The Effects of Neighborhood Structural Changes upon Older Residents Mental Health and Perceptions of the Broader Community Session 90: Neighborhoods, Health, and Well-being in Later Life Population Association of
Related Topics
Share
Embed code
Download this presentation From Below
"Multiple Vulnerabilities: The Effects of" is the property of its rightful owner. Permission is granted to download and print the materials on this website for personal, non-commercial use only, and to display it on your personal computer provided you do not modify the materials and that you retain all copyright notices contained in the materials. By downloading content from our website, you accept the terms of this agreement.
Presentation Transcript
01
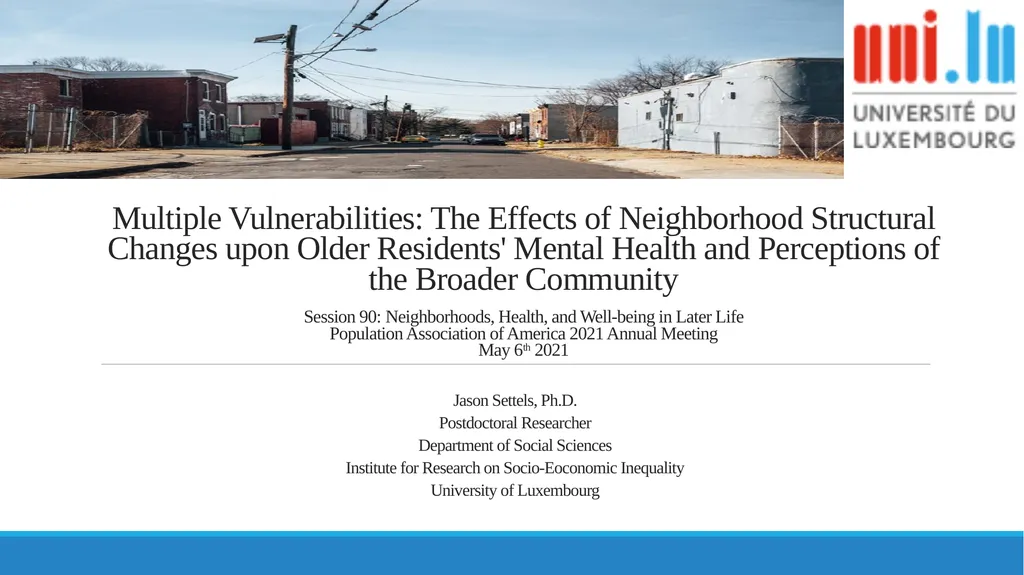
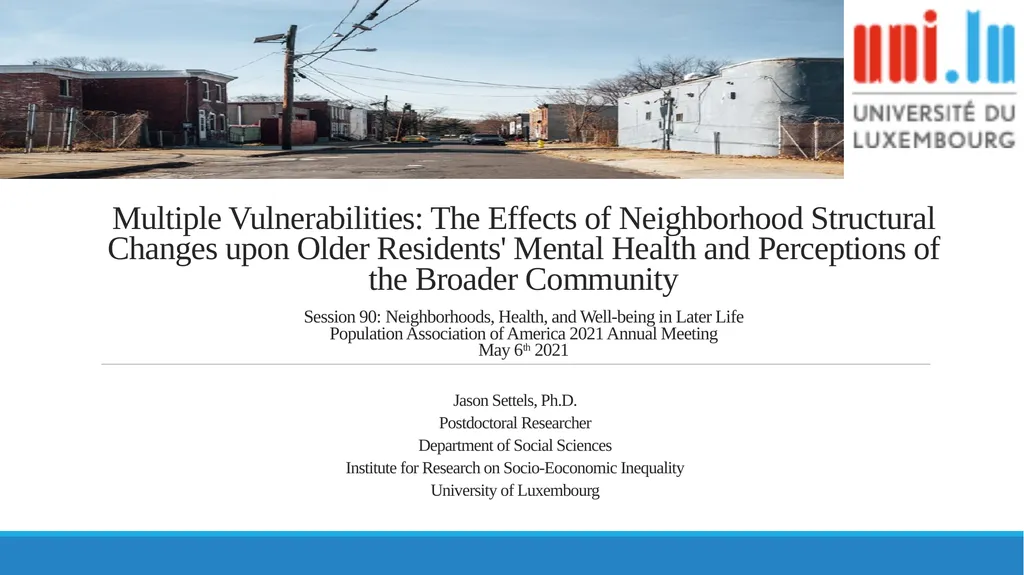
Multiple Vulnerabilities: The Effects of Neighborhood Structural Changes upon Older Residents' Mental Health and Perceptions of the Broader Community
Session 90: Neighborhoods, Health, and Well-being in Later Life
Population Association of America 2021 Annual Meeting
May 6th 2021 Jason Settels, Ph.D.
Postdoctoral Researcher Department of Social Sciences Institute for Research on Socio-Eoconomic Inequality University of Luxembourg<br>
Postdoctoral Researcher Department of Social Sciences Institute for Research on Socio-Eoconomic Inequality University of Luxembourg<br>
02
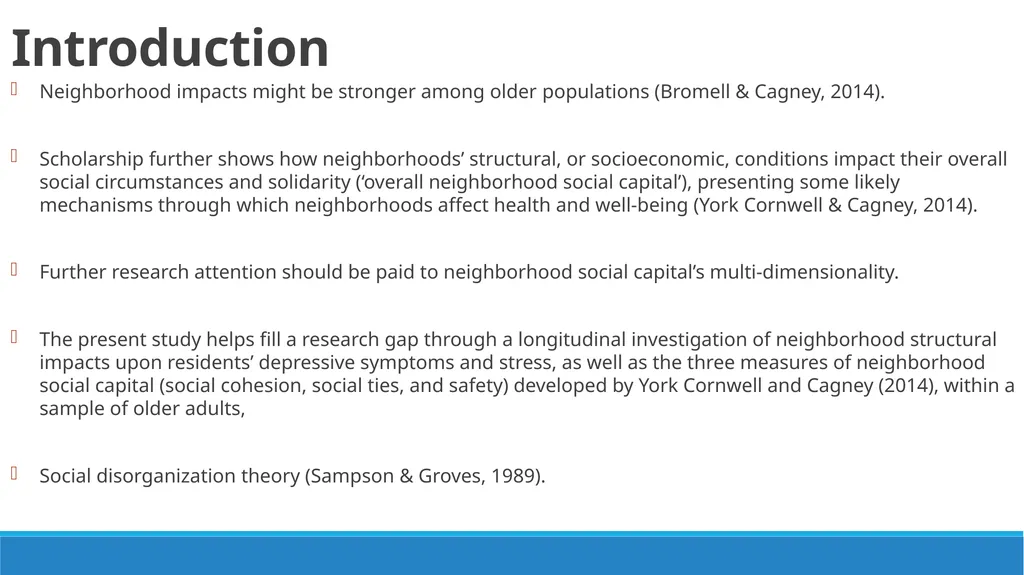
Introduction Neighborhood impacts might be stronger among older populations (Bromell & Cagney, 2014).
Scholarship further shows how neighborhoods’ structural, or socioeconomic, conditions impact their overall social circumstances and solidarity (‘overall neighborhood social capital’), presenting some likely mechanisms through which neighborhoods affect health and well-being (York Cornwell & Cagney, 2014).
Further research attention should be paid to neighborhood social capital’s multi-dimensionality.
The present study helps fill a research gap through a longitudinal investigation of neighborhood structural impacts upon residents’ depressive symptoms and stress, as well as the three measures of neighborhood social capital (social cohesion, social ties, and safety) developed by York Cornwell and Cagney (2014), within a sample of older adults,
Social disorganization theory (Sampson & Groves, 1989).<br>
Scholarship further shows how neighborhoods’ structural, or socioeconomic, conditions impact their overall social circumstances and solidarity (‘overall neighborhood social capital’), presenting some likely mechanisms through which neighborhoods affect health and well-being (York Cornwell & Cagney, 2014).
Further research attention should be paid to neighborhood social capital’s multi-dimensionality.
The present study helps fill a research gap through a longitudinal investigation of neighborhood structural impacts upon residents’ depressive symptoms and stress, as well as the three measures of neighborhood social capital (social cohesion, social ties, and safety) developed by York Cornwell and Cagney (2014), within a sample of older adults,
Social disorganization theory (Sampson & Groves, 1989).<br>
03
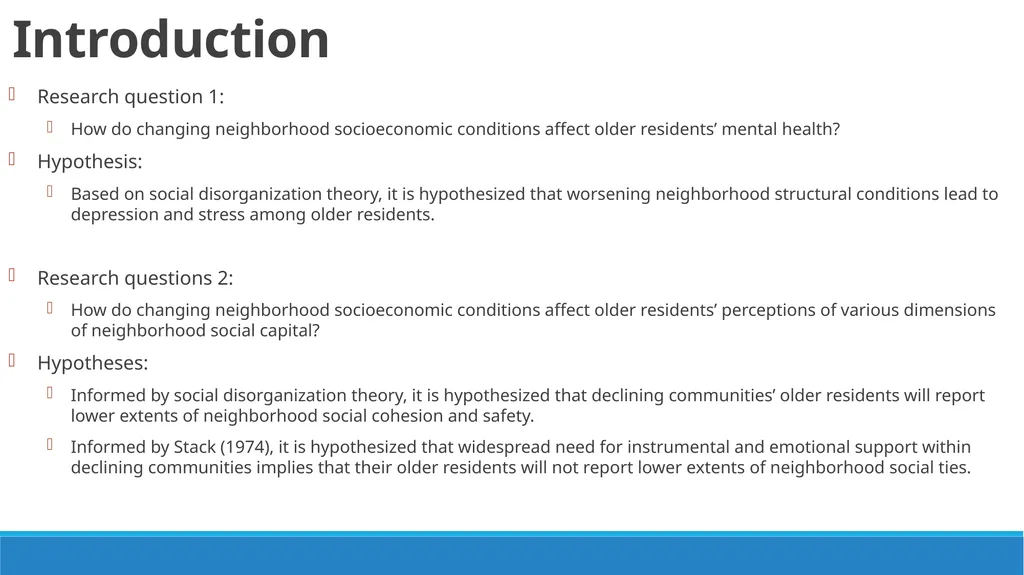
Introduction Research question 1:
How do changing neighborhood socioeconomic conditions affect older residents’ mental health?
Hypothesis:
Based on social disorganization theory, it is hypothesized that worsening neighborhood structural conditions lead to depression and stress among older residents.
Research questions 2:
How do changing neighborhood socioeconomic conditions affect older residents’ perceptions of various dimensions of neighborhood social capital?
Hypotheses:
Informed by social disorganization theory, it is hypothesized that declining communities’ older residents will report lower extents of neighborhood social cohesion and safety.
Informed by Stack (1974), it is hypothesized that widespread need for instrumental and emotional support within declining communities implies that their older residents will not report lower extents of neighborhood social ties.<br>
How do changing neighborhood socioeconomic conditions affect older residents’ mental health?
Hypothesis:
Based on social disorganization theory, it is hypothesized that worsening neighborhood structural conditions lead to depression and stress among older residents.
Research questions 2:
How do changing neighborhood socioeconomic conditions affect older residents’ perceptions of various dimensions of neighborhood social capital?
Hypotheses:
Informed by social disorganization theory, it is hypothesized that declining communities’ older residents will report lower extents of neighborhood social cohesion and safety.
Informed by Stack (1974), it is hypothesized that widespread need for instrumental and emotional support within declining communities implies that their older residents will not report lower extents of neighborhood social ties.<br>
04
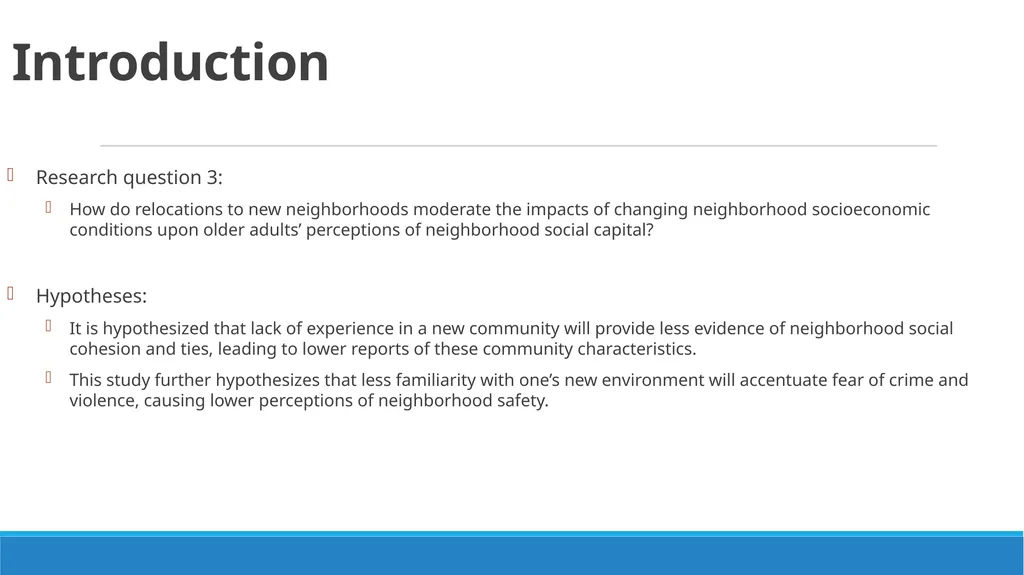
Introduction Research question 3:
How do relocations to new neighborhoods moderate the impacts of changing neighborhood socioeconomic conditions upon older adults’ perceptions of neighborhood social capital?
Hypotheses:
It is hypothesized that lack of experience in a new community will provide less evidence of neighborhood social cohesion and ties, leading to lower reports of these community characteristics.
This study further hypothesizes that less familiarity with one’s new environment will accentuate fear of crime and violence, causing lower perceptions of neighborhood safety.<br>
How do relocations to new neighborhoods moderate the impacts of changing neighborhood socioeconomic conditions upon older adults’ perceptions of neighborhood social capital?
Hypotheses:
It is hypothesized that lack of experience in a new community will provide less evidence of neighborhood social cohesion and ties, leading to lower reports of these community characteristics.
This study further hypothesizes that less familiarity with one’s new environment will accentuate fear of crime and violence, causing lower perceptions of neighborhood safety.<br>
05
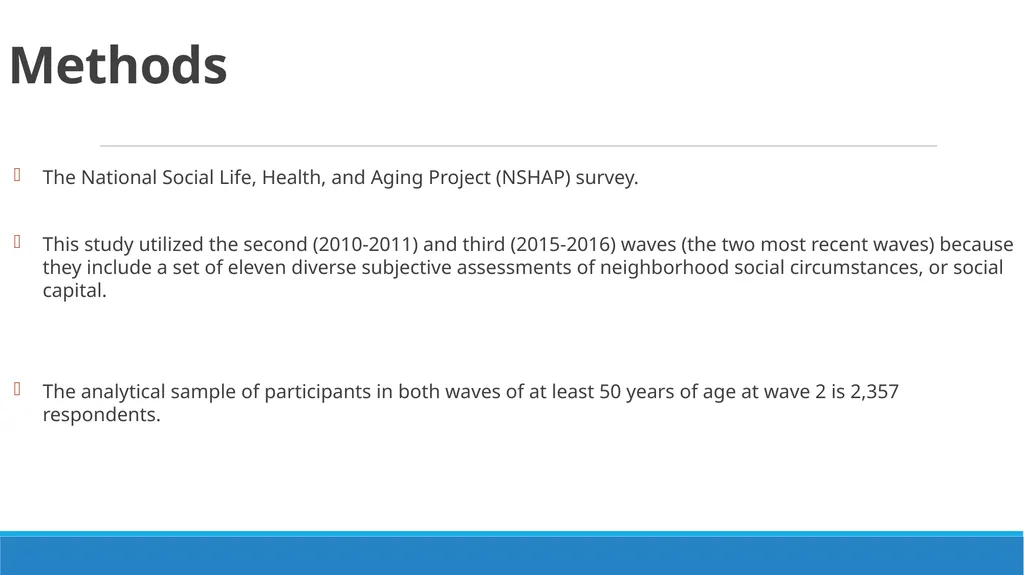
Methods The National Social Life, Health, and Aging Project (NSHAP) survey.
This study utilized the second (2010-2011) and third (2015-2016) waves (the two most recent waves) because they include a set of eleven diverse subjective assessments of neighborhood social circumstances, or social capital.
The analytical sample of participants in both waves of at least 50 years of age at wave 2 is 2,357 respondents.<br>
This study utilized the second (2010-2011) and third (2015-2016) waves (the two most recent waves) because they include a set of eleven diverse subjective assessments of neighborhood social circumstances, or social capital.
The analytical sample of participants in both waves of at least 50 years of age at wave 2 is 2,357 respondents.<br>
06
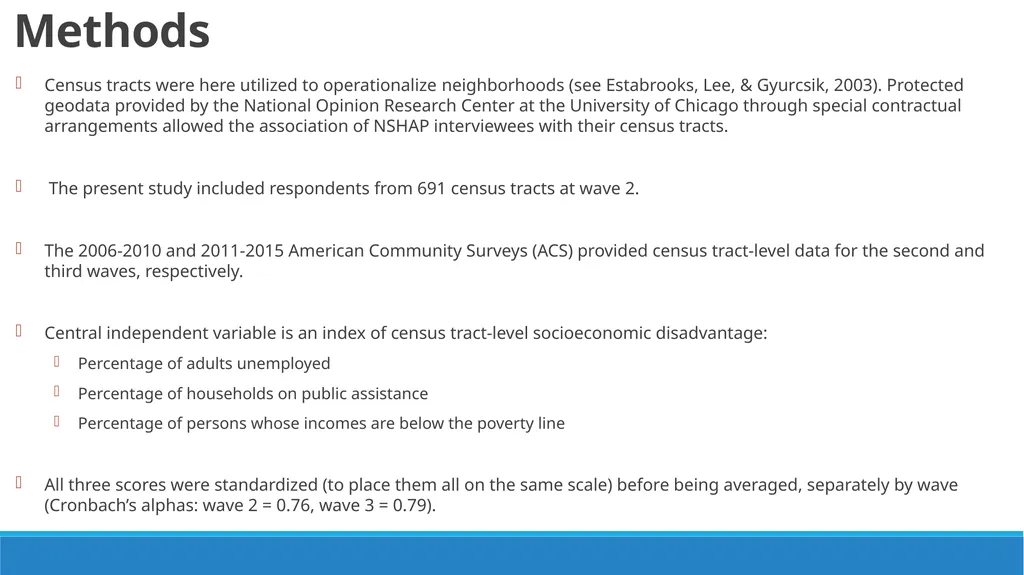
Methods Census tracts were here utilized to operationalize neighborhoods (see Estabrooks, Lee, & Gyurcsik, 2003). Protected geodata provided by the National Opinion Research Center at the University of Chicago through special contractual arrangements allowed the association of NSHAP interviewees with their census tracts.
The present study included respondents from 691 census tracts at wave 2.
The 2006-2010 and 2011-2015 American Community Surveys (ACS) provided census tract-level data for the second and third waves, respectively.
Central independent variable is an index of census tract-level socioeconomic disadvantage:
Percentage of adults unemployed
Percentage of households on public assistance
Percentage of persons whose incomes are below the poverty line
All three scores were standardized (to place them all on the same scale) before being averaged, separately by wave (Cronbach’s alphas: wave 2 = 0.76, wave 3 = 0.79).<br>
The present study included respondents from 691 census tracts at wave 2.
The 2006-2010 and 2011-2015 American Community Surveys (ACS) provided census tract-level data for the second and third waves, respectively.
Central independent variable is an index of census tract-level socioeconomic disadvantage:
Percentage of adults unemployed
Percentage of households on public assistance
Percentage of persons whose incomes are below the poverty line
All three scores were standardized (to place them all on the same scale) before being averaged, separately by wave (Cronbach’s alphas: wave 2 = 0.76, wave 3 = 0.79).<br>
07
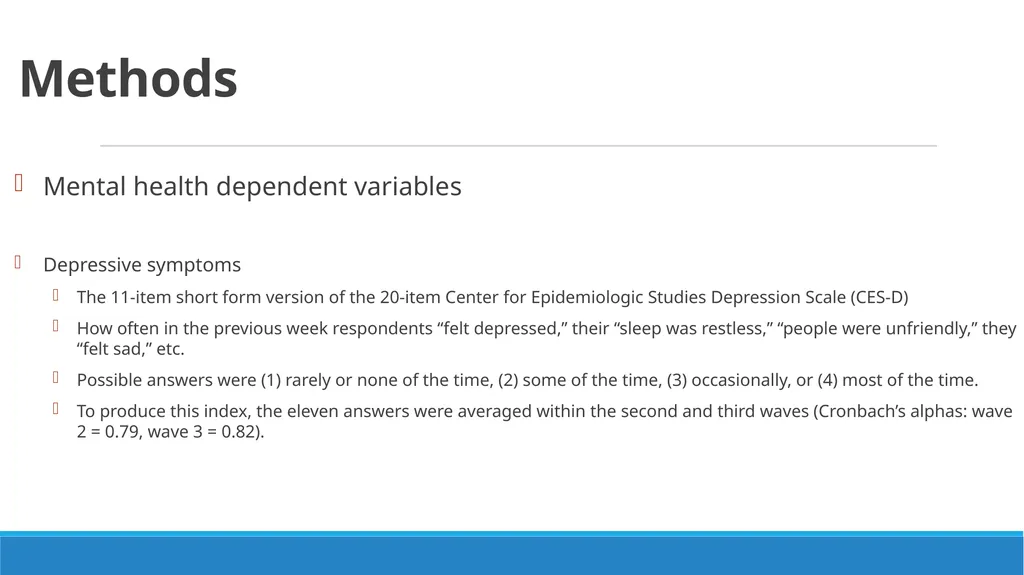
Methods Mental health dependent variables
Depressive symptoms
The 11-item short form version of the 20-item Center for Epidemiologic Studies Depression Scale (CES-D)
How often in the previous week respondents “felt depressed,” their “sleep was restless,” “people were unfriendly,” they “felt sad,” etc.
Possible answers were (1) rarely or none of the time, (2) some of the time, (3) occasionally, or (4) most of the time.
To produce this index, the eleven answers were averaged within the second and third waves (Cronbach’s alphas: wave 2 = 0.79, wave 3 = 0.82).<br>
Depressive symptoms
The 11-item short form version of the 20-item Center for Epidemiologic Studies Depression Scale (CES-D)
How often in the previous week respondents “felt depressed,” their “sleep was restless,” “people were unfriendly,” they “felt sad,” etc.
Possible answers were (1) rarely or none of the time, (2) some of the time, (3) occasionally, or (4) most of the time.
To produce this index, the eleven answers were averaged within the second and third waves (Cronbach’s alphas: wave 2 = 0.79, wave 3 = 0.82).<br>
08
Methods Stress
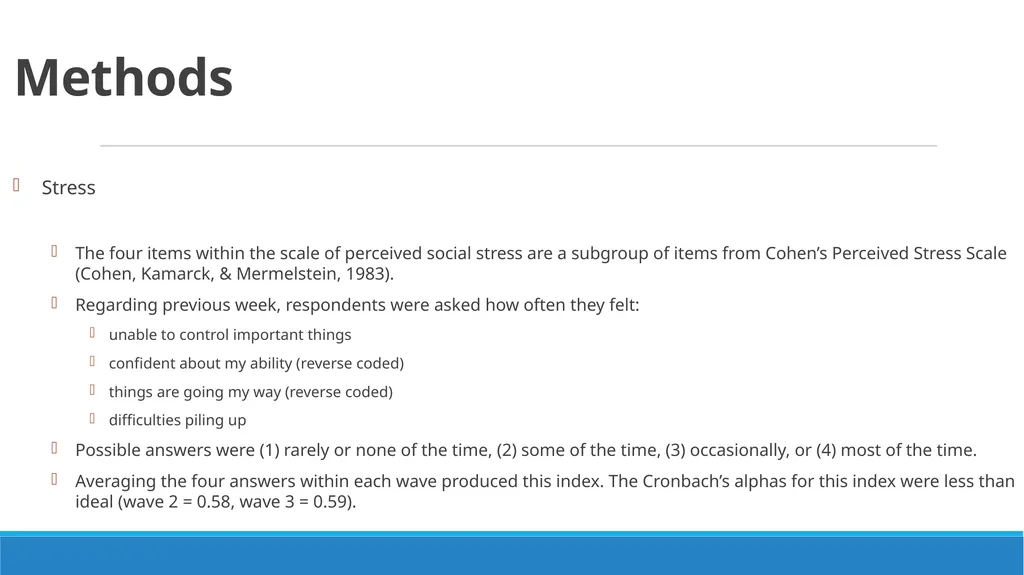
The four items within the scale of perceived social stress are a subgroup of items from Cohen’s Perceived Stress Scale (Cohen, Kamarck, & Mermelstein, 1983).
Regarding previous week, respondents were asked how often they felt:
unable to control important things
confident about my ability (reverse coded)
things are going my way (reverse coded)
difficulties piling up
Possible answers were (1) rarely or none of the time, (2) some of the time, (3) occasionally, or (4) most of the time.
Averaging the four answers within each wave produced this index. The Cronbach’s alphas for this index were less than ideal (wave 2 = 0.58, wave 3 = 0.59).<br>
The four items within the scale of perceived social stress are a subgroup of items from Cohen’s Perceived Stress Scale (Cohen, Kamarck, & Mermelstein, 1983).
Regarding previous week, respondents were asked how often they felt:
unable to control important things
confident about my ability (reverse coded)
things are going my way (reverse coded)
difficulties piling up
Possible answers were (1) rarely or none of the time, (2) some of the time, (3) occasionally, or (4) most of the time.
Averaging the four answers within each wave produced this index. The Cronbach’s alphas for this index were less than ideal (wave 2 = 0.58, wave 3 = 0.59).<br>
09
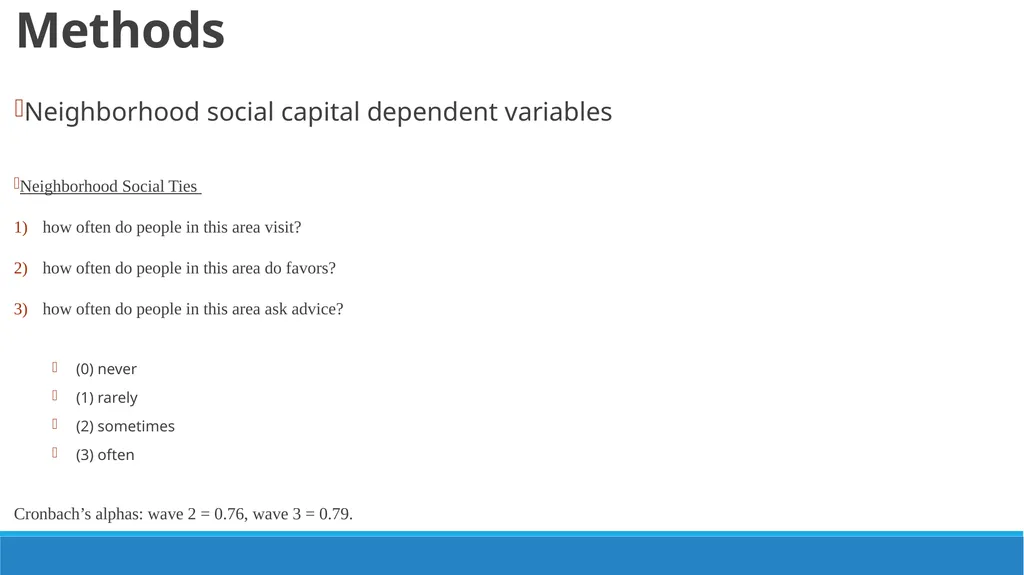
Methods Neighborhood Social Ties
how often do people in this area visit?
how often do people in this area do favors?
how often do people in this area ask advice?
(0) never
(1) rarely
(2) sometimes
(3) often
Cronbach’s alphas: wave 2 = 0.76, wave 3 = 0.79. Neighborhood social capital dependent variables<br>
how often do people in this area visit?
how often do people in this area do favors?
how often do people in this area ask advice?
(0) never
(1) rarely
(2) sometimes
(3) often
Cronbach’s alphas: wave 2 = 0.76, wave 3 = 0.79. Neighborhood social capital dependent variables<br>
10
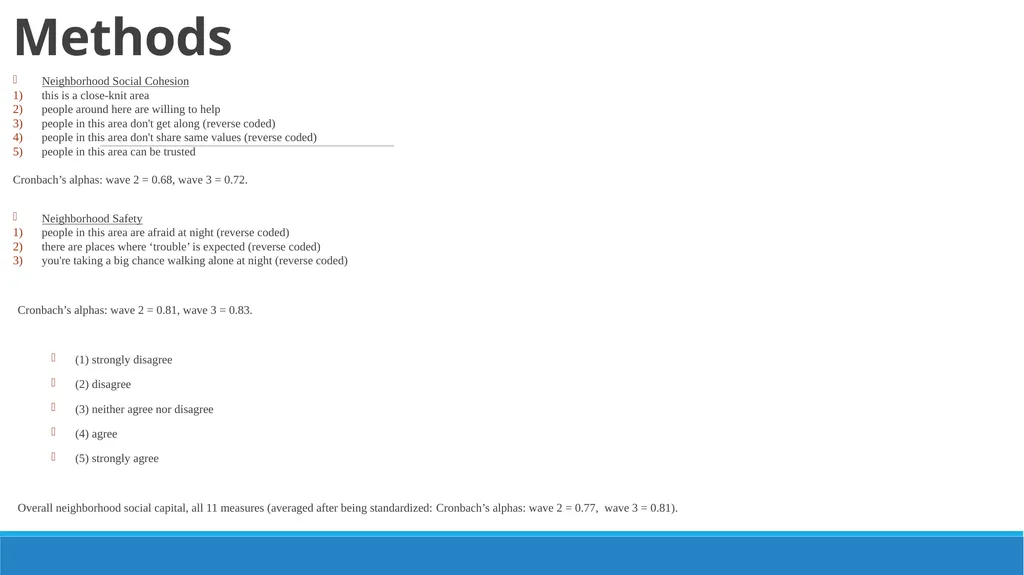
Methods Neighborhood Social Cohesion
this is a close-knit area
people around here are willing to help
people in this area don't get along (reverse coded)
people in this area don't share same values (reverse coded)
people in this area can be trusted
Cronbach’s alphas: wave 2 = 0.68, wave 3 = 0.72.
Neighborhood Safety
people in this area are afraid at night (reverse coded)
there are places where ‘trouble’ is expected (reverse coded)
you're taking a big chance walking alone at night (reverse coded)
Cronbach’s alphas: wave 2 = 0.81, wave 3 = 0.83.
(1) strongly disagree
(2) disagree
(3) neither agree nor disagree
(4) agree
(5) strongly agree
Overall neighborhood social capital, all 11 measures (averaged after being standardized: Cronbach’s alphas: wave 2 = 0.77, wave 3 = 0.81).<br>
this is a close-knit area
people around here are willing to help
people in this area don't get along (reverse coded)
people in this area don't share same values (reverse coded)
people in this area can be trusted
Cronbach’s alphas: wave 2 = 0.68, wave 3 = 0.72.
Neighborhood Safety
people in this area are afraid at night (reverse coded)
there are places where ‘trouble’ is expected (reverse coded)
you're taking a big chance walking alone at night (reverse coded)
Cronbach’s alphas: wave 2 = 0.81, wave 3 = 0.83.
(1) strongly disagree
(2) disagree
(3) neither agree nor disagree
(4) agree
(5) strongly agree
Overall neighborhood social capital, all 11 measures (averaged after being standardized: Cronbach’s alphas: wave 2 = 0.77, wave 3 = 0.81).<br>
11
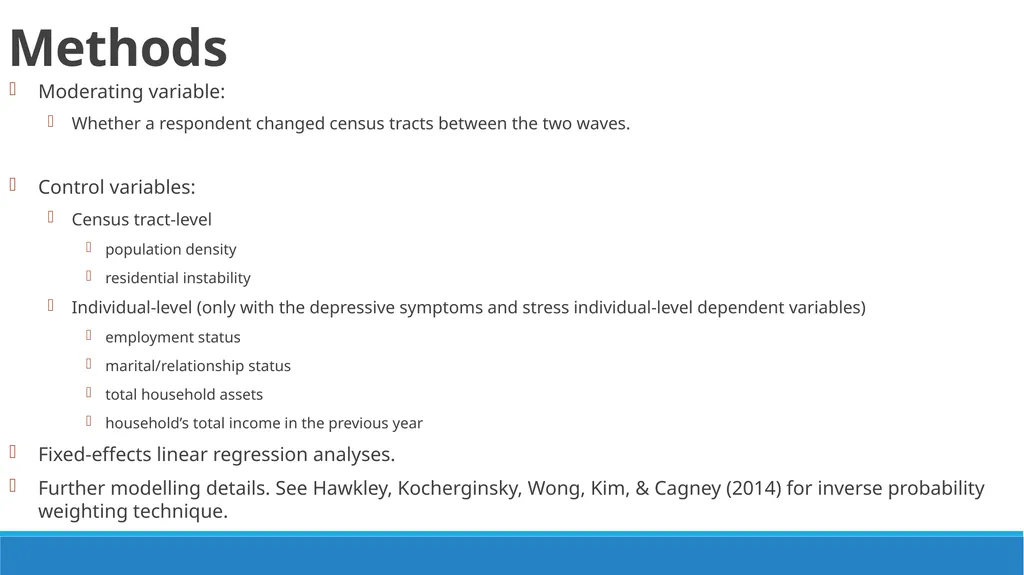
Methods Moderating variable:
Whether a respondent changed census tracts between the two waves.
Control variables:
Census tract-level
population density
residential instability
Individual-level (only with the depressive symptoms and stress individual-level dependent variables)
employment status
marital/relationship status
total household assets
household’s total income in the previous year
Fixed-effects linear regression analyses.
Further modelling details. See Hawkley, Kocherginsky, Wong, Kim, & Cagney (2014) for inverse probability weighting technique.<br>
Whether a respondent changed census tracts between the two waves.
Control variables:
Census tract-level
population density
residential instability
Individual-level (only with the depressive symptoms and stress individual-level dependent variables)
employment status
marital/relationship status
total household assets
household’s total income in the previous year
Fixed-effects linear regression analyses.
Further modelling details. See Hawkley, Kocherginsky, Wong, Kim, & Cagney (2014) for inverse probability weighting technique.<br>
12
Results<br>
13
Results<br>
14
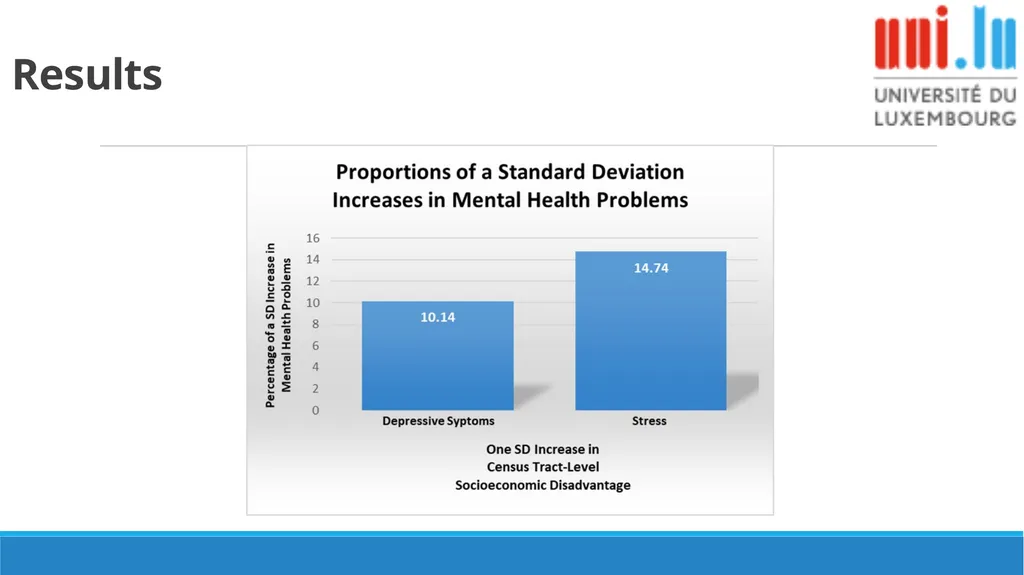
Discussion This study encourages explorations of the effects of contexts across the entire life course.
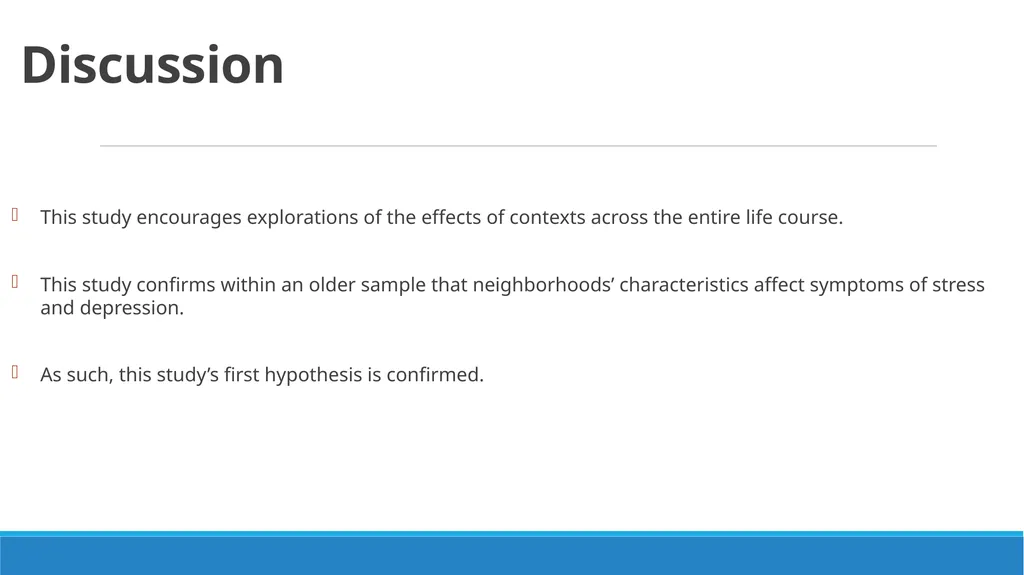
This study confirms within an older sample that neighborhoods’ characteristics affect symptoms of stress and depression.
As such, this study’s first hypothesis is confirmed.<br>
This study confirms within an older sample that neighborhoods’ characteristics affect symptoms of stress and depression.
As such, this study’s first hypothesis is confirmed.<br>
15
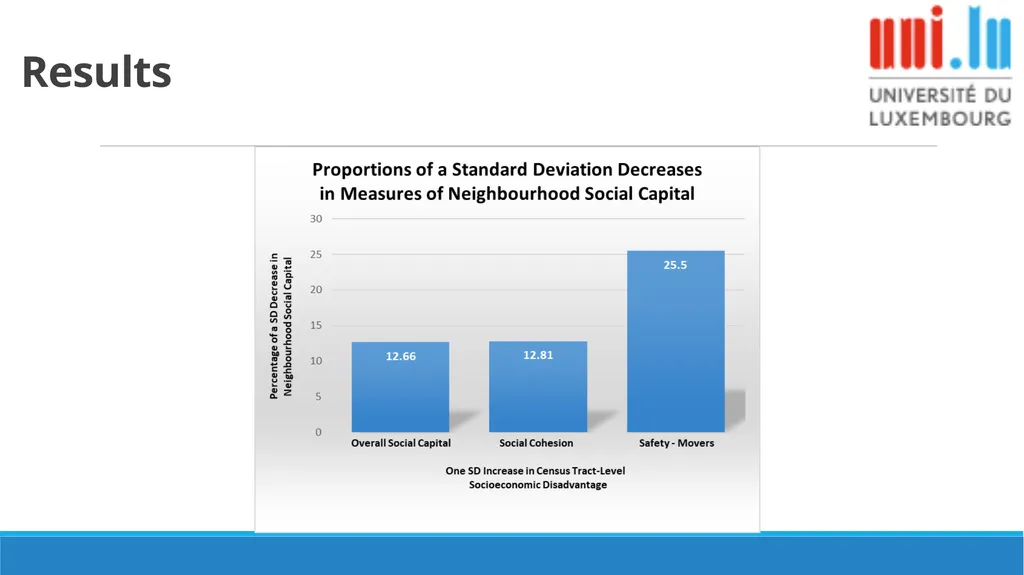
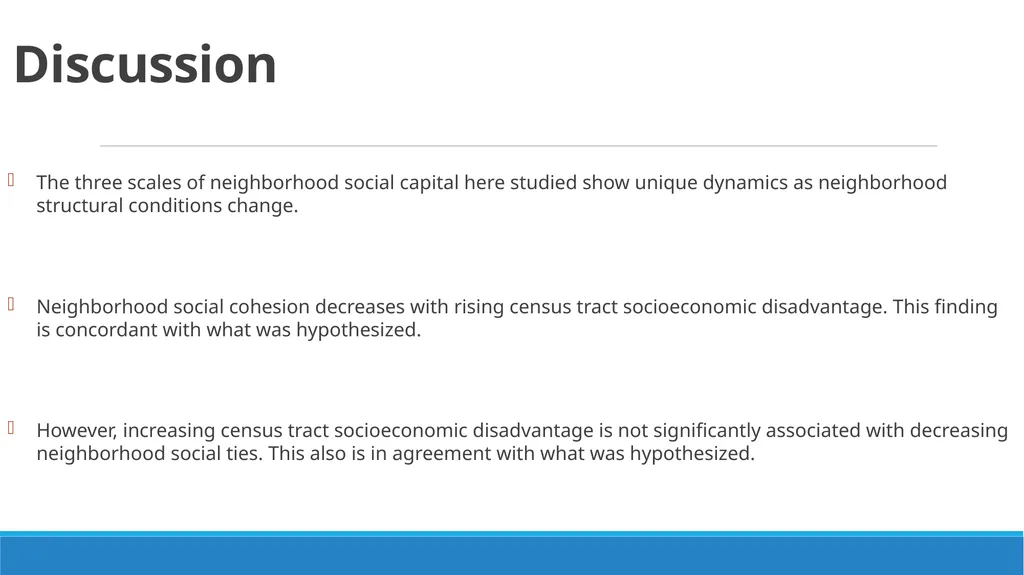
Discussion The three scales of neighborhood social capital here studied show unique dynamics as neighborhood structural conditions change.
Neighborhood social cohesion decreases with rising census tract socioeconomic disadvantage. This finding is concordant with what was hypothesized.
However, increasing census tract socioeconomic disadvantage is not significantly associated with decreasing neighborhood social ties. This also is in agreement with what was hypothesized.<br>
Neighborhood social cohesion decreases with rising census tract socioeconomic disadvantage. This finding is concordant with what was hypothesized.
However, increasing census tract socioeconomic disadvantage is not significantly associated with decreasing neighborhood social ties. This also is in agreement with what was hypothesized.<br>
16
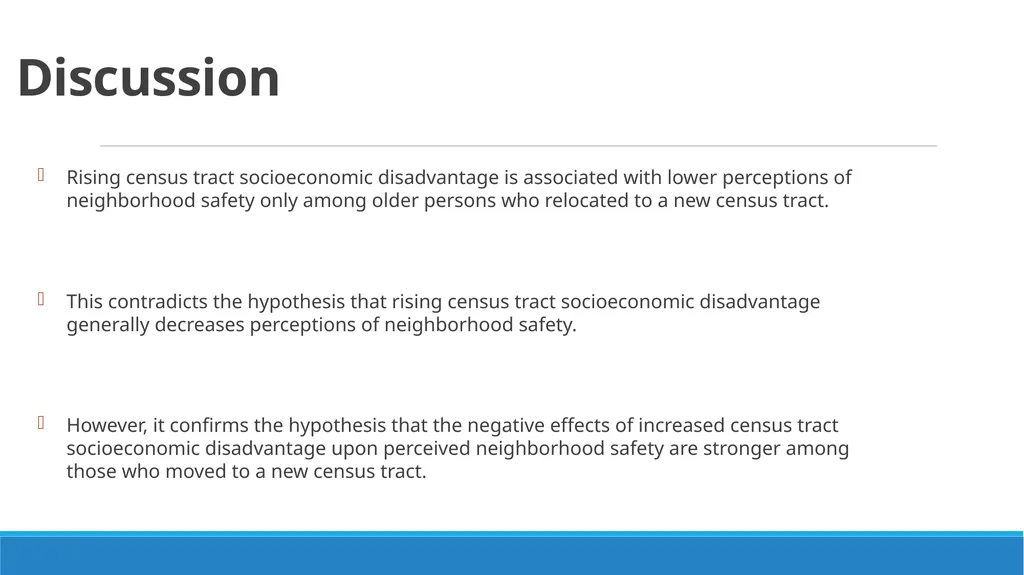
Discussion Rising census tract socioeconomic disadvantage is associated with lower perceptions of neighborhood safety only among older persons who relocated to a new census tract.
This contradicts the hypothesis that rising census tract socioeconomic disadvantage generally decreases perceptions of neighborhood safety.
However, it confirms the hypothesis that the negative effects of increased census tract socioeconomic disadvantage upon perceived neighborhood safety are stronger among those who moved to a new census tract.<br>
This contradicts the hypothesis that rising census tract socioeconomic disadvantage generally decreases perceptions of neighborhood safety.
However, it confirms the hypothesis that the negative effects of increased census tract socioeconomic disadvantage upon perceived neighborhood safety are stronger among those who moved to a new census tract.<br>
17
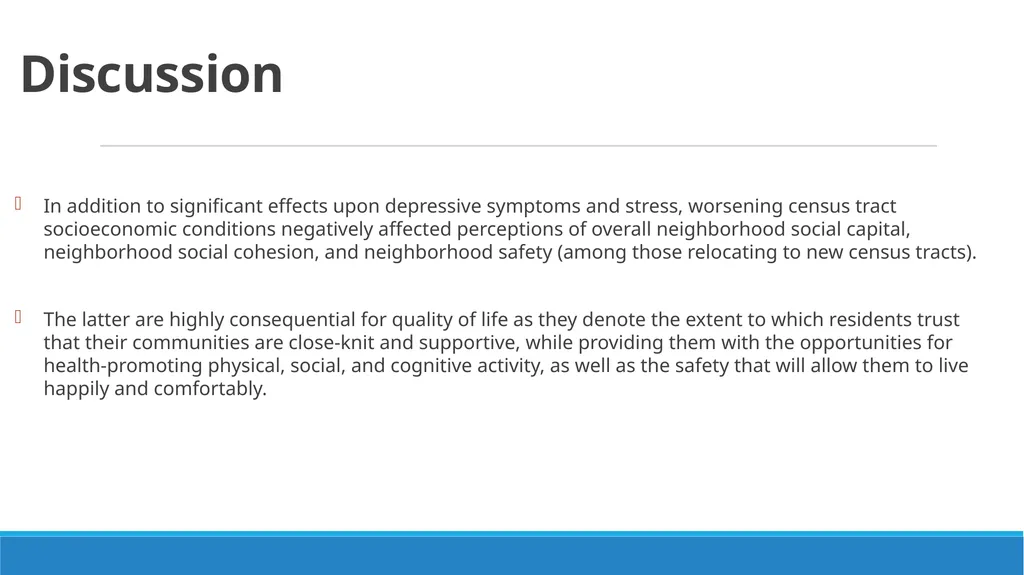
Discussion In addition to significant effects upon depressive symptoms and stress, worsening census tract socioeconomic conditions negatively affected perceptions of overall neighborhood social capital, neighborhood social cohesion, and neighborhood safety (among those relocating to new census tracts).
The latter are highly consequential for quality of life as they denote the extent to which residents trust that their communities are close-knit and supportive, while providing them with the opportunities for health-promoting physical, social, and cognitive activity, as well as the safety that will allow them to live happily and comfortably.<br>
The latter are highly consequential for quality of life as they denote the extent to which residents trust that their communities are close-knit and supportive, while providing them with the opportunities for health-promoting physical, social, and cognitive activity, as well as the safety that will allow them to live happily and comfortably.<br>
18
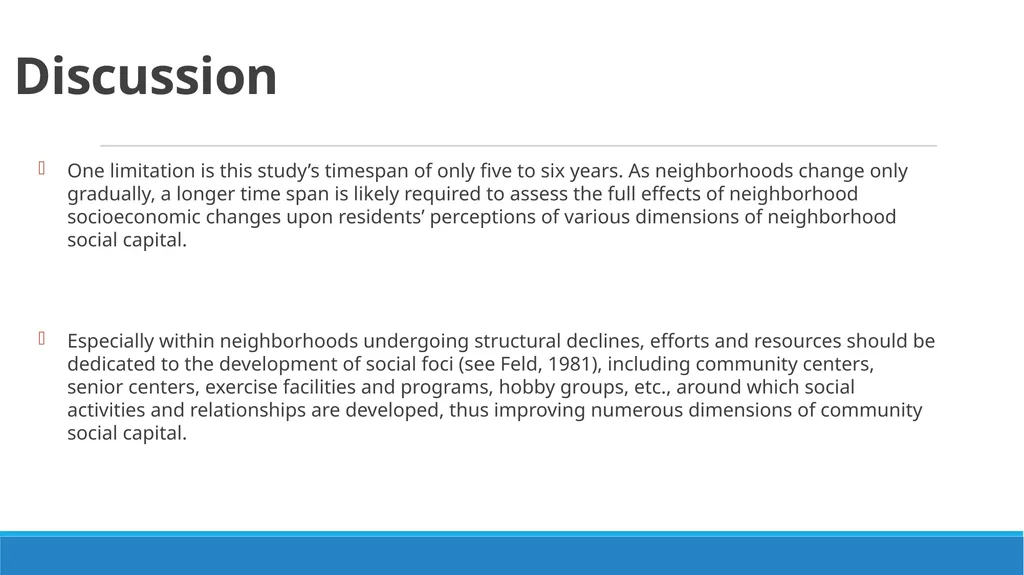
Discussion One limitation is this study’s timespan of only five to six years. As neighborhoods change only gradually, a longer time span is likely required to assess the full effects of neighborhood socioeconomic changes upon residents’ perceptions of various dimensions of neighborhood social capital.
Especially within neighborhoods undergoing structural declines, efforts and resources should be dedicated to the development of social foci (see Feld, 1981), including community centers, senior centers, exercise facilities and programs, hobby groups, etc., around which social activities and relationships are developed, thus improving numerous dimensions of community social capital.<br>
Especially within neighborhoods undergoing structural declines, efforts and resources should be dedicated to the development of social foci (see Feld, 1981), including community centers, senior centers, exercise facilities and programs, hobby groups, etc., around which social activities and relationships are developed, thus improving numerous dimensions of community social capital.<br>
19
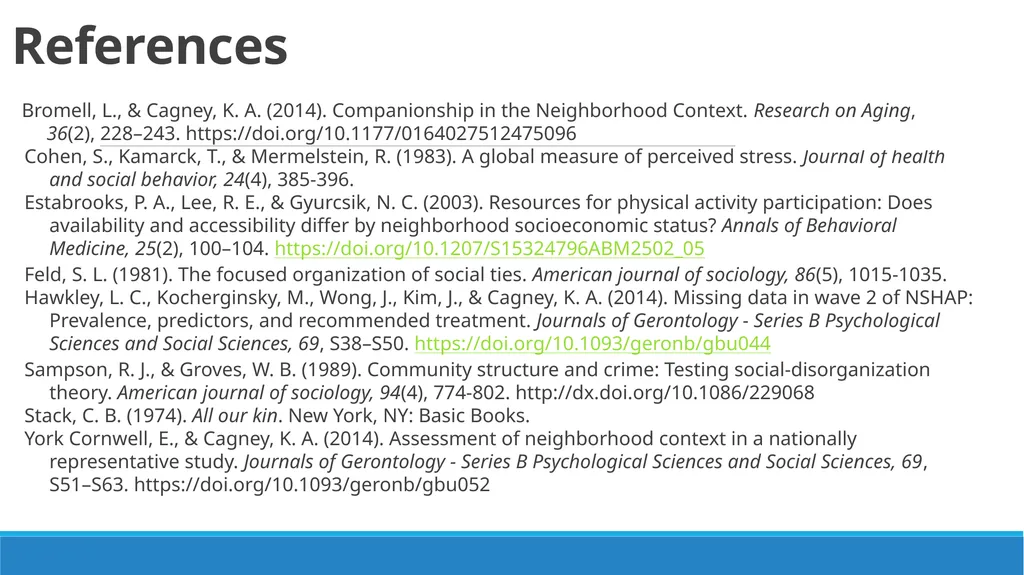
References Bromell, L., & Cagney, K. A. (2014). Companionship in the Neighborhood Context. Research on Aging,
36(2), 228–243. https://doi.org/10.1177/0164027512475096
Cohen, S., Kamarck, T., & Mermelstein, R. (1983). A global measure of perceived stress. Journal of health
and social behavior, 24(4), 385-396.
Estabrooks, P. A., Lee, R. E., & Gyurcsik, N. C. (2003). Resources for physical activity participation: Does
availability and accessibility differ by neighborhood socioeconomic status? Annals of Behavioral
Medicine, 25(2), 100–104. https://doi.org/10.1207/S15324796ABM2502_05
Feld, S. L. (1981). The focused organization of social ties. American journal of sociology, 86(5), 1015-1035.
Hawkley, L. C., Kocherginsky, M., Wong, J., Kim, J., & Cagney, K. A. (2014). Missing data in wave 2 of NSHAP:
Prevalence, predictors, and recommended treatment. Journals of Gerontology - Series B Psychological
Sciences and Social Sciences, 69, S38–S50. https://doi.org/10.1093/geronb/gbu044
Sampson, R. J., & Groves, W. B. (1989). Community structure and crime: Testing social-disorganization
theory. American journal of sociology, 94(4), 774-802. http://dx.doi.org/10.1086/229068
Stack, C. B. (1974). All our kin. New York, NY: Basic Books.
York Cornwell, E., & Cagney, K. A. (2014). Assessment of neighborhood context in a nationally
representative study. Journals of Gerontology - Series B Psychological Sciences and Social Sciences, 69,
S51–S63. https://doi.org/10.1093/geronb/gbu052<br>
36(2), 228–243. https://doi.org/10.1177/0164027512475096
Cohen, S., Kamarck, T., & Mermelstein, R. (1983). A global measure of perceived stress. Journal of health
and social behavior, 24(4), 385-396.
Estabrooks, P. A., Lee, R. E., & Gyurcsik, N. C. (2003). Resources for physical activity participation: Does
availability and accessibility differ by neighborhood socioeconomic status? Annals of Behavioral
Medicine, 25(2), 100–104. https://doi.org/10.1207/S15324796ABM2502_05
Feld, S. L. (1981). The focused organization of social ties. American journal of sociology, 86(5), 1015-1035.
Hawkley, L. C., Kocherginsky, M., Wong, J., Kim, J., & Cagney, K. A. (2014). Missing data in wave 2 of NSHAP:
Prevalence, predictors, and recommended treatment. Journals of Gerontology - Series B Psychological
Sciences and Social Sciences, 69, S38–S50. https://doi.org/10.1093/geronb/gbu044
Sampson, R. J., & Groves, W. B. (1989). Community structure and crime: Testing social-disorganization
theory. American journal of sociology, 94(4), 774-802. http://dx.doi.org/10.1086/229068
Stack, C. B. (1974). All our kin. New York, NY: Basic Books.
York Cornwell, E., & Cagney, K. A. (2014). Assessment of neighborhood context in a nationally
representative study. Journals of Gerontology - Series B Psychological Sciences and Social Sciences, 69,
S51–S63. https://doi.org/10.1093/geronb/gbu052<br>
20
Thank you!
jason.settels@uni.lu<br>
jason.settels@uni.lu<br>