04
August Grape Inquiry Information Sheet on NDC Website –HERE.pdf
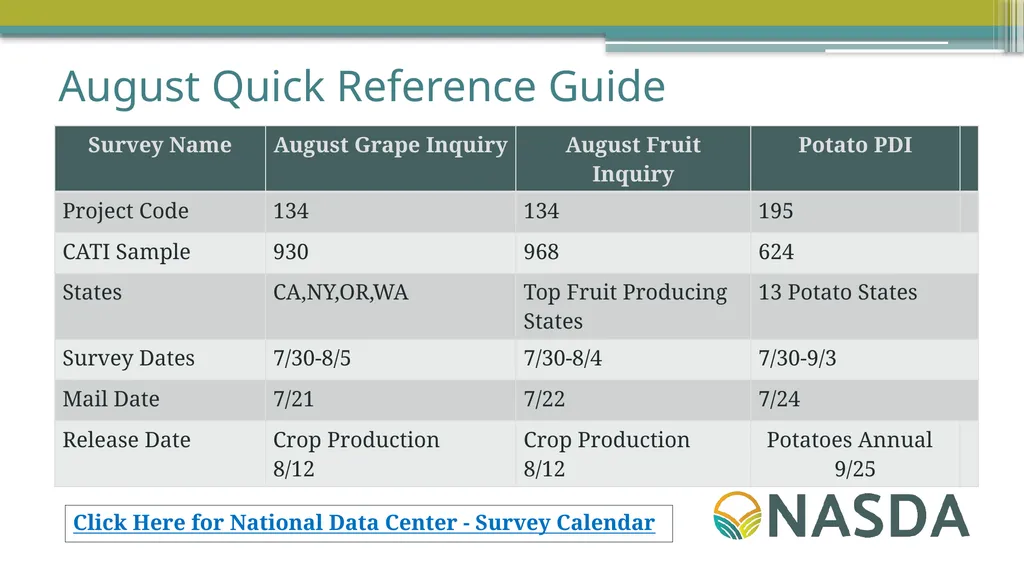
Grapes are harvested in the fall. The August Grape Inquiry collects grape acreage as of August 1st and expected production for the current crop year.
This report will give growers, processors, and industry experts insight into how the 2026 crop is shaping up and what they can expect for volume.<br>
05
August Grape Inquiry – Tips and Tricks Production numbers are summarized as tons. If any unit other than weight is used (crates etc.) we must have the weight per unit.
CA collects data for all operations managed by a vineyard management firm. (see CA questionnaire screener for info.)
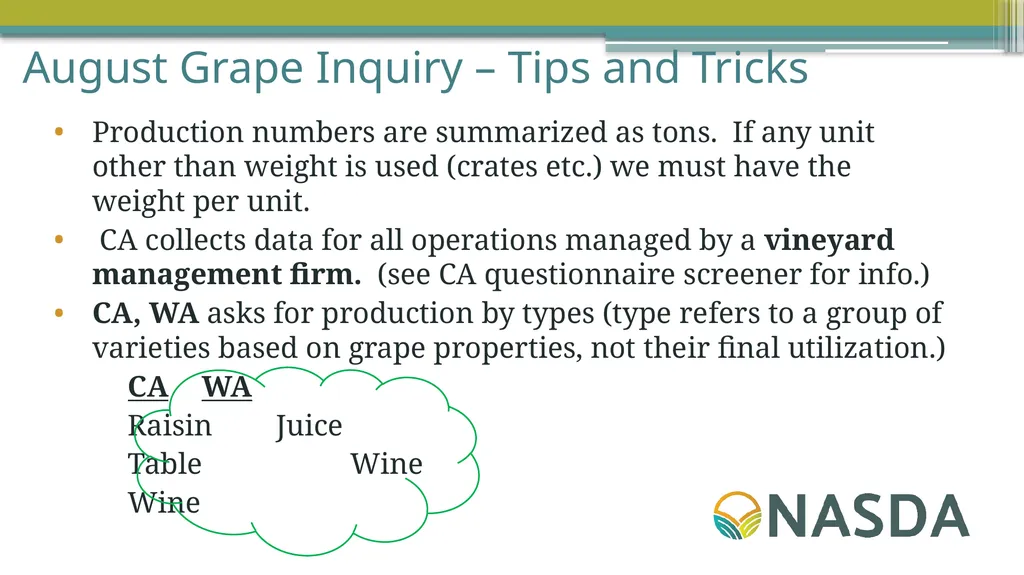
CA, WA asks for production by types (type refers to a group of varieties based on grape properties, not their final utilization.)
CA WA
Raisin Juice
Table Wine
Wine<br>
06
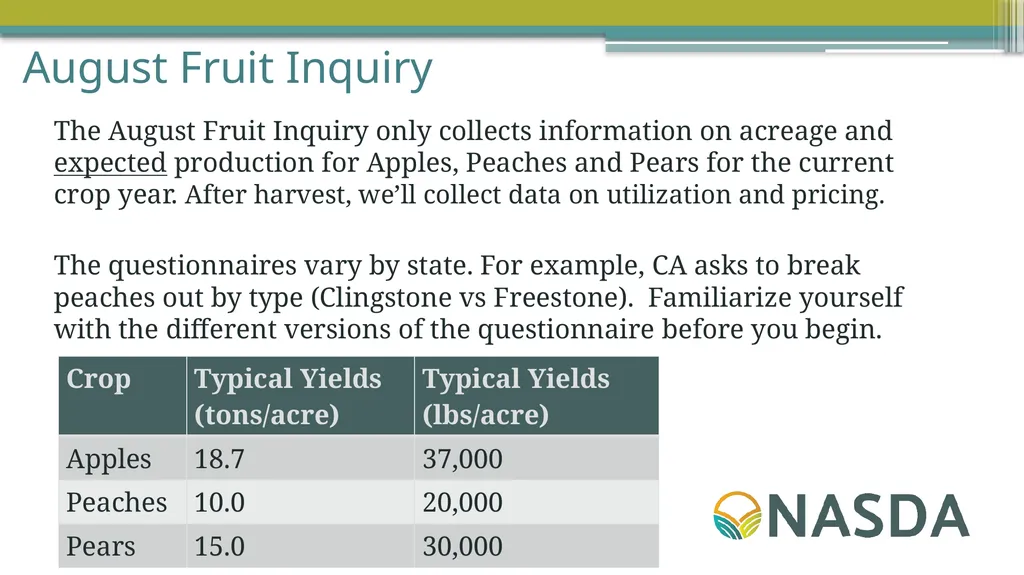
August Fruit Inquiry The August Fruit Inquiry only collects information on acreage and expected production for Apples, Peaches and Pears for the current crop year. After harvest, we’ll collect data on utilization and pricing.
The questionnaires vary by state. For example, CA asks to break peaches out by type (Clingstone vs Freestone). Familiarize yourself with the different versions of the questionnaire before you begin.<br>
07
August Fruit Inquiry-Tips and Tricks August Fruit Production Inquiry Enumerator Training - HERE
August Fruit Production Inquiry Information Sheet - HERE
Great items to include in notes:
Comments on weather damage, disease, drought, pest pressures, and the growing season in general.
Explanations for unusual data relationships (extremely low/high yields, bearing acres compared to total acres, etc.)
Descriptions for unusual units that will help calculate total production.
Out of business notes<br>
08
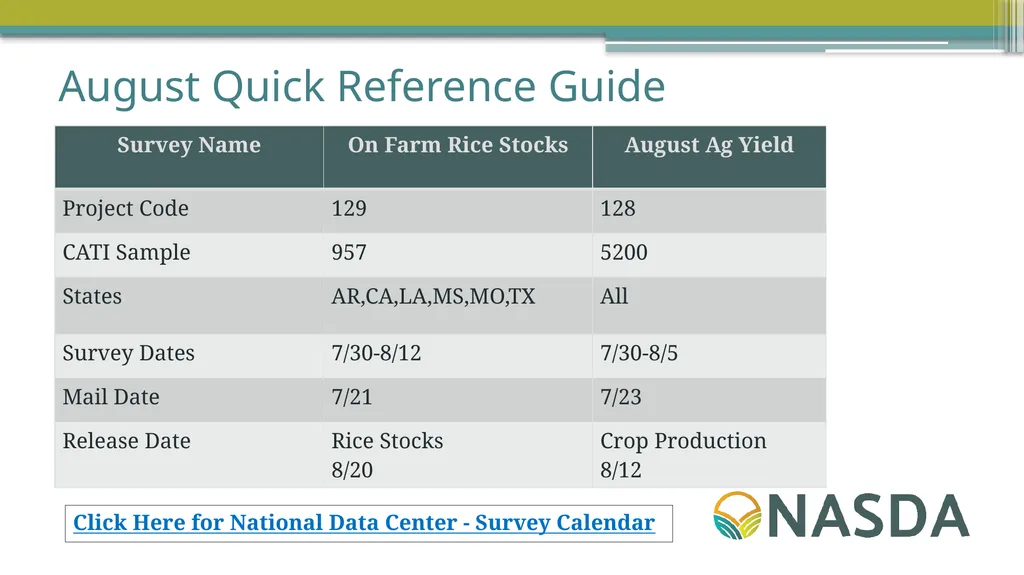
On Farm Rice Stocks This is a short survey collecting information on On-Farm rice stocks. NASS also contacts mills, elevators, warehouses and ports to obtain OFF Farm rice stocks. Combining these two numbers, they publish total Rice Stocks in Mar, June, Aug, Oct and Dec.
Tracking the total rice stocks allows growers, processors, and others to see expected shortages and surpluses and react accordingly.<br>
09
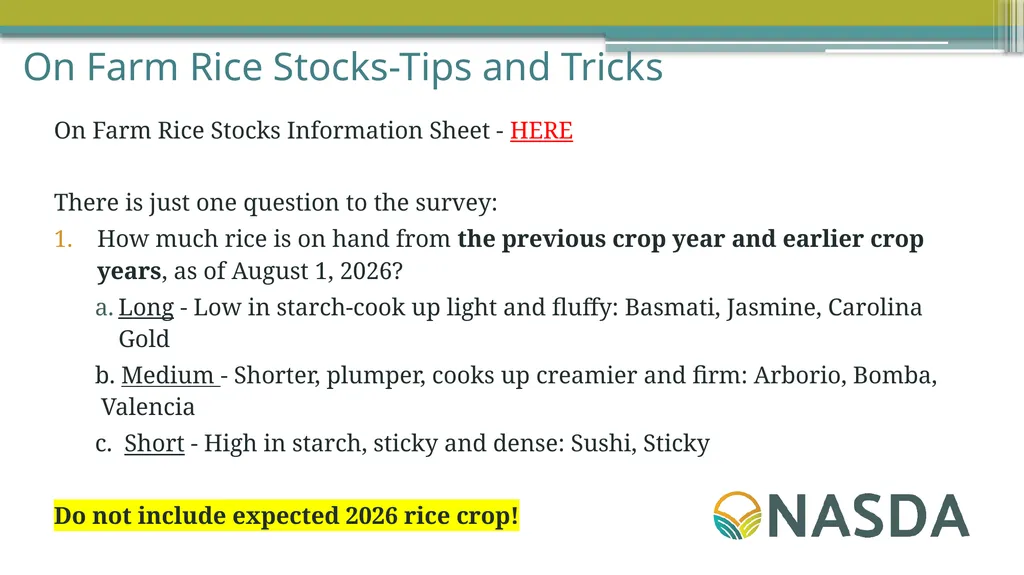
On Farm Rice Stocks-Tips and Tricks On Farm Rice Stocks Information Sheet - HERE
There is just one question to the survey:
How much rice is on hand from the previous crop year and earlier crop years, as of August 1, 2026?
Long - Low in starch-cook up light and fluffy: Basmati, Jasmine, Carolina Gold
b. Medium - Shorter, plumper, cooks up creamier and firm: Arborio, Bomba, Valencia
c. Short - High in starch, sticky and dense: Sushi, Sticky
Do not include expected 2026 rice crop!<br>
10
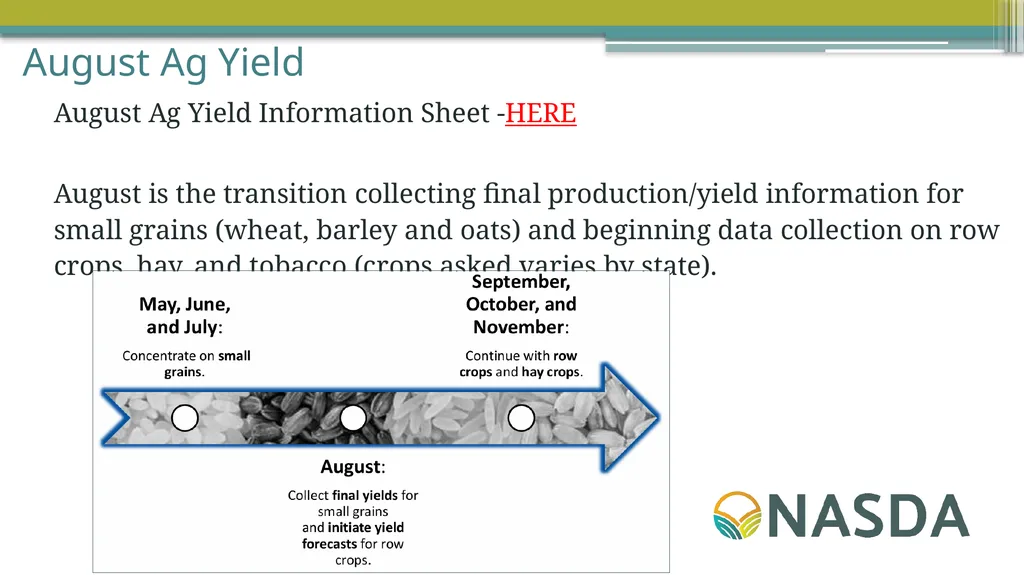
August Ag Yield August Ag Yield Information Sheet -HERE
August is the transition collecting final production/yield information for small grains (wheat, barley and oats) and beginning data collection on row crops, hay, and tobacco (crops asked varies by state).<br>
11
August Ag Yield Tips and Tricks Small Grains/Row Crops harvested for grain or seed only. Exclude any other uses (silage, haylage, cover crop, etc.)
Row crops include Corn, Pima & Upland Cotton, Dry Edible Beans, Peanuts, Rice, Soybeans, Sorghum, Sugarcane, Canola, Chickpeas, & Sunflowers.
Dry Hay: asking for Dry Hay only (exclude haylage and green chop).
Include all hay, alfalfa hay and other hay.
Include all cuttings during the current year.
Include the total expected yields for the entire year, not just what has been harvested to point in time.<br>
12
August Ag Yield NASDA Pilot A small group of NDC staff will be testing the use of cell phones during August AY.<br>
13
Potato Acreage and Disposition August Potato Acreage and Disposition Enumerator Training - HERE
August Potato Acreage and Disposition Information Sheet - HERE
The most comprehensive look at potato production, disposition and value for the country. The survey measures the total utilization of an entire year’s crop of potatoes.
This Potato PDI, along with the Potato Processor Survey (shown next) are used to develop the Annual Potato Summary in late September.<br>
14
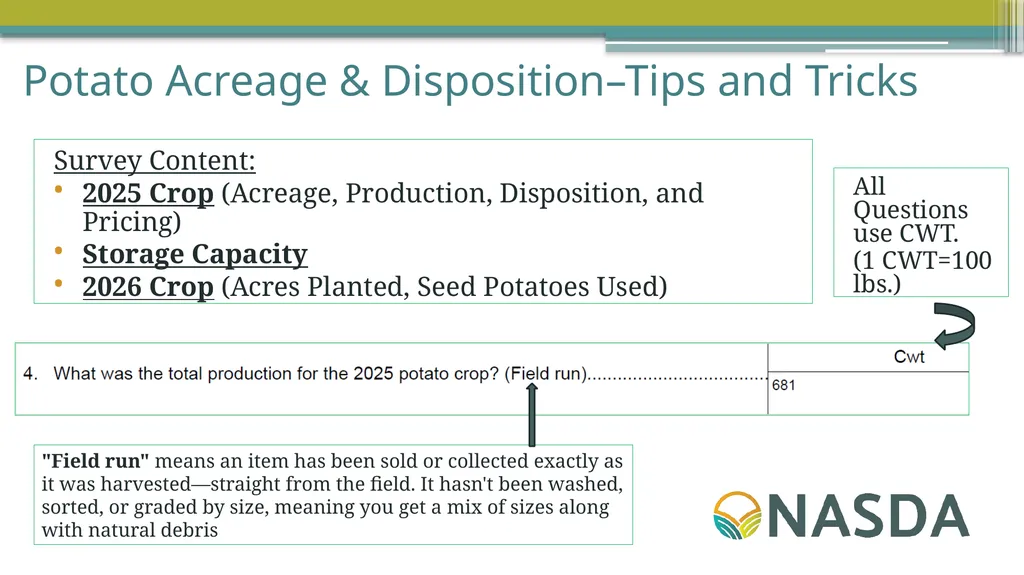
Potato Acreage & Disposition–Tips and Tricks Survey Content:
2025 Crop (Acreage, Production, Disposition, and Pricing)
Storage Capacity
2026 Crop (Acres Planted, Seed Potatoes Used) "Field run" means an item has been sold or collected exactly as it was harvested—straight from the field. It hasn't been washed, sorted, or graded by size, meaning you get a mix of sizes along with natural debris All Questions use CWT.
(1 CWT=100 lbs.)<br>
15
Callers Corner-NASS Mission Tools “To provide timely, accurate, and useful statistics in service to U.S. agriculture “<br>
16
Callers Corner Tools NASS conducts over 400 weekly, monthly, quarterly, and annual agricultural surveys, which culminate in nearly 500 separate national reports and data releases annually and NASDA is responsible for obtaining information for almost all of these!!!
Because most surveys are voluntary (except for the Census of Agriculture and its follow-on surveys) it’s easy to see how much we rely on our farmers and ranchers.
But remember, we’re giving back to them as well!<br>
17
Callers Corner-Producer Benefits Tools The reports NASS produces are vital to producers; providing them unbiased data that allows them to make management and marketing decisions for their operation.
Let’s look at some specific examples of direct and indirect benefits to respondents and follow the data back to its origins.<br>
18
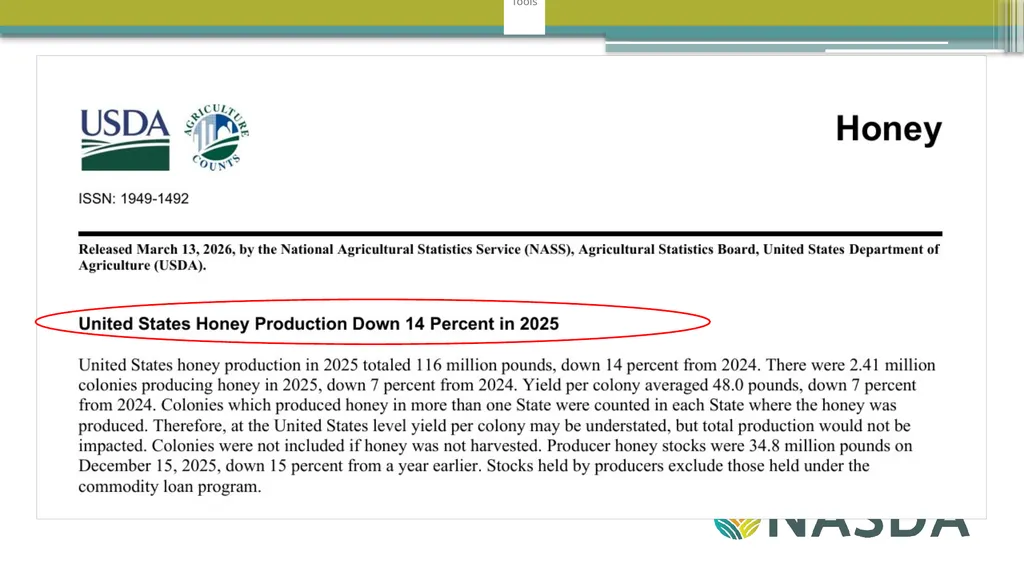
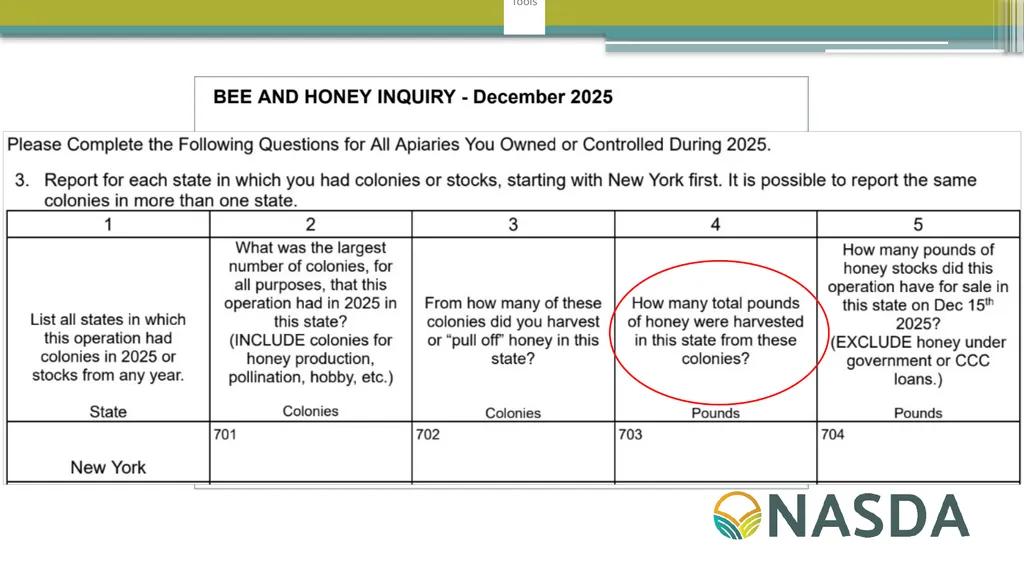
Callers Corner – Direct Benefits Example 1 Tools Revenue Forecasting: Beekeepers analyze state-level yields per colony and honey stocks published in the annual NASS Honey Report to benchmark their own operations. They look at the value of production and price-by-color class to decide whether to sell their honey immediately in bulk or hold stock when prices are favorable.<br>
19
Callers Corner – Direct Benefits Tools<br>
21
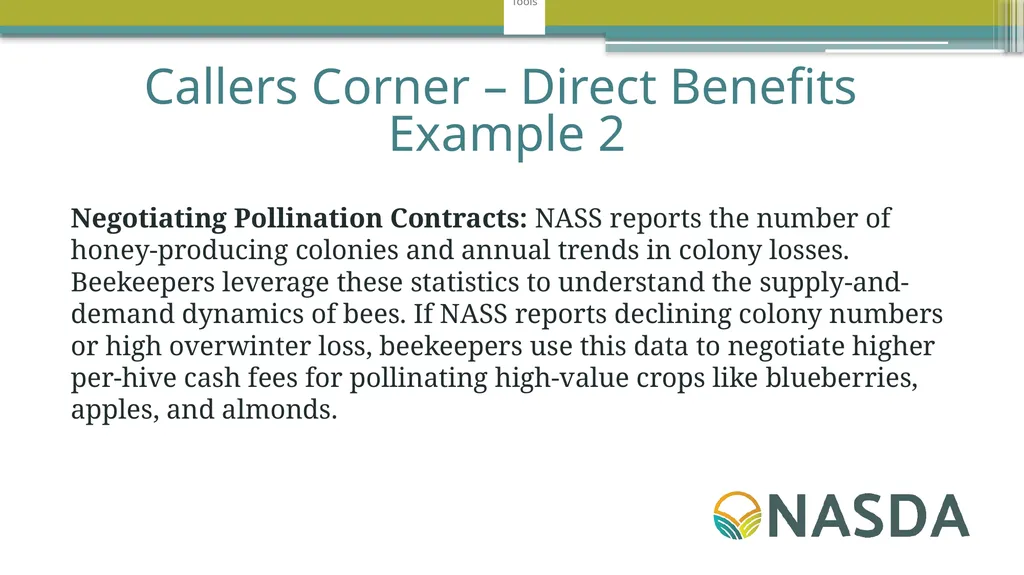
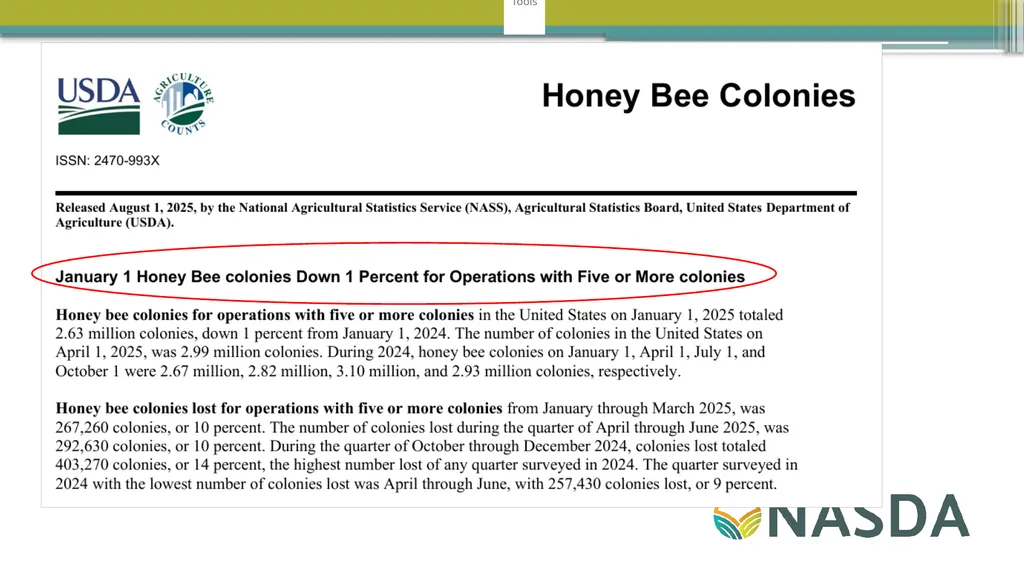
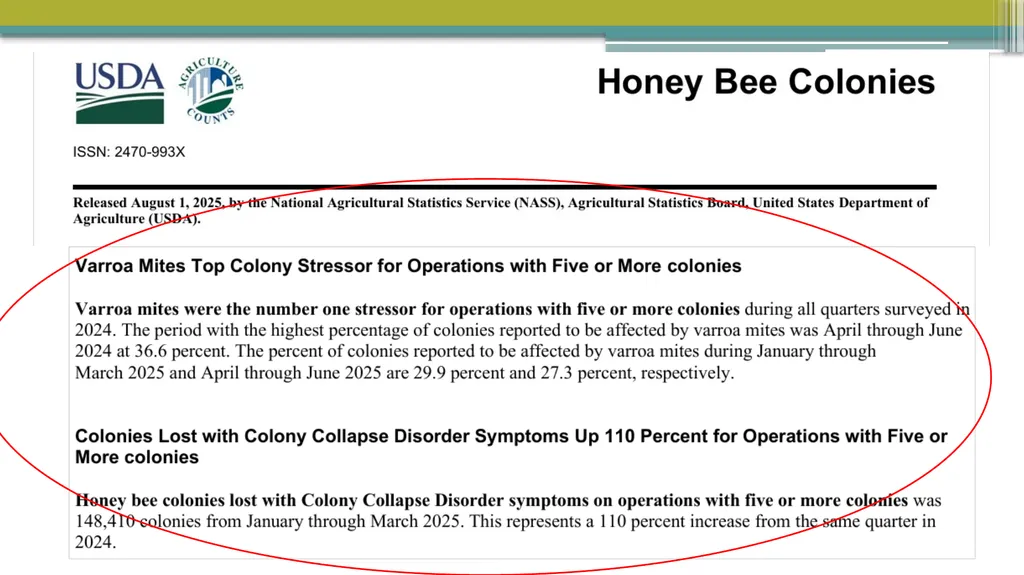
Tools Negotiating Pollination Contracts: NASS reports the number of honey-producing colonies and annual trends in colony losses. Beekeepers leverage these statistics to understand the supply-and-demand dynamics of bees. If NASS reports declining colony numbers or high overwinter loss, beekeepers use this data to negotiate higher per-hive cash fees for pollinating high-value crops like blueberries, apples, and almonds. Callers Corner – Direct Benefits Example 2<br>
23
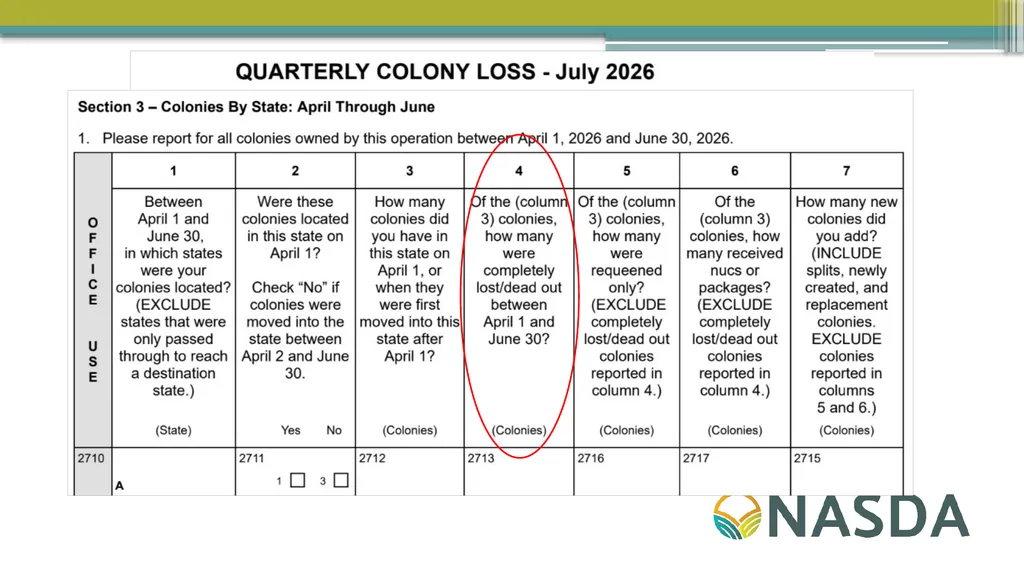
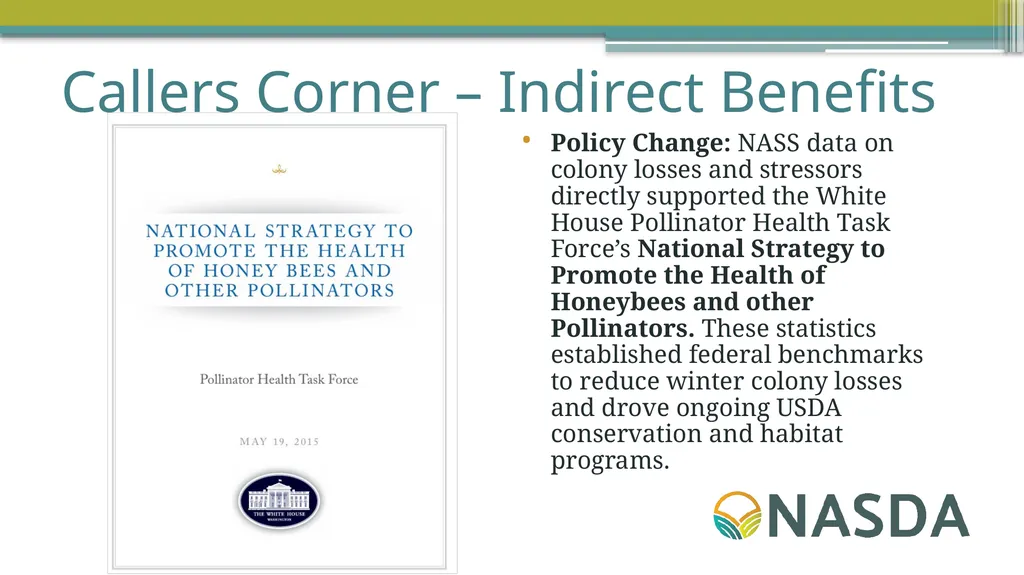
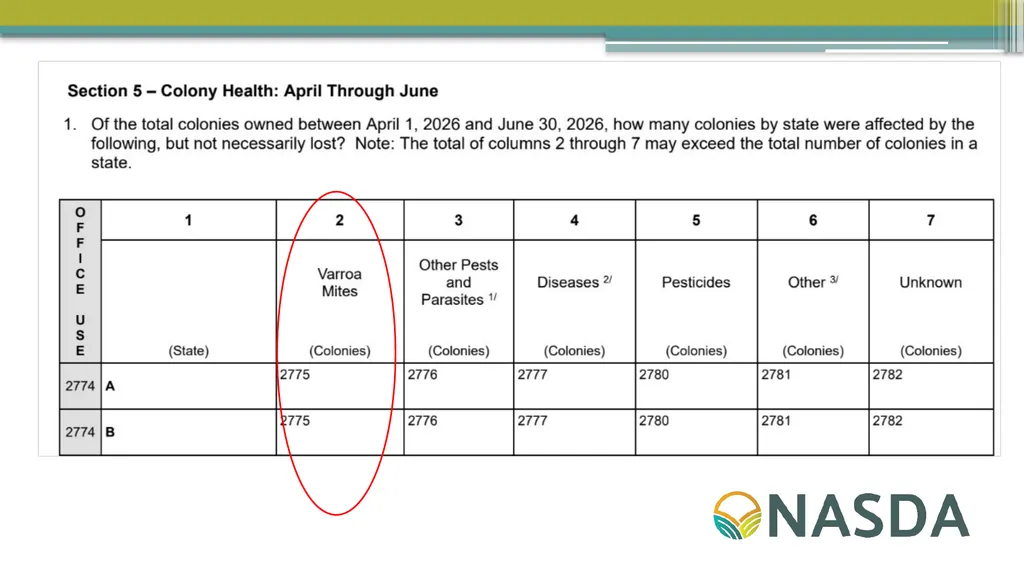
Policy Change: NASS data on colony losses and stressors directly supported the White House Pollinator Health Task Force’s National Strategy to Promote the Health of Honeybees and other Pollinators. These statistics established federal benchmarks to reduce winter colony losses and drove ongoing USDA conservation and habitat programs. Callers Corner – Indirect Benefits<br>
24
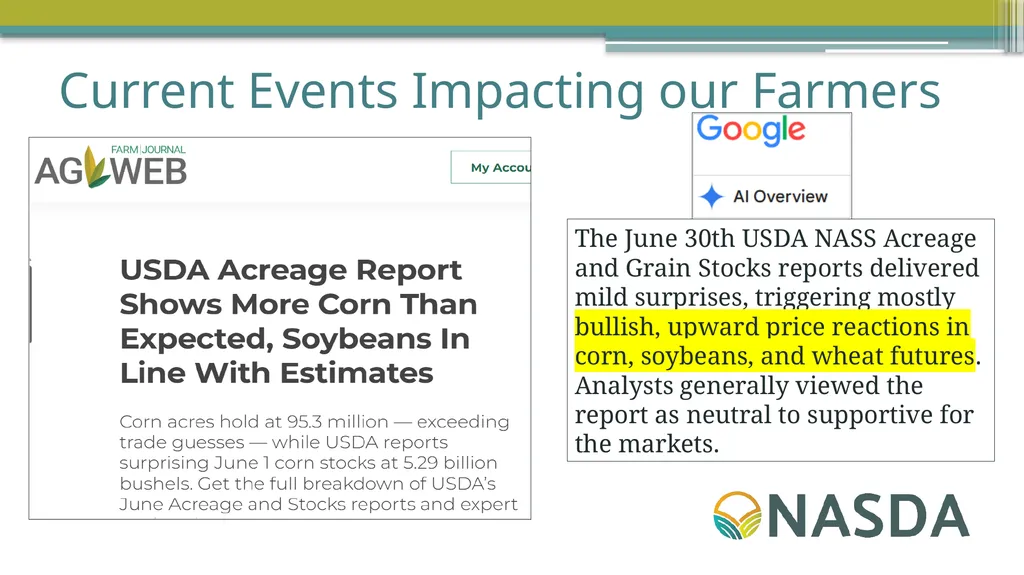
Current Events Impacting our Farmers Remember the June Surveys you all worked so hard on???
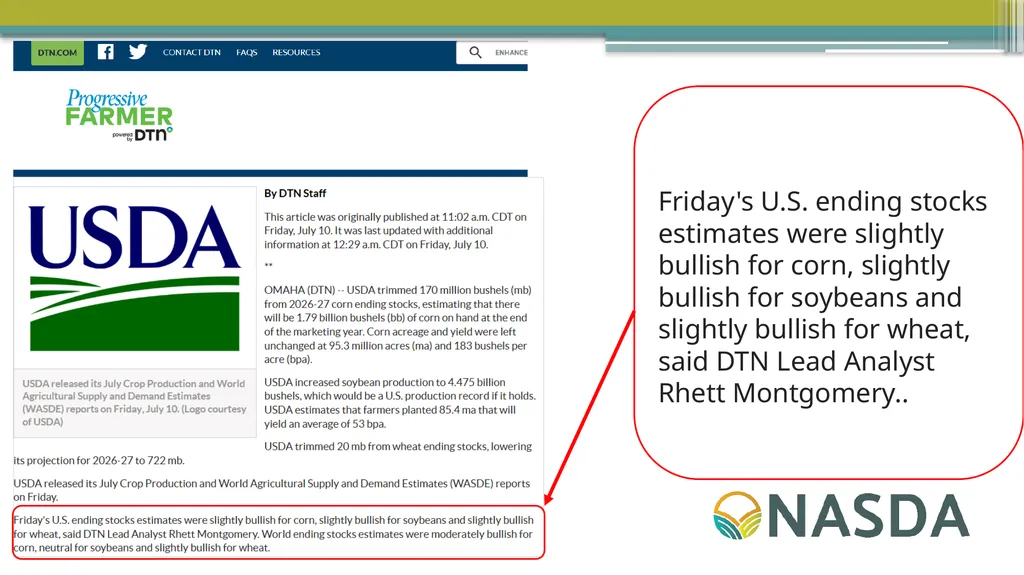
The Acreage Report was released on June 30th and the Crop Production release on July 10. Here are a few examples of how agricultural publications and news media used that information.
Notice the number of commodities that actually reacted with price INCREASES. We’ve talked before about farmer’s misconception that our reports result in lower prices. Here are good examples to the contrary!<br>
25
Current Events Impacting our Farmers The June 30th USDA NASS Acreage and Grain Stocks reports delivered mild surprises, triggering mostly bullish, upward price reactions in corn, soybeans, and wheat futures. Analysts generally viewed the report as neutral to supportive for the markets.<br>
26
Friday's U.S. ending stocks estimates were slightly bullish for corn, slightly bullish for soybeans and slightly bullish for wheat, said DTN Lead Analyst Rhett Montgomery..<br>