National Health Expenditures per Capita, 1960-2010
1 / 1

National Health Expenditures per Capita, 1960-2010

Author : myesha-ticknor | Published Date : 2025-05-12

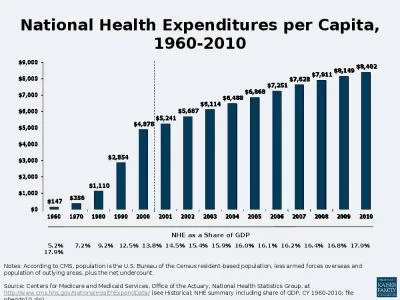
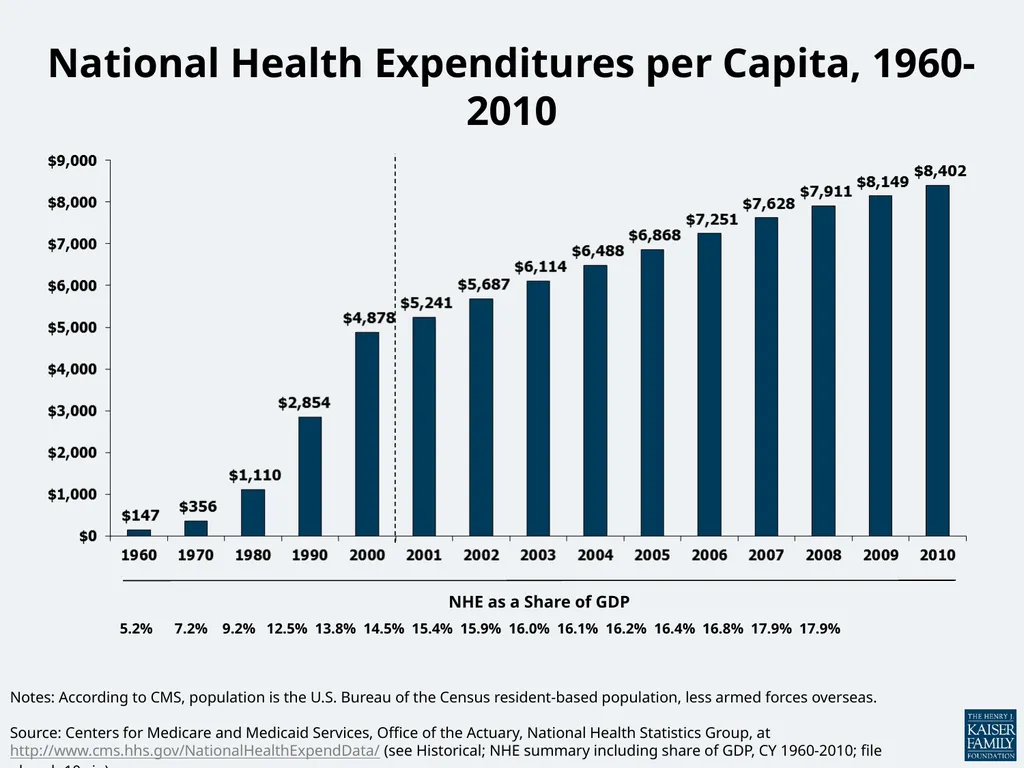
Description: National Health Expenditures per Capita 19602010 Notes According to CMS population is the US Bureau of the Census residentbased population less armed forces overseas Source Centers for Medicare and Medicaid Services Office of the

Presentation Embed Code

Download Presentation

Download Presentation The PPT/PDF document "National Health Expenditures per Capita, 1960-2010" is the property of its rightful owner. Permission is granted to download and print the materials on this website for personal, non-commercial use only, and to display it on your personal computer provided you do not modify the materials and that you retain all copyright notices contained in the materials. By downloading content from our website, you accept the terms of this agreement.

Transcript:National Health Expenditures per Capita, 1960-2010:
National Health Expenditures per Capita, 1960-2010 Notes: According to CMS, population is the U.S. Bureau of the Census resident-based population, less armed forces overseas. Source: Centers for Medicare and Medicaid Services, Office of the Actuary, National Health Statistics Group, at http://www.cms.hhs.gov/NationalHealthExpendData/ (see Historical; NHE summary including share of GDP, CY 1960-2010; file nhegdp10.zip). 5.2% 7.2% 9.2% 12.5% 13.8% 14.5% 15.4% 15.9% 16.0% 16.1% 16.2% 16.4% 16.8% 17.9% 17.9% NHE as a Share of GDP Average Annual Growth Rates for NHE and GDP, Per Capita, for Selected Time Periods Source: Historical data from Centers for Medicare and Medicaid Services, Office of the Actuary, National Health Statistics Group, January 2012, at http://www.cms.hhs.gov/NationalHealthExpendData/ (see Historical; NHE summary including share of GDP, CY 1960-2010; file nhegdp10.zip). Projections from Centers for Medicare and Medicaid Services, Office of the Actuary, National Health Statistics Group, July 2011, “National Health Expenditures 2010-2020,” Table 1, https://www.cms.gov/NationalHealthExpendData/downloads/proj2010.pdf. Projected Average Annual Percent Change in National Health Expenditures, 1960-2010 Source: Kaiser Family Foundation calculations using NHE data from Centers for Medicare and Medicaid Services, Office of the Actuary, National Health Statistics Group, at http://www.cms.hhs.gov/NationalHealthExpendData/ (see Historical; National Health Expenditures by type of service and source of funds, CY 1960-2010; file nhe2010.zip). Per Capita Total Current Health Care Expenditures, U.S. and Selected Countries, 2009 ^OECD estimate. *Break in series. Notes: Amounts in U.S.$ Purchasing Power Parity, see http://www.oecd.org/std/ppp; includes only countries over $2,500. OECD defines Total Current Expenditures on Health as the sum of expenditures on personal health care, preventive and public health services, and health administration and health insurance; it excludes investment. Source: Organisation for Economic Co-operation and Development. “OECD Health Data: Health Expenditures and Financing”, OECD Health Statistics Data from internet subscription database. http://www.oecd-ilibrary.org, data accessed on 01/10/12. Note: Dollar amounts in parentheses are the annual expenses per person in each percentile. Population is the civilian noninstitutionalized population, including those without any health care spending. Health care spending is total payments from all sources (including direct payments from individuals and families, private insurance, Medicare, Medicaid, and miscellaneous other sources) to hospitals, physicians, other providers (including dental care), and pharmacies; health insurance premiums are not included. Source: Kaiser Family Foundation calculations using data from U.S. Department of Health and Human Services, Agency for Healthcare Research and Quality, Medical Expenditure Panel Survey (MEPS), Household Component, 2009. Concentration of Health Care Spending in the U.S. Population, 2009 (≥$51,951) (≥$17,402) (≥$9,570) (≥$6,343) (≥$4,586) (≥$851) (<$851)

Download Document

Here is the link to download the presentation.
"National Health Expenditures per Capita, 1960-2010"The content belongs to its owner. You may download and print it for personal use, without modification, and keep all copyright notices. By downloading, you agree to these terms.

Related Presentations

Q Beer Q Wine Q Spirits Q Other Q All      Litres of pure alcohol  Year         Recorded BEER INSTITUTE Shipments of Malt Beverages and Per Capita Consumption by State   gallon Q Beer Q Wine Q Spirits Q Other Q All      Litres of pure alcohol  Year         Recorded Capita Per Brewery  Capita Brewery Rank State Total Breweries Capita Brewery Vermont Data Validation of National Accounts in the ICP 2011 GDP/Capita Improvement vs. Factors Expenditure Data Validation Federal, State, and Local Government Expenditures Michael Grubb THE 1960’S   THE 1960’S NOTE:  Other Personal Health Care includes, for example, dental and other professional Average Annual Percent Change in National Health Expenditures, 1960-2012 National Health Expenditures per Capita, 1960-2010