
National School Lunch Program Tuesday, July 10,



Description: National School Lunch Program Tuesday, July 10, 2012 Introduction Free Reduced Price Meal (FRPM) data are collected on behalf of the U.S. Department of Agriculture to provide nutritional meals to children in need. re-purposed by Education
Related Topics
Download Presentation
"National School Lunch Program Tuesday, July 10," is the property of its rightful owner. Permission is granted to download and print the materials on this website for personal, non-commercial use only, and to display it on your personal computer provided you do not modify the materials and that you retain all copyright notices contained in the materials. By downloading content from our website, you accept the terms of this agreement.
Presentation Transcript
slide1. National School Lunch Program Tuesday, July 10, 2012<br>
slide2. Introduction Free & Reduced Price Meal (FRPM) data are collected on behalf of the U.S. Department of Agriculture to provide nutritional meals to children in need.
re-purposed by Education as a poverty indicator
NSLP changes will impact the FRPM data collection
The Departments of Agriculture and Education are partnering to identify and address challenges.<br>
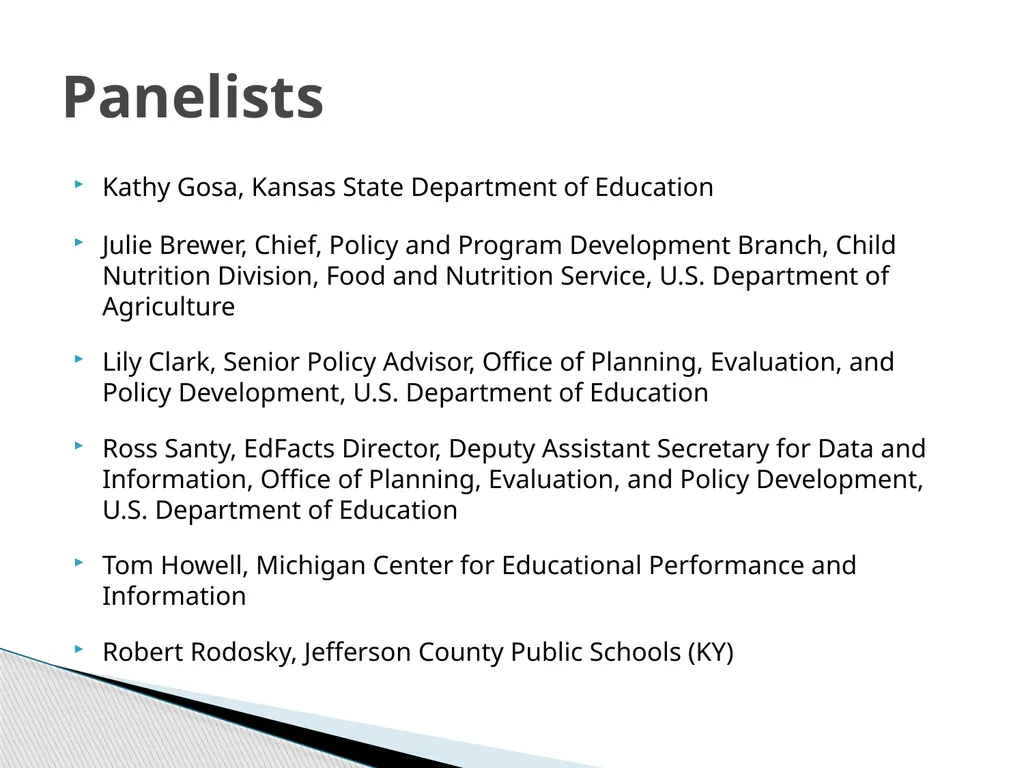
slide3. Panelists Kathy Gosa, Kansas State Department of Education
Julie Brewer, Chief, Policy and Program Development Branch, Child Nutrition Division, Food and Nutrition Service, U.S. Department of Agriculture
Lily Clark, Senior Policy Advisor, Office of Planning, Evaluation, and Policy Development, U.S. Department of Education
Ross Santy, EdFacts Director, Deputy Assistant Secretary for Data and Information, Office of Planning, Evaluation, and Policy Development, U.S. Department of Education
Tom Howell, Michigan Center for Educational Performance and Information
Robert Rodosky, Jefferson County Public Schools (KY)<br>
slide4. Julie Brewer National School Lunch Program
Program Eligibility<br>
slide5. Agenda National School Lunch Program (NSLP) Basics
Application Process
Categorical Eligibility
Direct Certification
Disclosure
Provisional Schools
Community Eligibility Option<br>
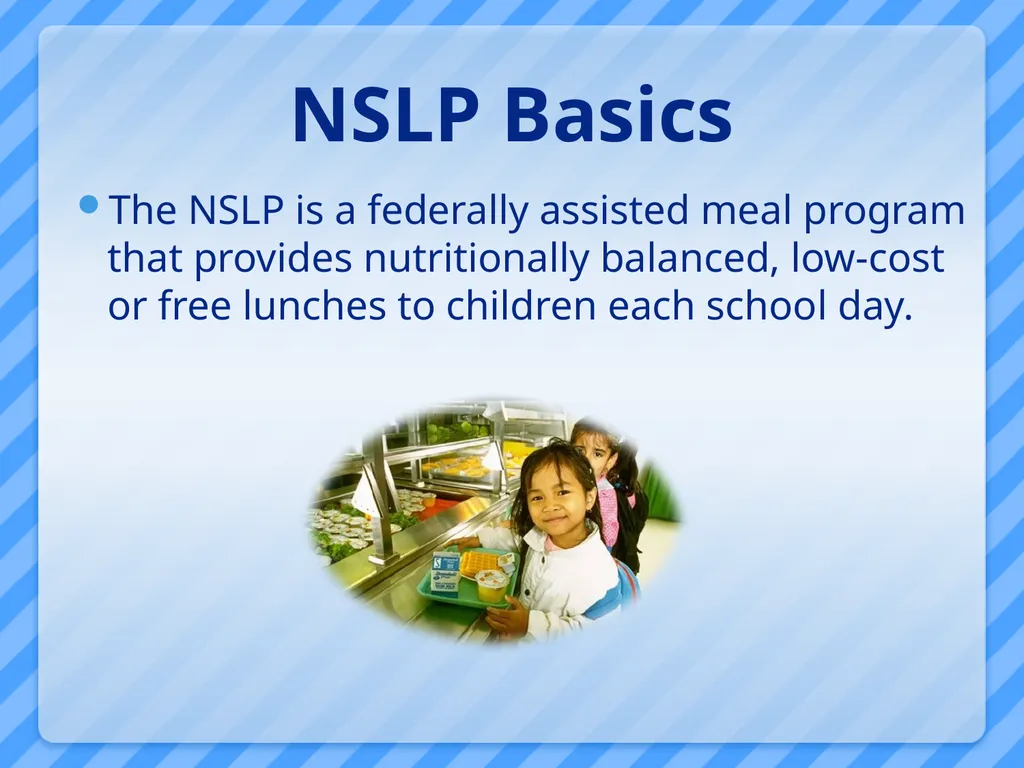
slide6. NSLP Basics The NSLP is a federally assisted meal program that provides nutritionally balanced, low-cost or free lunches to children each school day.<br>
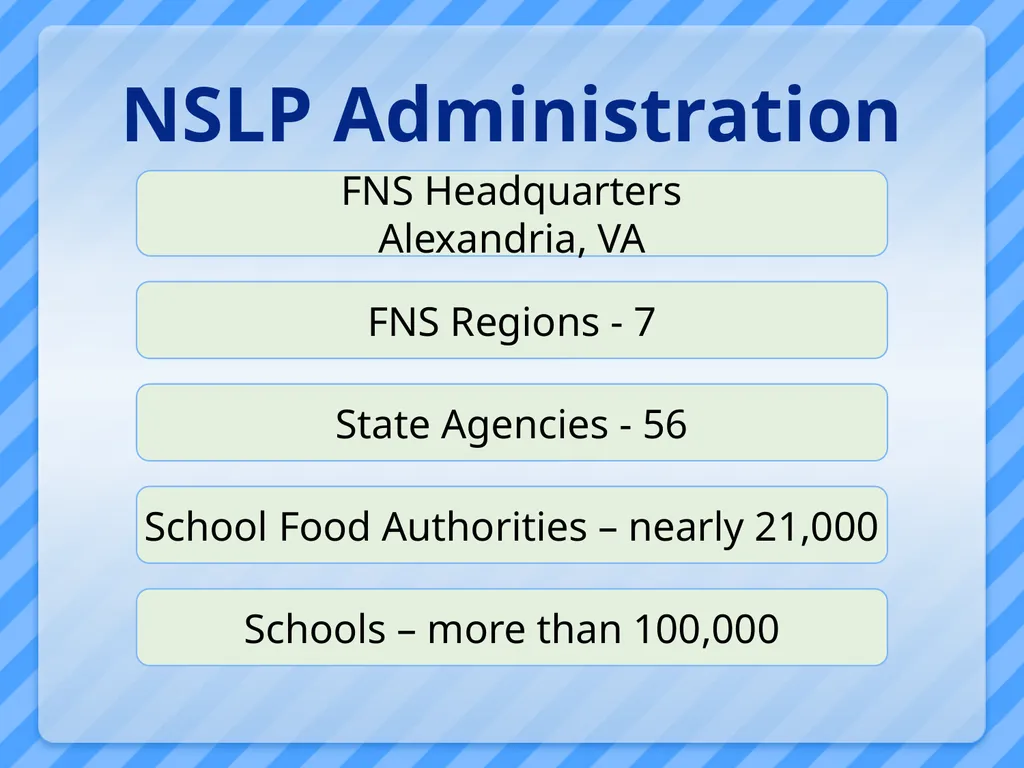
slide7. NSLP Administration Schools – more than 100,000 School Food Authorities – nearly 21,000 State Agencies - 56 FNS Headquarters
Alexandria, VA FNS Regions - 7<br>
slide8. Federal Income Guidelines Children from families whose income equals 130 percent of poverty or less are eligible for free meals
Children from families whose income equals between 131 and 185 percent of poverty are eligible for reduced price meals<br>
slide9. Application Process Household Application
Completed at home
Self-declaration of income or other status
Beginning of the school year (August/September)
Provides information on household income and size<br>
slide10. Income and Household Size Income
before any deductions (such as taxes, Social Security taxes, insurance premiums, charitable contributions and bonds)
Household
a group of related or non-related people living under one roof as one economic unit<br>
slide11. Verification Basics Local responsibility, though the State may conduct the process
Use number of applications approved as of October 1 as pool
LEAs must verify a minimum number of applications by November 15 every year<br>
slide12. SNAP and TANF Categorical Eligibility Children in households receiving assistance under SNAP and in some states TANF or FDPIR are eligible for NSLP free meals<br>
slide13. Categorical Eligibility: Migrant, Runaway or Homeless Children Migrant children in the Migrant Education Program
Children covered under the provisions of the Runaway and Homeless Youth Act
Homeless children under the McKinney-Vento Act
Head Start children
Foster children under the care of a State/local welfare agency or court<br>
slide14. The process by which schools certify eligible children using data from other assistance programs
States can match data either at the State or District level Direct Certification<br>
slide15. Direct Certification Mandatory for SNAP
SNAP, TANF or FDPIR officials relay documentation to schools that a child is part of a household certified to get those benefits
Documentation may include:
Name of child
A certifying statement
Identifiers (e.g., SSN and DOB)
Signature of program official
Date<br>
slide16. Advantages of Direct Certification No applications; easier for households and schools
Increases program access
Enhances accuracy of the eligibility process<br>
slide17. Direct Certification Medicaid Pilot Demonstration Projects in selected States and SFAs
Phased in starting with School Year 2012-13
Purpose of demonstration: To determine potential of direct certification with Medicaid to:
Reach eligible, uncertified children
Directly certify children who are free based on an application
To provide an estimate of the effect on Federal costs and participation<br>
slide18. Provision 1 Simplified Application Process Schools where 80% of students eligible for free and reduced price
Children eligible for FREE meals are certified every 2 years
Reduced and paid households apply for meal benefits annually<br>
slide19. Provision 2 Simplified Counting & Claiming No minimum % of free or reduced price
All student meals served at no charge
Base Year
Count daily meals by type
Claim reimbursement from these counts
SFA may delay implementation 1st claiming period
Subsequent Years
Count daily total meals
Claim reimbursement on base year percentages<br>
slide20. Provision 3 Simplified Counting & Claiming Allows schools to receive the same level of federal cash and commodity assistance each year, with some adjustments, for a 4-year period
No minimum % of free or reduced price<br>
slide21. Joint Guidance on Provision 2 & 3 February 20, 2003-USDA and ED guidance
Allowed LEA officials to deem all students in Provision 2 and 3 schools as “economically disadvantaged”
More information can be found at: http://www.fns.usda.gov/cnd/Governance/prov-1-2-3/provision1_2_3.htm<br>
slide22. Community Eligibility Option (CEO) Section 104 (a) of the Healthy, Hunger Free Kids Act of 2010
An alternative to collecting household applications for free and reduced price meals in high poverty local educational agencies (LEA) and schools.
Eligible LEAs/schools agree to serve all students free lunches and breakfasts for 4 successive school years. 22<br>
slide23. Who is eligible to elect the CEO? LEAs may elect the CEO for the entire district, individual schools, or a group of schools.
To be eligible; the LEA, individual school, or group of schools must have an identified student percentage of at least 40%.
Identified students are those certified for free meals NOT through individual household applications (example: directly certified through SNAP). 23<br>
slide24. How does the CEO work? The identified student percentage multiplied by a factor of 1.6 equals the percentage of total meals served reimbursed at the Federal free rate.
The remaining percentage of total meals is reimbursed at the Federal paid rate.
Any meal costs in excess of the total Federal reimbursement must be covered through non-Federal sources. 24<br>
slide25. How does the CEO work? LEA and schools run direct certification matches no later than April 1st of each year to obtain current counts of SNAP, TANF, and FDPIR participants.
Homeless, migrant youth, and foster children lists are matched no later than April 1st of each year to include in the identified student percentage.
Each year of the 4-year cycle, LEAs or schools may use the identified student percentage from the year prior to the first year or an updated identified student percentage from the prior year, whichever is higher. 25<br>
slide26. When is the CEO available? FNS selected three states for SY2011-12, four states for SY2012-13, and will select four states for SY2013-14.
Available nationwide starting in SY2014-2015.
LEAs and schools in Illinois, Kentucky, and Michigan implemented the Option in SY2011-2012 and the District of Columbia, New York, Ohio, and West Virginia will implement the Option in SY2012-2013. 26<br>
slide27. Disclosure and Privacy LEAs may disclose children’s free and reduced price meal eligibility information to programs, activities, and individuals that are specifically authorized access under the National School Lunch Act (NSLA) (42 U.S.C. 1758)
Disclosure is always an option, not a requirement<br>
slide28. Disclosure and Privacy Personal information may only be disclosed under select circumstances outlined in the NSLA (Sec. 9 (b)(6))
Examples include:
Disclosures to Federal, State, and local education programs (eligibility status only, parental consent required for local programs)
Disclosures to the Comptroller General of the United States for purposes of audit and examination (all eligibility information)
Disclosures to Federal, State, and local law enforcement officials investigating alleged criminal activity (all eligibility information)<br>
slide29. Comments or Questions<br>
slide30. FERPA & NSLA Privacy Protections NSLA’s and FERPA’s privacy protections are not fully aligned
USDA & ED recognize that there is confusion in the education field about under which circumstances disclosure under both statutes is allowed<br>
slide31. 2011 FERPA Regulations ED’s recent amendments to the FERPA regulations clarify the limited circumstances where SEAs and LEAs may disclose student information to assess the effectiveness of State and Federally-funded education programs<br>
slide32. 2011 FERPA Regulations: Joint Guidance As stated in our 2011 FERPA regulations:
“Because of the importance of assuring not only that FERPA requirements are met, but also that all of the Federal confidentiality protections in the National School Lunch Act are met, the two Departments intend to jointly issue guidance in the near future for use by the educational community and by State and local administrators of USDA programs.”<br>
slide33. Joint Guidance Update Ongoing meetings between USDA & ED
Plan to have joint guidance out before next Winter Forum meeting<br>
slide34. Joint Guidance Update Currently conducting a legal analysis of the two statutes to identify inconsistencies
Anticipate that joint guidance will clarify the use of FRPL data under FERPA’s audit/evaluation exception, reconciling:
Definitions of “education program”
Who has a “need to know” versus “legitimate educational interest”<br>
slide35. Help Inform the Joint Guidance Looking forward to receiving input from standing committees on the challenges your SEAs/LEAs face implementing overlapping USDA and ED requirements<br>
slide36. Uses of NSLP Data Across Education Ross Santy
Director, EDFacts
U.S. Department of Education 36<br>
slide37. The Common Core of Data (CCD) is ED’s primary database on public elementary and secondary education in the United States.
CCD’s objectives are to provide:
an official listing of public elementary and secondary schools and school districts in the nation, which can be used to select samples for other NCES surveys
basic information and descriptive statistics on public elementary and secondary schools 37 Use of NSLP Data: CCD<br>
slide38. The National Assessment of Educational Progress (NAEP) is the largest nationally representative and continuing assessment of what America’s students know and can do in various subject areas.
NAEP’s state assessment are administered across a representative sample of schools.
A national sample will have sufficient schools and students to yield data for public schools, each of the four NAEP regions of the country, as well as sex, race, degree of urbanization of school location, parent education and eligibility for the National School Lunch Program (NSLP). 38 Use of NSLP Data: NAEP<br>
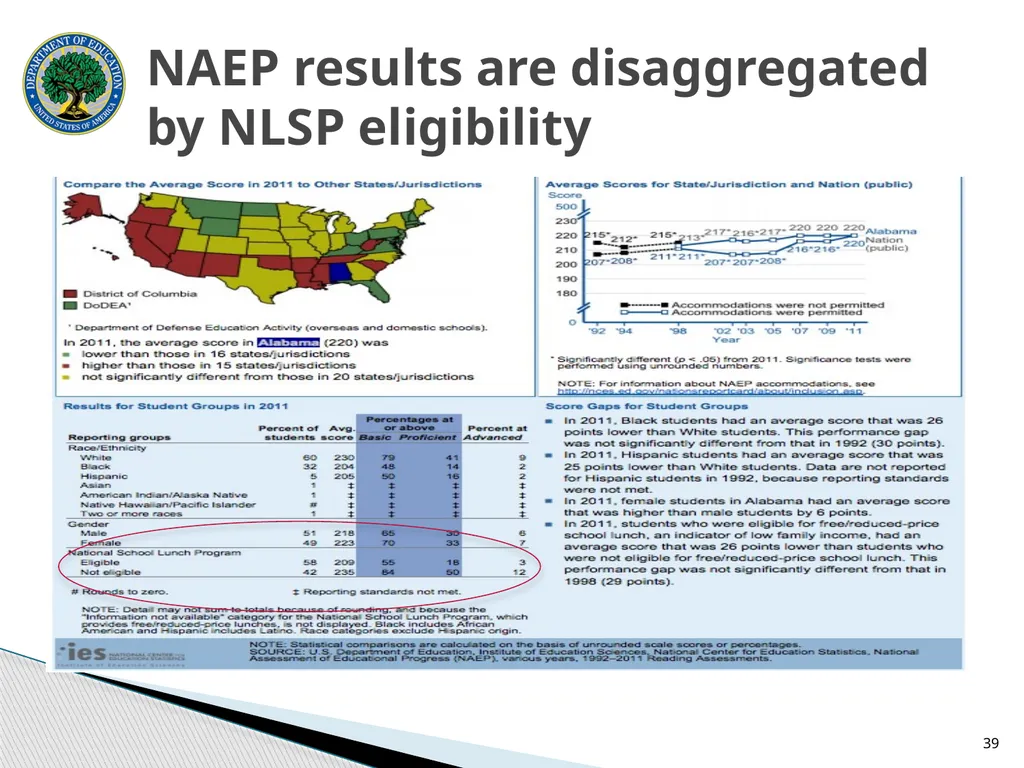
slide39. 39 NAEP results are disaggregated by NLSP eligibility<br>
slide40. Funding Formulas (all four of them) use Census data to determine the number of poor children ages 5-17. NSLP data are not used here.
Many LEAs have historically used NSLP data for within district distributions of Title I funds
Accountability for student progress requires states to assess not only the progress of the LEA or school as a whole but also examine and report the progress of students by:
Major racial and ethnic groups
English proficiency
Disability
Economic status Uses of NSLP Data: Title I<br>
slide41. December 17, 2002
Recognized that for many LEAs NSLP data “is likely the best, and perhaps the only source of data available”
Priority for public school choice and eligibility for supplemental educational services must be established using the same data LEAS use for making within-district Title I allocations
Allowed use of NSLP eligibility data to administer and enforce Title I subgroup requirements
Urged school officials to establish a memorandum of understanding among all involved parties (school lunch administration and education officials) ED & USDA Joint Guidance on Title I uses of NLSP data<br>
slide42. February 20, 2003
Focused upon impact of Provision 2 and Provision 3 when using NSLP data within administration of Title I requirements
“We have determined that, for purposes of disaggregating assessment data and for identifying students as "economically disadvantaged" in implementing supplemental educational services and the priority for public school choice, school officials may deem all students in Provision 2 and 3 schools as "economically disadvantaged."
“In addition, when determining Title I eligibility and allocations for a Provision 2 or 3 school, LEA officials may assume that the school has the same percentage of students eligible for free and reduced price lunches as it had in the most recent year for which the school collected that information.” ED & USDA Joint Guidance on Title I uses of NLSP data<br>
slide43. Significant aspects of CEO for educational use of NSLP data:
CEO will allow schools to certify eligibility for free and reduced-priced lunches once every four years.
CEO schools will use only “direct certification” data
“An LEA may treat the CEO school the same as it treats a Provision 2 or Provision 3 school. Accordingly the economically disadvantaged subgroup in a CEO school would be the same as the “all students” group”
When calculating Title I fund eligibility/priority “An LEA must assume that the percentage of economically disadvantaged students in the school is proportionate to the percentage of meals for which that CEO school is reimbursed for free meals by the USDA for the same school year.”
Source: 2011 ED letter to Chief State School Officers in CEO states 43 Community Eligibility Option (CEO)<br>
slide44. Reported percentage of “NSLP eligible” students within a school is becoming a less accurate representation of poverty within the individual school
Data to determine “Within-District Title I Allocation” are not the same as data on “Economically Disadvantaged” students under Title I – even if using NSLP eligibility for both
States or districts may be implementing new collections on poverty that shift burden from NLSP administration to ED-related program administration 44 Implications on continued use of NSLP data within education<br>
slide45. NCES has been studying possible alternatives to NSLP eligibility
CEO states are only now beginning to look into the impact on the usefulness of NSLP data within educational program administration
Provision 4 will be used by more states
ED is actively seeking input from the Forum and other groups on the continued use of these data 45 Next steps for using NSLP data within education<br>
slide46. MICHIGAN State Perspective on the USDA Direct Certification Program and the Community Eligibility Option<br>
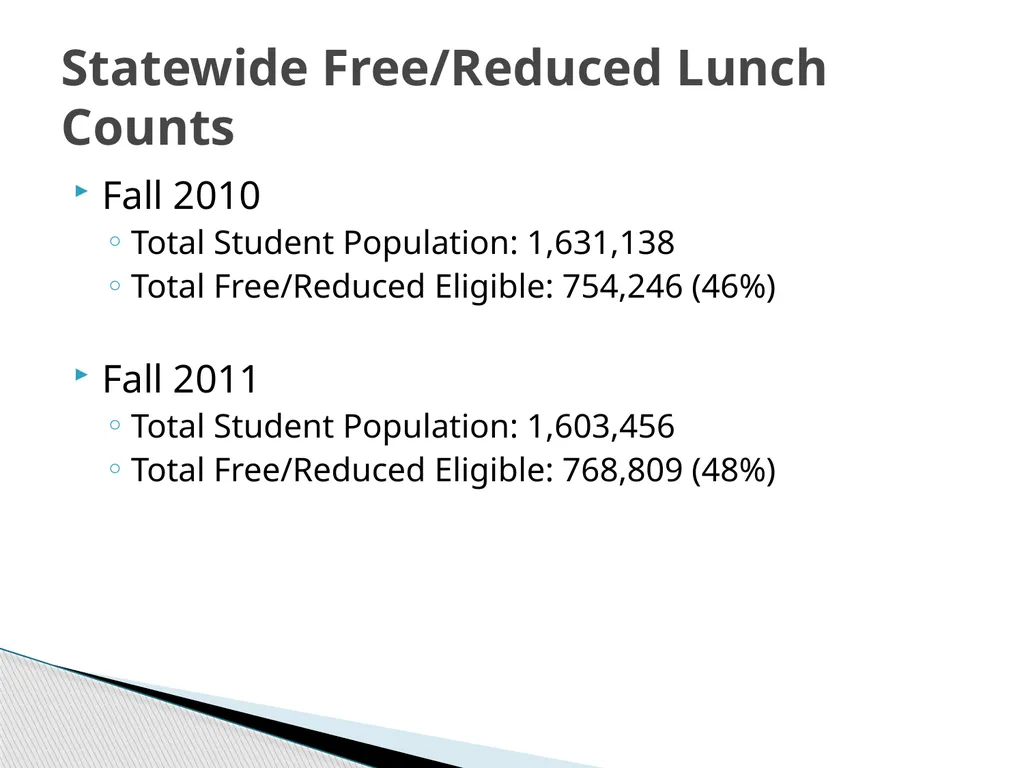
slide47. Statewide Free/Reduced Lunch Counts Fall 2010
Total Student Population: 1,631,138
Total Free/Reduced Eligible: 754,246 (46%)
Fall 2011
Total Student Population: 1,603,456
Total Free/Reduced Eligible: 768,809 (48%)<br>
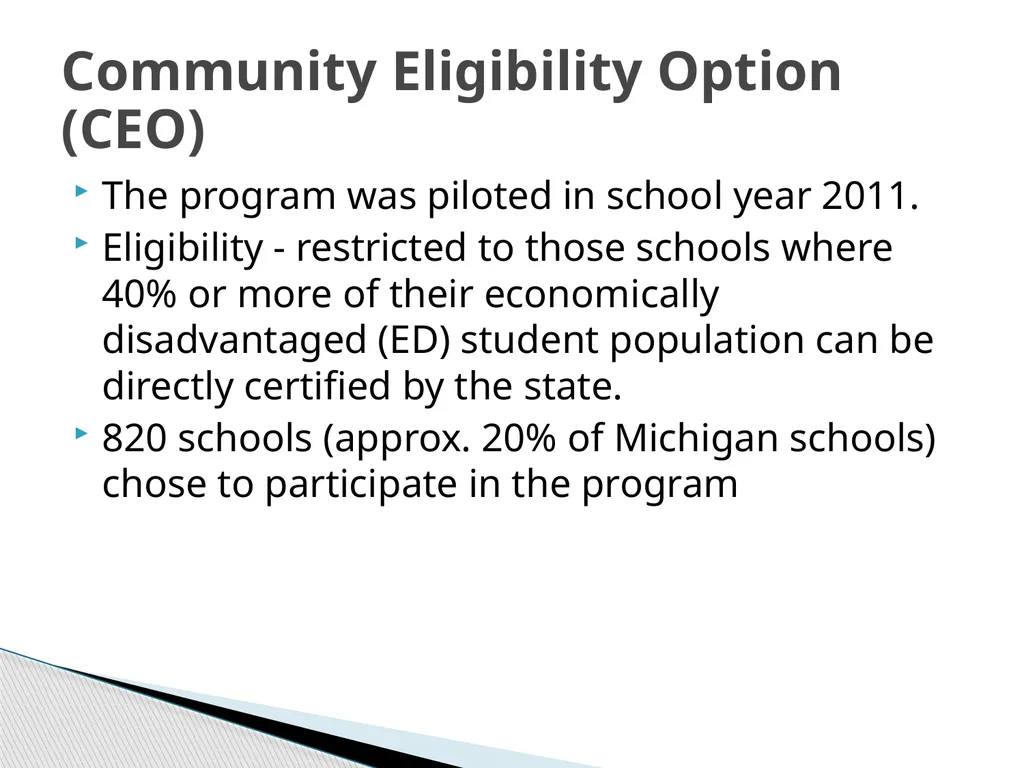
slide48. Community Eligibility Option (CEO) The program was piloted in school year 2011.
Eligibility - restricted to those schools where 40% or more of their economically disadvantaged (ED) student population can be directly certified by the state.
820 schools (approx. 20% of Michigan schools) chose to participate in the program<br>
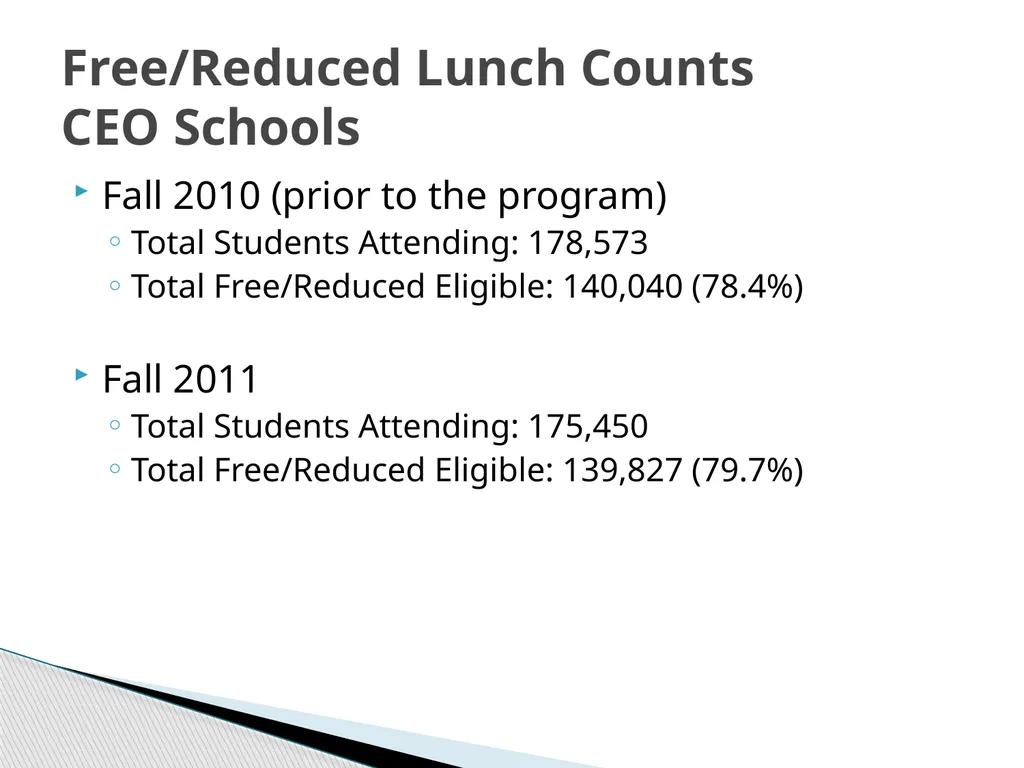
slide49. Free/Reduced Lunch Counts CEO Schools Fall 2010 (prior to the program)
Total Students Attending: 178,573
Total Free/Reduced Eligible: 140,040 (78.4%)
Fall 2011
Total Students Attending: 175,450
Total Free/Reduced Eligible: 139,827 (79.7%)<br>
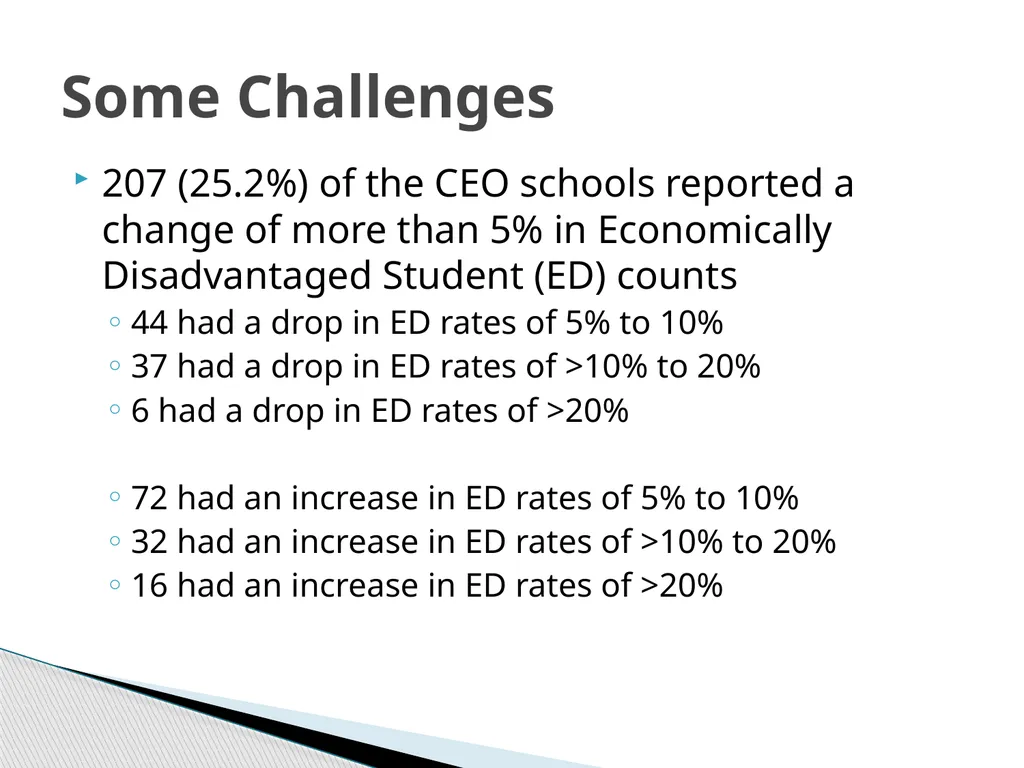
slide50. Some Challenges 207 (25.2%) of the CEO schools reported a change of more than 5% in Economically Disadvantaged Student (ED) counts
44 had a drop in ED rates of 5% to 10%
37 had a drop in ED rates of >10% to 20%
6 had a drop in ED rates of >20%
72 had an increase in ED rates of 5% to 10%
32 had an increase in ED rates of >10% to 20%
16 had an increase in ED rates of >20%<br>
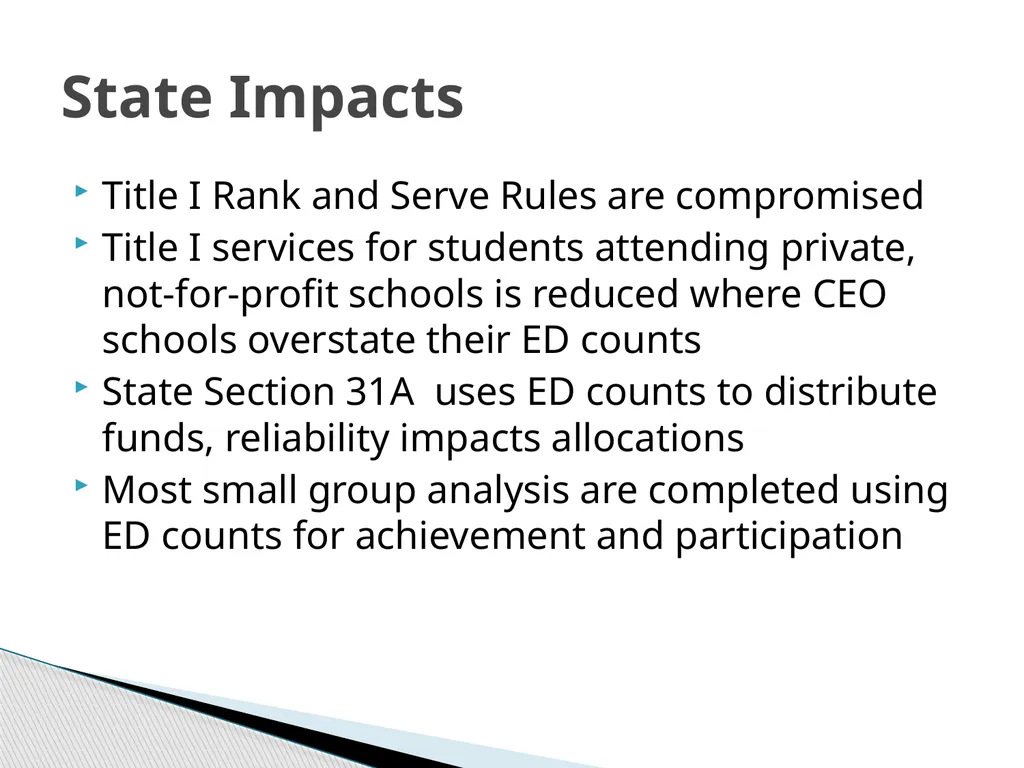
slide51. State Impacts Title I Rank and Serve Rules are compromised
Title I services for students attending private, not-for-profit schools is reduced where CEO schools overstate their ED counts
State Section 31A uses ED counts to distribute funds, reliability impacts allocations
Most small group analysis are completed using ED counts for achievement and participation<br>
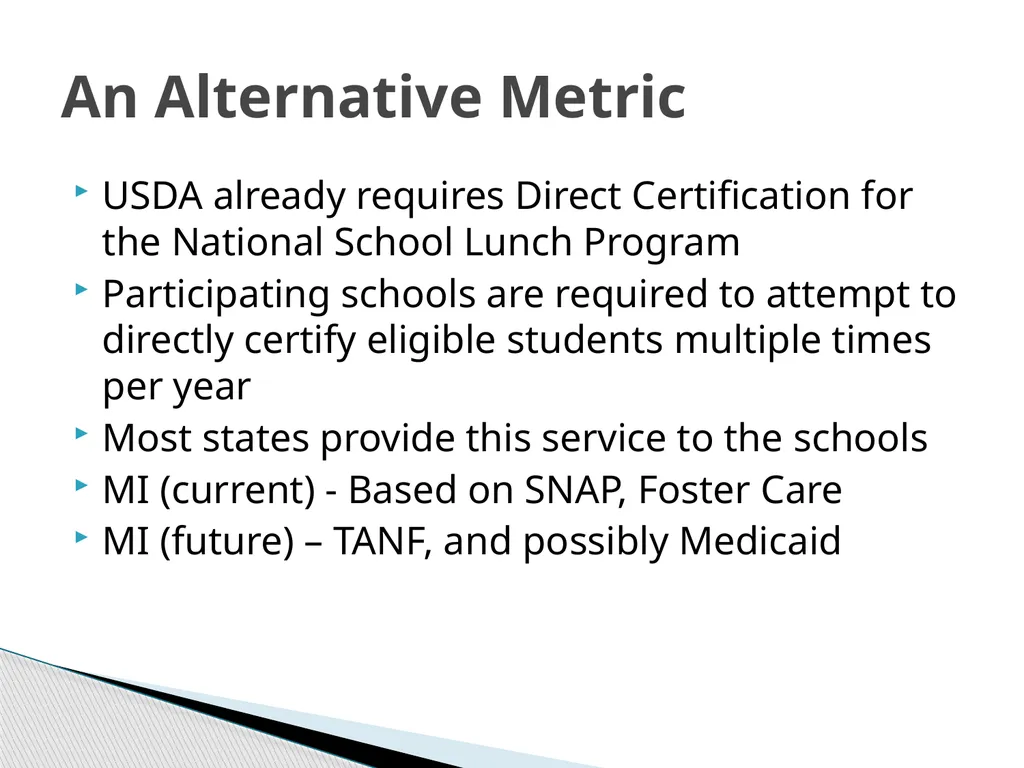
slide52. An Alternative Metric USDA already requires Direct Certification for the National School Lunch Program
Participating schools are required to attempt to directly certify eligible students multiple times per year
Most states provide this service to the schools
MI (current) - Based on SNAP, Foster Care
MI (future) – TANF, and possibly Medicaid<br>
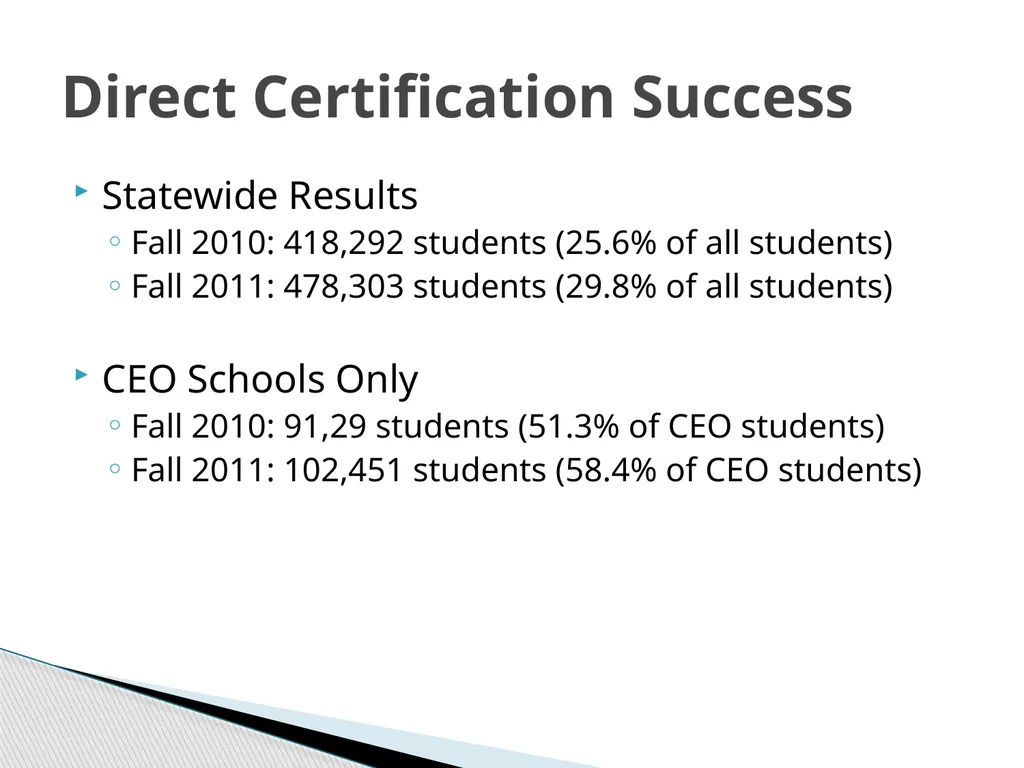
slide53. Direct Certification Success Statewide Results
Fall 2010: 418,292 students (25.6% of all students)
Fall 2011: 478,303 students (29.8% of all students)
CEO Schools Only
Fall 2010: 91,29 students (51.3% of CEO students)
Fall 2011: 102,451 students (58.4% of CEO students)<br>
slide54. Kentucky
Districts: 176
CEO Districts (11-12): 18
JCPS
Enrollment: 100,193
% Fee/Reduced Lunch: 61.8
Meal Sites: 147
Sites Eligible for CEO: 91
As of Today JCPS has not selected CEO option<br>
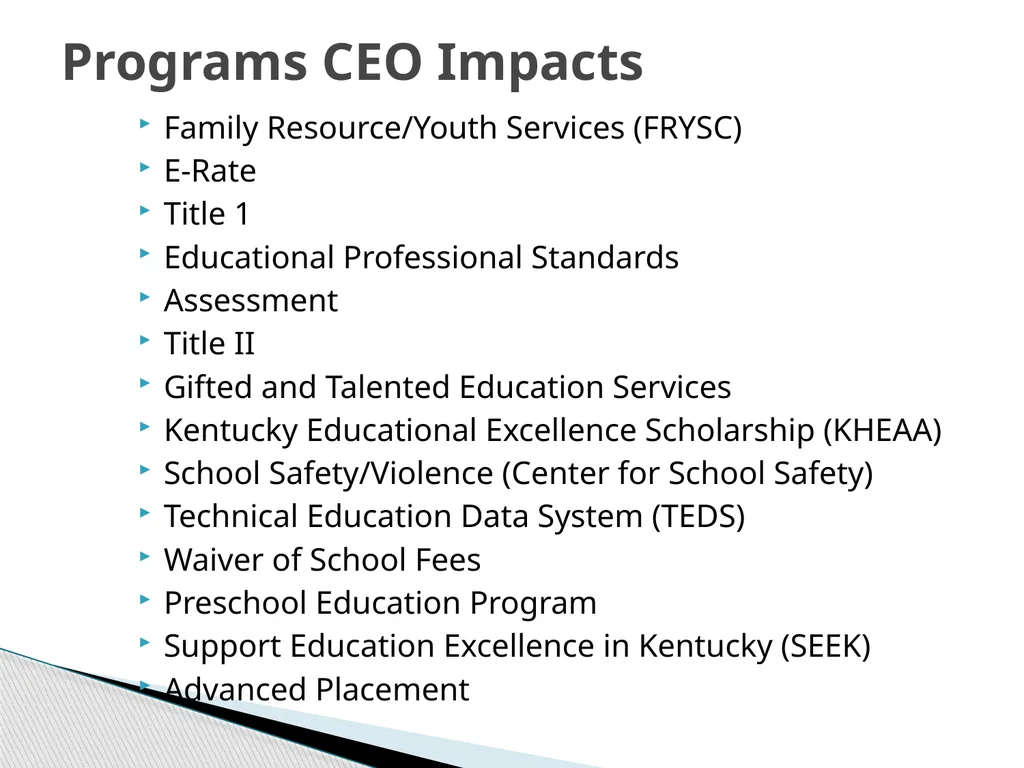
slide55. Programs CEO Impacts Family Resource/Youth Services (FRYSC)
E-Rate
Title 1
Educational Professional Standards
Assessment
Title II
Gifted and Talented Education Services
Kentucky Educational Excellence Scholarship (KHEAA)
School Safety/Violence (Center for School Safety)
Technical Education Data System (TEDS)
Waiver of School Fees
Preschool Education Program
Support Education Excellence in Kentucky (SEEK)
Advanced Placement<br>
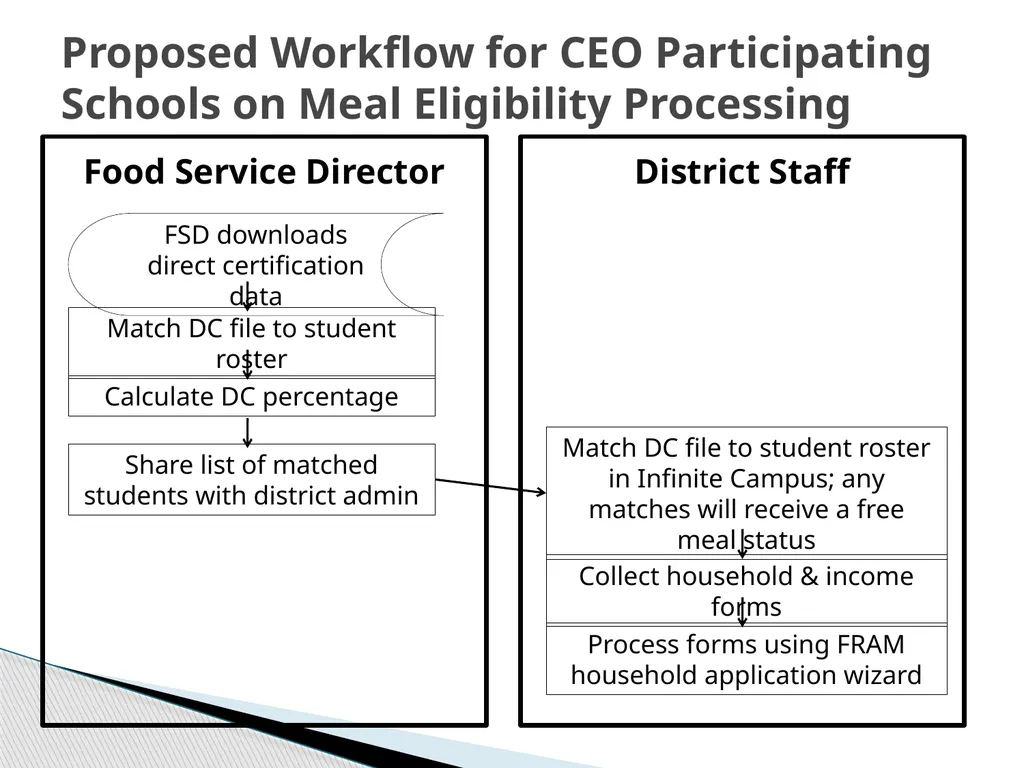
slide56. Proposed Workflow for CEO Participating Schools on Meal Eligibility Processing Food Service Director District Staff FSD downloads direct certification data Match DC file to student roster Calculate DC percentage Share list of matched students with district admin Match DC file to student roster in Infinite Campus; any matches will receive a free meal status Collect household & income forms Process forms using FRAM household application wizard<br>
slide57. JCPS Concerns Who / Cost
Student Assignment / Choice
Student Mobility<br>
slide2. Introduction Free & Reduced Price Meal (FRPM) data are collected on behalf of the U.S. Department of Agriculture to provide nutritional meals to children in need.
re-purposed by Education as a poverty indicator
NSLP changes will impact the FRPM data collection
The Departments of Agriculture and Education are partnering to identify and address challenges.<br>
slide3. Panelists Kathy Gosa, Kansas State Department of Education
Julie Brewer, Chief, Policy and Program Development Branch, Child Nutrition Division, Food and Nutrition Service, U.S. Department of Agriculture
Lily Clark, Senior Policy Advisor, Office of Planning, Evaluation, and Policy Development, U.S. Department of Education
Ross Santy, EdFacts Director, Deputy Assistant Secretary for Data and Information, Office of Planning, Evaluation, and Policy Development, U.S. Department of Education
Tom Howell, Michigan Center for Educational Performance and Information
Robert Rodosky, Jefferson County Public Schools (KY)<br>
slide4. Julie Brewer National School Lunch Program
Program Eligibility<br>
slide5. Agenda National School Lunch Program (NSLP) Basics
Application Process
Categorical Eligibility
Direct Certification
Disclosure
Provisional Schools
Community Eligibility Option<br>
slide6. NSLP Basics The NSLP is a federally assisted meal program that provides nutritionally balanced, low-cost or free lunches to children each school day.<br>
slide7. NSLP Administration Schools – more than 100,000 School Food Authorities – nearly 21,000 State Agencies - 56 FNS Headquarters
Alexandria, VA FNS Regions - 7<br>
slide8. Federal Income Guidelines Children from families whose income equals 130 percent of poverty or less are eligible for free meals
Children from families whose income equals between 131 and 185 percent of poverty are eligible for reduced price meals<br>
slide9. Application Process Household Application
Completed at home
Self-declaration of income or other status
Beginning of the school year (August/September)
Provides information on household income and size<br>
slide10. Income and Household Size Income
before any deductions (such as taxes, Social Security taxes, insurance premiums, charitable contributions and bonds)
Household
a group of related or non-related people living under one roof as one economic unit<br>
slide11. Verification Basics Local responsibility, though the State may conduct the process
Use number of applications approved as of October 1 as pool
LEAs must verify a minimum number of applications by November 15 every year<br>
slide12. SNAP and TANF Categorical Eligibility Children in households receiving assistance under SNAP and in some states TANF or FDPIR are eligible for NSLP free meals<br>
slide13. Categorical Eligibility: Migrant, Runaway or Homeless Children Migrant children in the Migrant Education Program
Children covered under the provisions of the Runaway and Homeless Youth Act
Homeless children under the McKinney-Vento Act
Head Start children
Foster children under the care of a State/local welfare agency or court<br>
slide14. The process by which schools certify eligible children using data from other assistance programs
States can match data either at the State or District level Direct Certification<br>
slide15. Direct Certification Mandatory for SNAP
SNAP, TANF or FDPIR officials relay documentation to schools that a child is part of a household certified to get those benefits
Documentation may include:
Name of child
A certifying statement
Identifiers (e.g., SSN and DOB)
Signature of program official
Date<br>
slide16. Advantages of Direct Certification No applications; easier for households and schools
Increases program access
Enhances accuracy of the eligibility process<br>
slide17. Direct Certification Medicaid Pilot Demonstration Projects in selected States and SFAs
Phased in starting with School Year 2012-13
Purpose of demonstration: To determine potential of direct certification with Medicaid to:
Reach eligible, uncertified children
Directly certify children who are free based on an application
To provide an estimate of the effect on Federal costs and participation<br>
slide18. Provision 1 Simplified Application Process Schools where 80% of students eligible for free and reduced price
Children eligible for FREE meals are certified every 2 years
Reduced and paid households apply for meal benefits annually<br>
slide19. Provision 2 Simplified Counting & Claiming No minimum % of free or reduced price
All student meals served at no charge
Base Year
Count daily meals by type
Claim reimbursement from these counts
SFA may delay implementation 1st claiming period
Subsequent Years
Count daily total meals
Claim reimbursement on base year percentages<br>
slide20. Provision 3 Simplified Counting & Claiming Allows schools to receive the same level of federal cash and commodity assistance each year, with some adjustments, for a 4-year period
No minimum % of free or reduced price<br>
slide21. Joint Guidance on Provision 2 & 3 February 20, 2003-USDA and ED guidance
Allowed LEA officials to deem all students in Provision 2 and 3 schools as “economically disadvantaged”
More information can be found at: http://www.fns.usda.gov/cnd/Governance/prov-1-2-3/provision1_2_3.htm<br>
slide22. Community Eligibility Option (CEO) Section 104 (a) of the Healthy, Hunger Free Kids Act of 2010
An alternative to collecting household applications for free and reduced price meals in high poverty local educational agencies (LEA) and schools.
Eligible LEAs/schools agree to serve all students free lunches and breakfasts for 4 successive school years. 22<br>
slide23. Who is eligible to elect the CEO? LEAs may elect the CEO for the entire district, individual schools, or a group of schools.
To be eligible; the LEA, individual school, or group of schools must have an identified student percentage of at least 40%.
Identified students are those certified for free meals NOT through individual household applications (example: directly certified through SNAP). 23<br>
slide24. How does the CEO work? The identified student percentage multiplied by a factor of 1.6 equals the percentage of total meals served reimbursed at the Federal free rate.
The remaining percentage of total meals is reimbursed at the Federal paid rate.
Any meal costs in excess of the total Federal reimbursement must be covered through non-Federal sources. 24<br>
slide25. How does the CEO work? LEA and schools run direct certification matches no later than April 1st of each year to obtain current counts of SNAP, TANF, and FDPIR participants.
Homeless, migrant youth, and foster children lists are matched no later than April 1st of each year to include in the identified student percentage.
Each year of the 4-year cycle, LEAs or schools may use the identified student percentage from the year prior to the first year or an updated identified student percentage from the prior year, whichever is higher. 25<br>
slide26. When is the CEO available? FNS selected three states for SY2011-12, four states for SY2012-13, and will select four states for SY2013-14.
Available nationwide starting in SY2014-2015.
LEAs and schools in Illinois, Kentucky, and Michigan implemented the Option in SY2011-2012 and the District of Columbia, New York, Ohio, and West Virginia will implement the Option in SY2012-2013. 26<br>
slide27. Disclosure and Privacy LEAs may disclose children’s free and reduced price meal eligibility information to programs, activities, and individuals that are specifically authorized access under the National School Lunch Act (NSLA) (42 U.S.C. 1758)
Disclosure is always an option, not a requirement<br>
slide28. Disclosure and Privacy Personal information may only be disclosed under select circumstances outlined in the NSLA (Sec. 9 (b)(6))
Examples include:
Disclosures to Federal, State, and local education programs (eligibility status only, parental consent required for local programs)
Disclosures to the Comptroller General of the United States for purposes of audit and examination (all eligibility information)
Disclosures to Federal, State, and local law enforcement officials investigating alleged criminal activity (all eligibility information)<br>
slide29. Comments or Questions<br>
slide30. FERPA & NSLA Privacy Protections NSLA’s and FERPA’s privacy protections are not fully aligned
USDA & ED recognize that there is confusion in the education field about under which circumstances disclosure under both statutes is allowed<br>
slide31. 2011 FERPA Regulations ED’s recent amendments to the FERPA regulations clarify the limited circumstances where SEAs and LEAs may disclose student information to assess the effectiveness of State and Federally-funded education programs<br>
slide32. 2011 FERPA Regulations: Joint Guidance As stated in our 2011 FERPA regulations:
“Because of the importance of assuring not only that FERPA requirements are met, but also that all of the Federal confidentiality protections in the National School Lunch Act are met, the two Departments intend to jointly issue guidance in the near future for use by the educational community and by State and local administrators of USDA programs.”<br>
slide33. Joint Guidance Update Ongoing meetings between USDA & ED
Plan to have joint guidance out before next Winter Forum meeting<br>
slide34. Joint Guidance Update Currently conducting a legal analysis of the two statutes to identify inconsistencies
Anticipate that joint guidance will clarify the use of FRPL data under FERPA’s audit/evaluation exception, reconciling:
Definitions of “education program”
Who has a “need to know” versus “legitimate educational interest”<br>
slide35. Help Inform the Joint Guidance Looking forward to receiving input from standing committees on the challenges your SEAs/LEAs face implementing overlapping USDA and ED requirements<br>
slide36. Uses of NSLP Data Across Education Ross Santy
Director, EDFacts
U.S. Department of Education 36<br>
slide37. The Common Core of Data (CCD) is ED’s primary database on public elementary and secondary education in the United States.
CCD’s objectives are to provide:
an official listing of public elementary and secondary schools and school districts in the nation, which can be used to select samples for other NCES surveys
basic information and descriptive statistics on public elementary and secondary schools 37 Use of NSLP Data: CCD<br>
slide38. The National Assessment of Educational Progress (NAEP) is the largest nationally representative and continuing assessment of what America’s students know and can do in various subject areas.
NAEP’s state assessment are administered across a representative sample of schools.
A national sample will have sufficient schools and students to yield data for public schools, each of the four NAEP regions of the country, as well as sex, race, degree of urbanization of school location, parent education and eligibility for the National School Lunch Program (NSLP). 38 Use of NSLP Data: NAEP<br>
slide39. 39 NAEP results are disaggregated by NLSP eligibility<br>
slide40. Funding Formulas (all four of them) use Census data to determine the number of poor children ages 5-17. NSLP data are not used here.
Many LEAs have historically used NSLP data for within district distributions of Title I funds
Accountability for student progress requires states to assess not only the progress of the LEA or school as a whole but also examine and report the progress of students by:
Major racial and ethnic groups
English proficiency
Disability
Economic status Uses of NSLP Data: Title I<br>
slide41. December 17, 2002
Recognized that for many LEAs NSLP data “is likely the best, and perhaps the only source of data available”
Priority for public school choice and eligibility for supplemental educational services must be established using the same data LEAS use for making within-district Title I allocations
Allowed use of NSLP eligibility data to administer and enforce Title I subgroup requirements
Urged school officials to establish a memorandum of understanding among all involved parties (school lunch administration and education officials) ED & USDA Joint Guidance on Title I uses of NLSP data<br>
slide42. February 20, 2003
Focused upon impact of Provision 2 and Provision 3 when using NSLP data within administration of Title I requirements
“We have determined that, for purposes of disaggregating assessment data and for identifying students as "economically disadvantaged" in implementing supplemental educational services and the priority for public school choice, school officials may deem all students in Provision 2 and 3 schools as "economically disadvantaged."
“In addition, when determining Title I eligibility and allocations for a Provision 2 or 3 school, LEA officials may assume that the school has the same percentage of students eligible for free and reduced price lunches as it had in the most recent year for which the school collected that information.” ED & USDA Joint Guidance on Title I uses of NLSP data<br>
slide43. Significant aspects of CEO for educational use of NSLP data:
CEO will allow schools to certify eligibility for free and reduced-priced lunches once every four years.
CEO schools will use only “direct certification” data
“An LEA may treat the CEO school the same as it treats a Provision 2 or Provision 3 school. Accordingly the economically disadvantaged subgroup in a CEO school would be the same as the “all students” group”
When calculating Title I fund eligibility/priority “An LEA must assume that the percentage of economically disadvantaged students in the school is proportionate to the percentage of meals for which that CEO school is reimbursed for free meals by the USDA for the same school year.”
Source: 2011 ED letter to Chief State School Officers in CEO states 43 Community Eligibility Option (CEO)<br>
slide44. Reported percentage of “NSLP eligible” students within a school is becoming a less accurate representation of poverty within the individual school
Data to determine “Within-District Title I Allocation” are not the same as data on “Economically Disadvantaged” students under Title I – even if using NSLP eligibility for both
States or districts may be implementing new collections on poverty that shift burden from NLSP administration to ED-related program administration 44 Implications on continued use of NSLP data within education<br>
slide45. NCES has been studying possible alternatives to NSLP eligibility
CEO states are only now beginning to look into the impact on the usefulness of NSLP data within educational program administration
Provision 4 will be used by more states
ED is actively seeking input from the Forum and other groups on the continued use of these data 45 Next steps for using NSLP data within education<br>
slide46. MICHIGAN State Perspective on the USDA Direct Certification Program and the Community Eligibility Option<br>
slide47. Statewide Free/Reduced Lunch Counts Fall 2010
Total Student Population: 1,631,138
Total Free/Reduced Eligible: 754,246 (46%)
Fall 2011
Total Student Population: 1,603,456
Total Free/Reduced Eligible: 768,809 (48%)<br>
slide48. Community Eligibility Option (CEO) The program was piloted in school year 2011.
Eligibility - restricted to those schools where 40% or more of their economically disadvantaged (ED) student population can be directly certified by the state.
820 schools (approx. 20% of Michigan schools) chose to participate in the program<br>
slide49. Free/Reduced Lunch Counts CEO Schools Fall 2010 (prior to the program)
Total Students Attending: 178,573
Total Free/Reduced Eligible: 140,040 (78.4%)
Fall 2011
Total Students Attending: 175,450
Total Free/Reduced Eligible: 139,827 (79.7%)<br>
slide50. Some Challenges 207 (25.2%) of the CEO schools reported a change of more than 5% in Economically Disadvantaged Student (ED) counts
44 had a drop in ED rates of 5% to 10%
37 had a drop in ED rates of >10% to 20%
6 had a drop in ED rates of >20%
72 had an increase in ED rates of 5% to 10%
32 had an increase in ED rates of >10% to 20%
16 had an increase in ED rates of >20%<br>
slide51. State Impacts Title I Rank and Serve Rules are compromised
Title I services for students attending private, not-for-profit schools is reduced where CEO schools overstate their ED counts
State Section 31A uses ED counts to distribute funds, reliability impacts allocations
Most small group analysis are completed using ED counts for achievement and participation<br>
slide52. An Alternative Metric USDA already requires Direct Certification for the National School Lunch Program
Participating schools are required to attempt to directly certify eligible students multiple times per year
Most states provide this service to the schools
MI (current) - Based on SNAP, Foster Care
MI (future) – TANF, and possibly Medicaid<br>
slide53. Direct Certification Success Statewide Results
Fall 2010: 418,292 students (25.6% of all students)
Fall 2011: 478,303 students (29.8% of all students)
CEO Schools Only
Fall 2010: 91,29 students (51.3% of CEO students)
Fall 2011: 102,451 students (58.4% of CEO students)<br>
slide54. Kentucky
Districts: 176
CEO Districts (11-12): 18
JCPS
Enrollment: 100,193
% Fee/Reduced Lunch: 61.8
Meal Sites: 147
Sites Eligible for CEO: 91
As of Today JCPS has not selected CEO option<br>
slide55. Programs CEO Impacts Family Resource/Youth Services (FRYSC)
E-Rate
Title 1
Educational Professional Standards
Assessment
Title II
Gifted and Talented Education Services
Kentucky Educational Excellence Scholarship (KHEAA)
School Safety/Violence (Center for School Safety)
Technical Education Data System (TEDS)
Waiver of School Fees
Preschool Education Program
Support Education Excellence in Kentucky (SEEK)
Advanced Placement<br>
slide56. Proposed Workflow for CEO Participating Schools on Meal Eligibility Processing Food Service Director District Staff FSD downloads direct certification data Match DC file to student roster Calculate DC percentage Share list of matched students with district admin Match DC file to student roster in Infinite Campus; any matches will receive a free meal status Collect household & income forms Process forms using FRAM household application wizard<br>
slide57. JCPS Concerns Who / Cost
Student Assignment / Choice
Student Mobility<br>