
NCHRP 25-25/Task 115 (Panel D2525115) Zero



Description: NCHRP 25-25Task 115 (Panel D2525115) Zero Emission Vehicles: Forecasting Fleet Scenarios and their Emissions Implications November 27, 2019 STI-7205 Research Agency: Louis Berger U.S. Inc. Sonoma Technology, Inc. (STI) 2 Garnet Erdakos,
Related Topics
Download Presentation
"NCHRP 25-25/Task 115 (Panel D2525115) Zero" is the property of its rightful owner. Permission is granted to download and print the materials on this website for personal, non-commercial use only, and to display it on your personal computer provided you do not modify the materials and that you retain all copyright notices contained in the materials. By downloading content from our website, you accept the terms of this agreement.
Presentation Transcript
slide1. NCHRP 25-25/Task 115
(Panel D2525115)
Zero Emission Vehicles: Forecasting Fleet Scenarios and their Emissions Implications November 27, 2019 STI-7205<br>
slide2. Research Agency: Louis Berger U.S. Inc. & Sonoma Technology, Inc. (STI) 2 Garnet Erdakos, PhD (Principal Investigator, STI)
Shih Ying Chang, PhD (STI)
Douglas Eisinger, PhD (Senior Advisor, STI)
Adrienne Heller, AICP, ENV SP (Louis Berger)
Heather Unger, LEED AP, ENV SP (Louis Berger) NCHRP Senior Program Officer Ann M. Hartell, PhD<br>
slide3. Author Acknowledgments 3 Colleen M. Turner, Maryland Department of Transportation
Rick Baker, Eastern Research Group, Inc.
Jeffrey R. Lidicker, California Air Resources Board
Jane Jie Lin, University of Illinois – Chicago
Natalie Ries, Minnesota Department of Transportation
Lubna Shoaib, East West Gateway Council of Government
Benjamin P. VanGessel, U.S. Environmental Protection Agency
John Davies, Federal Highway Administration (Liaison)
Melissa Savage, American Association of State Highway and Transportation Officials (Liaison) The research team also thanks Dr. Song Bai of the Bay Area Air Quality Management District for his input on the research approach used in this study. In addition, appreciation goes to John Davies of the U.S. Federal Highway Administration, Dr. Zhenhong Lin of the Oak Ridge National Laboratory, and Andrew Breck of the Volpe National Transportation Systems Center, for their assistance regarding use of the MA3T model.<br>
slide4. Project Tasks 4 Task 1: Amplified work plan
Task 2: Brief literature review
Task 3: Develop analysis scenarios
Task 4: Assess emissions reductions
Task 5: Project report Objective of this webinar: present the activities conducted for NCHRP 25-25 Task 115 and the emission reduction estimates in the analysis scenarios<br>
slide5. Outline 5 Key findings from the literature review
Rationale for using the MA3T model
Guiding principles for development and selection of scenarios
ZEV adoption scenarios
Modeled ZEV population increases
Modeled emissions reductions
Implications and future research suggestions<br>
slide6. Brief Literature Review to Support Modeling Scenario Development 6 Investigated use of the panel-recommended MA3T model and identified key inputs to guide the literature review
Reviewed various resources representing historical data, a variety of forecast resources, consumer preferences, policies, technology, infrastructure, and other topics
Identified key factors affecting adoption of all types of alternative technology vehicles (ATVs): battery electric vehicles (BEV), fuel-cell electric vehicles (FCEV), plug-in hybrid electric vehicles (PHEV), and hybrid electric vehicles (HEV).<br>
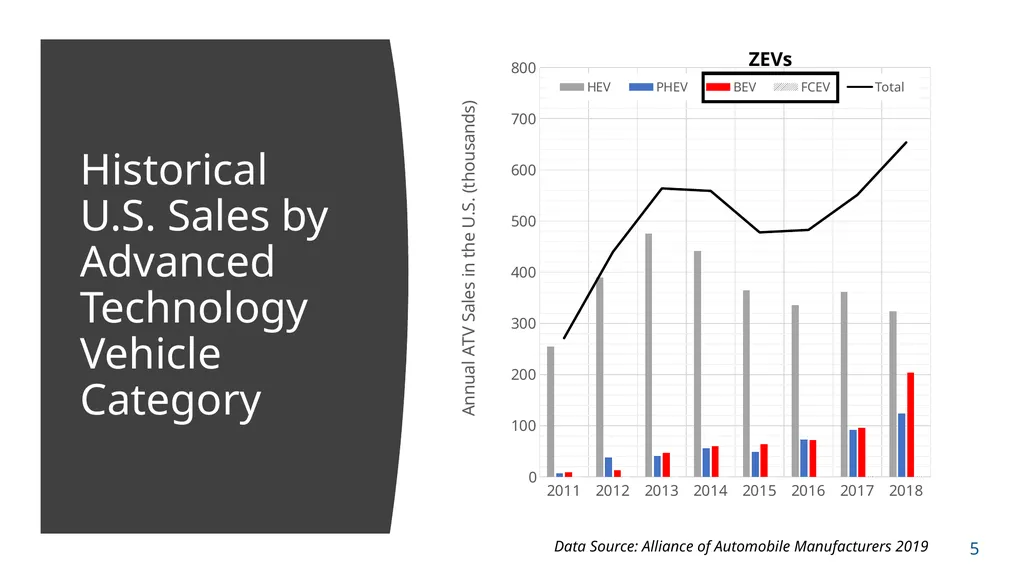
slide7. Historical U.S. Sales by Advanced Technology Vehicle Category Data Source: Alliance of Automobile Manufacturers 2019 5 ZEVs<br>
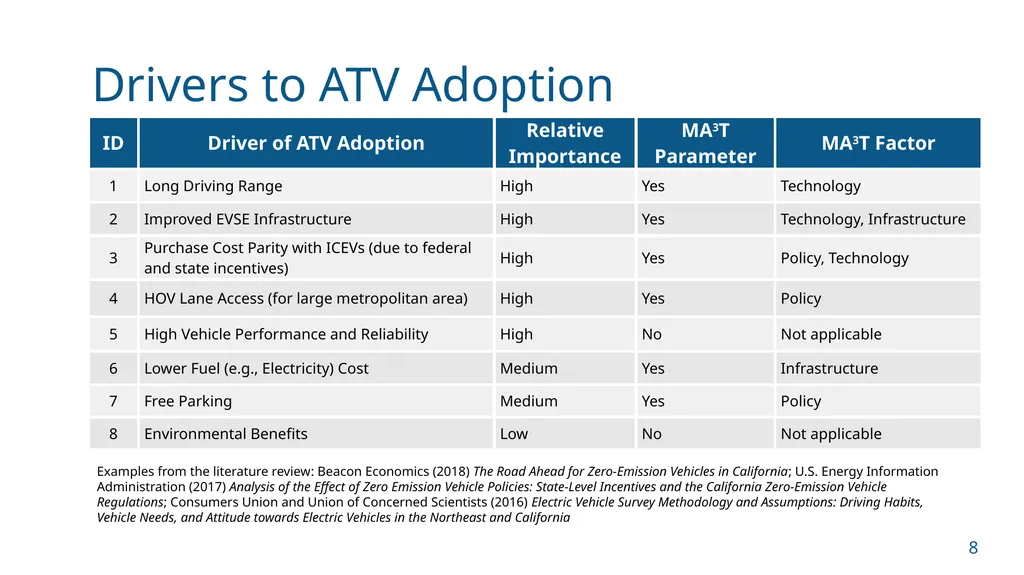
slide8. Drivers to ATV Adoption 8 Examples from the literature review: Beacon Economics (2018) The Road Ahead for Zero-Emission Vehicles in California; U.S. Energy Information Administration (2017) Analysis of the Effect of Zero Emission Vehicle Policies: State-Level Incentives and the California Zero-Emission Vehicle Regulations; Consumers Union and Union of Concerned Scientists (2016) Electric Vehicle Survey Methodology and Assumptions: Driving Habits, Vehicle Needs, and Attitude towards Electric Vehicles in the Northeast and California<br>
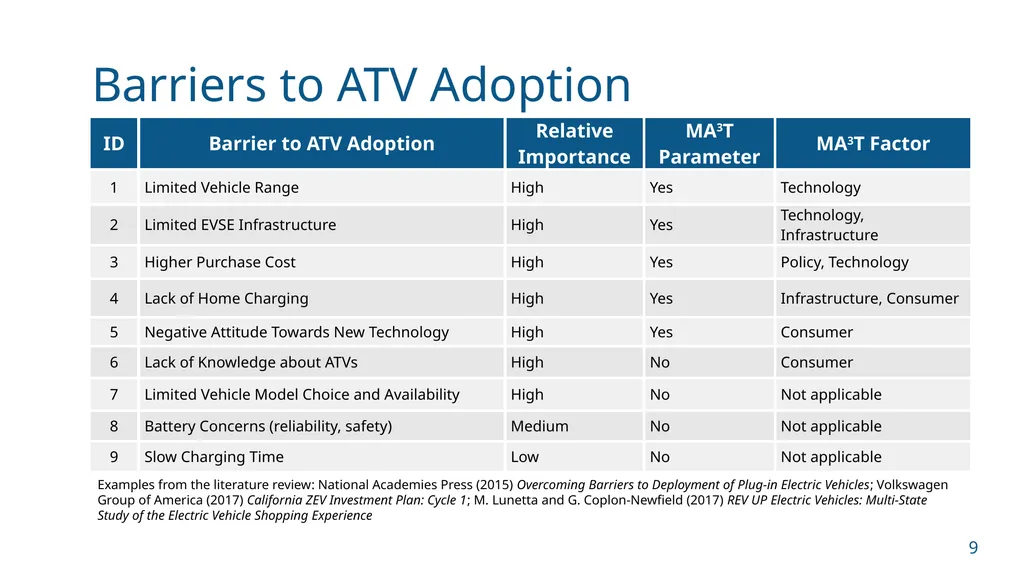
slide9. Barriers to ATV Adoption 9 Examples from the literature review: National Academies Press (2015) Overcoming Barriers to Deployment of Plug-in Electric Vehicles; Volkswagen Group of America (2017) California ZEV Investment Plan: Cycle 1; M. Lunetta and G. Coplon-Newfield (2017) REV UP Electric Vehicles: Multi-State Study of the Electric Vehicle Shopping Experience<br>
slide10. Overview of Analysis Methodology 10 Developed analysis approach to test the sensitivity of ZEV adoption to changes in key factors identified in the literature review
Based on the literature review findings and NCHRP panel input, the MA3T model developed by Oak Ridge National Laboratory (ORNL) was selected for use in the modeling analyses.
Assessed MA3T for comparable output results with other ZEV adoption data sources
Worked with Volpe (an MA3T user) and ORNL to understand the model’s strengths and limitations
Developed a sensitivity test strategy to leverage literature review findings and MA3T structure<br>
slide11. Overview of the MA3T Model 11 MA3T: Market Acceptance of Advanced Automotive Technologies model
A consumer choice model to predict light-duty ATV sales, population, and energy consumption
Includes multiple input parameters representing key factors affecting ATV adoption
Calibrated to total light-duty vehicle sales data from the 2019 Annual Energy Outlook (AEO) reference case<br>
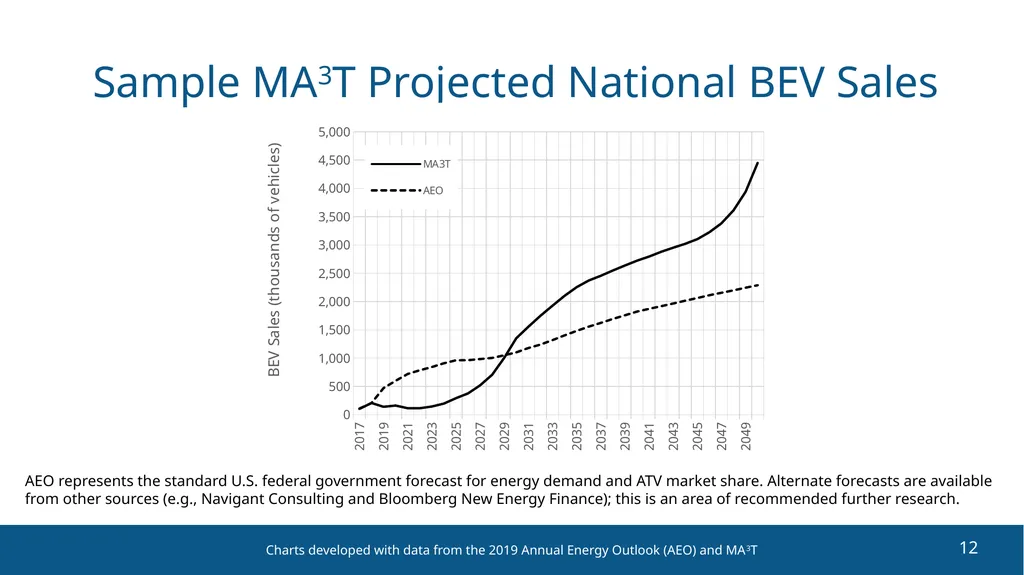
slide12. Charts developed with data from the 2019 Annual Energy Outlook (AEO) and MA3T 12 12 Sample MA3T Projected National BEV Sales AEO represents the standard U.S. federal government forecast for energy demand and ATV market share. Alternate forecasts are available from other sources (e.g., Navigant Consulting and Bloomberg New Energy Finance); this is an area of recommended further research.<br>
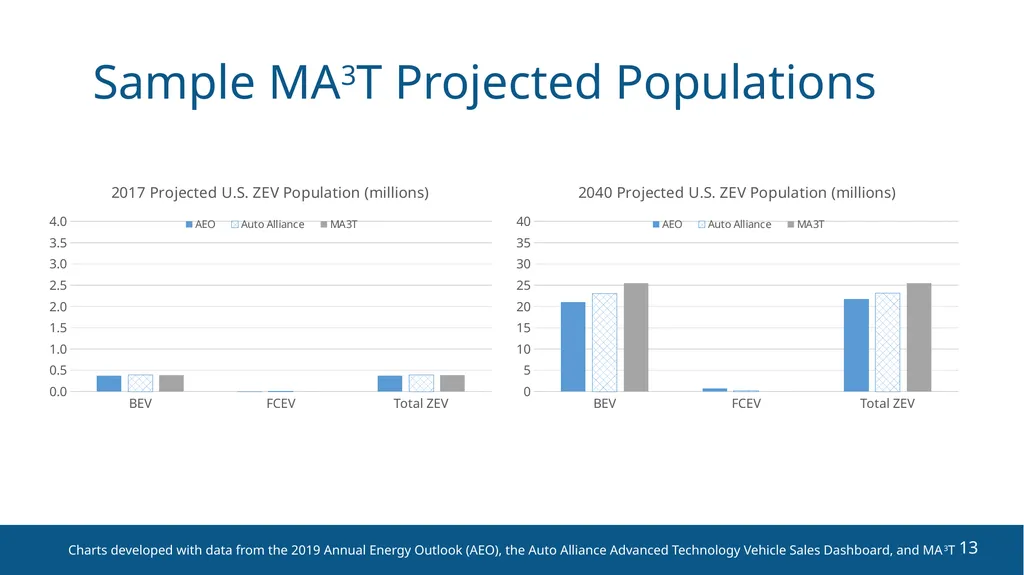
slide13. Charts developed with data from the 2019 Annual Energy Outlook (AEO), the Auto Alliance Advanced Technology Vehicle Sales Dashboard, and MA3T 13 13 Sample MA3T Projected Populations<br>
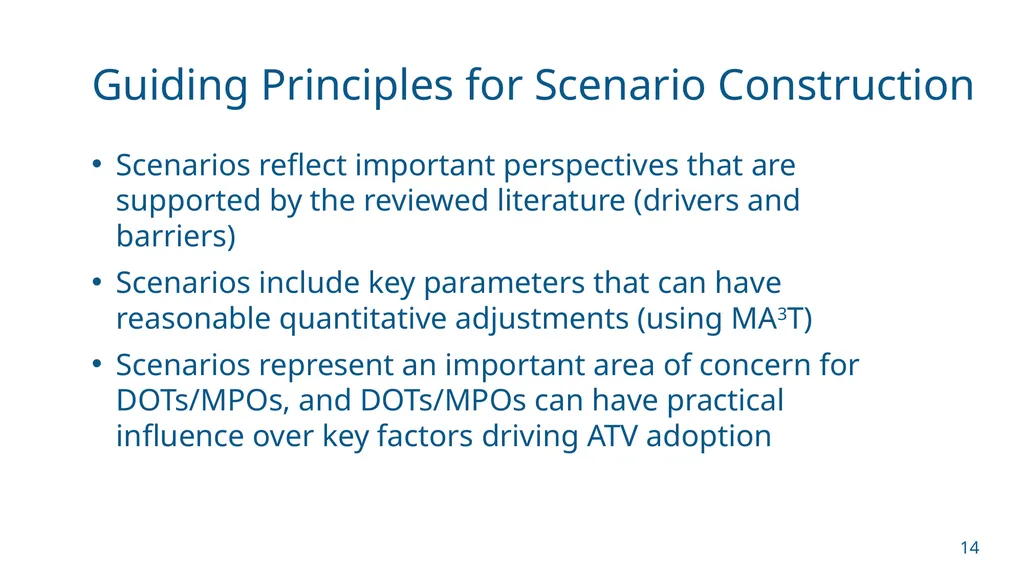
slide14. Guiding Principles for Scenario Construction 14 Scenarios reflect important perspectives that are supported by the reviewed literature (drivers and barriers)
Scenarios include key parameters that can have reasonable quantitative adjustments (using MA3T)
Scenarios represent an important area of concern for DOTs/MPOs, and DOTs/MPOs can have practical influence over key factors driving ATV adoption<br>
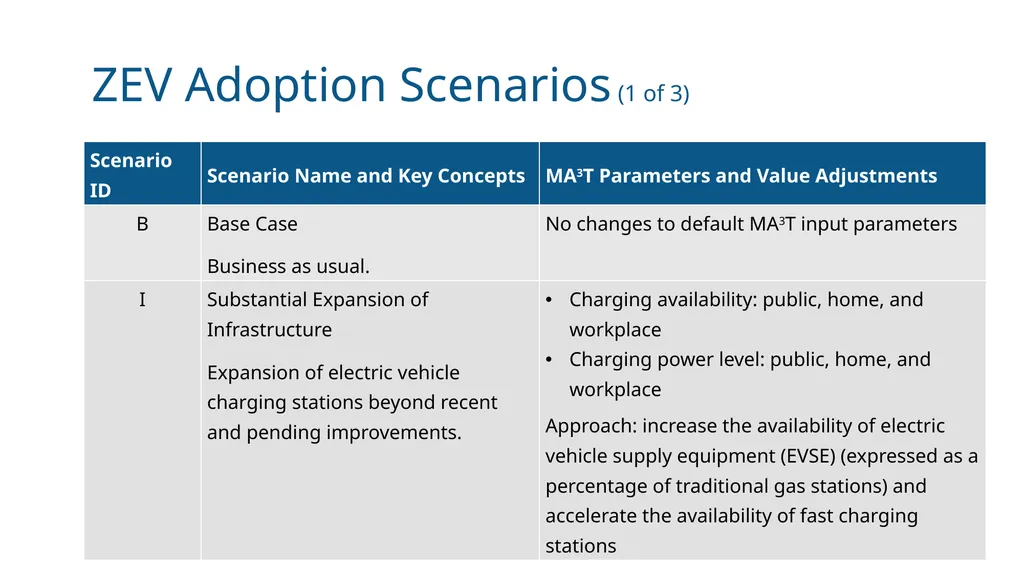
slide15. ZEV Adoption Scenarios (1 of 3) 15<br>
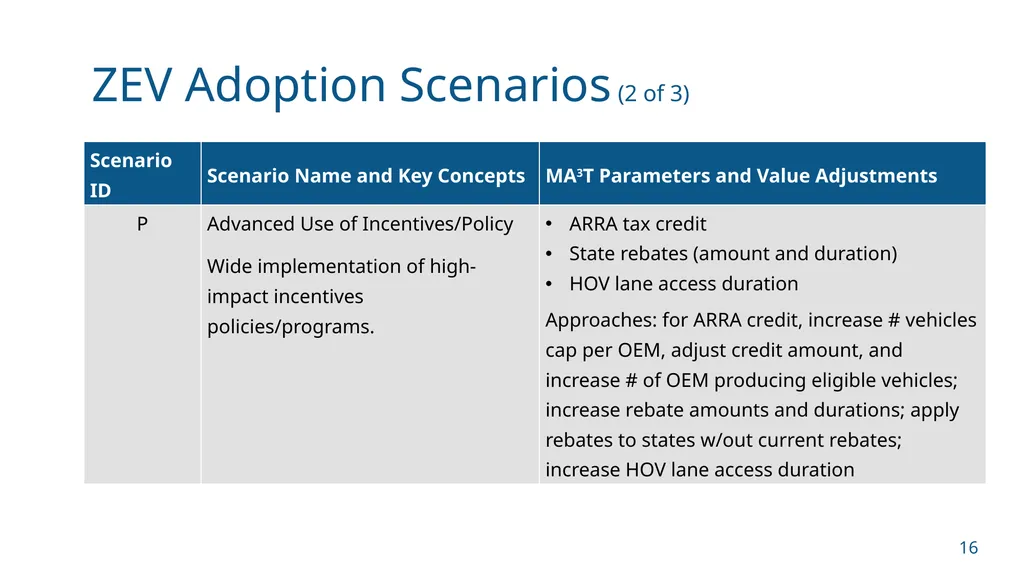
slide16. ZEV Adoption Scenarios (2 of 3) 16<br>
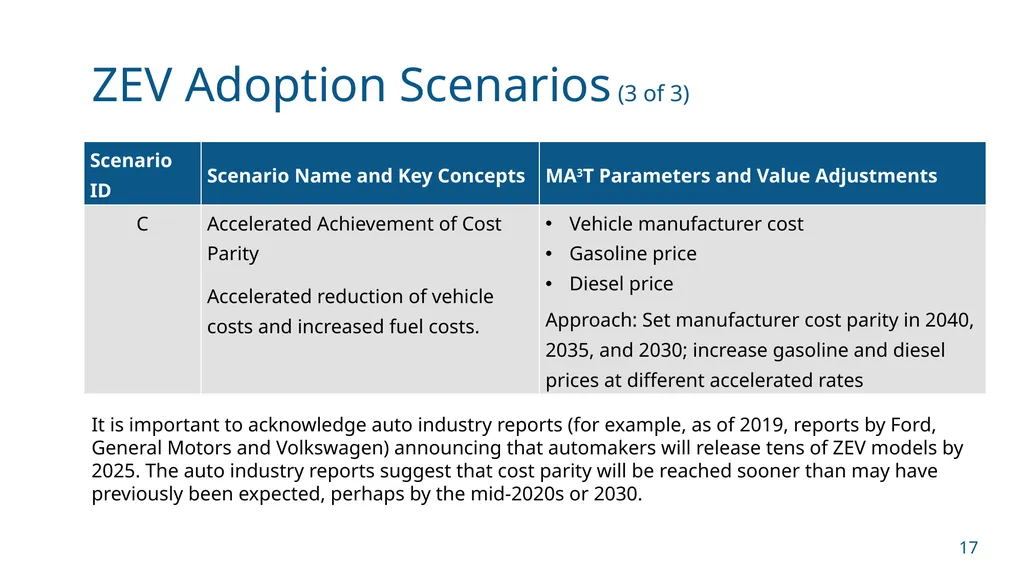
slide17. ZEV Adoption Scenarios (3 of 3) 17 It is important to acknowledge auto industry reports (for example, as of 2019, reports by Ford, General Motors and Volkswagen) announcing that automakers will release tens of ZEV models by 2025. The auto industry reports suggest that cost parity will be reached sooner than may have previously been expected, perhaps by the mid-2020s or 2030.<br>
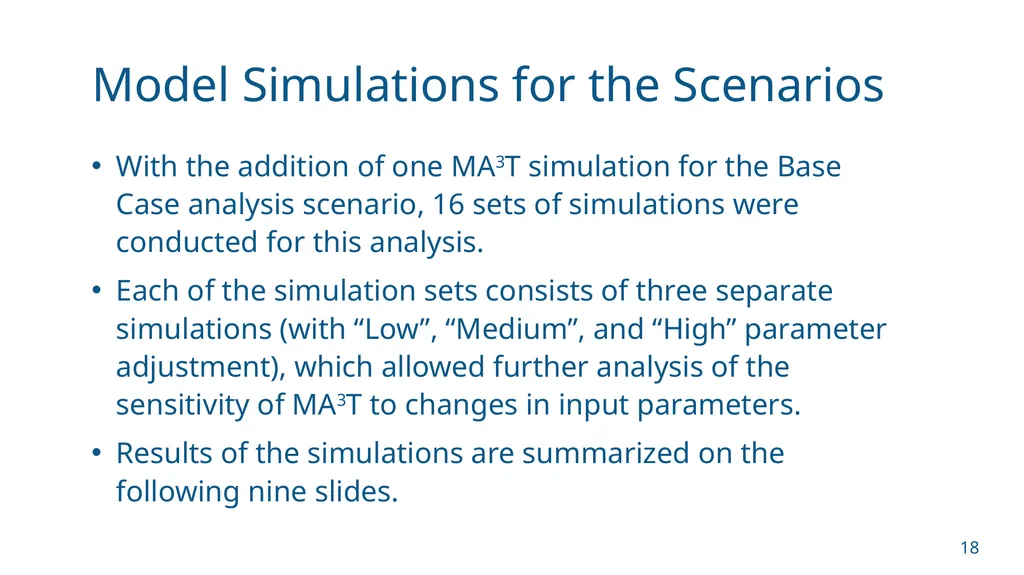
slide18. Model Simulations for the Scenarios 18 With the addition of one MA3T simulation for the Base Case analysis scenario, 16 sets of simulations were conducted for this analysis.
Each of the simulation sets consists of three separate simulations (with “Low”, “Medium”, and “High” parameter adjustment), which allowed further analysis of the sensitivity of MA3T to changes in input parameters.
Results of the simulations are summarized on the following nine slides.<br>
slide19. Results of the ZEV Adoption Scenario Simulations 19<br>
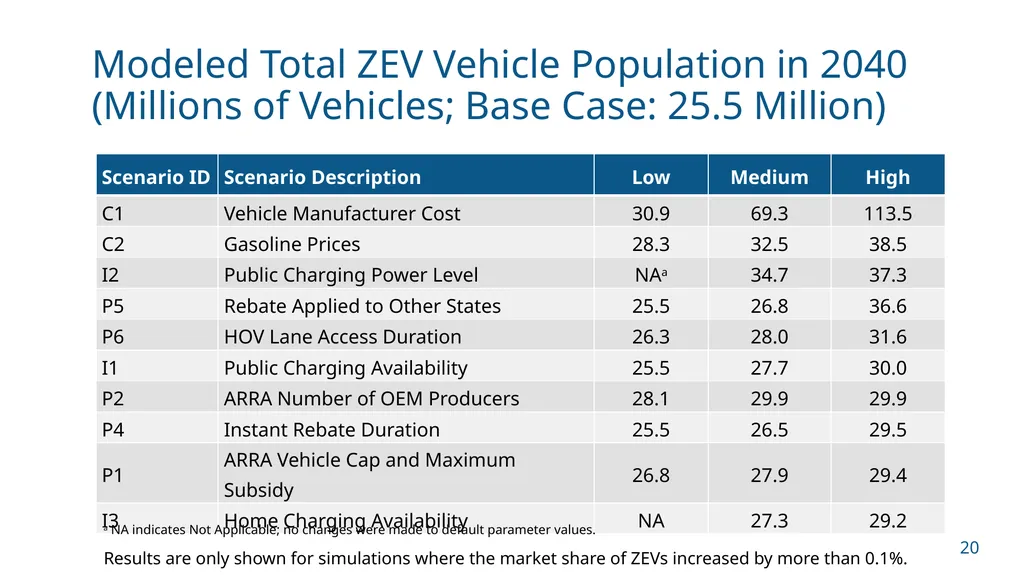
slide20. Modeled Total ZEV Vehicle Population in 2040 (Millions of Vehicles; Base Case: 25.5 Million) 20 a NA indicates Not Applicable; no changes were made to default parameter values. Results are only shown for simulations where the market share of ZEVs increased by more than 0.1%.<br>
slide21. Modeled Annual Light-Duty Vehicle Emissions Reductions in 2040 (Criteria Pollutants) (tons) 21 Results are only shown for simulations where the emissions decreased by 3% or more, except the HOV lane High case, which also had reductions of 3%.<br>
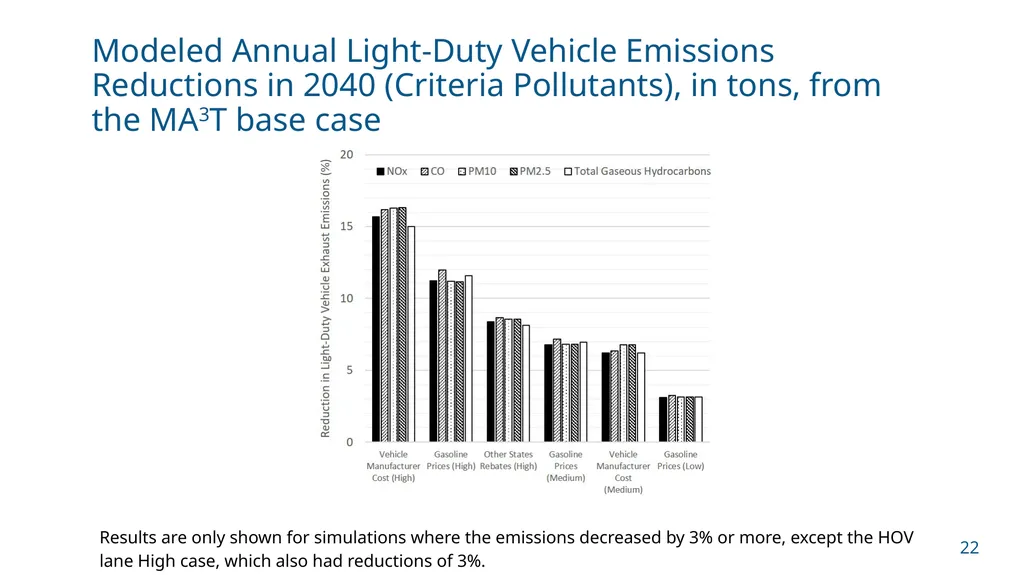
slide22. Modeled Annual Light-Duty Vehicle Emissions Reductions in 2040 (Criteria Pollutants), in tons, from the MA3T base case 22 Results are only shown for simulations where the emissions decreased by 3% or more, except the HOV lane High case, which also had reductions of 3%.<br>
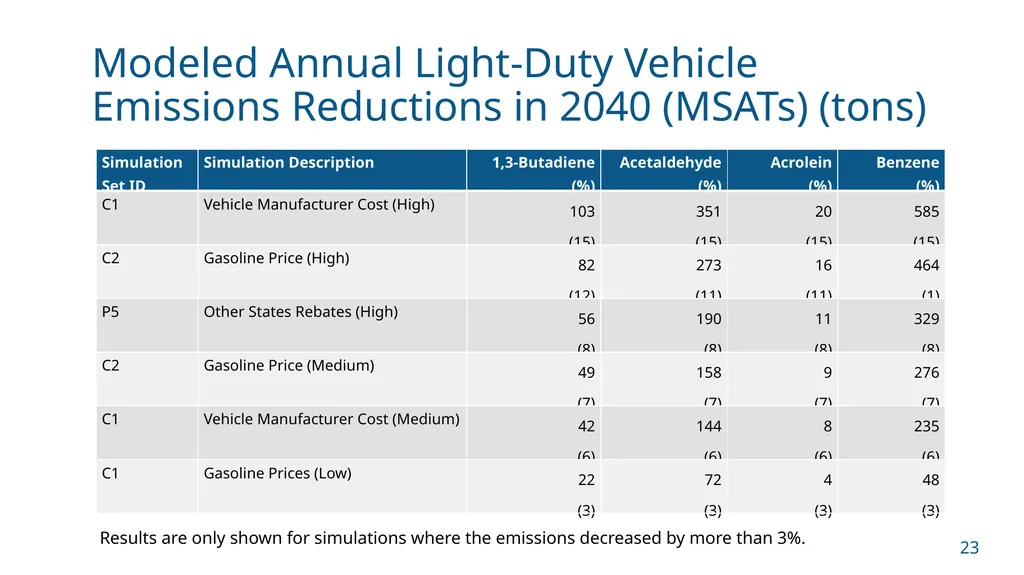
slide23. Modeled Annual Light-Duty Vehicle Emissions Reductions in 2040 (MSATs) (tons) 23 Results are only shown for simulations where the emissions decreased by more than 3%.<br>
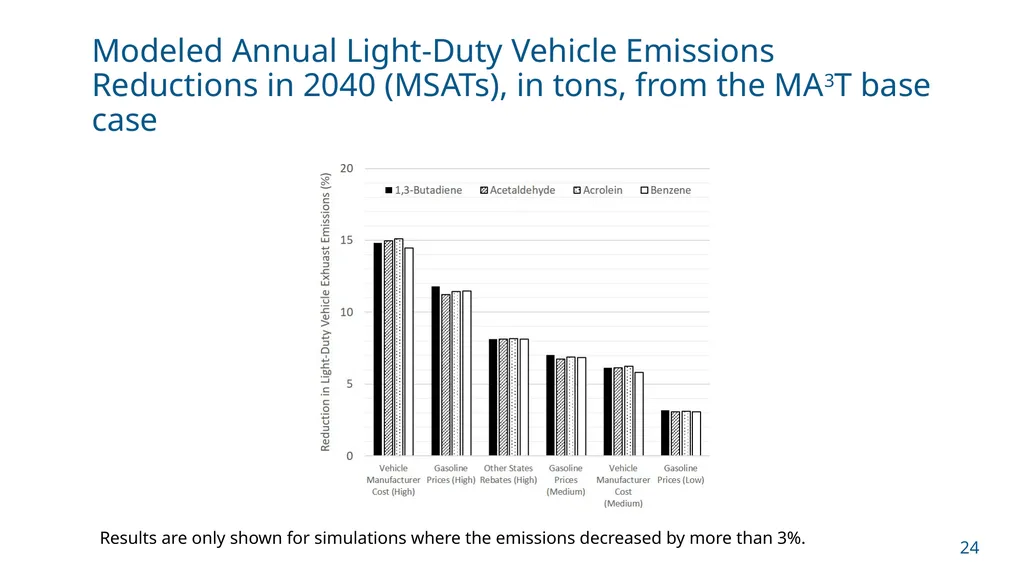
slide24. Modeled Annual Light-Duty Vehicle Emissions Reductions in 2040 (MSATs), in tons, from the MA3T base case 24 Results are only shown for simulations where the emissions decreased by more than 3%.<br>
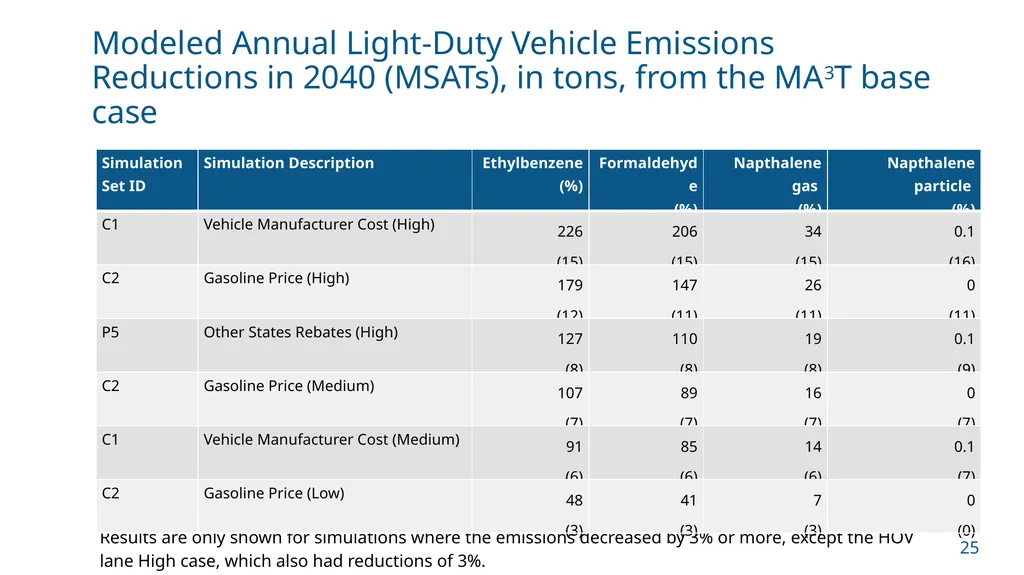
slide25. Modeled Annual Light-Duty Vehicle Emissions Reductions in 2040 (MSATs), in tons, from the MA3T base case 25 Results are only shown for simulations where the emissions decreased by 3% or more, except the HOV lane High case, which also had reductions of 3%.<br>
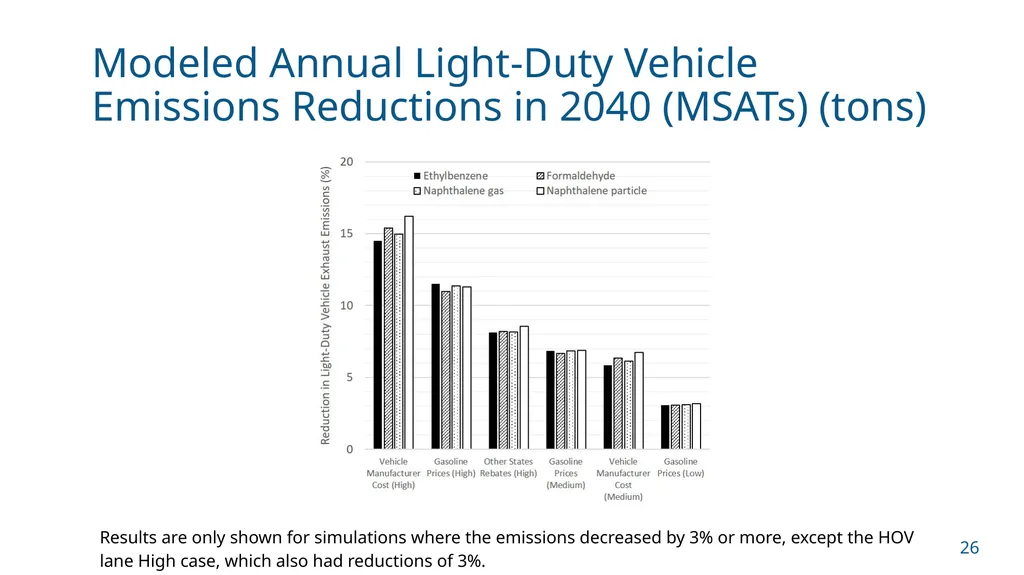
slide26. Modeled Annual Light-Duty Vehicle Emissions Reductions in 2040 (MSATs) (tons) 26 Results are only shown for simulations where the emissions decreased by 3% or more, except the HOV lane High case, which also had reductions of 3%.<br>
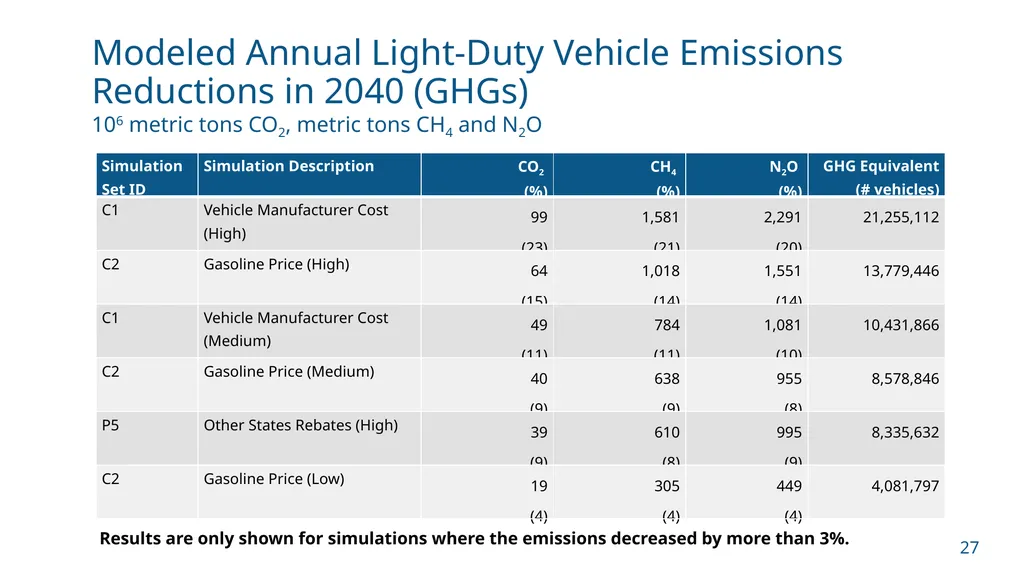
slide27. Modeled Annual Light-Duty Vehicle Emissions Reductions in 2040 (GHGs) 106 metric tons CO2, metric tons CH4 and N2O 27 Results are only shown for simulations where the emissions decreased by more than 3%.<br>
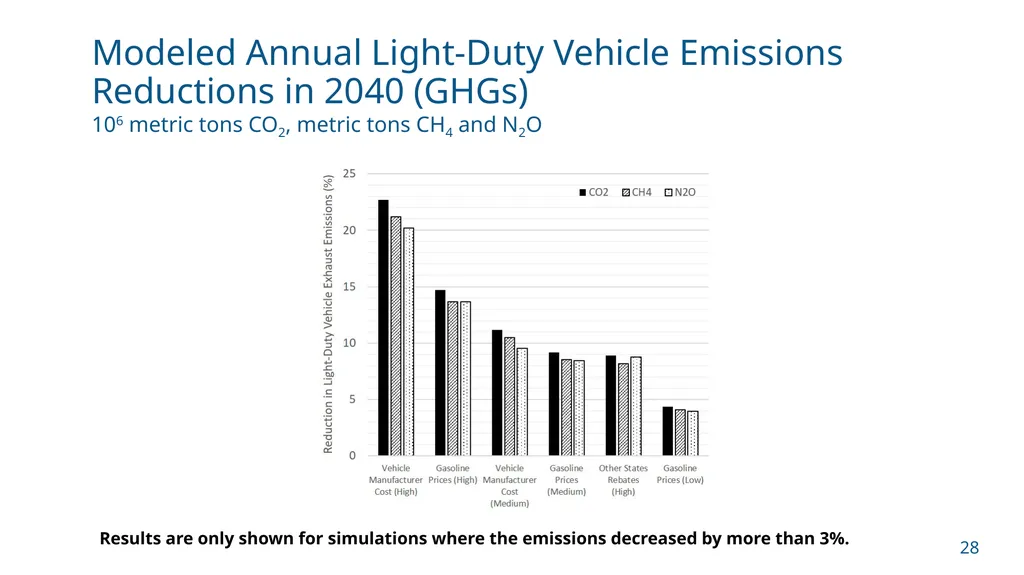
slide28. Modeled Annual Light-Duty Vehicle Emissions Reductions in 2040 (GHGs) 106 metric tons CO2, metric tons CH4 and N2O 28 Results are only shown for simulations where the emissions decreased by more than 3%.<br>
slide29. Implications (1 of 2) 29 The findings of this study suggest that, to support efforts to promote adoption of ZEVs, state DOTs and MPOs should consider the following (listed in order of importance):
Cost Parity simulations resulted in the greatest reductions of light-duty vehicle emissions.
The Incentive/Policy simulation with the application of a long-duration rebate to states without current rebates had the next highest reductions of light-duty vehicle emissions.
The high case of the HOV lane access simulations (HOV lane access from 2014‒2030) had the next highest emissions reductions.<br>
slide30. Implications (2 of 2) 30 Potential actions for DOTs and MPOs include the following:
Promoting advancement of policies that support ZEV adoption, such as reduced vehicle manufacturer costs of ZEVs, increased gasoline prices, and long-duration HOV lane access and rebate programs
Expanding infrastructure to support charging or fueling of ZEVs (e.g., deploy charging stations and install signage for directing drivers); for example, the California Department of Transportation (Caltrans) is building infrastructure to support widespread adoption of ZEVs1
Providing resources to address the need for consumer awareness and education; for example, the North Carolina Department of Transportation (NCDOT) includes promotion of public awareness and education about electric vehicles in their recent draft Zero-Emission Vehicle Plan2 1 https://dot.ca.gov/programs/sustainability
2 https://www.ncdot.gov/news/press-releases/Pages/2019/2019-08-22-ncdot-draft-zev-plan-released.aspx<br>
slide31. Suggestions for Future Research (1 of 5) 31 Because the emission reduction results in this study rely on outputs from the MA3T model, recommendations for further research focus on factors used by MA3T to modify ZEV fleet size.
Research into the influence of education programs would provide insight into programs and actions that fall well within many transportation agencies’ area of influence.
Research into the long-term influence of range anxiety, price factors, home charge availability, and other factors will also provide insight into how consumers might respond to important factors.<br>
slide32. Suggestions for Future Research (2 of 5) 32 Research into the manufacturer cost differences by ZEV size classes could improve the assumptions in MA3T as more large-class ZEVs come into the market.
MA3T needs to consider the influence of the “normalizing” of new electric vehicle technology for representing how consumers might behave once electric vehicles represent a large portion of the market (e.g., 40 percent or more); one of the MA3T model developers indicated that future updates to the model will include these factors if funding becomes available.<br>
slide33. Suggestions for Future Research (3 of 5) 33 As ZEVs become a larger portion of the light-duty vehicle fleet, there is potential for new policies that could offset positive incentives. Policies such as state-level increases in ZEV registration fees as a result of losses in gas taxes could be considered in future developments of the MA3T model.
The MA3T model is calibrated to the AEO forecast. Other forecasts, such as the Navigant Consulting forecast or the Bloomberg New Energy Finance forecast, project substantially greater ATV adoption. This is an area for further investigation, as calibrating the model to other forecasts would provide alternate outcomes.<br>
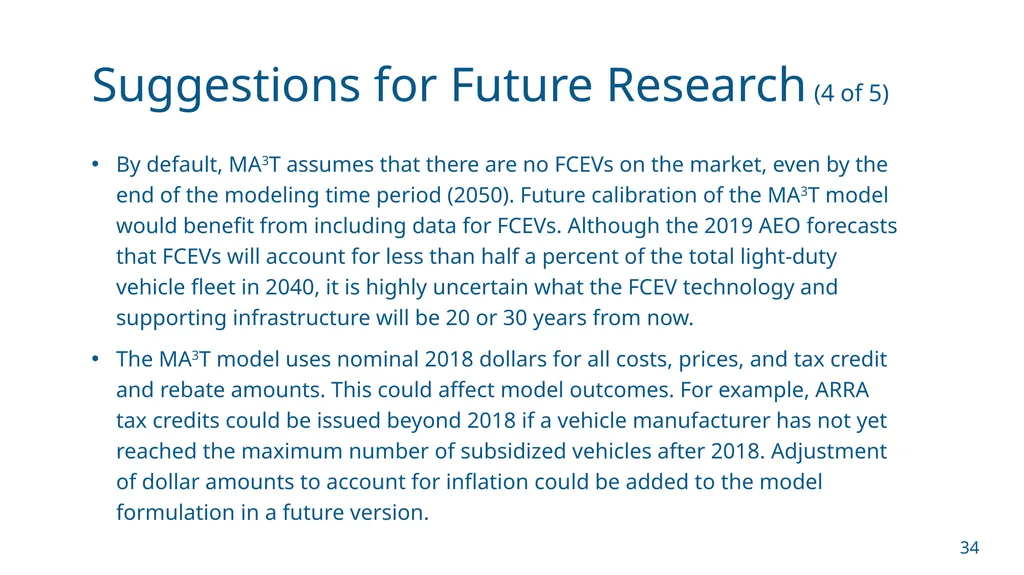
slide34. Suggestions for Future Research (4 of 5) 34 By default, MA3T assumes that there are no FCEVs on the market, even by the end of the modeling time period (2050). Future calibration of the MA3T model would benefit from including data for FCEVs. Although the 2019 AEO forecasts that FCEVs will account for less than half a percent of the total light-duty vehicle fleet in 2040, it is highly uncertain what the FCEV technology and supporting infrastructure will be 20 or 30 years from now.
The MA3T model uses nominal 2018 dollars for all costs, prices, and tax credit and rebate amounts. This could affect model outcomes. For example, ARRA tax credits could be issued beyond 2018 if a vehicle manufacturer has not yet reached the maximum number of subsidized vehicles after 2018. Adjustment of dollar amounts to account for inflation could be added to the model formulation in a future version.<br>
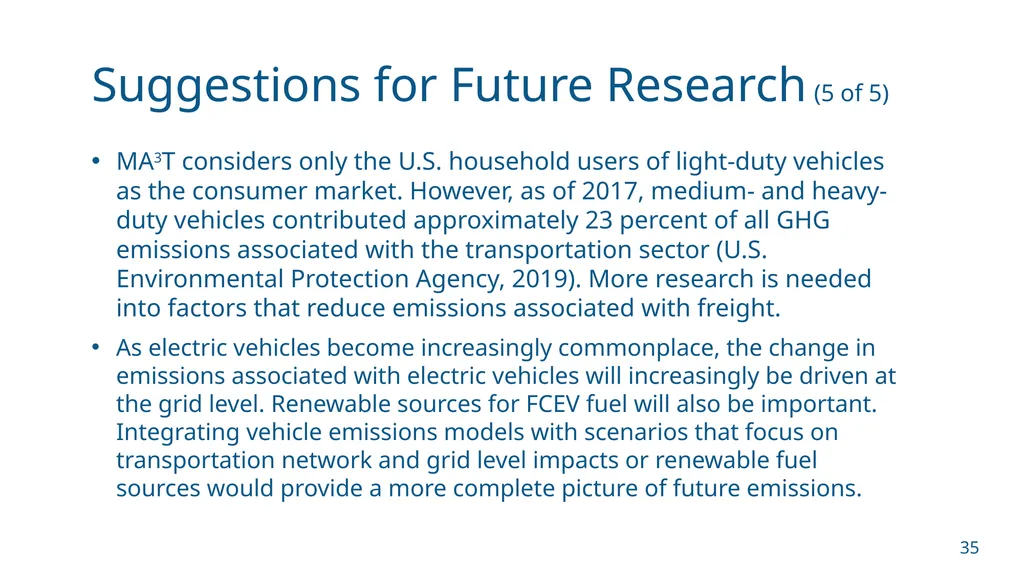
slide35. Suggestions for Future Research (5 of 5) 35 MA3T considers only the U.S. household users of light-duty vehicles as the consumer market. However, as of 2017, medium- and heavy-duty vehicles contributed approximately 23 percent of all GHG emissions associated with the transportation sector (U.S. Environmental Protection Agency, 2019). More research is needed into factors that reduce emissions associated with freight.
As electric vehicles become increasingly commonplace, the change in emissions associated with electric vehicles will increasingly be driven at the grid level. Renewable sources for FCEV fuel will also be important. Integrating vehicle emissions models with scenarios that focus on transportation network and grid level impacts or renewable fuel sources would provide a more complete picture of future emissions.<br>
slide36. For More Information 36 https://apps.trb.org/cmsfeed/TRBNetProjectDisplay.asp?ProjectID=4485<br>
slide37. Supplemental Slides 37<br>
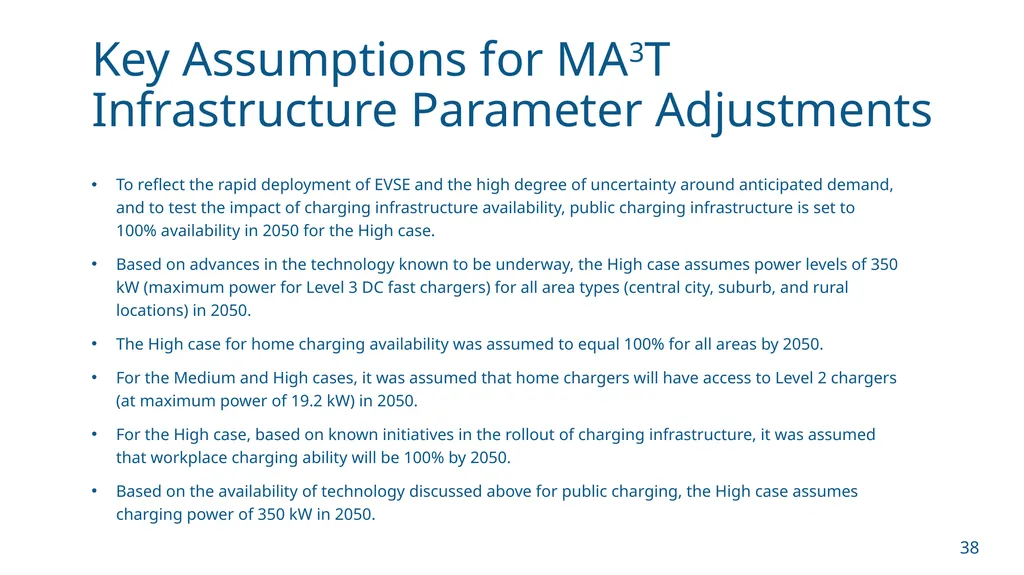
slide38. Key Assumptions for MA3T Infrastructure Parameter Adjustments 38 To reflect the rapid deployment of EVSE and the high degree of uncertainty around anticipated demand, and to test the impact of charging infrastructure availability, public charging infrastructure is set to 100% availability in 2050 for the High case.
Based on advances in the technology known to be underway, the High case assumes power levels of 350 kW (maximum power for Level 3 DC fast chargers) for all area types (central city, suburb, and rural locations) in 2050.
The High case for home charging availability was assumed to equal 100% for all areas by 2050.
For the Medium and High cases, it was assumed that home chargers will have access to Level 2 chargers (at maximum power of 19.2 kW) in 2050.
For the High case, based on known initiatives in the rollout of charging infrastructure, it was assumed that workplace charging ability will be 100% by 2050.
Based on the availability of technology discussed above for public charging, the High case assumes charging power of 350 kW in 2050.<br>
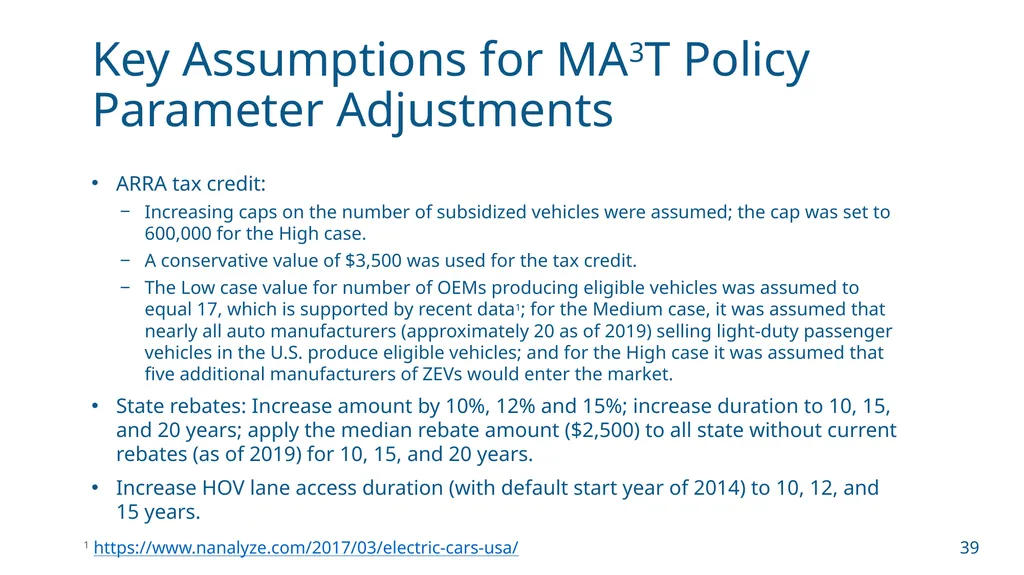
slide39. Key Assumptions for MA3T Policy Parameter Adjustments 39 ARRA tax credit:
Increasing caps on the number of subsidized vehicles were assumed; the cap was set to 600,000 for the High case.
A conservative value of $3,500 was used for the tax credit.
The Low case value for number of OEMs producing eligible vehicles was assumed to equal 17, which is supported by recent data1; for the Medium case, it was assumed that nearly all auto manufacturers (approximately 20 as of 2019) selling light-duty passenger vehicles in the U.S. produce eligible vehicles; and for the High case it was assumed that five additional manufacturers of ZEVs would enter the market.
State rebates: Increase amount by 10%, 12% and 15%; increase duration to 10, 15, and 20 years; apply the median rebate amount ($2,500) to all state without current rebates (as of 2019) for 10, 15, and 20 years.
Increase HOV lane access duration (with default start year of 2014) to 10, 12, and 15 years. 1 https://www.nanalyze.com/2017/03/electric-cars-usa/<br>
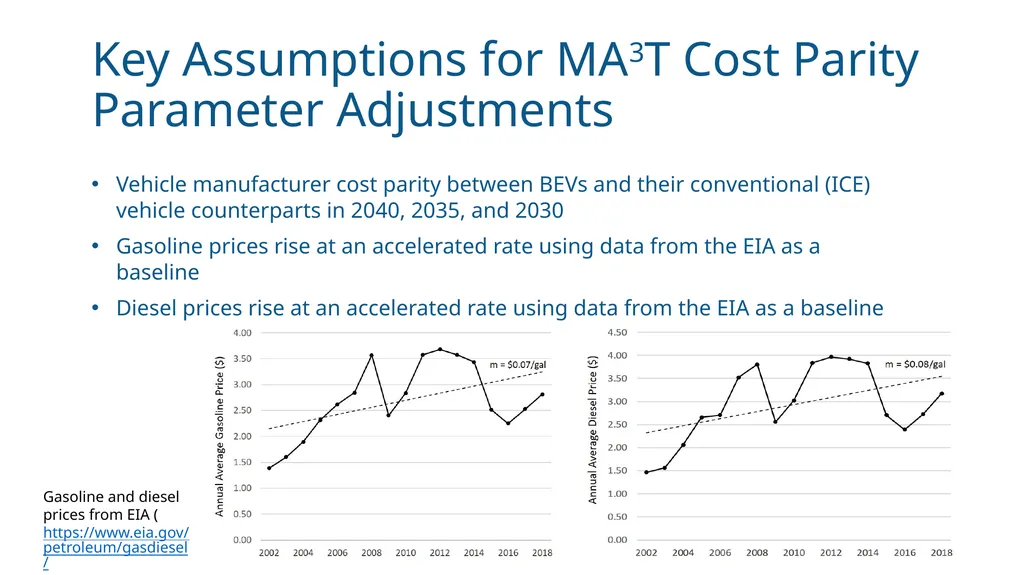
slide40. Key Assumptions for MA3T Cost Parity Parameter Adjustments Vehicle manufacturer cost parity between BEVs and their conventional (ICE) vehicle counterparts in 2040, 2035, and 2030
Gasoline prices rise at an accelerated rate using data from the EIA as a baseline
Diesel prices rise at an accelerated rate using data from the EIA as a baseline Gasoline and diesel prices from EIA (https://www.eia.gov/petroleum/gasdiesel/)<br>
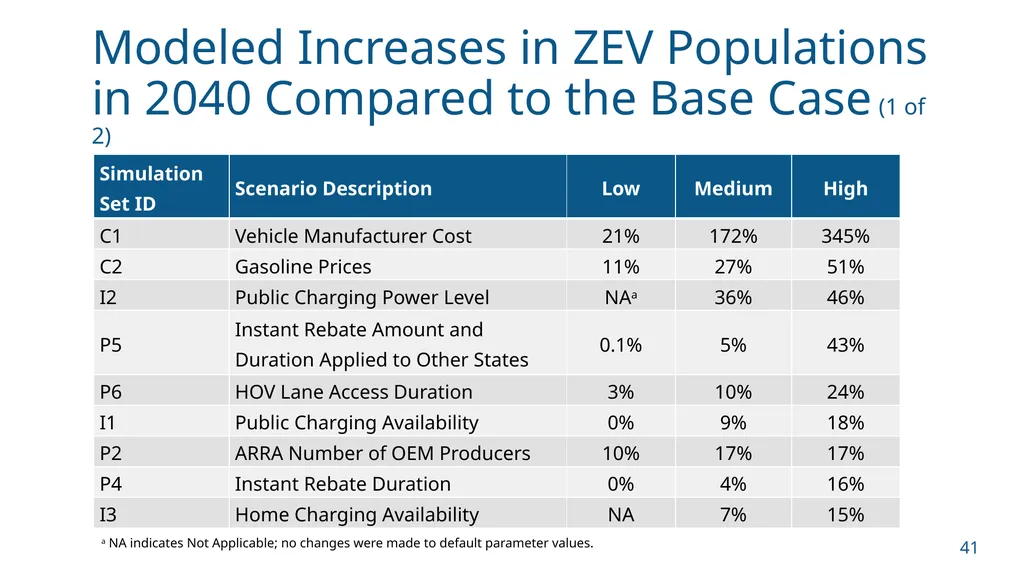
slide41. Modeled Increases in ZEV Populations in 2040 Compared to the Base Case (1 of 2) 41 a NA indicates Not Applicable; no changes were made to default parameter values.<br>
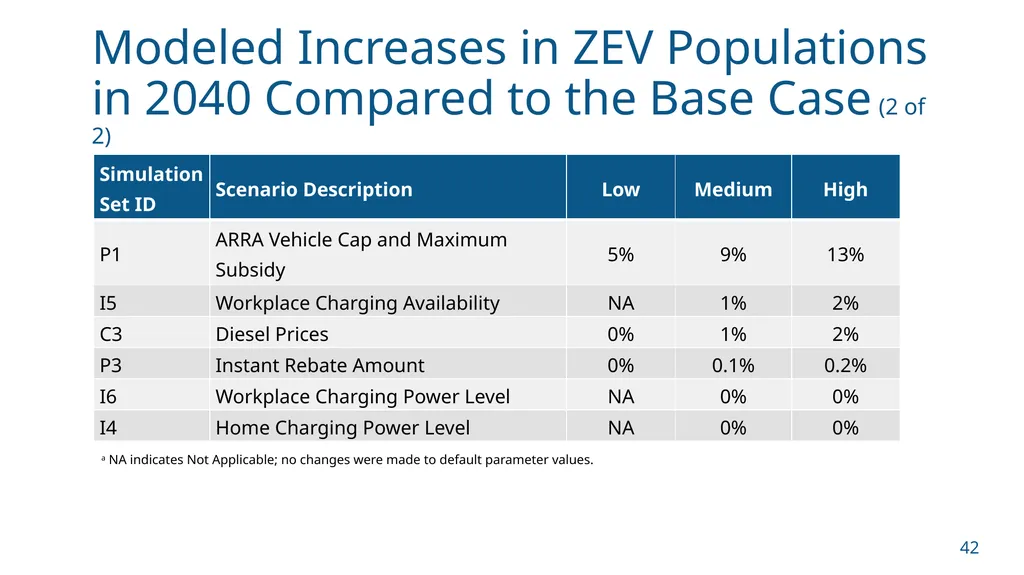
slide42. Modeled Increases in ZEV Populations in 2040 Compared to the Base Case (2 of 2) 42 a NA indicates Not Applicable; no changes were made to default parameter values.<br>
slide2. Research Agency: Louis Berger U.S. Inc. & Sonoma Technology, Inc. (STI) 2 Garnet Erdakos, PhD (Principal Investigator, STI)
Shih Ying Chang, PhD (STI)
Douglas Eisinger, PhD (Senior Advisor, STI)
Adrienne Heller, AICP, ENV SP (Louis Berger)
Heather Unger, LEED AP, ENV SP (Louis Berger) NCHRP Senior Program Officer Ann M. Hartell, PhD<br>
slide3. Author Acknowledgments 3 Colleen M. Turner, Maryland Department of Transportation
Rick Baker, Eastern Research Group, Inc.
Jeffrey R. Lidicker, California Air Resources Board
Jane Jie Lin, University of Illinois – Chicago
Natalie Ries, Minnesota Department of Transportation
Lubna Shoaib, East West Gateway Council of Government
Benjamin P. VanGessel, U.S. Environmental Protection Agency
John Davies, Federal Highway Administration (Liaison)
Melissa Savage, American Association of State Highway and Transportation Officials (Liaison) The research team also thanks Dr. Song Bai of the Bay Area Air Quality Management District for his input on the research approach used in this study. In addition, appreciation goes to John Davies of the U.S. Federal Highway Administration, Dr. Zhenhong Lin of the Oak Ridge National Laboratory, and Andrew Breck of the Volpe National Transportation Systems Center, for their assistance regarding use of the MA3T model.<br>
slide4. Project Tasks 4 Task 1: Amplified work plan
Task 2: Brief literature review
Task 3: Develop analysis scenarios
Task 4: Assess emissions reductions
Task 5: Project report Objective of this webinar: present the activities conducted for NCHRP 25-25 Task 115 and the emission reduction estimates in the analysis scenarios<br>
slide5. Outline 5 Key findings from the literature review
Rationale for using the MA3T model
Guiding principles for development and selection of scenarios
ZEV adoption scenarios
Modeled ZEV population increases
Modeled emissions reductions
Implications and future research suggestions<br>
slide6. Brief Literature Review to Support Modeling Scenario Development 6 Investigated use of the panel-recommended MA3T model and identified key inputs to guide the literature review
Reviewed various resources representing historical data, a variety of forecast resources, consumer preferences, policies, technology, infrastructure, and other topics
Identified key factors affecting adoption of all types of alternative technology vehicles (ATVs): battery electric vehicles (BEV), fuel-cell electric vehicles (FCEV), plug-in hybrid electric vehicles (PHEV), and hybrid electric vehicles (HEV).<br>
slide7. Historical U.S. Sales by Advanced Technology Vehicle Category Data Source: Alliance of Automobile Manufacturers 2019 5 ZEVs<br>
slide8. Drivers to ATV Adoption 8 Examples from the literature review: Beacon Economics (2018) The Road Ahead for Zero-Emission Vehicles in California; U.S. Energy Information Administration (2017) Analysis of the Effect of Zero Emission Vehicle Policies: State-Level Incentives and the California Zero-Emission Vehicle Regulations; Consumers Union and Union of Concerned Scientists (2016) Electric Vehicle Survey Methodology and Assumptions: Driving Habits, Vehicle Needs, and Attitude towards Electric Vehicles in the Northeast and California<br>
slide9. Barriers to ATV Adoption 9 Examples from the literature review: National Academies Press (2015) Overcoming Barriers to Deployment of Plug-in Electric Vehicles; Volkswagen Group of America (2017) California ZEV Investment Plan: Cycle 1; M. Lunetta and G. Coplon-Newfield (2017) REV UP Electric Vehicles: Multi-State Study of the Electric Vehicle Shopping Experience<br>
slide10. Overview of Analysis Methodology 10 Developed analysis approach to test the sensitivity of ZEV adoption to changes in key factors identified in the literature review
Based on the literature review findings and NCHRP panel input, the MA3T model developed by Oak Ridge National Laboratory (ORNL) was selected for use in the modeling analyses.
Assessed MA3T for comparable output results with other ZEV adoption data sources
Worked with Volpe (an MA3T user) and ORNL to understand the model’s strengths and limitations
Developed a sensitivity test strategy to leverage literature review findings and MA3T structure<br>
slide11. Overview of the MA3T Model 11 MA3T: Market Acceptance of Advanced Automotive Technologies model
A consumer choice model to predict light-duty ATV sales, population, and energy consumption
Includes multiple input parameters representing key factors affecting ATV adoption
Calibrated to total light-duty vehicle sales data from the 2019 Annual Energy Outlook (AEO) reference case<br>
slide12. Charts developed with data from the 2019 Annual Energy Outlook (AEO) and MA3T 12 12 Sample MA3T Projected National BEV Sales AEO represents the standard U.S. federal government forecast for energy demand and ATV market share. Alternate forecasts are available from other sources (e.g., Navigant Consulting and Bloomberg New Energy Finance); this is an area of recommended further research.<br>
slide13. Charts developed with data from the 2019 Annual Energy Outlook (AEO), the Auto Alliance Advanced Technology Vehicle Sales Dashboard, and MA3T 13 13 Sample MA3T Projected Populations<br>
slide14. Guiding Principles for Scenario Construction 14 Scenarios reflect important perspectives that are supported by the reviewed literature (drivers and barriers)
Scenarios include key parameters that can have reasonable quantitative adjustments (using MA3T)
Scenarios represent an important area of concern for DOTs/MPOs, and DOTs/MPOs can have practical influence over key factors driving ATV adoption<br>
slide15. ZEV Adoption Scenarios (1 of 3) 15<br>
slide16. ZEV Adoption Scenarios (2 of 3) 16<br>
slide17. ZEV Adoption Scenarios (3 of 3) 17 It is important to acknowledge auto industry reports (for example, as of 2019, reports by Ford, General Motors and Volkswagen) announcing that automakers will release tens of ZEV models by 2025. The auto industry reports suggest that cost parity will be reached sooner than may have previously been expected, perhaps by the mid-2020s or 2030.<br>
slide18. Model Simulations for the Scenarios 18 With the addition of one MA3T simulation for the Base Case analysis scenario, 16 sets of simulations were conducted for this analysis.
Each of the simulation sets consists of three separate simulations (with “Low”, “Medium”, and “High” parameter adjustment), which allowed further analysis of the sensitivity of MA3T to changes in input parameters.
Results of the simulations are summarized on the following nine slides.<br>
slide19. Results of the ZEV Adoption Scenario Simulations 19<br>
slide20. Modeled Total ZEV Vehicle Population in 2040 (Millions of Vehicles; Base Case: 25.5 Million) 20 a NA indicates Not Applicable; no changes were made to default parameter values. Results are only shown for simulations where the market share of ZEVs increased by more than 0.1%.<br>
slide21. Modeled Annual Light-Duty Vehicle Emissions Reductions in 2040 (Criteria Pollutants) (tons) 21 Results are only shown for simulations where the emissions decreased by 3% or more, except the HOV lane High case, which also had reductions of 3%.<br>
slide22. Modeled Annual Light-Duty Vehicle Emissions Reductions in 2040 (Criteria Pollutants), in tons, from the MA3T base case 22 Results are only shown for simulations where the emissions decreased by 3% or more, except the HOV lane High case, which also had reductions of 3%.<br>
slide23. Modeled Annual Light-Duty Vehicle Emissions Reductions in 2040 (MSATs) (tons) 23 Results are only shown for simulations where the emissions decreased by more than 3%.<br>
slide24. Modeled Annual Light-Duty Vehicle Emissions Reductions in 2040 (MSATs), in tons, from the MA3T base case 24 Results are only shown for simulations where the emissions decreased by more than 3%.<br>
slide25. Modeled Annual Light-Duty Vehicle Emissions Reductions in 2040 (MSATs), in tons, from the MA3T base case 25 Results are only shown for simulations where the emissions decreased by 3% or more, except the HOV lane High case, which also had reductions of 3%.<br>
slide26. Modeled Annual Light-Duty Vehicle Emissions Reductions in 2040 (MSATs) (tons) 26 Results are only shown for simulations where the emissions decreased by 3% or more, except the HOV lane High case, which also had reductions of 3%.<br>
slide27. Modeled Annual Light-Duty Vehicle Emissions Reductions in 2040 (GHGs) 106 metric tons CO2, metric tons CH4 and N2O 27 Results are only shown for simulations where the emissions decreased by more than 3%.<br>
slide28. Modeled Annual Light-Duty Vehicle Emissions Reductions in 2040 (GHGs) 106 metric tons CO2, metric tons CH4 and N2O 28 Results are only shown for simulations where the emissions decreased by more than 3%.<br>
slide29. Implications (1 of 2) 29 The findings of this study suggest that, to support efforts to promote adoption of ZEVs, state DOTs and MPOs should consider the following (listed in order of importance):
Cost Parity simulations resulted in the greatest reductions of light-duty vehicle emissions.
The Incentive/Policy simulation with the application of a long-duration rebate to states without current rebates had the next highest reductions of light-duty vehicle emissions.
The high case of the HOV lane access simulations (HOV lane access from 2014‒2030) had the next highest emissions reductions.<br>
slide30. Implications (2 of 2) 30 Potential actions for DOTs and MPOs include the following:
Promoting advancement of policies that support ZEV adoption, such as reduced vehicle manufacturer costs of ZEVs, increased gasoline prices, and long-duration HOV lane access and rebate programs
Expanding infrastructure to support charging or fueling of ZEVs (e.g., deploy charging stations and install signage for directing drivers); for example, the California Department of Transportation (Caltrans) is building infrastructure to support widespread adoption of ZEVs1
Providing resources to address the need for consumer awareness and education; for example, the North Carolina Department of Transportation (NCDOT) includes promotion of public awareness and education about electric vehicles in their recent draft Zero-Emission Vehicle Plan2 1 https://dot.ca.gov/programs/sustainability
2 https://www.ncdot.gov/news/press-releases/Pages/2019/2019-08-22-ncdot-draft-zev-plan-released.aspx<br>
slide31. Suggestions for Future Research (1 of 5) 31 Because the emission reduction results in this study rely on outputs from the MA3T model, recommendations for further research focus on factors used by MA3T to modify ZEV fleet size.
Research into the influence of education programs would provide insight into programs and actions that fall well within many transportation agencies’ area of influence.
Research into the long-term influence of range anxiety, price factors, home charge availability, and other factors will also provide insight into how consumers might respond to important factors.<br>
slide32. Suggestions for Future Research (2 of 5) 32 Research into the manufacturer cost differences by ZEV size classes could improve the assumptions in MA3T as more large-class ZEVs come into the market.
MA3T needs to consider the influence of the “normalizing” of new electric vehicle technology for representing how consumers might behave once electric vehicles represent a large portion of the market (e.g., 40 percent or more); one of the MA3T model developers indicated that future updates to the model will include these factors if funding becomes available.<br>
slide33. Suggestions for Future Research (3 of 5) 33 As ZEVs become a larger portion of the light-duty vehicle fleet, there is potential for new policies that could offset positive incentives. Policies such as state-level increases in ZEV registration fees as a result of losses in gas taxes could be considered in future developments of the MA3T model.
The MA3T model is calibrated to the AEO forecast. Other forecasts, such as the Navigant Consulting forecast or the Bloomberg New Energy Finance forecast, project substantially greater ATV adoption. This is an area for further investigation, as calibrating the model to other forecasts would provide alternate outcomes.<br>
slide34. Suggestions for Future Research (4 of 5) 34 By default, MA3T assumes that there are no FCEVs on the market, even by the end of the modeling time period (2050). Future calibration of the MA3T model would benefit from including data for FCEVs. Although the 2019 AEO forecasts that FCEVs will account for less than half a percent of the total light-duty vehicle fleet in 2040, it is highly uncertain what the FCEV technology and supporting infrastructure will be 20 or 30 years from now.
The MA3T model uses nominal 2018 dollars for all costs, prices, and tax credit and rebate amounts. This could affect model outcomes. For example, ARRA tax credits could be issued beyond 2018 if a vehicle manufacturer has not yet reached the maximum number of subsidized vehicles after 2018. Adjustment of dollar amounts to account for inflation could be added to the model formulation in a future version.<br>
slide35. Suggestions for Future Research (5 of 5) 35 MA3T considers only the U.S. household users of light-duty vehicles as the consumer market. However, as of 2017, medium- and heavy-duty vehicles contributed approximately 23 percent of all GHG emissions associated with the transportation sector (U.S. Environmental Protection Agency, 2019). More research is needed into factors that reduce emissions associated with freight.
As electric vehicles become increasingly commonplace, the change in emissions associated with electric vehicles will increasingly be driven at the grid level. Renewable sources for FCEV fuel will also be important. Integrating vehicle emissions models with scenarios that focus on transportation network and grid level impacts or renewable fuel sources would provide a more complete picture of future emissions.<br>
slide36. For More Information 36 https://apps.trb.org/cmsfeed/TRBNetProjectDisplay.asp?ProjectID=4485<br>
slide37. Supplemental Slides 37<br>
slide38. Key Assumptions for MA3T Infrastructure Parameter Adjustments 38 To reflect the rapid deployment of EVSE and the high degree of uncertainty around anticipated demand, and to test the impact of charging infrastructure availability, public charging infrastructure is set to 100% availability in 2050 for the High case.
Based on advances in the technology known to be underway, the High case assumes power levels of 350 kW (maximum power for Level 3 DC fast chargers) for all area types (central city, suburb, and rural locations) in 2050.
The High case for home charging availability was assumed to equal 100% for all areas by 2050.
For the Medium and High cases, it was assumed that home chargers will have access to Level 2 chargers (at maximum power of 19.2 kW) in 2050.
For the High case, based on known initiatives in the rollout of charging infrastructure, it was assumed that workplace charging ability will be 100% by 2050.
Based on the availability of technology discussed above for public charging, the High case assumes charging power of 350 kW in 2050.<br>
slide39. Key Assumptions for MA3T Policy Parameter Adjustments 39 ARRA tax credit:
Increasing caps on the number of subsidized vehicles were assumed; the cap was set to 600,000 for the High case.
A conservative value of $3,500 was used for the tax credit.
The Low case value for number of OEMs producing eligible vehicles was assumed to equal 17, which is supported by recent data1; for the Medium case, it was assumed that nearly all auto manufacturers (approximately 20 as of 2019) selling light-duty passenger vehicles in the U.S. produce eligible vehicles; and for the High case it was assumed that five additional manufacturers of ZEVs would enter the market.
State rebates: Increase amount by 10%, 12% and 15%; increase duration to 10, 15, and 20 years; apply the median rebate amount ($2,500) to all state without current rebates (as of 2019) for 10, 15, and 20 years.
Increase HOV lane access duration (with default start year of 2014) to 10, 12, and 15 years. 1 https://www.nanalyze.com/2017/03/electric-cars-usa/<br>
slide40. Key Assumptions for MA3T Cost Parity Parameter Adjustments Vehicle manufacturer cost parity between BEVs and their conventional (ICE) vehicle counterparts in 2040, 2035, and 2030
Gasoline prices rise at an accelerated rate using data from the EIA as a baseline
Diesel prices rise at an accelerated rate using data from the EIA as a baseline Gasoline and diesel prices from EIA (https://www.eia.gov/petroleum/gasdiesel/)<br>
slide41. Modeled Increases in ZEV Populations in 2040 Compared to the Base Case (1 of 2) 41 a NA indicates Not Applicable; no changes were made to default parameter values.<br>
slide42. Modeled Increases in ZEV Populations in 2040 Compared to the Base Case (2 of 2) 42 a NA indicates Not Applicable; no changes were made to default parameter values.<br>