
NCHRP Project 20-102(27) Realistic Timing
CM
Published · 46 slides · 0 views
1 / 1







Description
NCHRP Project 20-102(27) Realistic Timing Estimates for Automated Vehicle Implementation Project Summary September 29, 2022 The National Cooperative Highway Research Program (NCHRP) is sponsored by the individual state departments of
Related Topics
Share
Embed code
Download this presentation From Below
"NCHRP Project 20-102(27) Realistic Timing" is the property of its rightful owner. Permission is granted to download and print the materials on this website for personal, non-commercial use only, and to display it on your personal computer provided you do not modify the materials and that you retain all copyright notices contained in the materials. By downloading content from our website, you accept the terms of this agreement.
Presentation Transcript
01
NCHRP Project 20-102(27)
Realistic Timing Estimates for Automated Vehicle Implementation Project Summary
September 29, 2022<br>
September 29, 2022<br>
02
The National Cooperative Highway Research Program (NCHRP) is sponsored by the individual state departments of transportation of the American Association of State Highway and Transportation Officials. NCHRP is administered by the Transportation Research Board (TRB), part of the National Academies of Sciences, Engineering, and Medicine, under a cooperative agreement with the Federal Highway Administration (FHWA). Any opinions and conclusions expressed or implied in resulting research products are those of the individuals and organizations who performed the research and are not necessarily those of TRB; the National Academies of Sciences, Engineering, and Medicine; the FHWA; or NCHRP sponsors.<br>
03
Contents Background and Objectives
Research Approach
Findings and Conclusions<br>
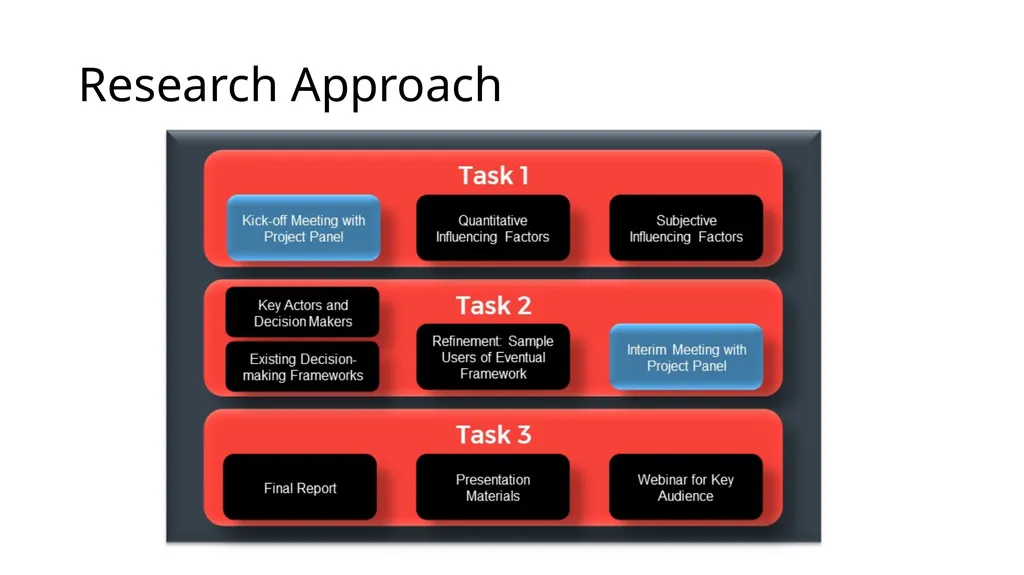
Research Approach
Findings and Conclusions<br>
04
Background and Objectives<br>
05
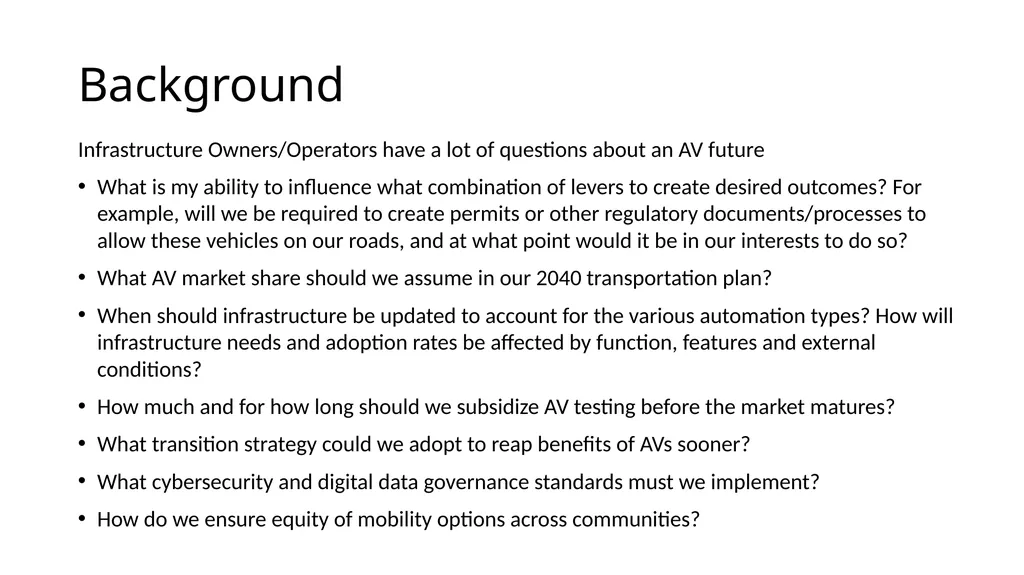
Background Infrastructure Owners/Operators have a lot of questions about an AV future
What is my ability to influence what combination of levers to create desired outcomes? For example, will we be required to create permits or other regulatory documents/processes to allow these vehicles on our roads, and at what point would it be in our interests to do so?
What AV market share should we assume in our 2040 transportation plan?
When should infrastructure be updated to account for the various automation types? How will infrastructure needs and adoption rates be affected by function, features and external conditions?
How much and for how long should we subsidize AV testing before the market matures?
What transition strategy could we adopt to reap benefits of AVs sooner?
What cybersecurity and digital data governance standards must we implement?
How do we ensure equity of mobility options across communities?<br>
What is my ability to influence what combination of levers to create desired outcomes? For example, will we be required to create permits or other regulatory documents/processes to allow these vehicles on our roads, and at what point would it be in our interests to do so?
What AV market share should we assume in our 2040 transportation plan?
When should infrastructure be updated to account for the various automation types? How will infrastructure needs and adoption rates be affected by function, features and external conditions?
How much and for how long should we subsidize AV testing before the market matures?
What transition strategy could we adopt to reap benefits of AVs sooner?
What cybersecurity and digital data governance standards must we implement?
How do we ensure equity of mobility options across communities?<br>
06
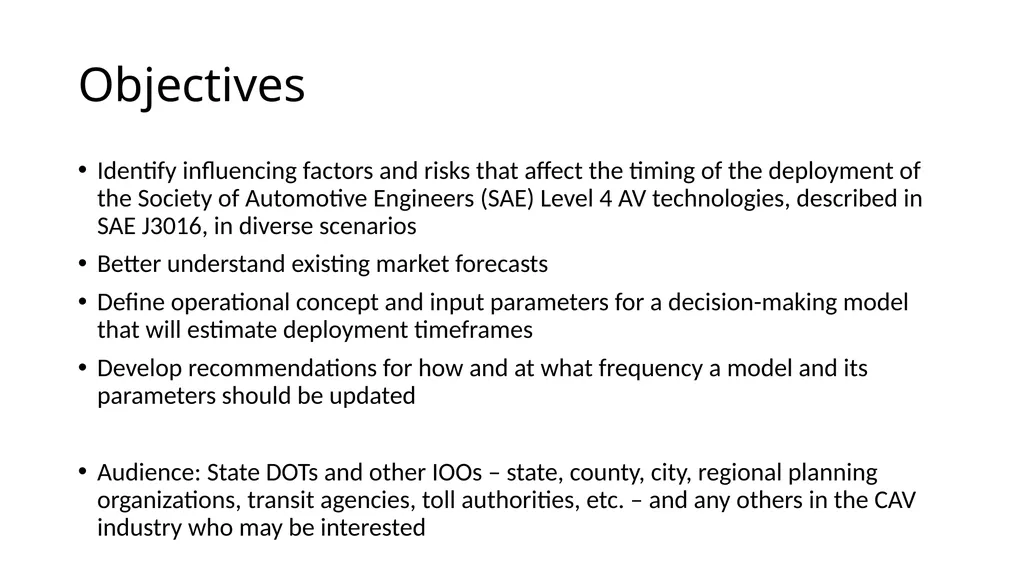
Objectives Identify influencing factors and risks that affect the timing of the deployment of the Society of Automotive Engineers (SAE) Level 4 AV technologies, described in SAE J3016, in diverse scenarios
Better understand existing market forecasts
Define operational concept and input parameters for a decision-making model that will estimate deployment timeframes
Develop recommendations for how and at what frequency a model and its parameters should be updated
Audience: State DOTs and other IOOs – state, county, city, regional planning organizations, transit agencies, toll authorities, etc. – and any others in the CAV industry who may be interested<br>
Better understand existing market forecasts
Define operational concept and input parameters for a decision-making model that will estimate deployment timeframes
Develop recommendations for how and at what frequency a model and its parameters should be updated
Audience: State DOTs and other IOOs – state, county, city, regional planning organizations, transit agencies, toll authorities, etc. – and any others in the CAV industry who may be interested<br>
07
Research Approach<br>
08
Research Approach<br>
09
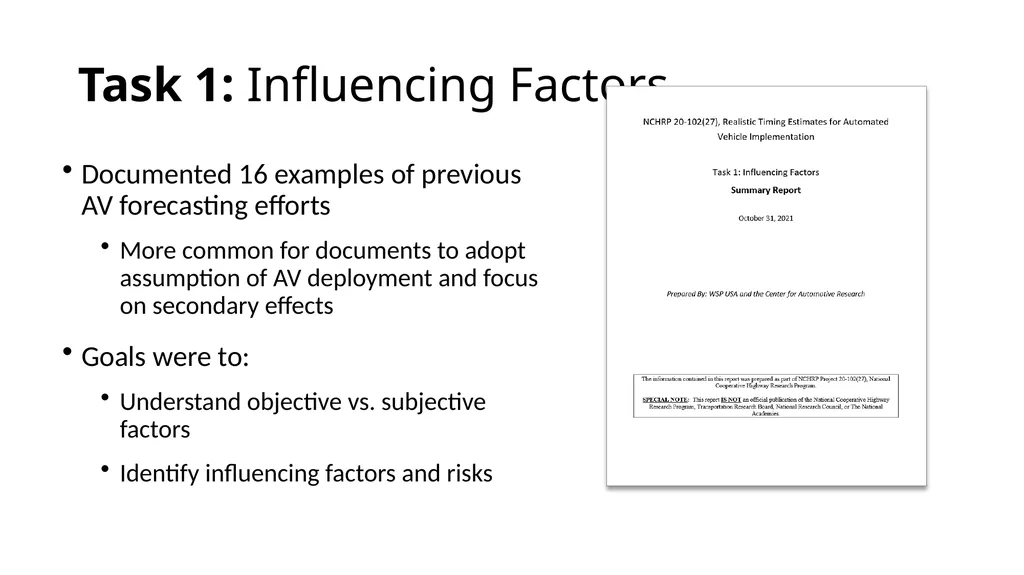
Task 1: Influencing Factors Documented 16 examples of previous AV forecasting efforts
More common for documents to adopt assumption of AV deployment and focus on secondary effects
Goals were to:
Understand objective vs. subjective factors
Identify influencing factors and risks<br>
More common for documents to adopt assumption of AV deployment and focus on secondary effects
Goals were to:
Understand objective vs. subjective factors
Identify influencing factors and risks<br>
10
Identify Influencing Factors and Risks Factors from previous efforts combined with project team research and brainstorming
Identifying factors was a dynamic and judgment-based exercise
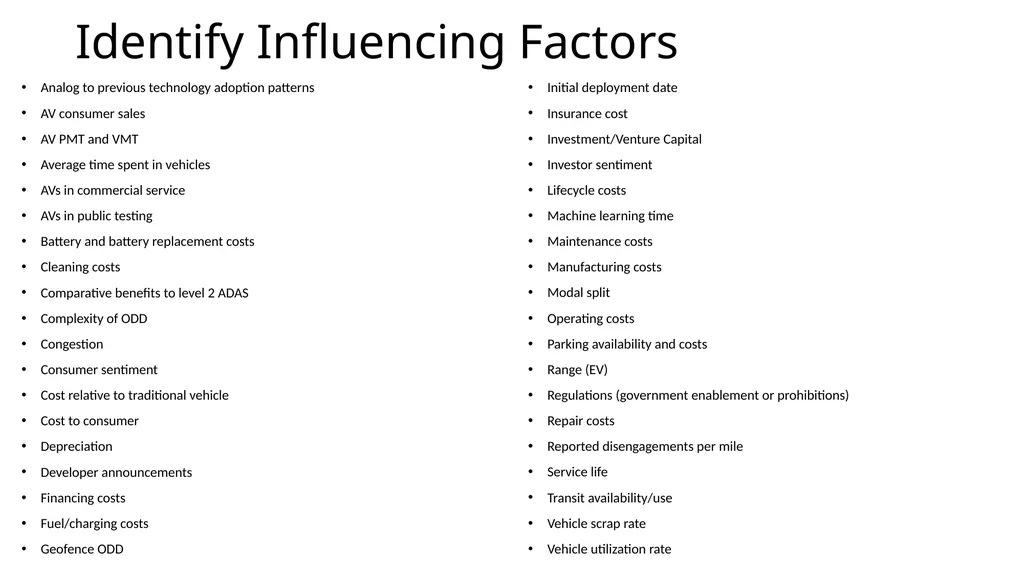
Extracted bulk list of 39 unique factors (see reference slides)
Useful to distinguish pre-market (current) and market (future) forecasting methods
At this time, we can only use intuition and interviews to guess when a market will develop. Once it does, we can activate a formal forecasting model.<br>
Identifying factors was a dynamic and judgment-based exercise
Extracted bulk list of 39 unique factors (see reference slides)
Useful to distinguish pre-market (current) and market (future) forecasting methods
At this time, we can only use intuition and interviews to guess when a market will develop. Once it does, we can activate a formal forecasting model.<br>
11
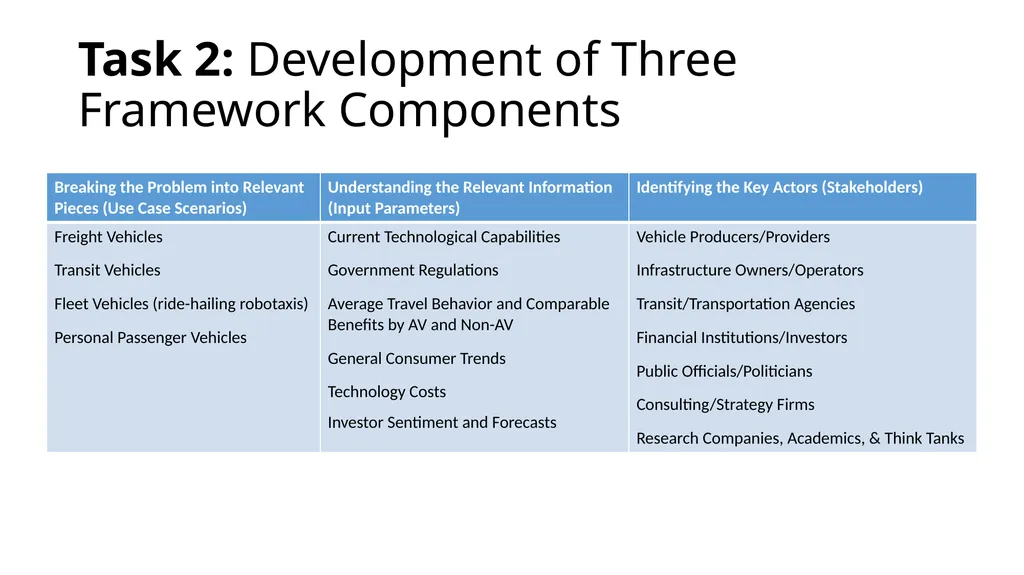
Task 2: Development of Three Framework Components<br>
12
Task 3: Summarizing Project Findings Final Report
Presentation Materials<br>
Presentation Materials<br>
13
Pre-market vs. Market Forecasting Separate forecasting methods must be applied to each stage of technology maturity:
Pre-market framework: forecast the time to and dynamics of the establishment of a meaningful consumer market, necessarily relying on subjective input such as expert interviews and heuristics
Market framework: significant revenue is derived from consumer-ready technology, utilizing data-based correlations to the extent possible
At this time, we are limited to performing pre-market forecasting, but can prepare a framework for a data-based model once we have more evidence of adoption in market.<br>
Pre-market framework: forecast the time to and dynamics of the establishment of a meaningful consumer market, necessarily relying on subjective input such as expert interviews and heuristics
Market framework: significant revenue is derived from consumer-ready technology, utilizing data-based correlations to the extent possible
At this time, we are limited to performing pre-market forecasting, but can prepare a framework for a data-based model once we have more evidence of adoption in market.<br>
14
Desired Framework Outputs Certainty of outputs needs to be reported clearly
IOOs need to know when to consider making investments in anticipation of impeding widespread adoption of AVs
Trigger points, such as specified AV market shares, should be used to indicate when IOOs should reevaluate their policies and plans
This is a framework for a premarket model that will need to be reviewed and adjusted once the market is more mature – perhaps in a series of increments<br>
IOOs need to know when to consider making investments in anticipation of impeding widespread adoption of AVs
Trigger points, such as specified AV market shares, should be used to indicate when IOOs should reevaluate their policies and plans
This is a framework for a premarket model that will need to be reviewed and adjusted once the market is more mature – perhaps in a series of increments<br>
15
Findings and Conclusions<br>
16
Use Cases Freight
Both long haul and short haul
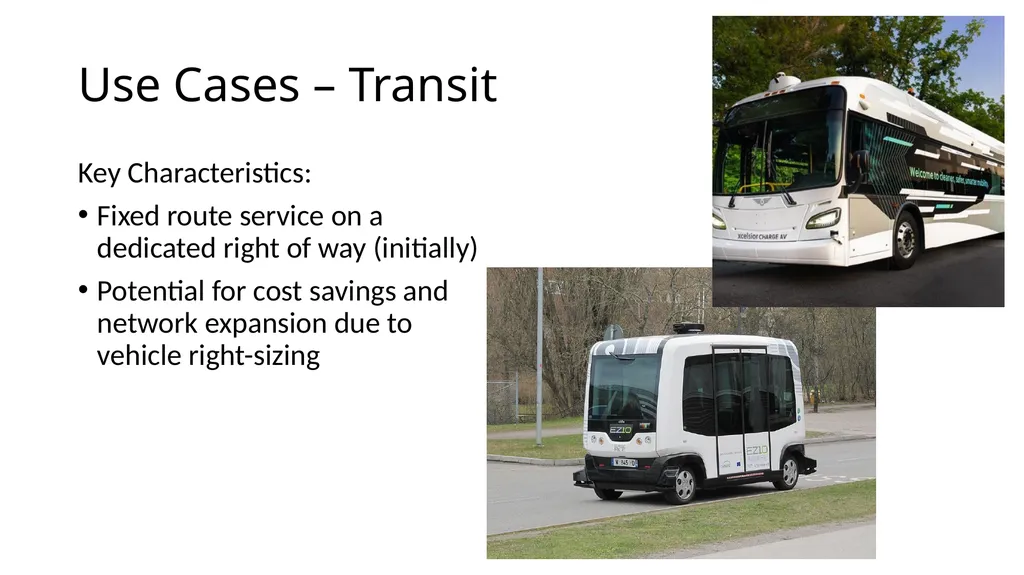
Transit
Both low-speed AV shuttles and full-size buses
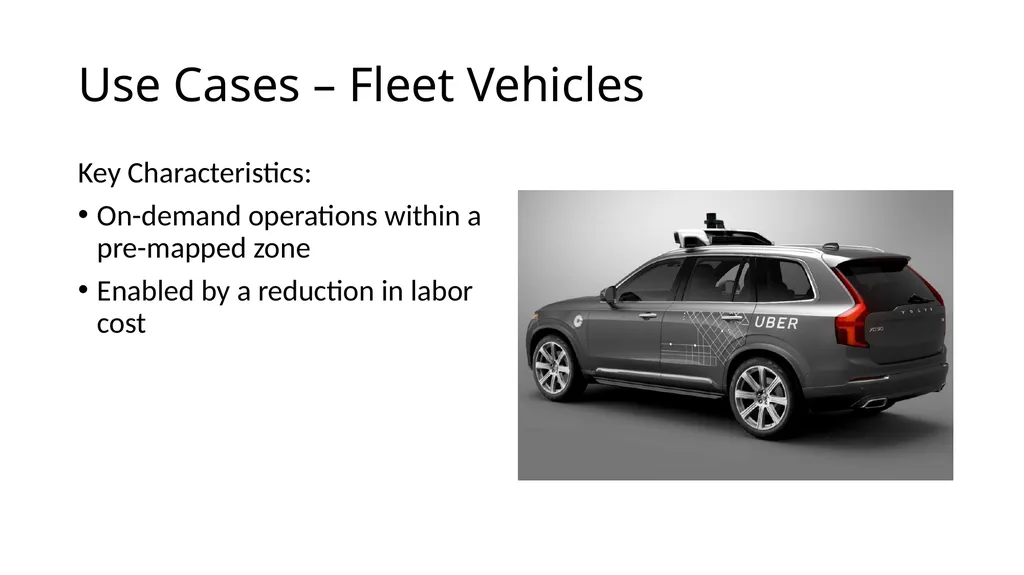
Fleet Vehicles
Privately operated fleets used for passenger travel
Including ridesharing, ride hailing, carsharing, etc. provided to consumers through a private fleet operator
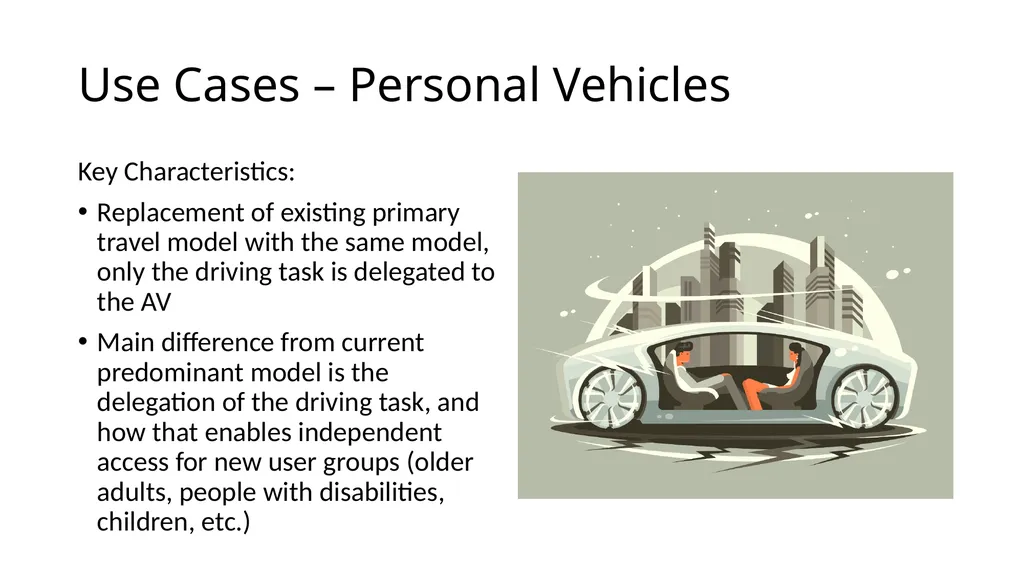
Personal Vehicles
AVs deployed as privately owned vehicles<br>
Both long haul and short haul
Transit
Both low-speed AV shuttles and full-size buses
Fleet Vehicles
Privately operated fleets used for passenger travel
Including ridesharing, ride hailing, carsharing, etc. provided to consumers through a private fleet operator
Personal Vehicles
AVs deployed as privately owned vehicles<br>
17
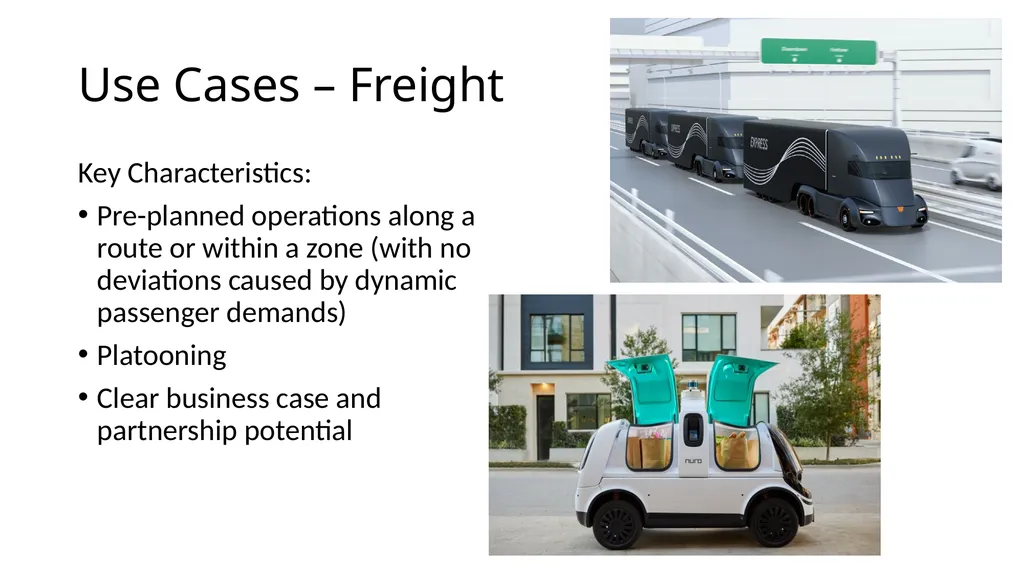
Use Cases – Freight Key Characteristics:
Pre-planned operations along a route or within a zone (with no deviations caused by dynamic passenger demands)
Platooning
Clear business case and partnership potential<br>
Pre-planned operations along a route or within a zone (with no deviations caused by dynamic passenger demands)
Platooning
Clear business case and partnership potential<br>
18
Use Cases – Transit Key Characteristics:
Fixed route service on a dedicated right of way (initially)
Potential for cost savings and network expansion due to vehicle right-sizing<br>
Fixed route service on a dedicated right of way (initially)
Potential for cost savings and network expansion due to vehicle right-sizing<br>
19
Use Cases – Fleet Vehicles Key Characteristics:
On-demand operations within a pre-mapped zone
Enabled by a reduction in labor cost<br>
On-demand operations within a pre-mapped zone
Enabled by a reduction in labor cost<br>
20
Use Cases – Personal Vehicles Key Characteristics:
Replacement of existing primary travel model with the same model, only the driving task is delegated to the AV
Main difference from current predominant model is the delegation of the driving task, and how that enables independent access for new user groups (older adults, people with disabilities, children, etc.)<br>
Replacement of existing primary travel model with the same model, only the driving task is delegated to the AV
Main difference from current predominant model is the delegation of the driving task, and how that enables independent access for new user groups (older adults, people with disabilities, children, etc.)<br>
21
Priority Input Parameters Current technological capabilities
Government regulations and policies
Investments in other related factors (roads, traffic control, etc.)
Average travel behavior and comparable benefits by AV and by non-AV
General consumer trends
Technology costs
Development cost and cost to users (insurance, tax incentives, e-commerce and remote work trends)
Investor sentiment and forecasts<br>
Government regulations and policies
Investments in other related factors (roads, traffic control, etc.)
Average travel behavior and comparable benefits by AV and by non-AV
General consumer trends
Technology costs
Development cost and cost to users (insurance, tax incentives, e-commerce and remote work trends)
Investor sentiment and forecasts<br>
22
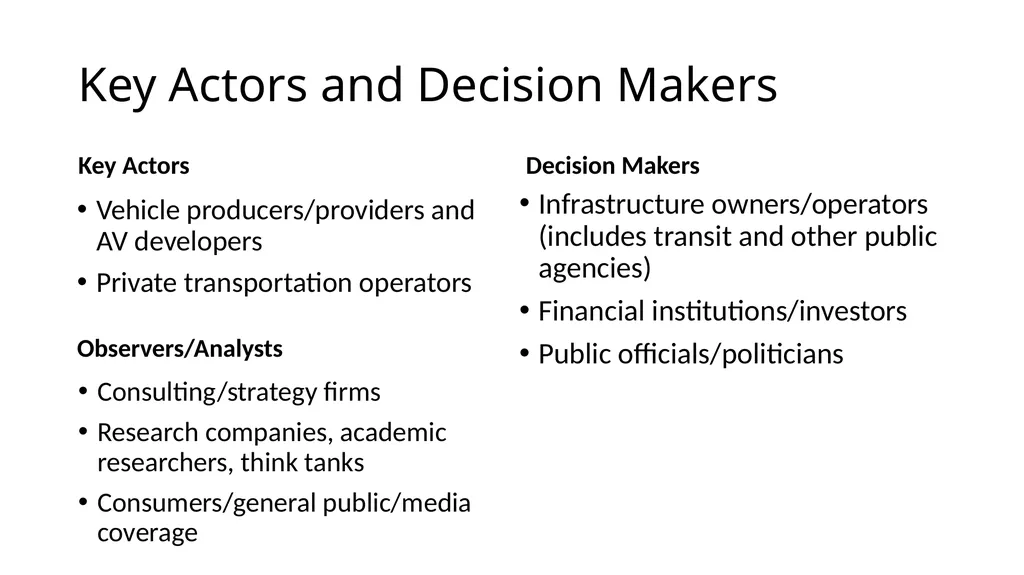
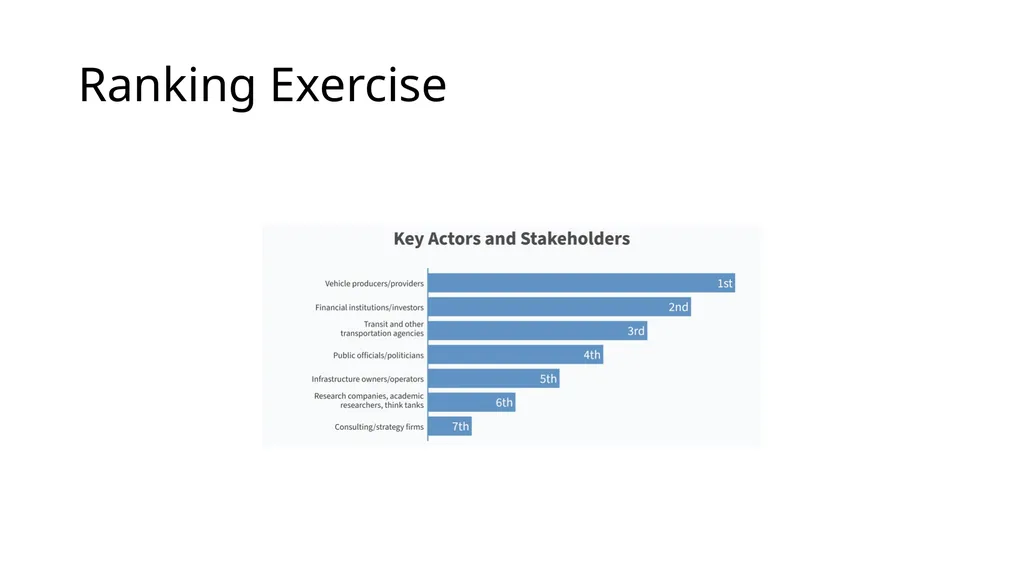
Key Actors and Decision Makers Key Actors Vehicle producers/providers and AV developers
Private transportation operators Decision Makers Consulting/strategy firms
Research companies, academic researchers, think tanks
Consumers/general public/media coverage Observers/Analysts Infrastructure owners/operators (includes transit and other public agencies)
Financial institutions/investors
Public officials/politicians<br>
Private transportation operators Decision Makers Consulting/strategy firms
Research companies, academic researchers, think tanks
Consumers/general public/media coverage Observers/Analysts Infrastructure owners/operators (includes transit and other public agencies)
Financial institutions/investors
Public officials/politicians<br>
23
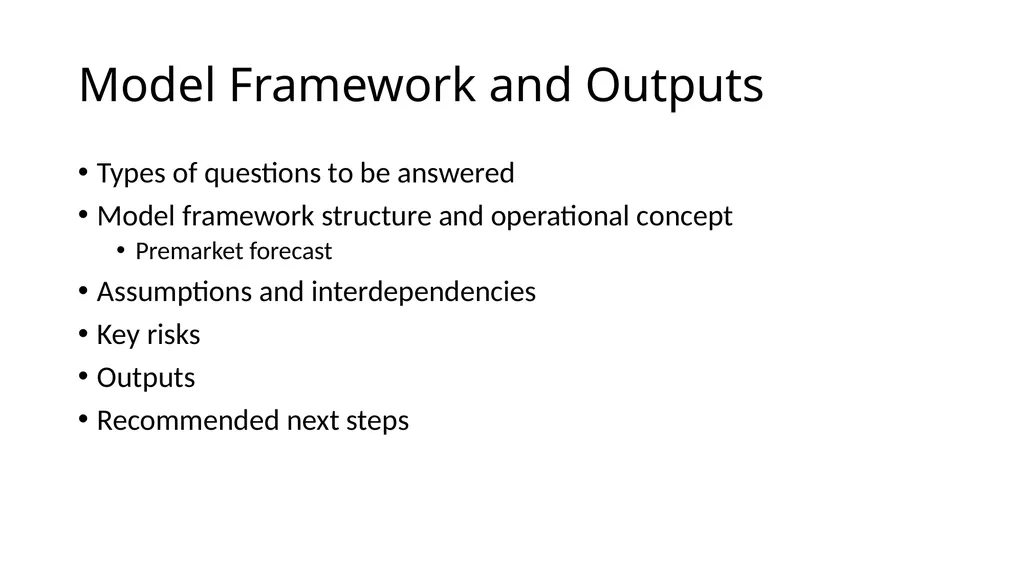
Model Framework and Outputs Types of questions to be answered
Model framework structure and operational concept
Premarket forecast
Assumptions and interdependencies
Key risks
Outputs
Recommended next steps<br>
Model framework structure and operational concept
Premarket forecast
Assumptions and interdependencies
Key risks
Outputs
Recommended next steps<br>
24
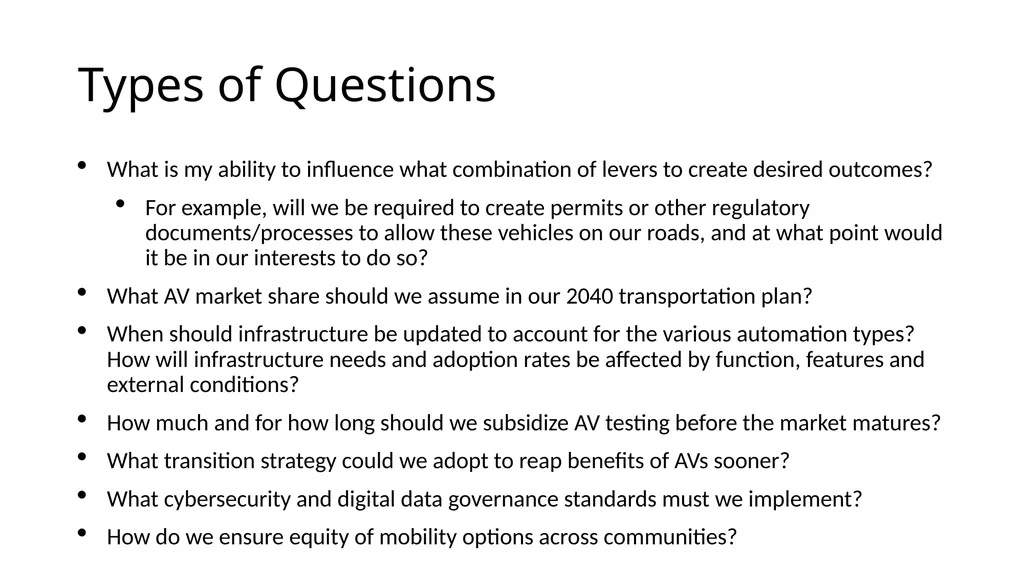
Types of Questions What is my ability to influence what combination of levers to create desired outcomes?
For example, will we be required to create permits or other regulatory documents/processes to allow these vehicles on our roads, and at what point would it be in our interests to do so?
What AV market share should we assume in our 2040 transportation plan?
When should infrastructure be updated to account for the various automation types? How will infrastructure needs and adoption rates be affected by function, features and external conditions?
How much and for how long should we subsidize AV testing before the market matures?
What transition strategy could we adopt to reap benefits of AVs sooner?
What cybersecurity and digital data governance standards must we implement?
How do we ensure equity of mobility options across communities?<br>
For example, will we be required to create permits or other regulatory documents/processes to allow these vehicles on our roads, and at what point would it be in our interests to do so?
What AV market share should we assume in our 2040 transportation plan?
When should infrastructure be updated to account for the various automation types? How will infrastructure needs and adoption rates be affected by function, features and external conditions?
How much and for how long should we subsidize AV testing before the market matures?
What transition strategy could we adopt to reap benefits of AVs sooner?
What cybersecurity and digital data governance standards must we implement?
How do we ensure equity of mobility options across communities?<br>
25
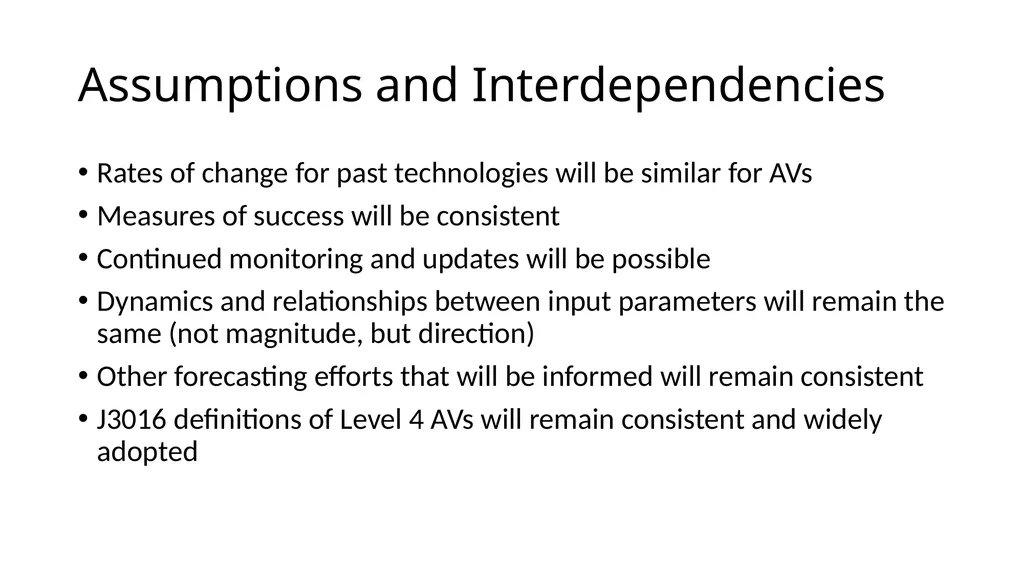
Assumptions and Interdependencies Rates of change for past technologies will be similar for AVs
Measures of success will be consistent
Continued monitoring and updates will be possible
Dynamics and relationships between input parameters will remain the same (not magnitude, but direction)
Other forecasting efforts that will be informed will remain consistent
J3016 definitions of Level 4 AVs will remain consistent and widely adopted<br>
Measures of success will be consistent
Continued monitoring and updates will be possible
Dynamics and relationships between input parameters will remain the same (not magnitude, but direction)
Other forecasting efforts that will be informed will remain consistent
J3016 definitions of Level 4 AVs will remain consistent and widely adopted<br>
26
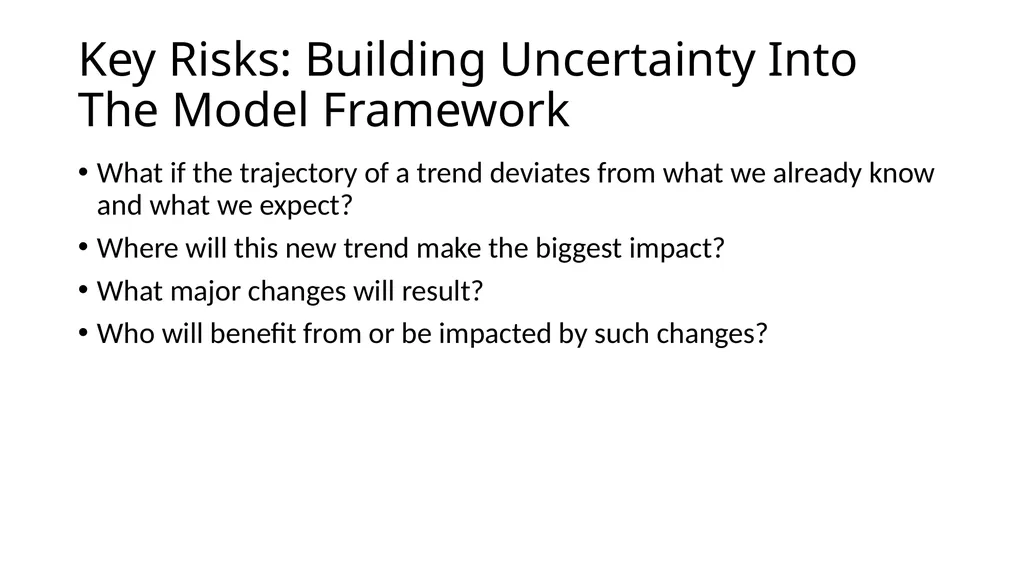
Key Risks: Building Uncertainty Into The Model Framework What if the trajectory of a trend deviates from what we already know and what we expect?
Where will this new trend make the biggest impact?
What major changes will result?
Who will benefit from or be impacted by such changes?<br>
Where will this new trend make the biggest impact?
What major changes will result?
Who will benefit from or be impacted by such changes?<br>
27
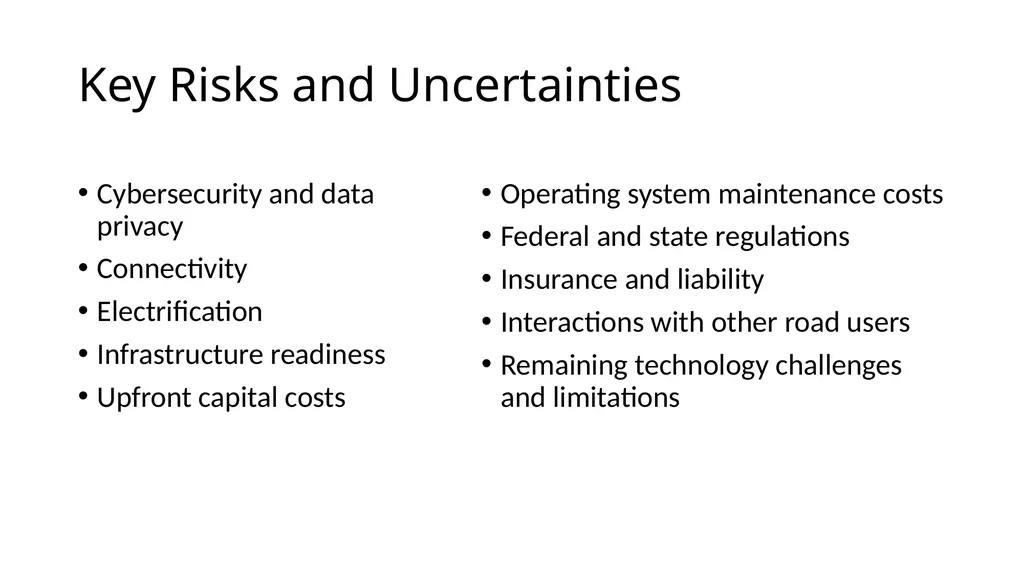
Key Risks and Uncertainties Cybersecurity and data privacy
Connectivity
Electrification
Infrastructure readiness
Upfront capital costs Operating system maintenance costs
Federal and state regulations
Insurance and liability
Interactions with other road users
Remaining technology challenges and limitations<br>
Connectivity
Electrification
Infrastructure readiness
Upfront capital costs Operating system maintenance costs
Federal and state regulations
Insurance and liability
Interactions with other road users
Remaining technology challenges and limitations<br>
28
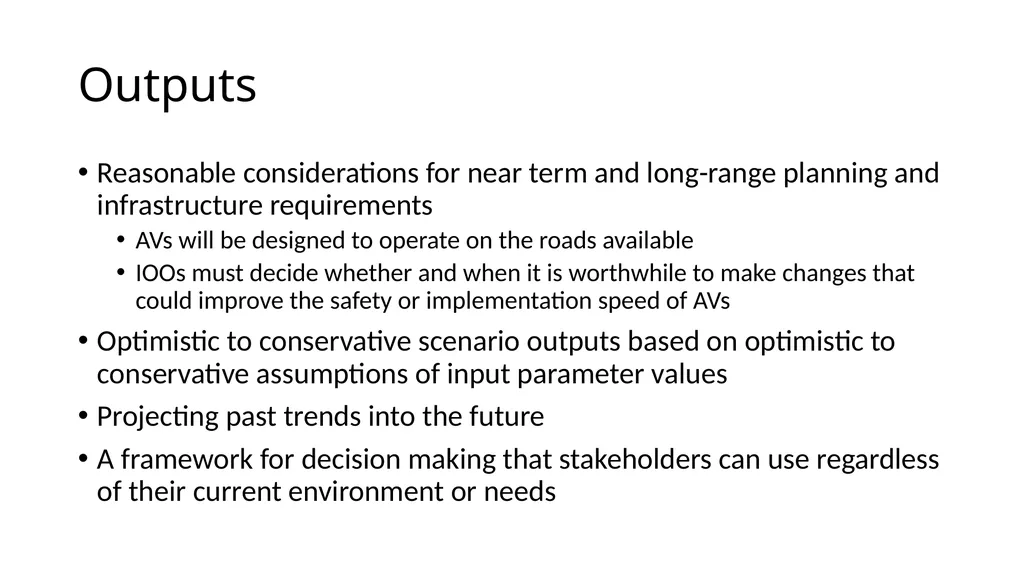
Outputs Reasonable considerations for near term and long-range planning and infrastructure requirements
AVs will be designed to operate on the roads available
IOOs must decide whether and when it is worthwhile to make changes that could improve the safety or implementation speed of AVs
Optimistic to conservative scenario outputs based on optimistic to conservative assumptions of input parameter values
Projecting past trends into the future
A framework for decision making that stakeholders can use regardless of their current environment or needs<br>
AVs will be designed to operate on the roads available
IOOs must decide whether and when it is worthwhile to make changes that could improve the safety or implementation speed of AVs
Optimistic to conservative scenario outputs based on optimistic to conservative assumptions of input parameter values
Projecting past trends into the future
A framework for decision making that stakeholders can use regardless of their current environment or needs<br>
29
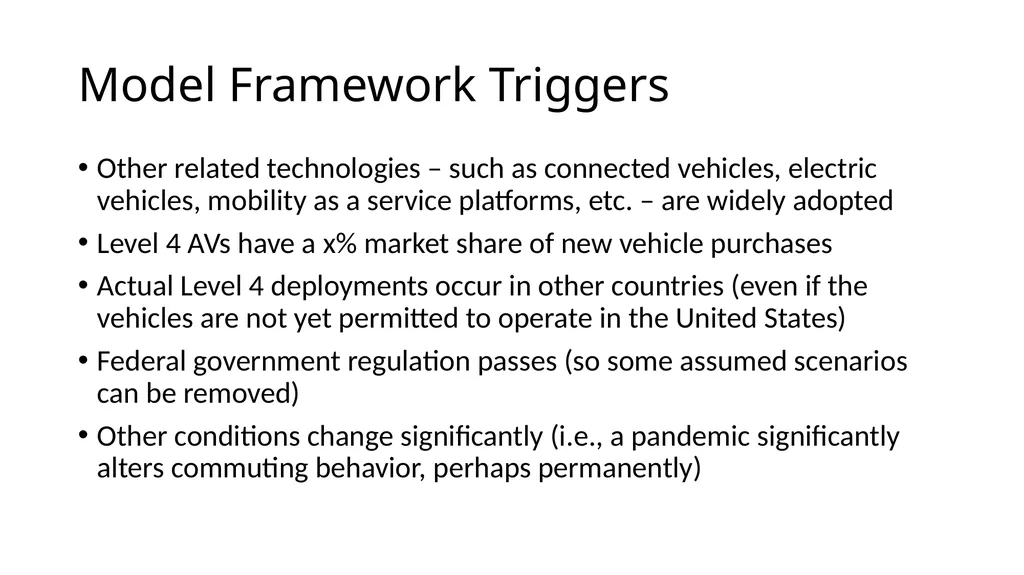
Model Framework Triggers Other related technologies – such as connected vehicles, electric vehicles, mobility as a service platforms, etc. – are widely adopted
Level 4 AVs have a x% market share of new vehicle purchases
Actual Level 4 deployments occur in other countries (even if the vehicles are not yet permitted to operate in the United States)
Federal government regulation passes (so some assumed scenarios can be removed)
Other conditions change significantly (i.e., a pandemic significantly alters commuting behavior, perhaps permanently)<br>
Level 4 AVs have a x% market share of new vehicle purchases
Actual Level 4 deployments occur in other countries (even if the vehicles are not yet permitted to operate in the United States)
Federal government regulation passes (so some assumed scenarios can be removed)
Other conditions change significantly (i.e., a pandemic significantly alters commuting behavior, perhaps permanently)<br>
30
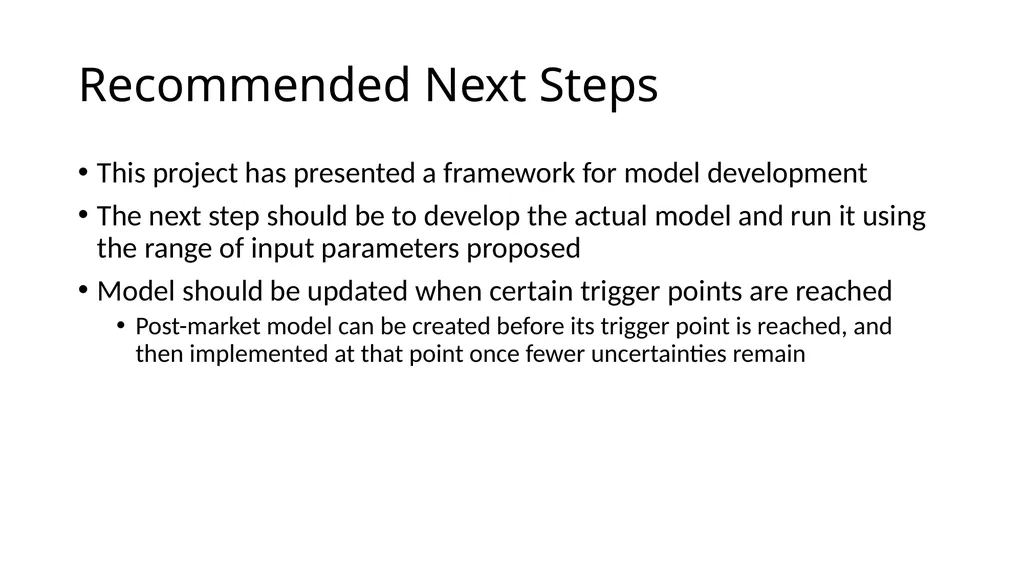
Recommended Next Steps This project has presented a framework for model development
The next step should be to develop the actual model and run it using the range of input parameters proposed
Model should be updated when certain trigger points are reached
Post-market model can be created before its trigger point is reached, and then implemented at that point once fewer uncertainties remain<br>
The next step should be to develop the actual model and run it using the range of input parameters proposed
Model should be updated when certain trigger points are reached
Post-market model can be created before its trigger point is reached, and then implemented at that point once fewer uncertainties remain<br>
31
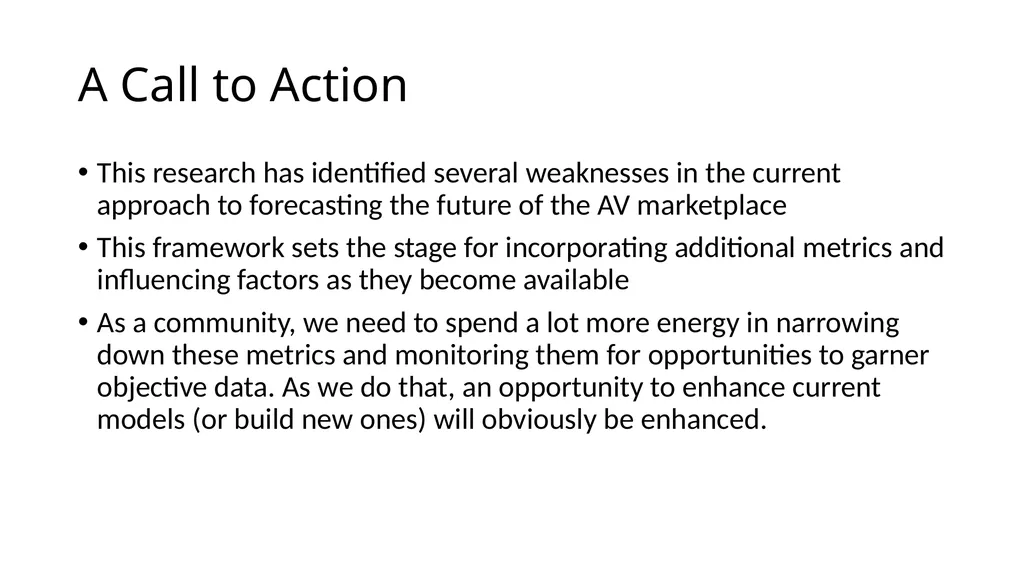
A Call to Action This research has identified several weaknesses in the current approach to forecasting the future of the AV marketplace
This framework sets the stage for incorporating additional metrics and influencing factors as they become available
As a community, we need to spend a lot more energy in narrowing down these metrics and monitoring them for opportunities to garner objective data. As we do that, an opportunity to enhance current models (or build new ones) will obviously be enhanced.<br>
This framework sets the stage for incorporating additional metrics and influencing factors as they become available
As a community, we need to spend a lot more energy in narrowing down these metrics and monitoring them for opportunities to garner objective data. As we do that, an opportunity to enhance current models (or build new ones) will obviously be enhanced.<br>
32
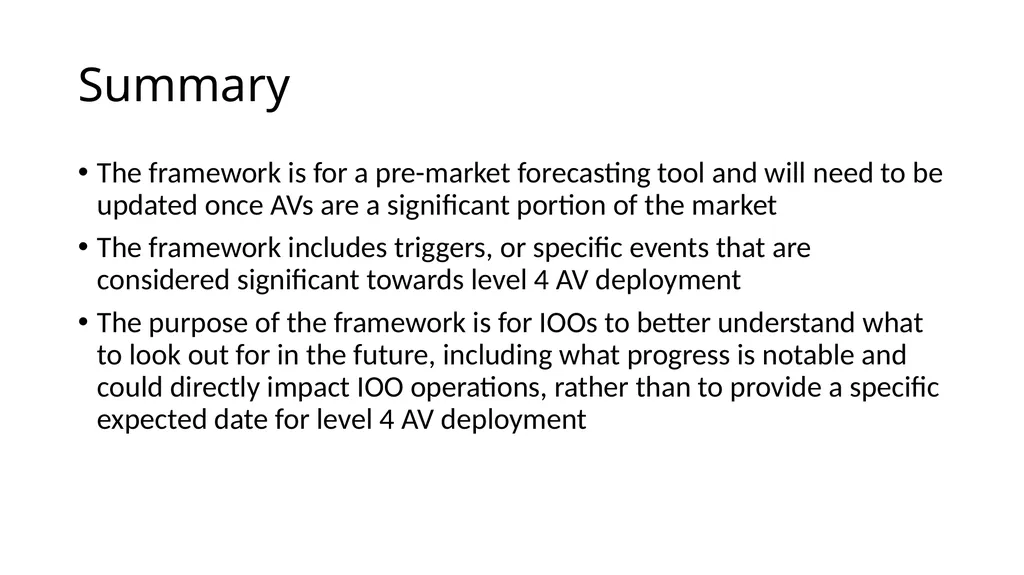
Summary The framework is for a pre-market forecasting tool and will need to be updated once AVs are a significant portion of the market
The framework includes triggers, or specific events that are considered significant towards level 4 AV deployment
The purpose of the framework is for IOOs to better understand what to look out for in the future, including what progress is notable and could directly impact IOO operations, rather than to provide a specific expected date for level 4 AV deployment<br>
The framework includes triggers, or specific events that are considered significant towards level 4 AV deployment
The purpose of the framework is for IOOs to better understand what to look out for in the future, including what progress is notable and could directly impact IOO operations, rather than to provide a specific expected date for level 4 AV deployment<br>
33
Reference<br>
34
Identify Influencing Factors Analog to previous technology adoption patterns
AV consumer sales
AV PMT and VMT
Average time spent in vehicles
AVs in commercial service
AVs in public testing
Battery and battery replacement costs
Cleaning costs
Comparative benefits to level 2 ADAS
Complexity of ODD
Congestion
Consumer sentiment
Cost relative to traditional vehicle
Cost to consumer
Depreciation
Developer announcements
Financing costs
Fuel/charging costs
Geofence ODD Initial deployment date
Insurance cost
Investment/Venture Capital
Investor sentiment
Lifecycle costs
Machine learning time
Maintenance costs
Manufacturing costs
Modal split
Operating costs
Parking availability and costs
Range (EV)
Regulations (government enablement or prohibitions)
Repair costs
Reported disengagements per mile
Service life
Transit availability/use
Vehicle scrap rate
Vehicle utilization rate<br>
AV consumer sales
AV PMT and VMT
Average time spent in vehicles
AVs in commercial service
AVs in public testing
Battery and battery replacement costs
Cleaning costs
Comparative benefits to level 2 ADAS
Complexity of ODD
Congestion
Consumer sentiment
Cost relative to traditional vehicle
Cost to consumer
Depreciation
Developer announcements
Financing costs
Fuel/charging costs
Geofence ODD Initial deployment date
Insurance cost
Investment/Venture Capital
Investor sentiment
Lifecycle costs
Machine learning time
Maintenance costs
Manufacturing costs
Modal split
Operating costs
Parking availability and costs
Range (EV)
Regulations (government enablement or prohibitions)
Repair costs
Reported disengagements per mile
Service life
Transit availability/use
Vehicle scrap rate
Vehicle utilization rate<br>
35
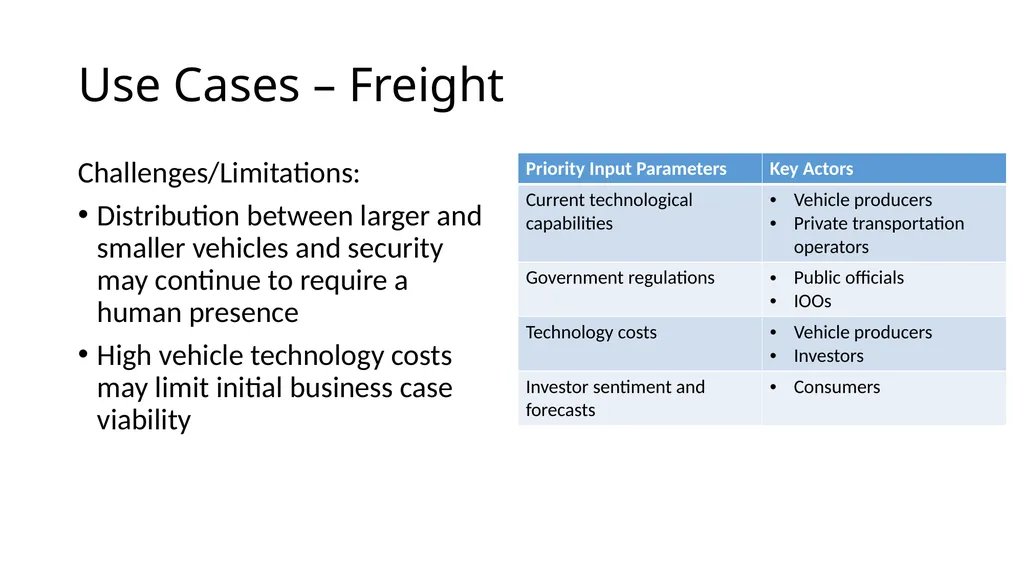
Use Cases – Freight Challenges/Limitations:
Distribution between larger and smaller vehicles and security may continue to require a human presence
High vehicle technology costs may limit initial business case viability<br>
Distribution between larger and smaller vehicles and security may continue to require a human presence
High vehicle technology costs may limit initial business case viability<br>
36
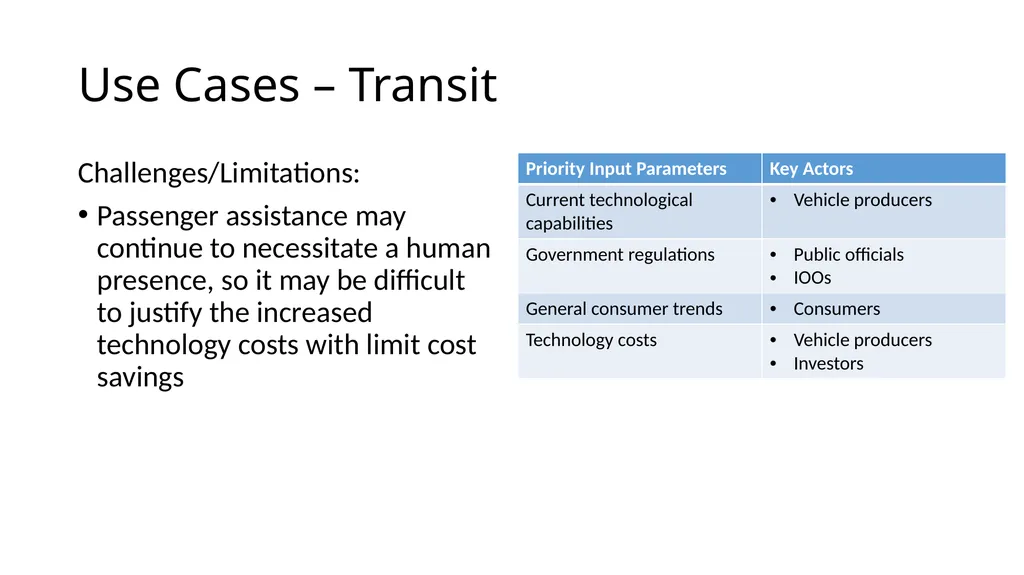
Use Cases – Transit Challenges/Limitations:
Passenger assistance may continue to necessitate a human presence, so it may be difficult to justify the increased technology costs with limit cost savings<br>
Passenger assistance may continue to necessitate a human presence, so it may be difficult to justify the increased technology costs with limit cost savings<br>
37
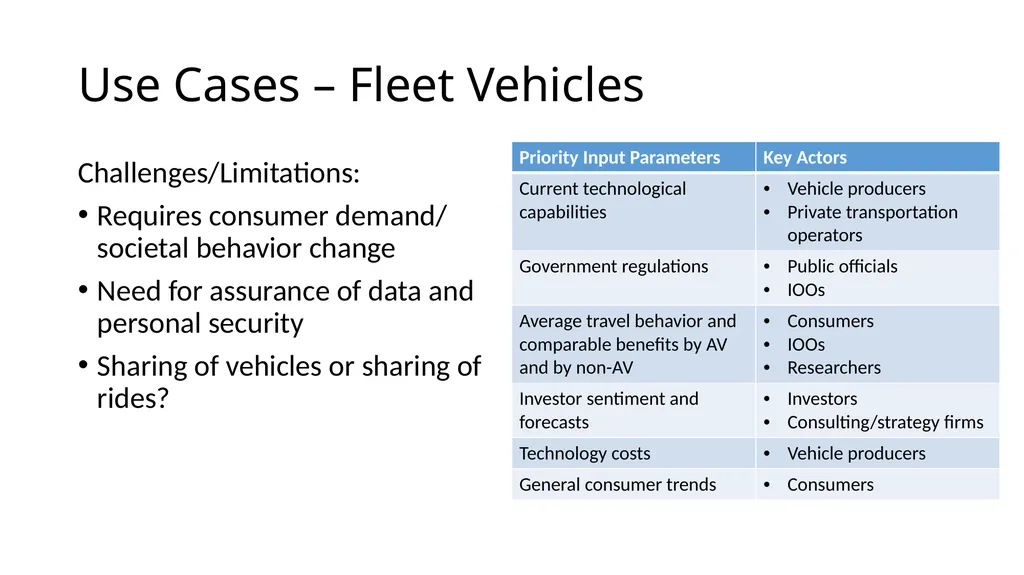
Use Cases – Fleet Vehicles Challenges/Limitations:
Requires consumer demand/ societal behavior change
Need for assurance of data and personal security
Sharing of vehicles or sharing of rides?<br>
Requires consumer demand/ societal behavior change
Need for assurance of data and personal security
Sharing of vehicles or sharing of rides?<br>
38
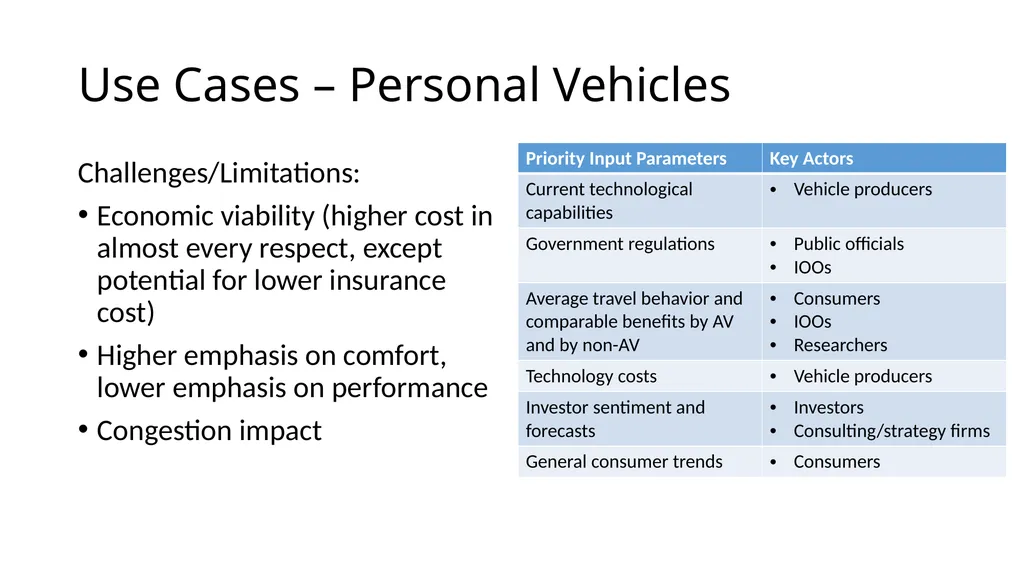
Use Cases – Personal Vehicles Challenges/Limitations:
Economic viability (higher cost in almost every respect, except potential for lower insurance cost)
Higher emphasis on comfort, lower emphasis on performance
Congestion impact<br>
Economic viability (higher cost in almost every respect, except potential for lower insurance cost)
Higher emphasis on comfort, lower emphasis on performance
Congestion impact<br>
39
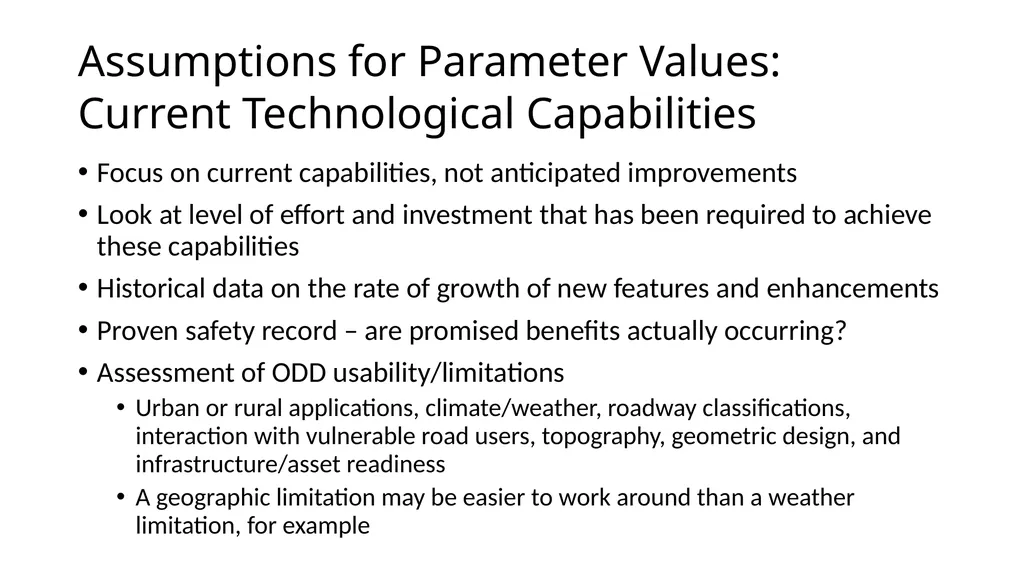
Assumptions for Parameter Values:
Current Technological Capabilities Focus on current capabilities, not anticipated improvements
Look at level of effort and investment that has been required to achieve these capabilities
Historical data on the rate of growth of new features and enhancements
Proven safety record – are promised benefits actually occurring?
Assessment of ODD usability/limitations
Urban or rural applications, climate/weather, roadway classifications, interaction with vulnerable road users, topography, geometric design, and infrastructure/asset readiness
A geographic limitation may be easier to work around than a weather limitation, for example<br>
Look at level of effort and investment that has been required to achieve these capabilities
Historical data on the rate of growth of new features and enhancements
Proven safety record – are promised benefits actually occurring?
Assessment of ODD usability/limitations
Urban or rural applications, climate/weather, roadway classifications, interaction with vulnerable road users, topography, geometric design, and infrastructure/asset readiness
A geographic limitation may be easier to work around than a weather limitation, for example<br>
40
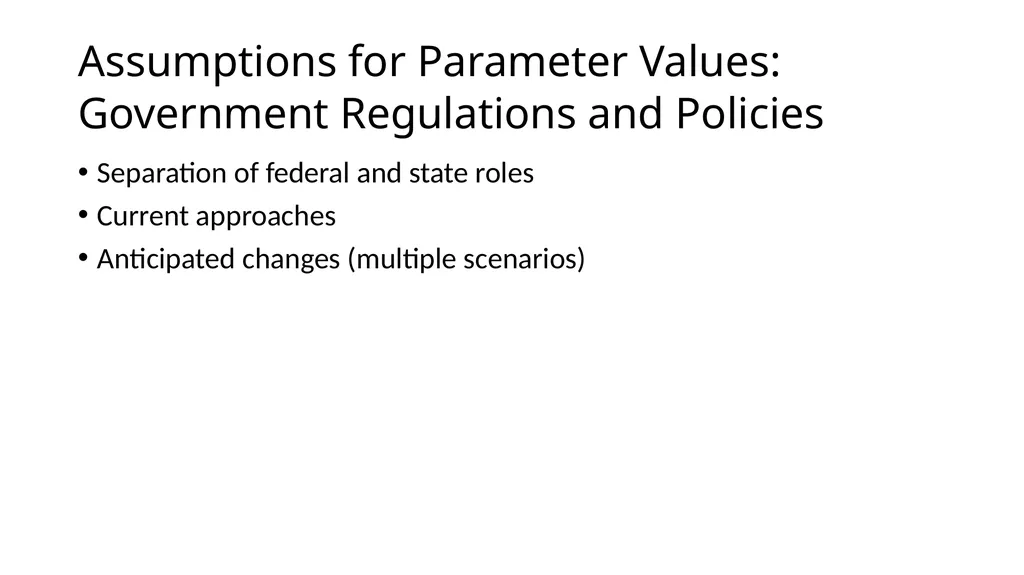
Assumptions for Parameter Values:
Government Regulations and Policies Separation of federal and state roles
Current approaches
Anticipated changes (multiple scenarios)<br>
Current approaches
Anticipated changes (multiple scenarios)<br>
41
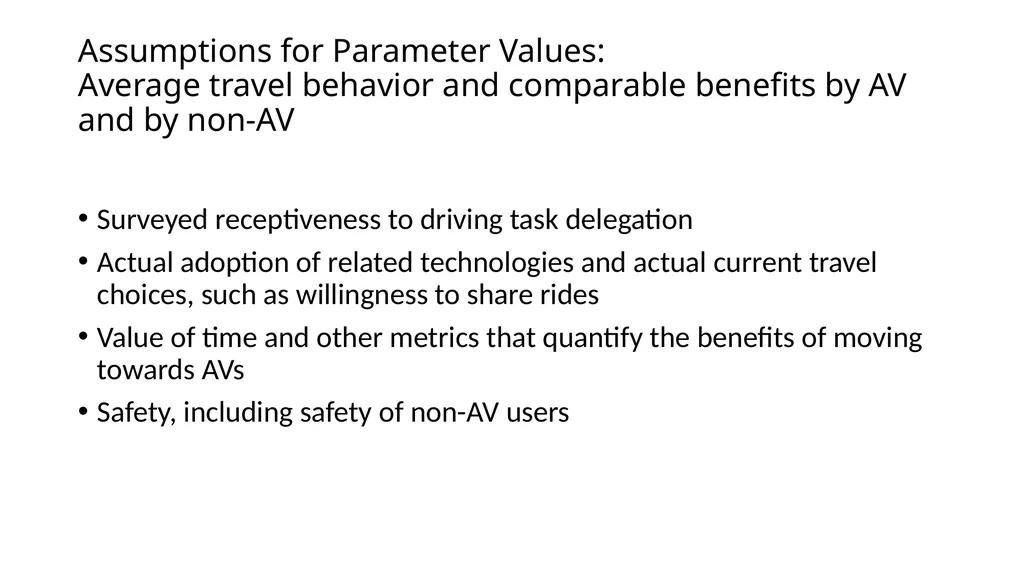
Assumptions for Parameter Values:
Average travel behavior and comparable benefits by AV and by non-AV Surveyed receptiveness to driving task delegation
Actual adoption of related technologies and actual current travel choices, such as willingness to share rides
Value of time and other metrics that quantify the benefits of moving towards AVs
Safety, including safety of non-AV users<br>
Actual adoption of related technologies and actual current travel choices, such as willingness to share rides
Value of time and other metrics that quantify the benefits of moving towards AVs
Safety, including safety of non-AV users<br>
42
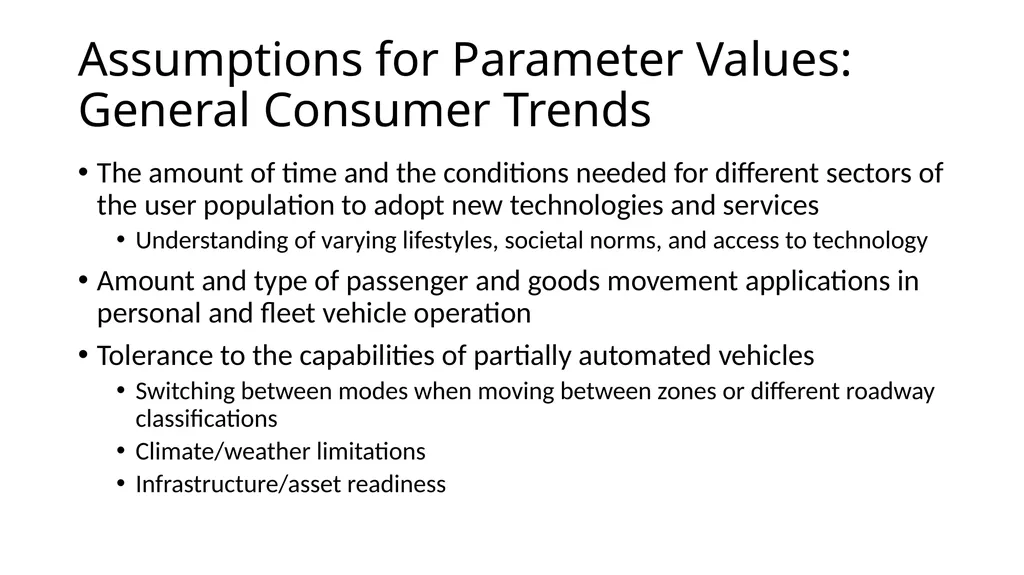
Assumptions for Parameter Values:
General Consumer Trends The amount of time and the conditions needed for different sectors of the user population to adopt new technologies and services
Understanding of varying lifestyles, societal norms, and access to technology
Amount and type of passenger and goods movement applications in personal and fleet vehicle operation
Tolerance to the capabilities of partially automated vehicles
Switching between modes when moving between zones or different roadway classifications
Climate/weather limitations
Infrastructure/asset readiness<br>
Understanding of varying lifestyles, societal norms, and access to technology
Amount and type of passenger and goods movement applications in personal and fleet vehicle operation
Tolerance to the capabilities of partially automated vehicles
Switching between modes when moving between zones or different roadway classifications
Climate/weather limitations
Infrastructure/asset readiness<br>
43
Assumptions for Parameter Values:
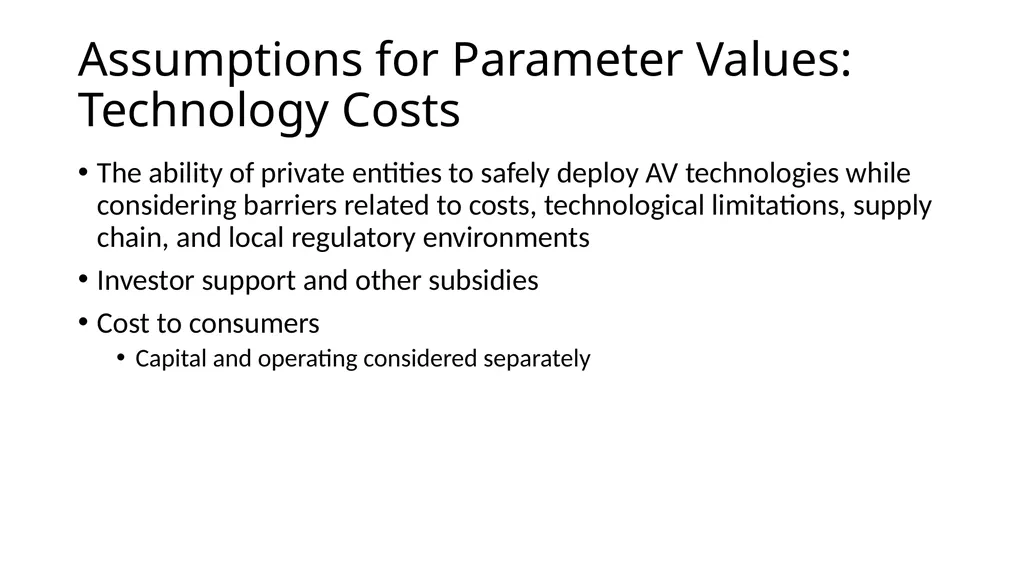
Technology Costs The ability of private entities to safely deploy AV technologies while considering barriers related to costs, technological limitations, supply chain, and local regulatory environments
Investor support and other subsidies
Cost to consumers
Capital and operating considered separately<br>
Investor support and other subsidies
Cost to consumers
Capital and operating considered separately<br>
44
Assumptions for Parameter Values:
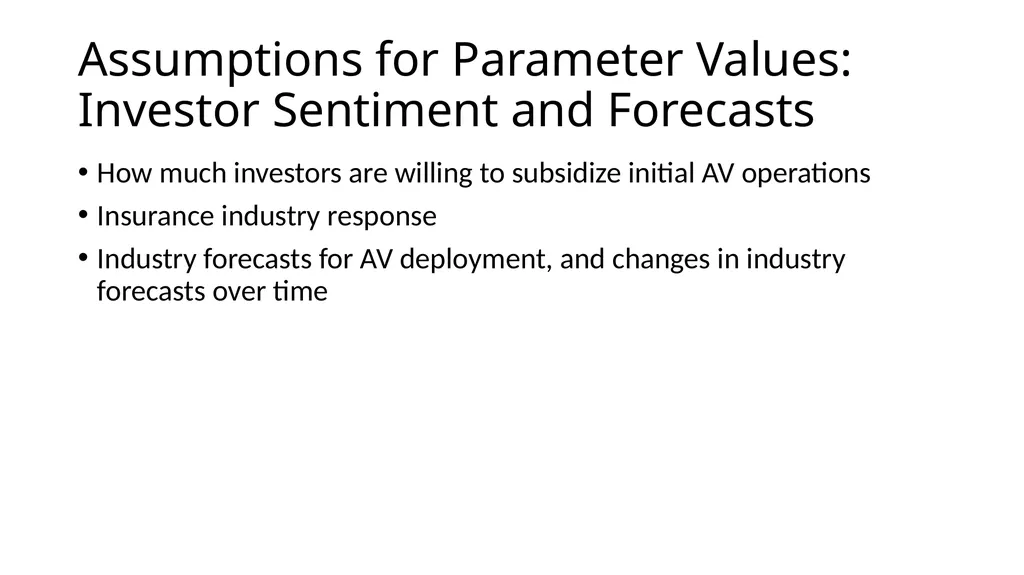
Investor Sentiment and Forecasts How much investors are willing to subsidize initial AV operations
Insurance industry response
Industry forecasts for AV deployment, and changes in industry forecasts over time<br>
Insurance industry response
Industry forecasts for AV deployment, and changes in industry forecasts over time<br>
45
Ranking Exercise<br>
46
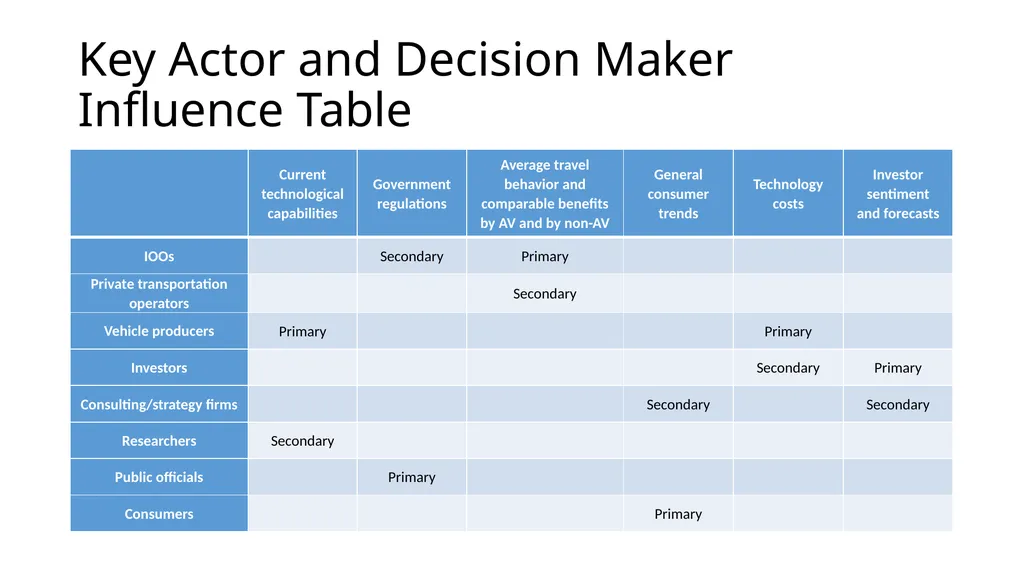
Key Actor and Decision Maker Influence Table<br>