04
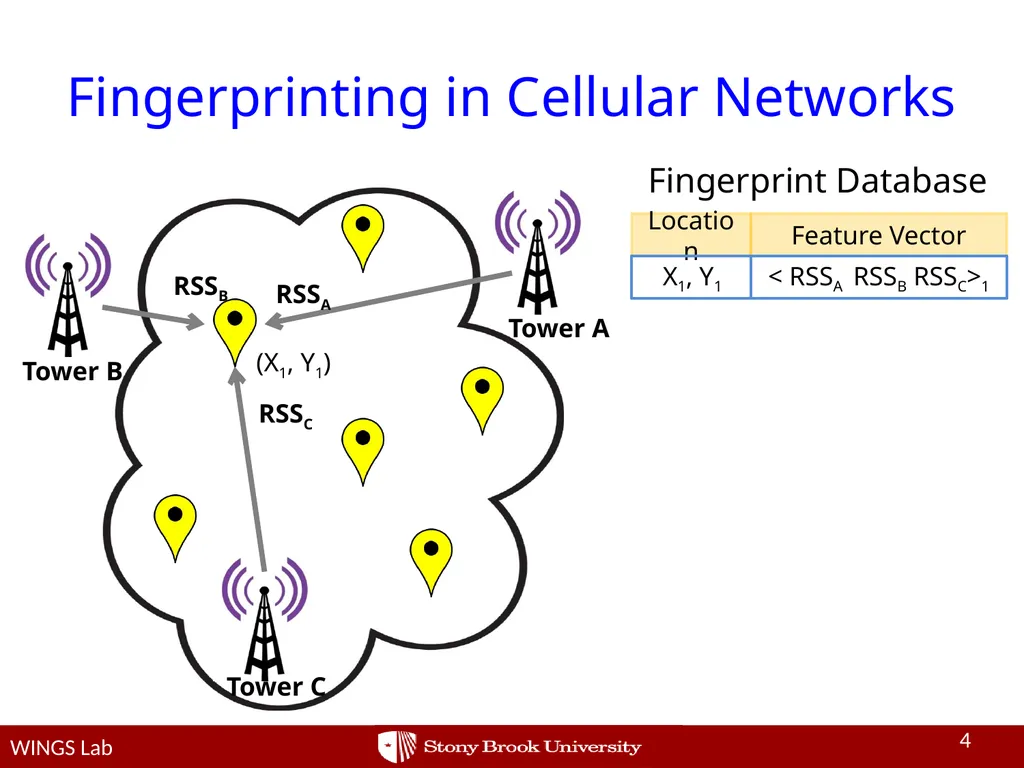
Fingerprinting in Cellular Networks WINGS Lab 4 Tower C Tower B Tower A (X1, Y1) RSSC RSSB RSSA Location Feature Vector X1, Y1 < RSSA RSSB RSSC>1 Fingerprint Database WINGS Lab 4<br>
05
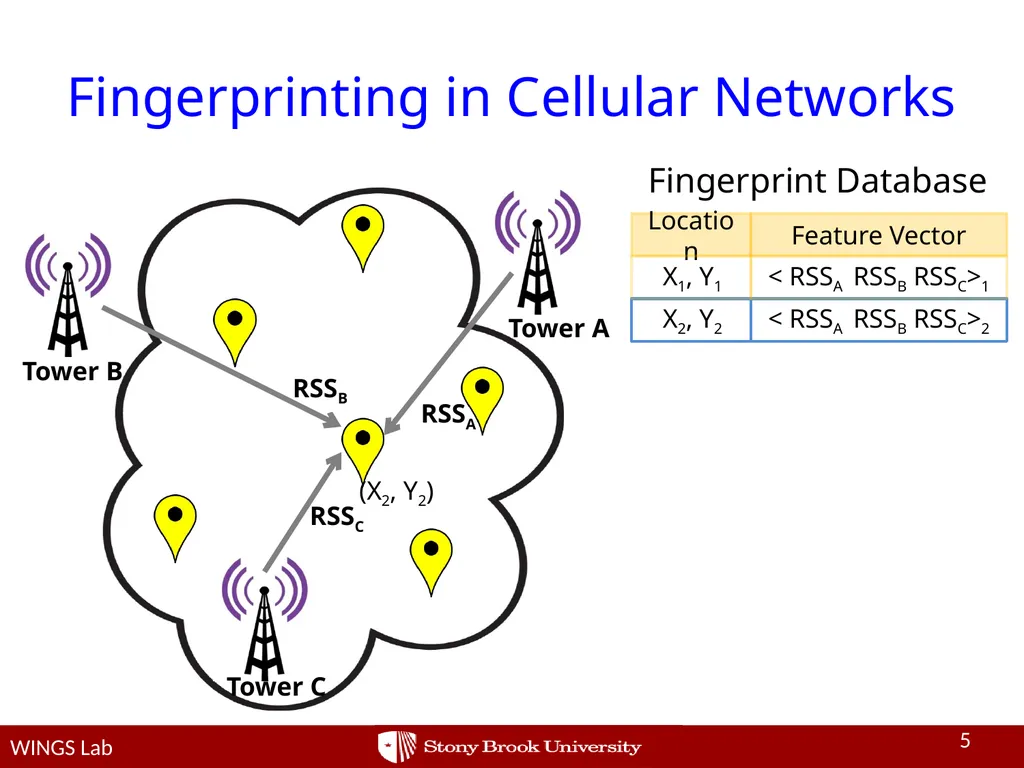
Fingerprinting in Cellular Networks WINGS Lab 5 Tower C Tower B Tower A (X2, Y2) RSSC RSSB RSSA X2, Y2 < RSSA RSSB RSSC>2 Location Feature Vector X1, Y1 < RSSA RSSB RSSC>1 Fingerprint Database WINGS Lab 5<br>
06
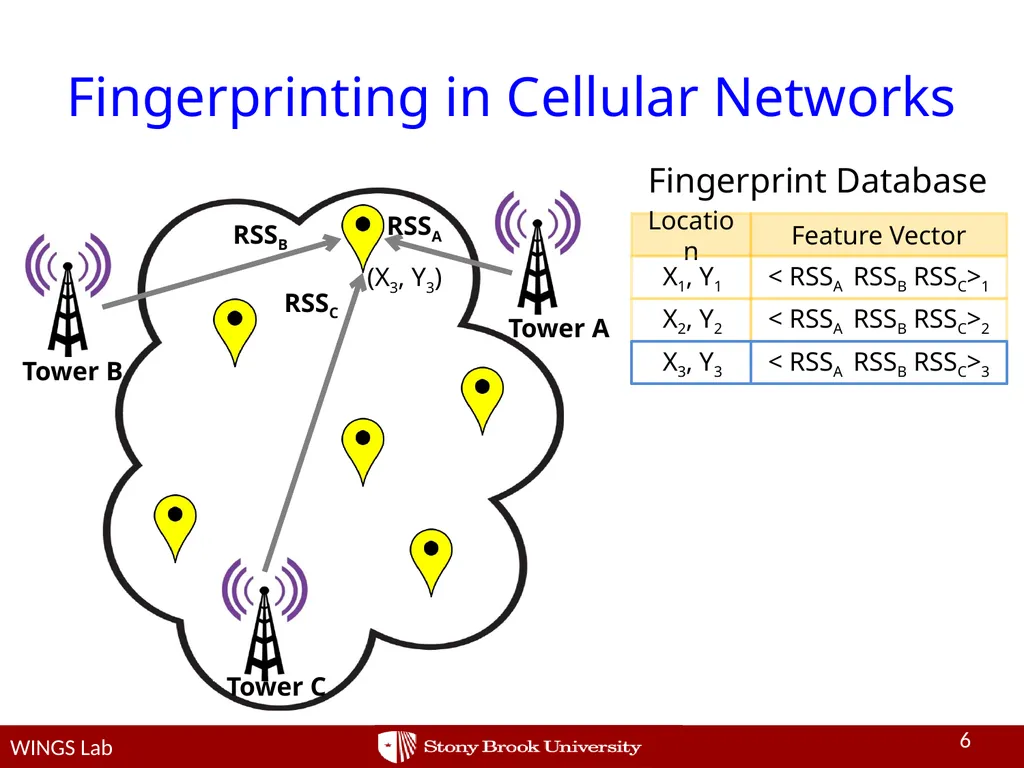
Fingerprinting in Cellular Networks WINGS Lab 6 Tower C Tower B Tower A (X3, Y3) RSSC RSSB RSSA X2, Y2 < RSSA RSSB RSSC>2 Location Feature Vector X1, Y1 < RSSA RSSB RSSC>1 Fingerprint Database X3, Y3 < RSSA RSSB RSSC>3 WINGS Lab 6<br>
07
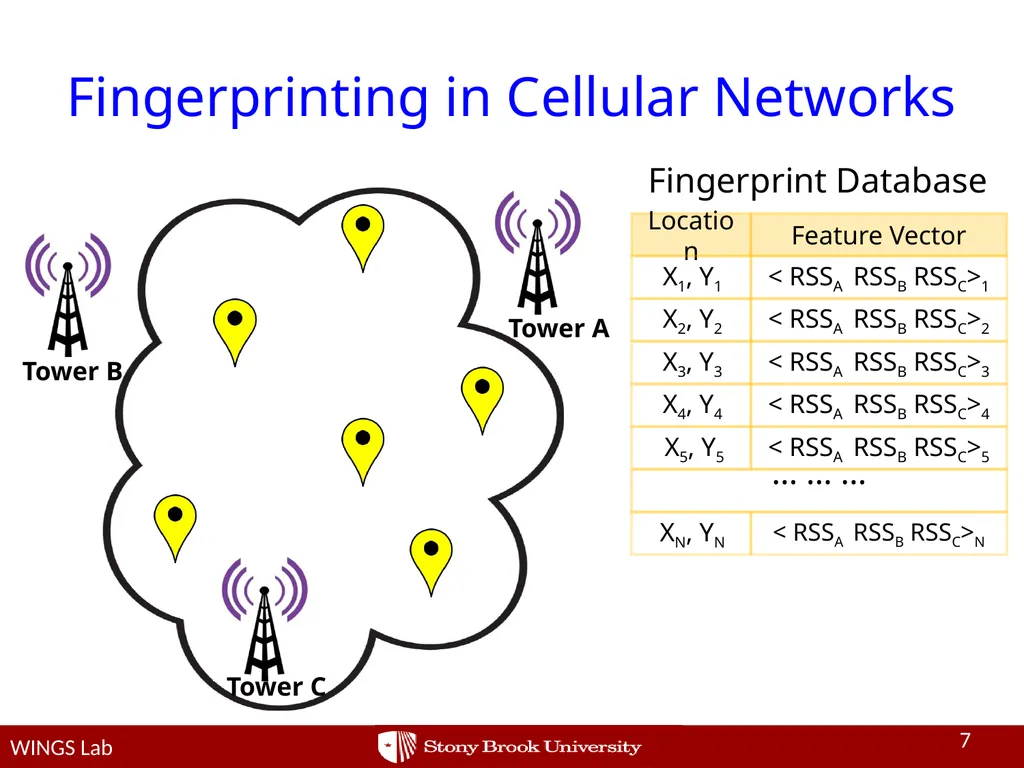
Fingerprinting in Cellular Networks WINGS Lab 7 Tower C Tower B Tower A X2, Y2 < RSSA RSSB RSSC>2 Location Feature Vector X1, Y1 < RSSA RSSB RSSC>1 Fingerprint Database X3, Y3 < RSSA RSSB RSSC>3 X4, Y4 < RSSA RSSB RSSC>4 X5, Y5 < RSSA RSSB RSSC>5 … … … XN, YN < RSSA RSSB RSSC>N WINGS Lab 7<br>
08
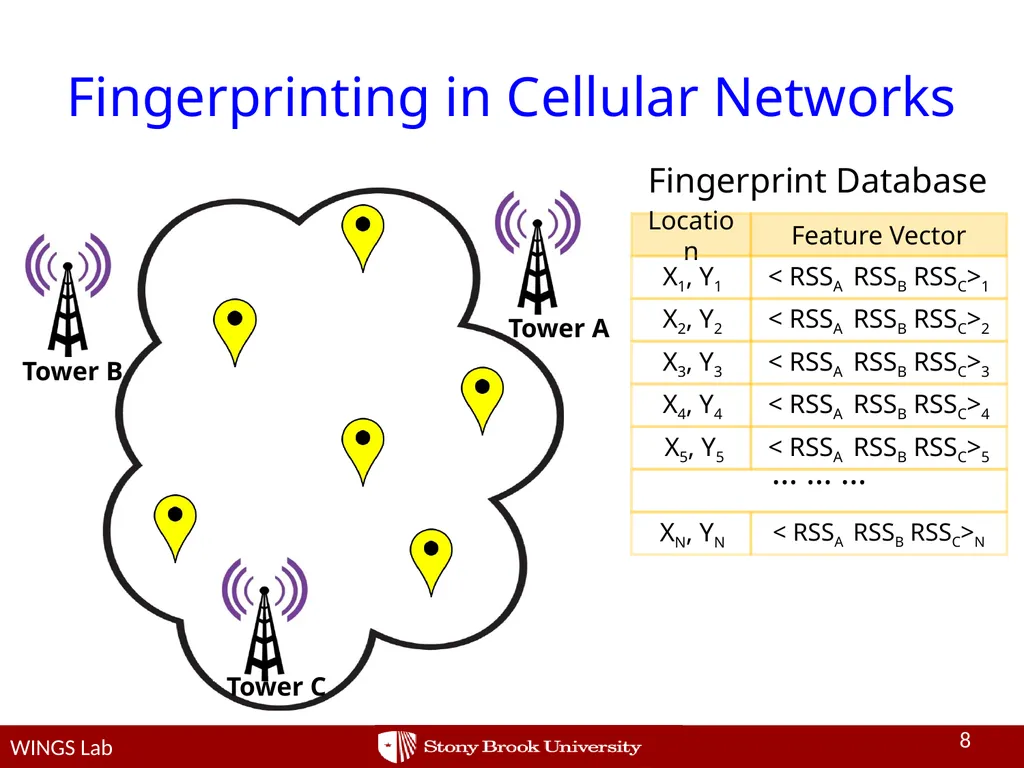
Fingerprinting in Cellular Networks WINGS Lab 8 Tower C Tower B Tower A X2, Y2 < RSSA RSSB RSSC>2 Location Feature Vector X1, Y1 < RSSA RSSB RSSC>1 Fingerprint Database X3, Y3 < RSSA RSSB RSSC>3 X4, Y4 < RSSA RSSB RSSC>4 X5, Y5 < RSSA RSSB RSSC>5 … … … XN, YN < RSSA RSSB RSSC>N WINGS Lab 8<br>
09
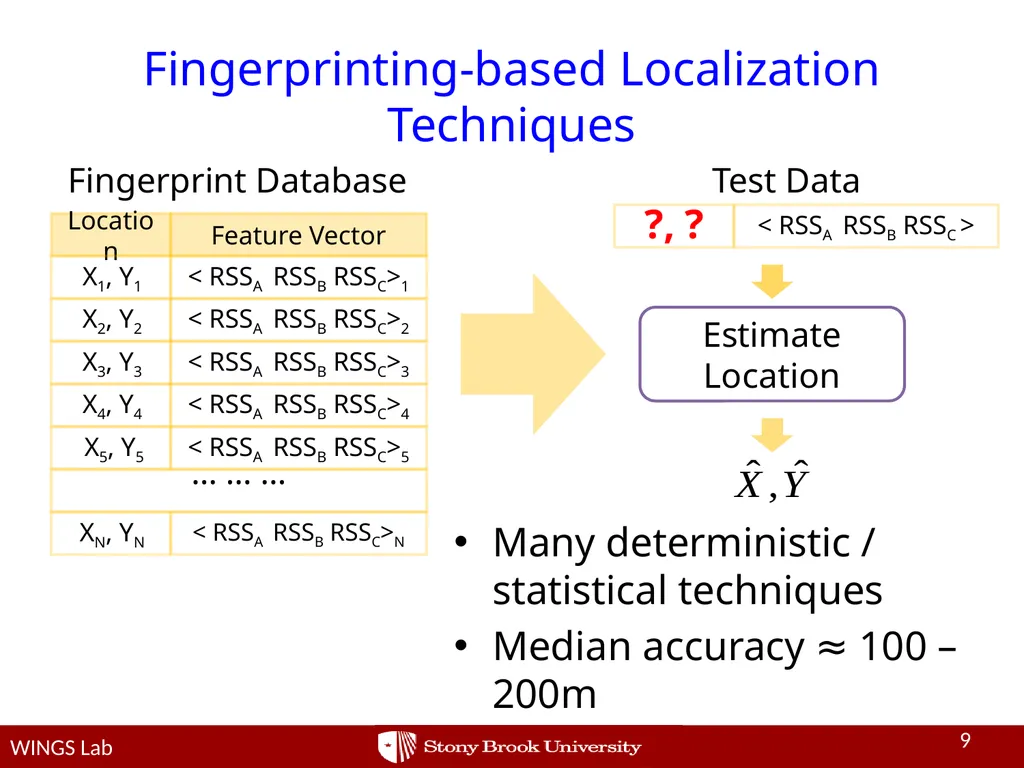
Fingerprinting-based Localization Techniques Many deterministic / statistical techniques
Median accuracy ≈ 100 – 200m 9 WINGS Lab X2, Y2 < RSSA RSSB RSSC>2 Location Feature Vector X1, Y1 < RSSA RSSB RSSC>1 Fingerprint Database X3, Y3 < RSSA RSSB RSSC>3 X4, Y4 < RSSA RSSB RSSC>4 X5, Y5 < RSSA RSSB RSSC>5 … … … XN, YN < RSSA RSSB RSSC>N Estimate Location ?, ? < RSSA RSSB RSSC > Test Data WINGS Lab 9<br>
10
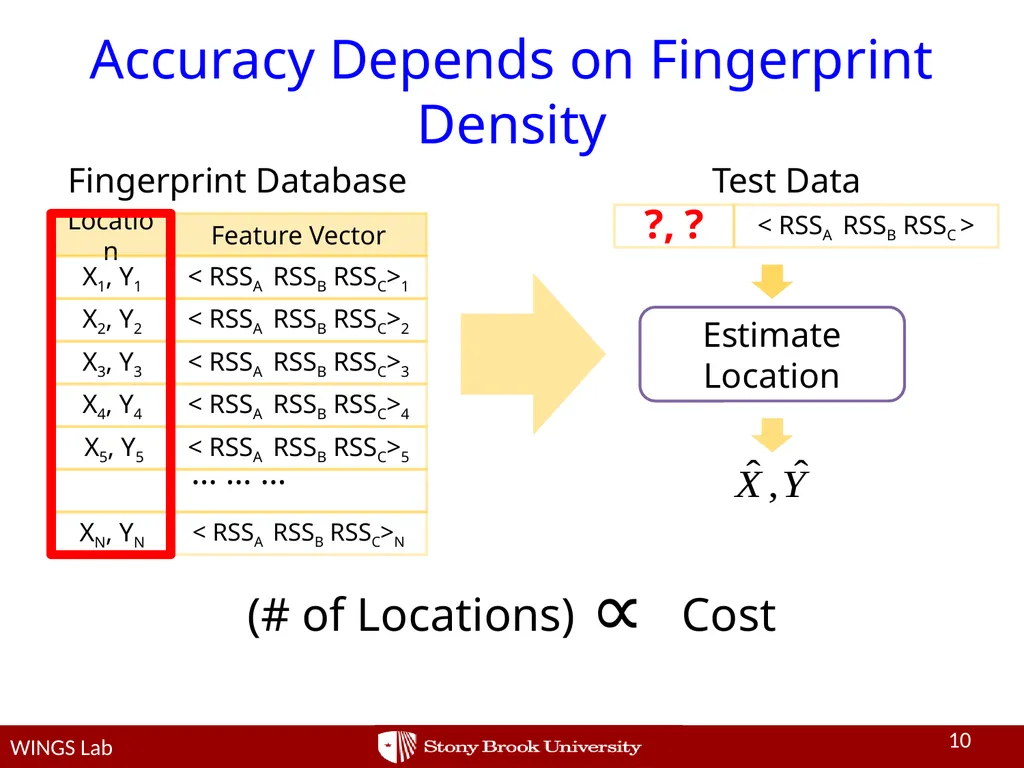
Accuracy Depends on Fingerprint Density WINGS Lab 10 X2, Y2 < RSSA RSSB RSSC>2 Location Feature Vector X1, Y1 < RSSA RSSB RSSC>1 Fingerprint Database X3, Y3 < RSSA RSSB RSSC>3 X4, Y4 < RSSA RSSB RSSC>4 X5, Y5 < RSSA RSSB RSSC>5 … … … XN, YN < RSSA RSSB RSSC>N Estimate Location ?, ? < RSSA RSSB RSSC > Test Data (# of Locations) Cost ∝ WINGS Lab 10<br>
11
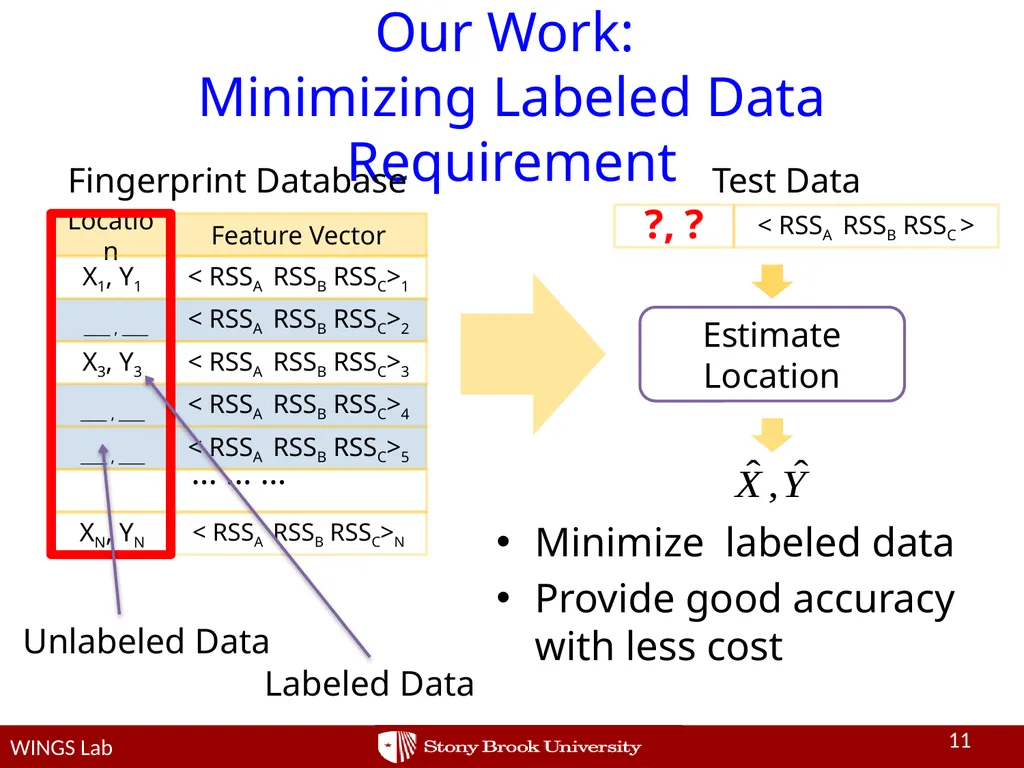
Our Work: �Minimizing Labeled Data Requirement Minimize labeled data
Provide good accuracy with less cost 11 WINGS Lab ____ , ____ < RSSA RSSB RSSC>2 Location Feature Vector X1, Y1 < RSSA RSSB RSSC>1 X3, Y3 < RSSA RSSB RSSC>3 ____ , ____ < RSSA RSSB RSSC>4 ____ , ____ < RSSA RSSB RSSC>5 … … … XN, YN < RSSA RSSB RSSC>N Estimate Location ?, ? < RSSA RSSB RSSC > Test Data Labeled Data Unlabeled Data Fingerprint Database WINGS Lab 11<br>
12
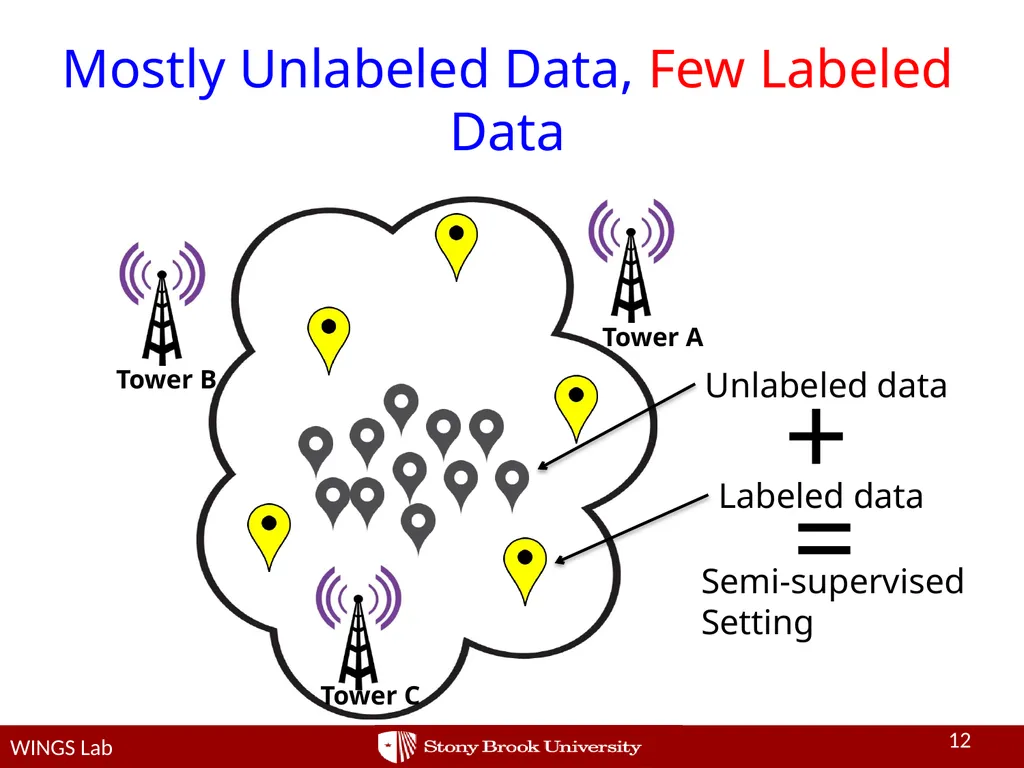
Mostly Unlabeled Data, Few Labeled Data WINGS Lab 12 Tower C Tower B Tower A Labeled data Unlabeled data Semi-supervised Setting + = WINGS Lab 12<br>
13
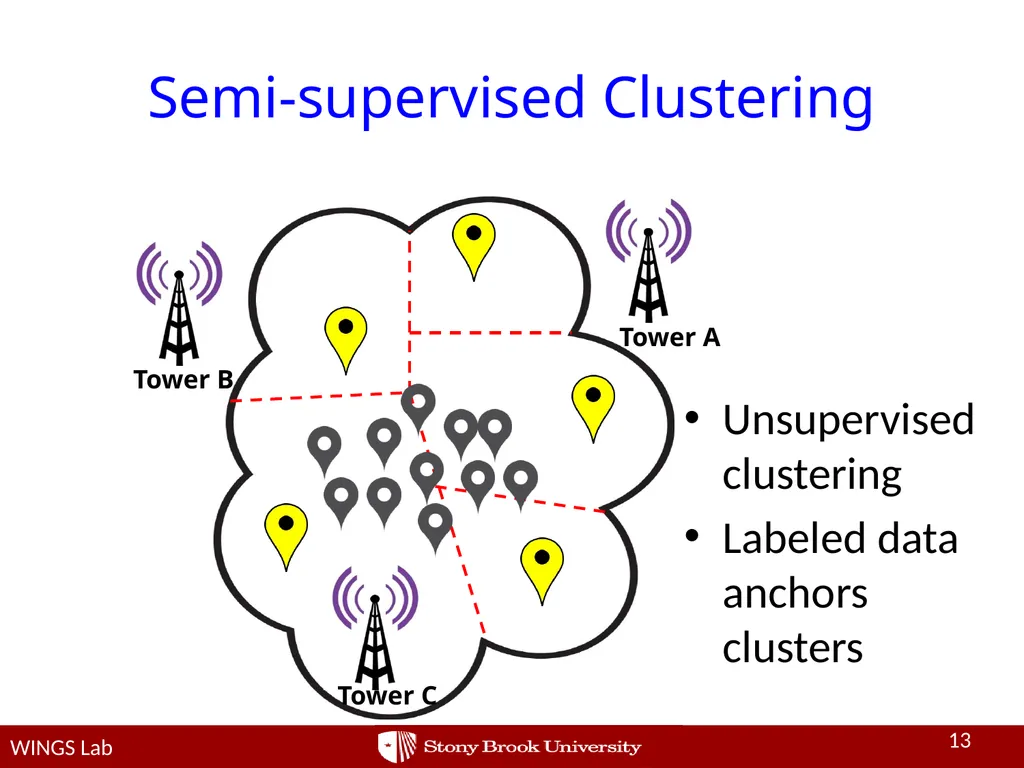
Semi-supervised Clustering Unsupervised clustering
Labeled data anchors clusters 13 WINGS Lab Tower C Tower B Tower A WINGS Lab 13<br>
14
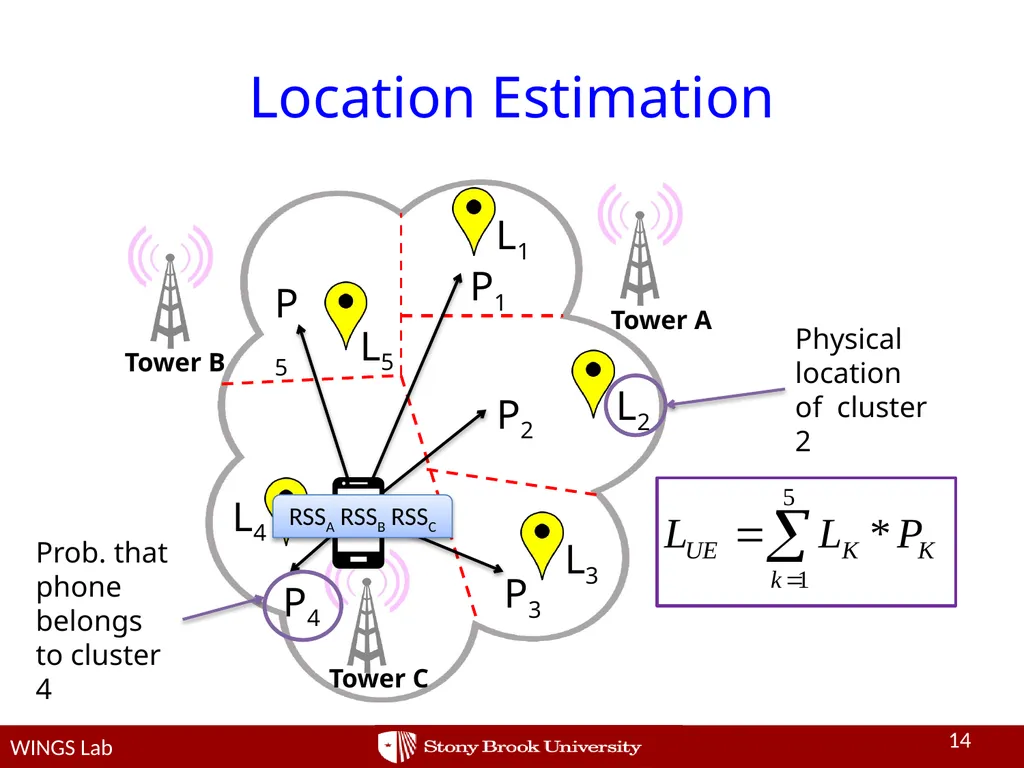
Location Estimation 14 WINGS Lab Tower C Tower B Tower A P1 P3 P5 P4 P2 Prob. that phone belongs to cluster 4 L1 L5 L4 L3 L2 Physical location of cluster 2 RSSA RSSB RSSC WINGS Lab 14<br>
15
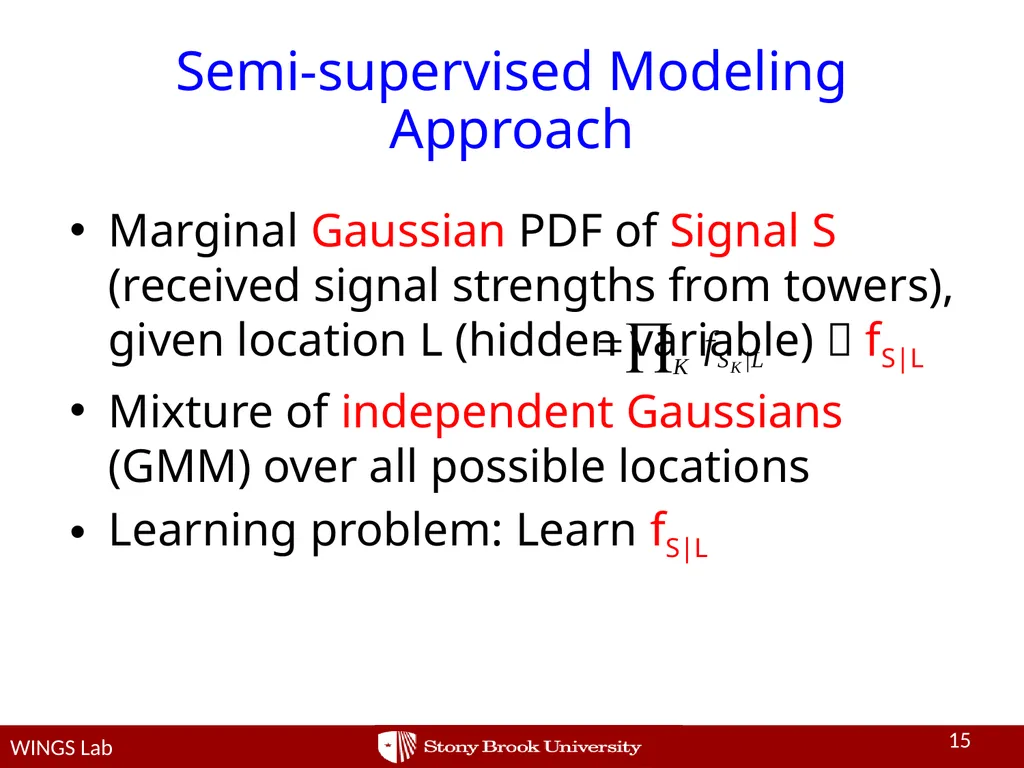
Semi-supervised Modeling Approach Marginal Gaussian PDF of Signal S (received signal strengths from towers), given location L (hidden variable) fS|L
Mixture of independent Gaussians (GMM) over all possible locations
Learning problem: Learn fS|L 15 WINGS Lab WINGS Lab 15<br>
16
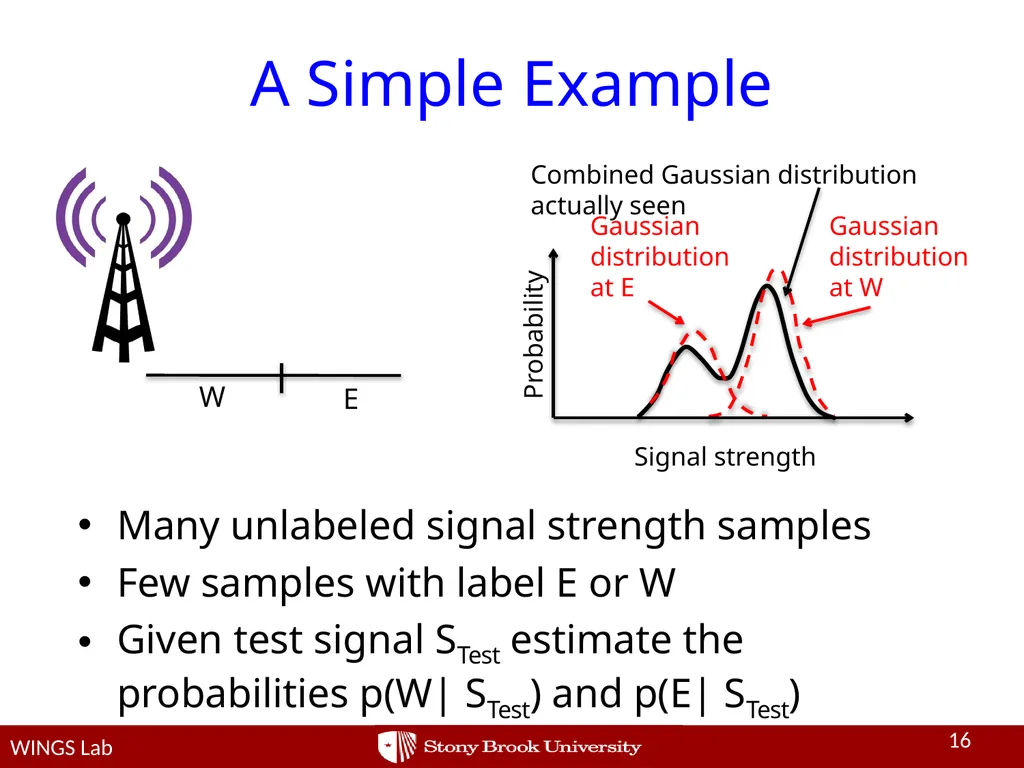
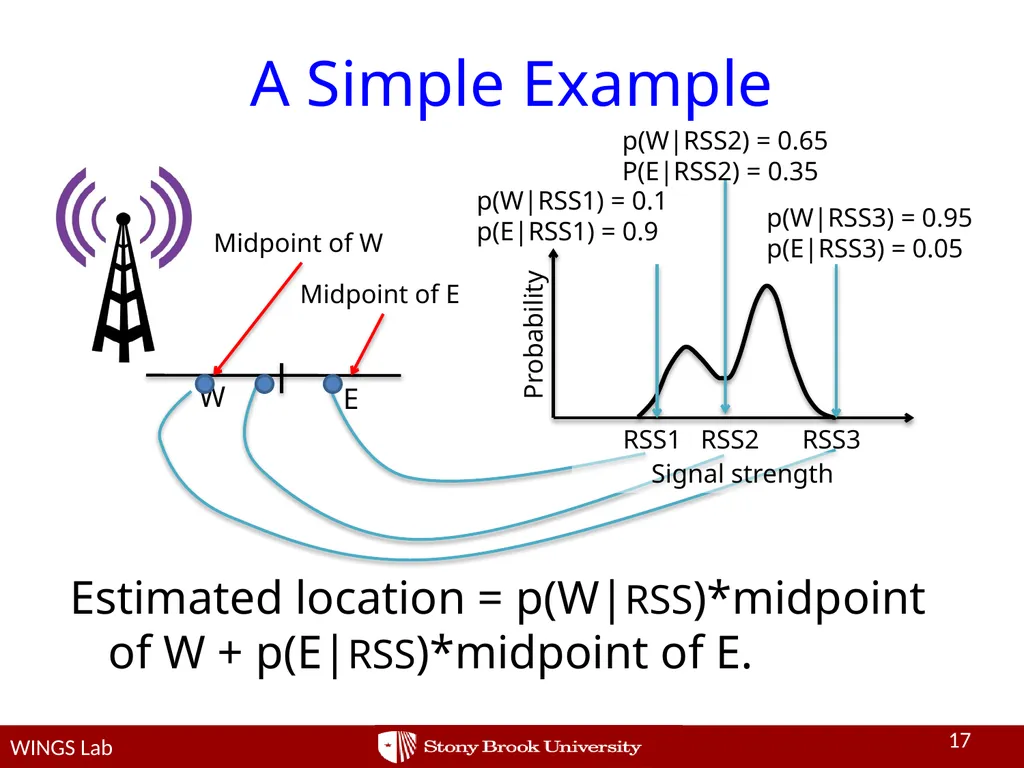
A Simple Example Many unlabeled signal strength samples
Few samples with label E or W
Given test signal STest estimate the probabilities p(W| STest) and p(E| STest) 16 W E Probability Signal strength Gaussian
distribution
at W Gaussian
distribution
at E Combined Gaussian distribution actually seen WINGS Lab WINGS Lab 16<br>
17
A Simple Example Estimated location = p(W|RSS)*midpoint of W + p(E|RSS)*midpoint of E. 17 W E Probability p(W|RSS3) = 0.95
p(E|RSS3) = 0.05 p(W|RSS1) = 0.1
p(E|RSS1) = 0.9 p(W|RSS2) = 0.65
P(E|RSS2) = 0.35 WINGS Lab RSS1 RSS2 RSS3 Midpoint of W Midpoint of E Signal strength WINGS Lab 17<br>
18
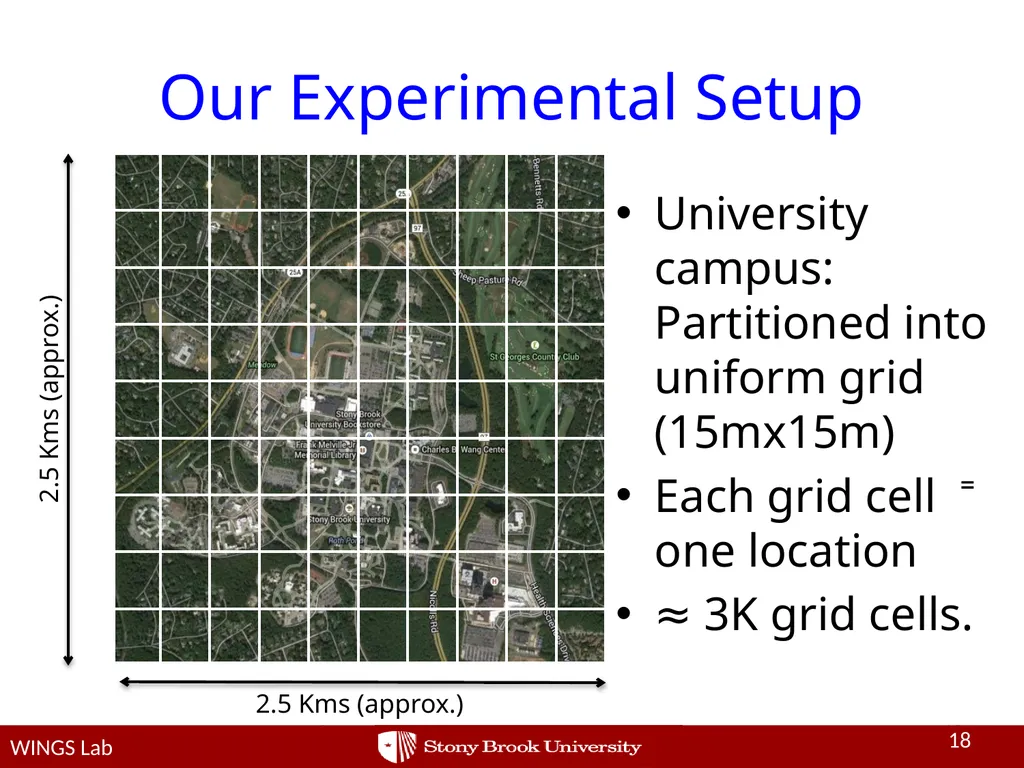
Our Experimental Setup University campus: Partitioned into uniform grid (15mx15m)
Each grid cell ⁼ one location
≈ 3K grid cells. 18 2.5 Kms (approx.) 2.5 Kms (approx.) WINGS Lab Not drawn to scale WINGS Lab 18<br>
19
Data Collected 35K samples at outdoor locations
T-Mobile’s GSM network on Nexus4/5 phone (our technique not specific to GSM though)
10K samples kept aside for testing 19 WINGS Lab WINGS Lab 19<br>
20
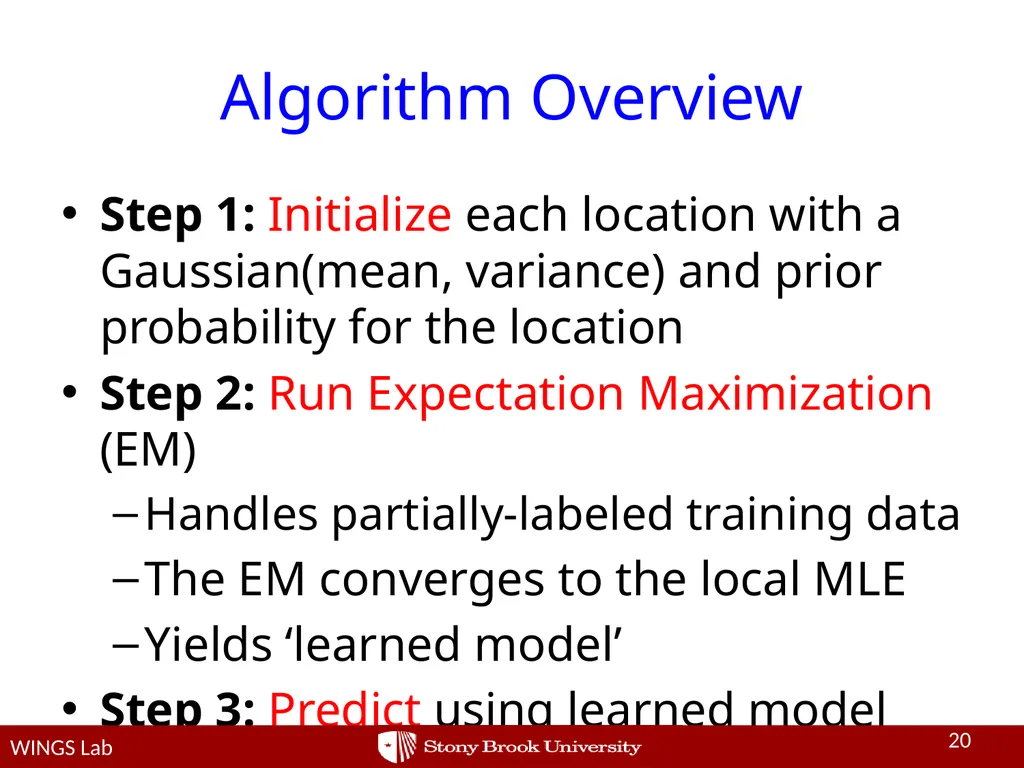
Algorithm Overview Step 1: Initialize each location with a Gaussian(mean, variance) and prior probability for the location
Step 2: Run Expectation Maximization (EM)
Handles partially-labeled training data
The EM converges to the local MLE
Yields ‘learned model’
Step 3: Predict using learned model WINGS Lab 20 WINGS Lab 20<br>
21
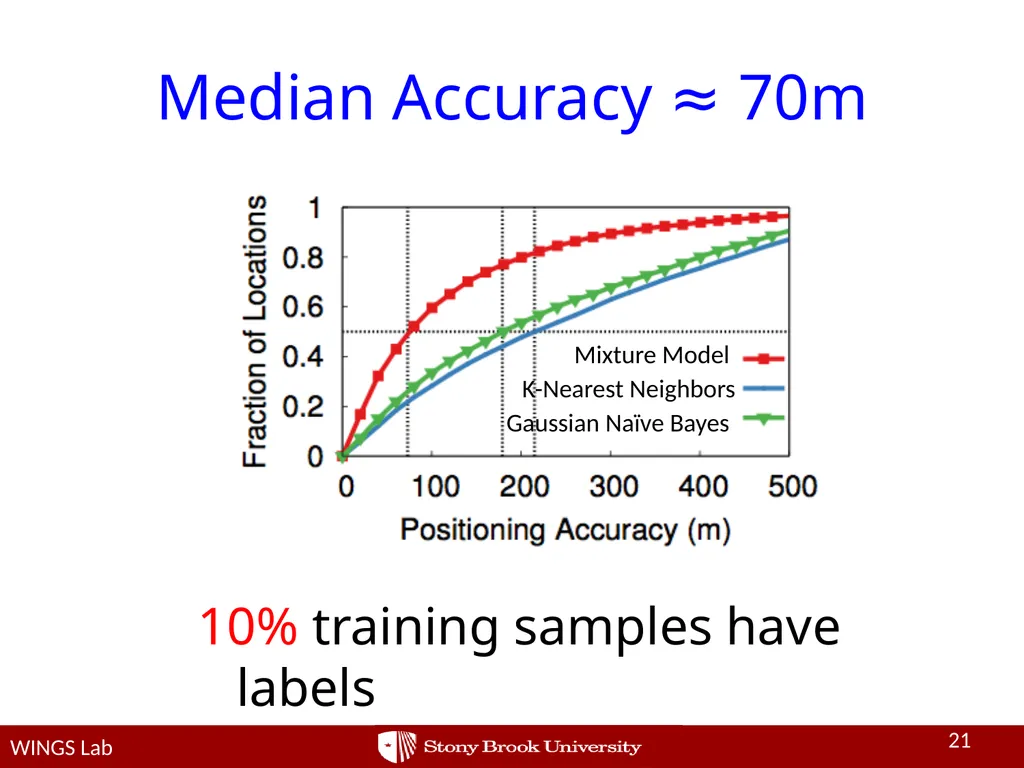
21 10% training samples have labels WINGS Lab Median Accuracy ≈ 70m Mixture Model K-Nearest Neighbors Gaussian Naïve Bayes WINGS Lab 21<br>
22
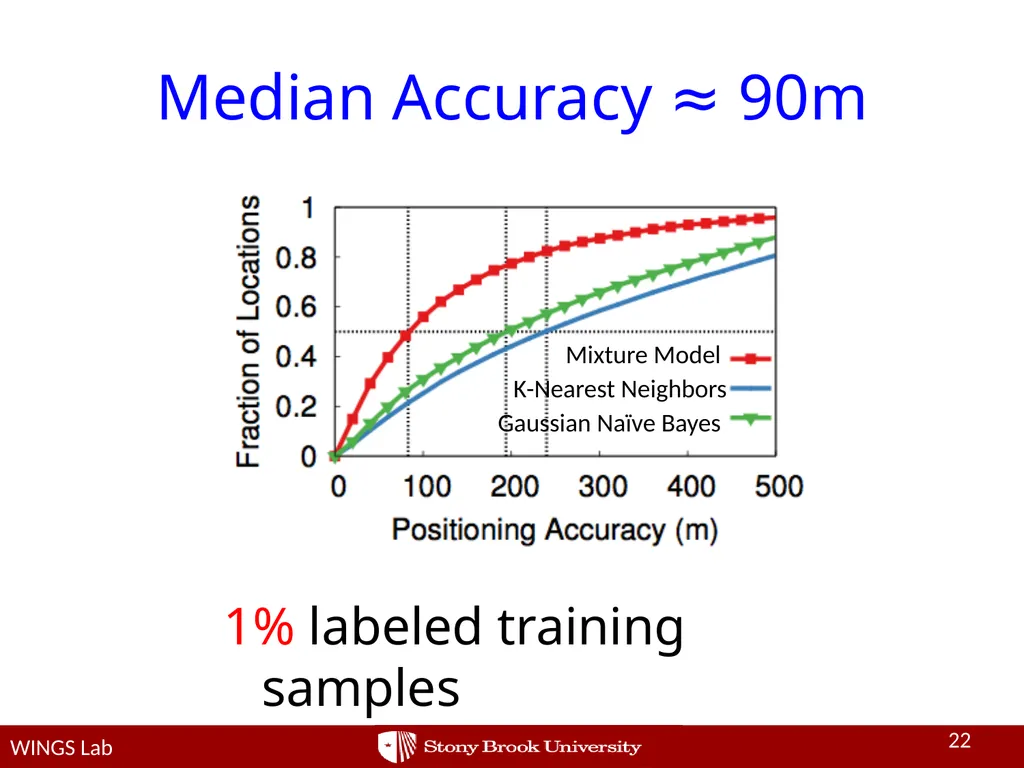
22 1% labeled training samples WINGS Lab Median Accuracy ≈ 90m Mixture Model K-Nearest Neighbors Gaussian Naïve Bayes WINGS Lab 22<br>
23
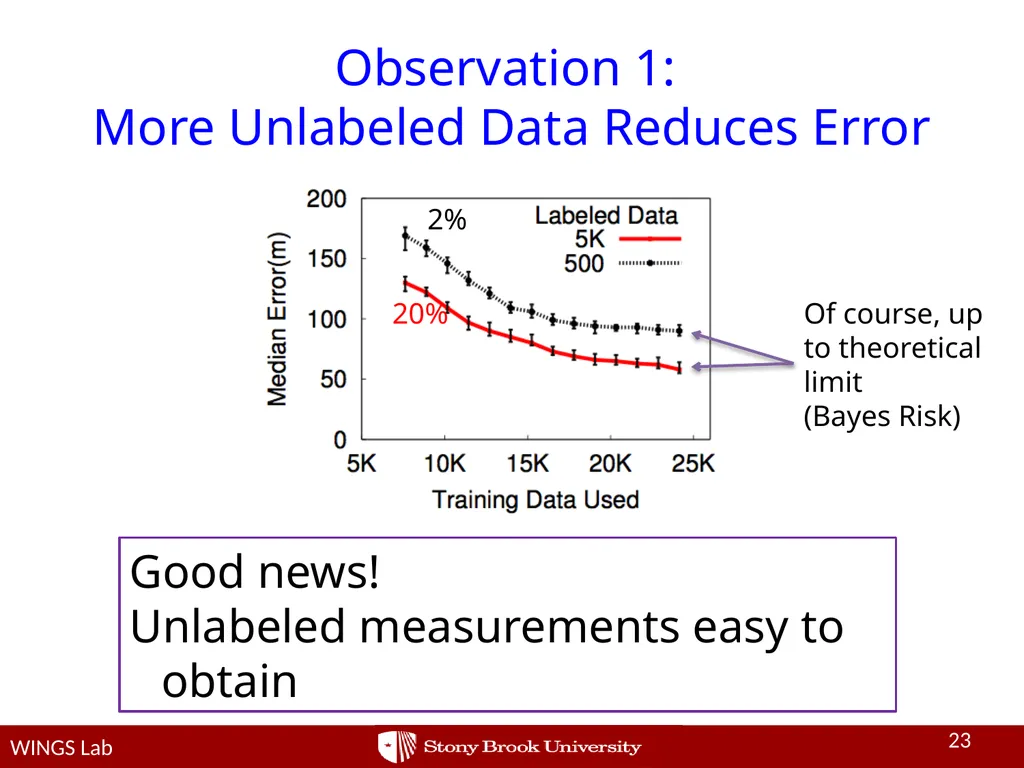
23 Good news!
Unlabeled measurements easy to obtain 2% 20% WINGS Lab Observation 1: �More Unlabeled Data Reduces Error Of course, up to theoretical limit
(Bayes Risk) WINGS Lab 23<br>
24
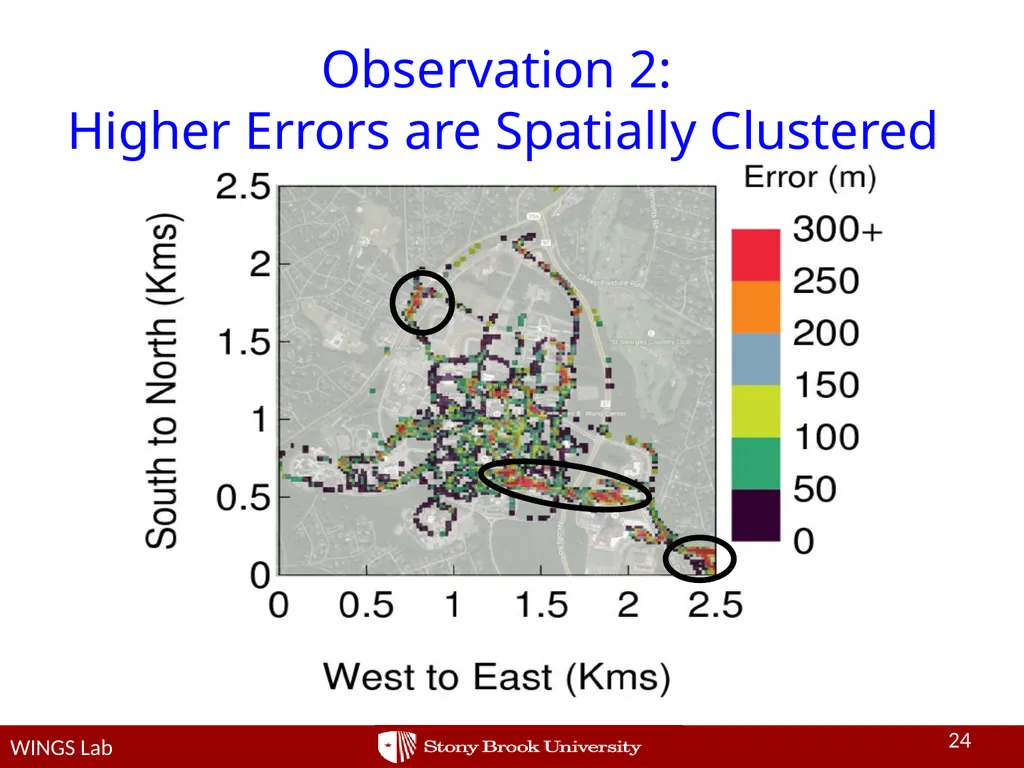
Observation 2: �Higher Errors are Spatially Clustered 24 WINGS Lab 24 WINGS Lab 24<br>
25
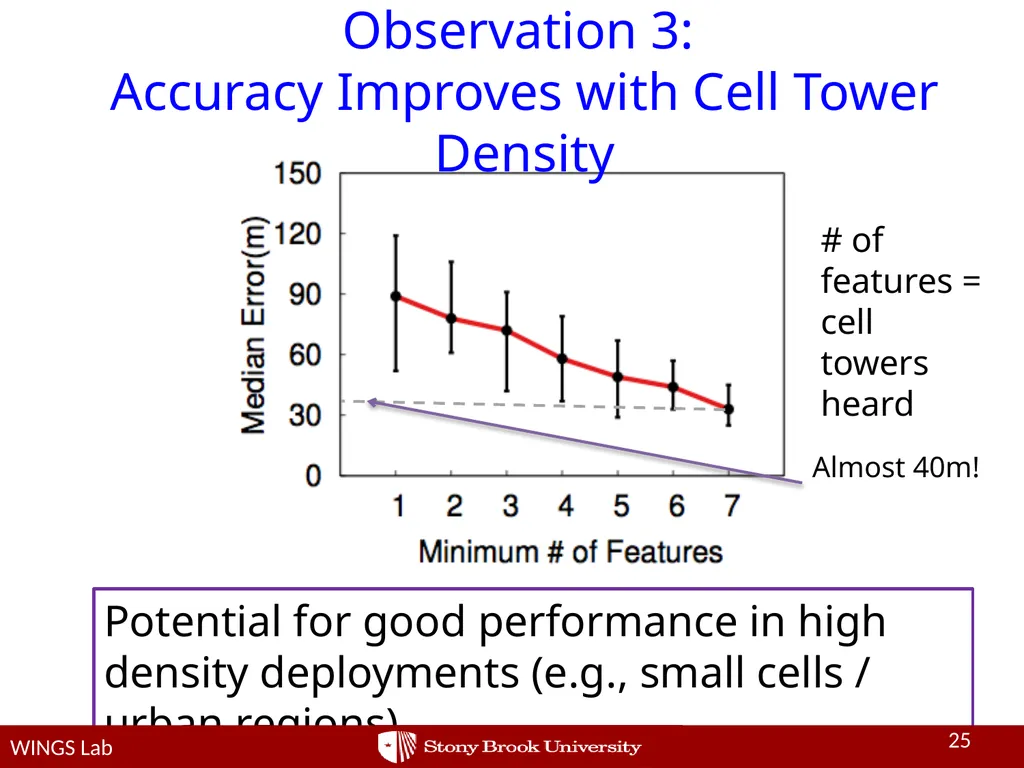
Observation 3: �Accuracy Improves with Cell Tower Density 25 WINGS Lab Potential for good performance in high density deployments (e.g., small cells / urban regions) Almost 40m! # of features = cell towers heard WINGS Lab 25 WINGS Lab 25<br>
26
Summary of Our Contributions Minimize labeled training data requirement – a cost center for operators
1% labeled data achieves ≈ 90m median accuracy
Additional unlabeled data improves accuracy, up to a theoretical limit (Bayes risk)
Possible to extend to completely unsupervised setting (see paper) 26 WINGS Lab WINGS Lab 26 WINGS Lab 26<br>
27
Acknowledgement Huawei Technologies, New Jersey, USA Thank You WINGS Lab 27 WINGS Lab 27<br>
28
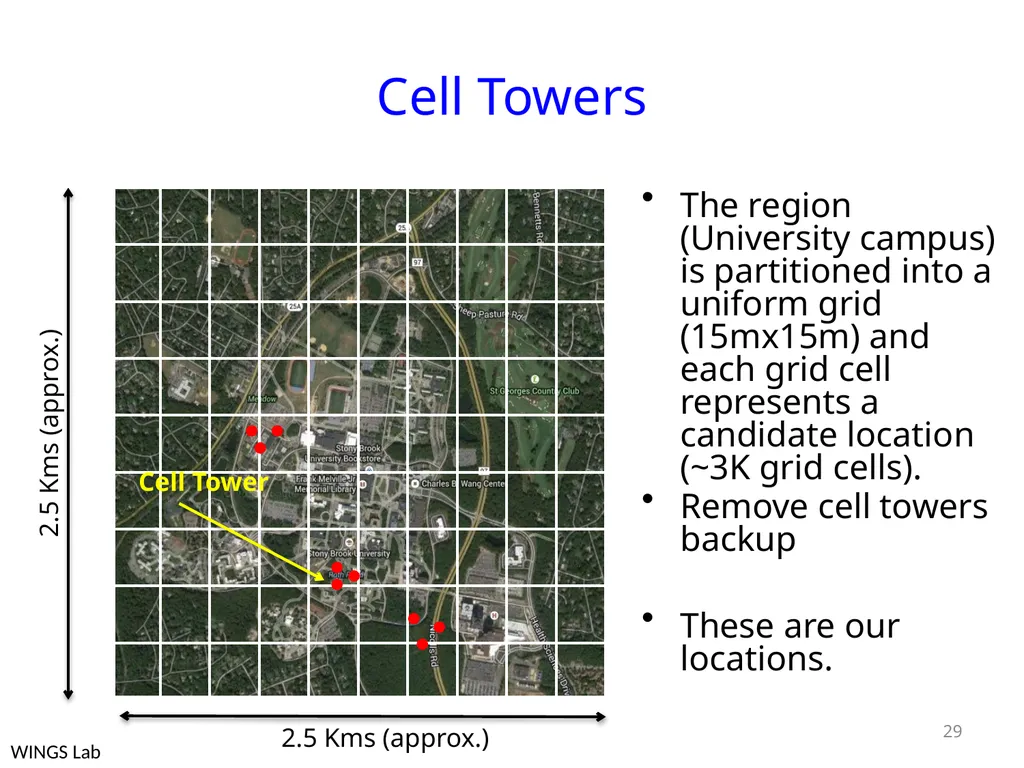
Cell Towers The region (University campus) is partitioned into a uniform grid (15mx15m) and each grid cell represents a candidate location (~3K grid cells).
Remove cell towers backup
These are our locations. 29 Cell Tower 2.5 Kms (approx.) 2.5 Kms (approx.) WINGS Lab<br>