
New Lot QC Parallel testing Labs for Life Project




Description: New Lot QC Parallel testing Labs for Life Project 2 When Do You Create a New LJ Chart? QC Lot changes Major component change on the instrument Change in the testing process, usually manufacturer-directed. Having the Right Control Chart
Related Topics
Download Presentation
"New Lot QC Parallel testing Labs for Life Project" is the property of its rightful owner. Permission is granted to download and print the materials on this website for personal, non-commercial use only, and to display it on your personal computer provided you do not modify the materials and that you retain all copyright notices contained in the materials. By downloading content from our website, you accept the terms of this agreement.
Presentation Transcript
slide1. New Lot QC
Parallel testing
Labs for Life Project<br>
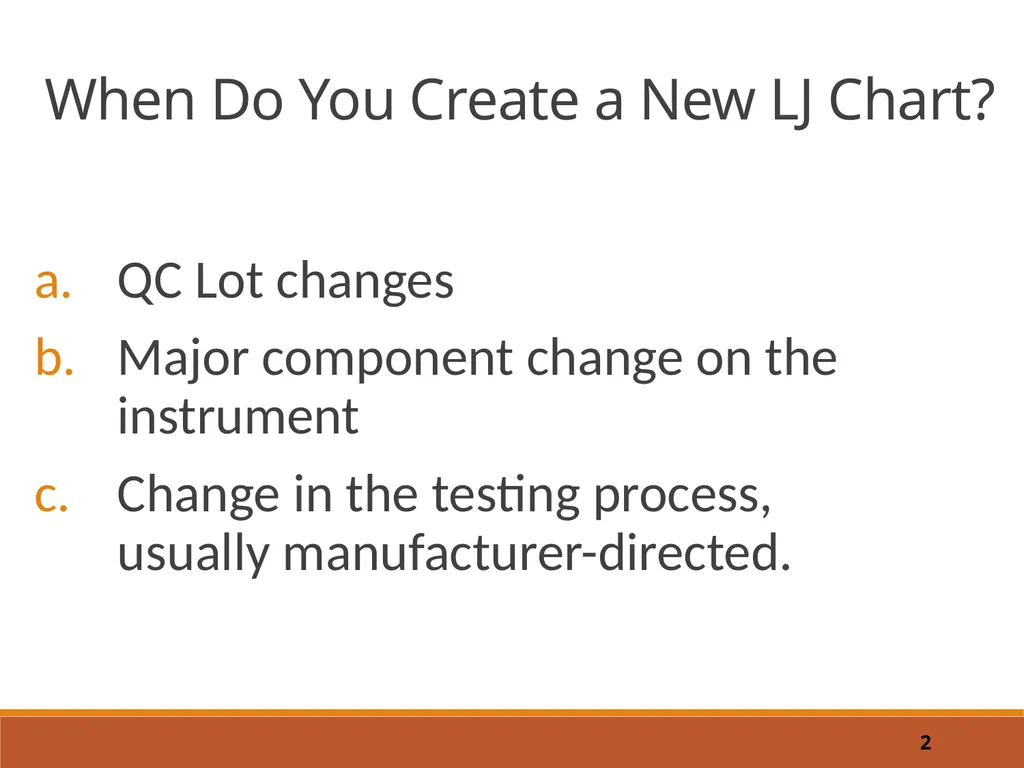
slide2. 2 When Do You Create a New LJ Chart? QC Lot changes
Major component change on the instrument
Change in the testing process, usually manufacturer-directed.<br>
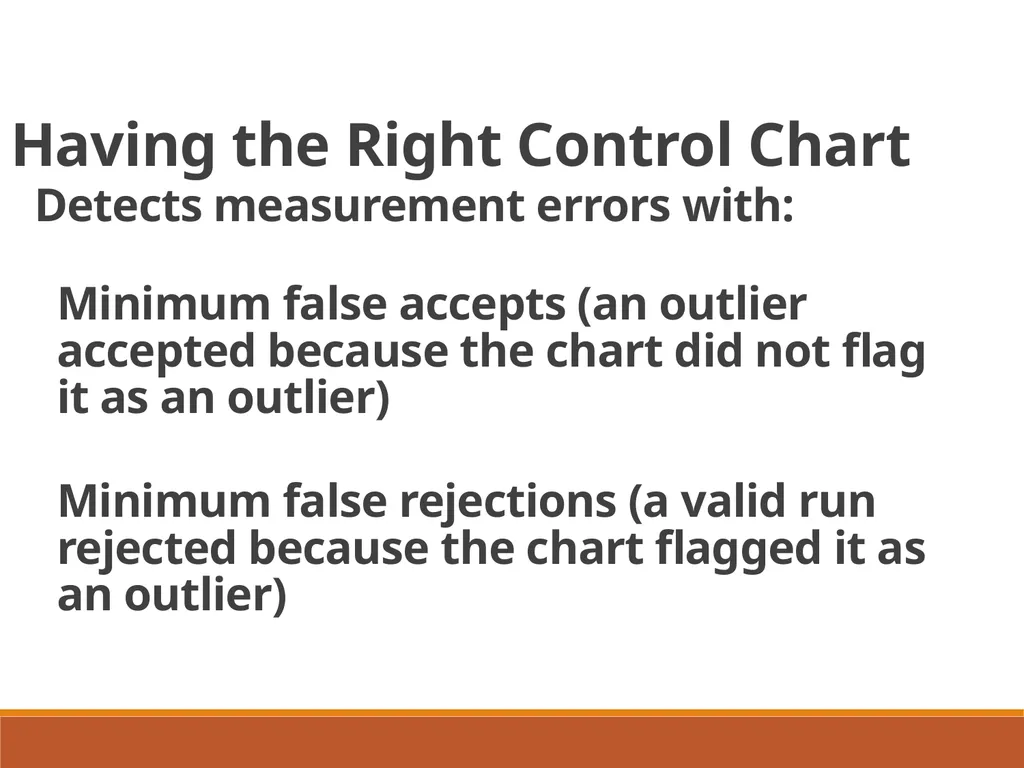
slide3. Having the Right Control Chart Detects measurement errors with:
Minimum false accepts (an outlier accepted because the chart did not flag it as an outlier)
Minimum false rejections (a valid run rejected because the chart flagged it as an outlier)<br>
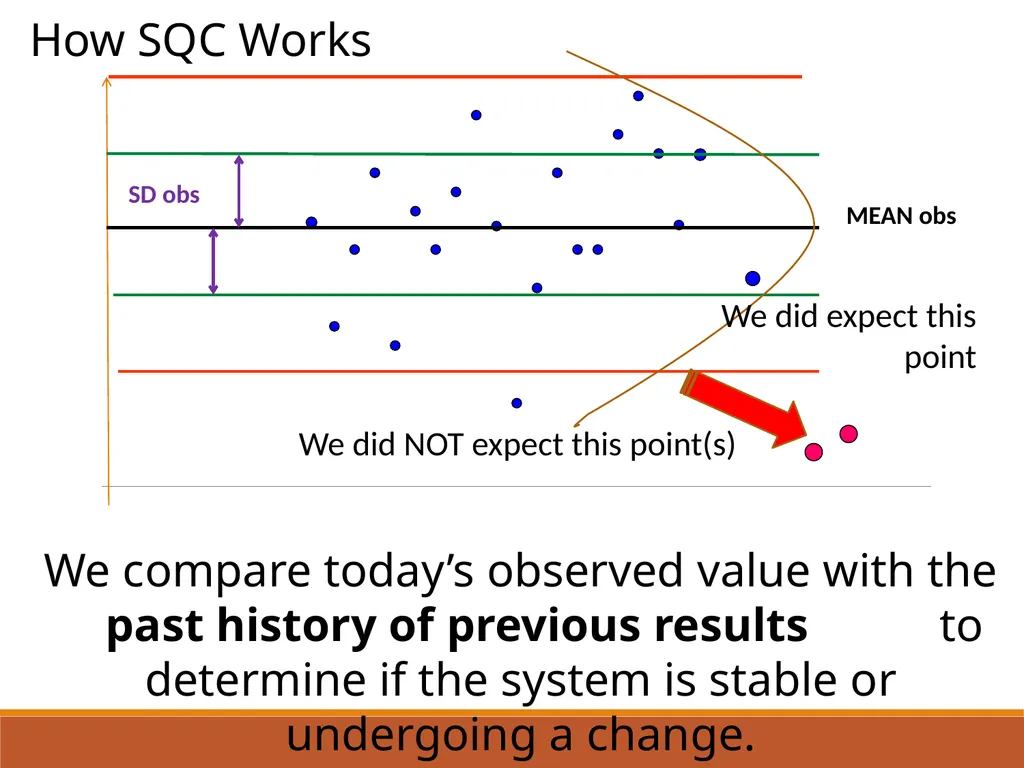
slide4. MEAN obs SD obs We did NOT expect this point(s) We did expect this point How SQC Works We compare today’s observed value with the past history of previous results to determine if the system is stable or undergoing a change.<br>
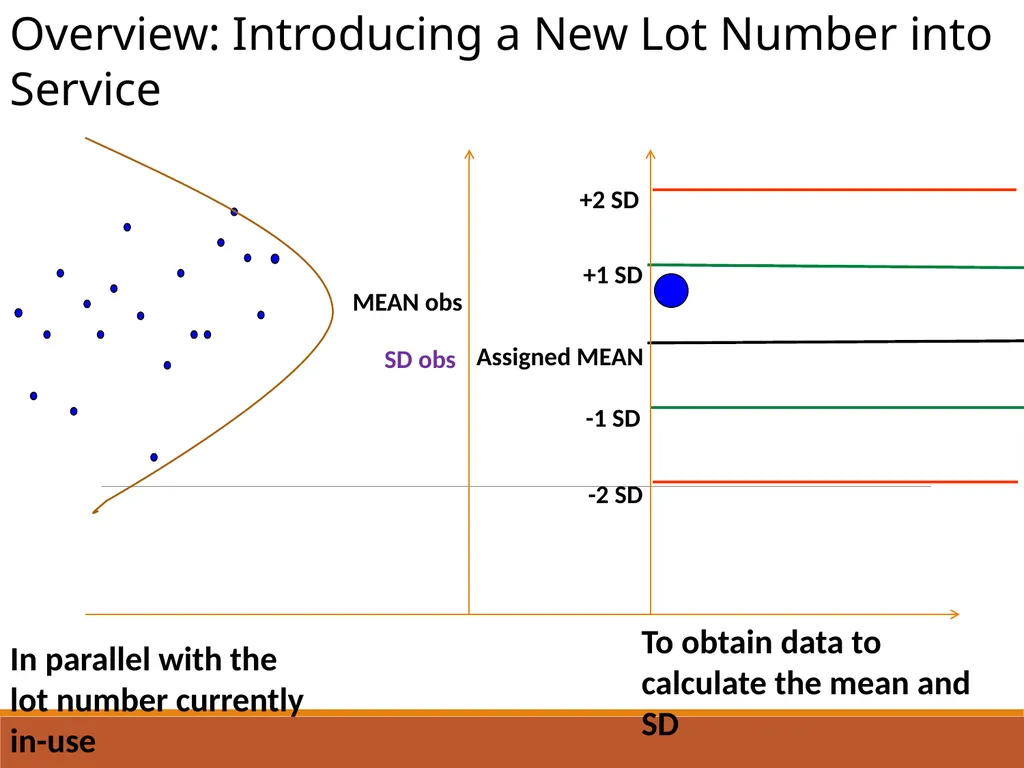
slide5. MEAN obs SD obs In parallel with the lot number currently in-use Overview: Introducing a New Lot Number into Service To obtain data to calculate the mean and SD<br>
slide6. Evaluate your
QC
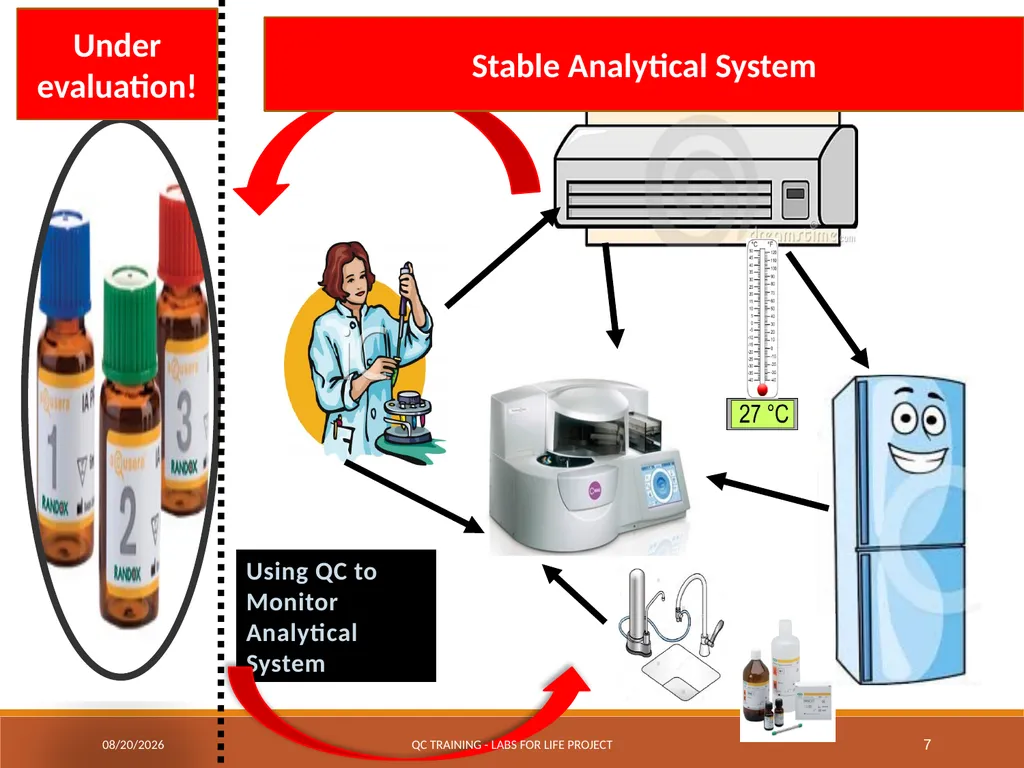
with a stable analytical system
before your QC can evaluate your analytical system for instability!
True Democracy!<br>
slide7. 7/7/2017 QC Training - Labs for Life Project 7 Stable Analytical System Under evaluation!<br>
slide8. Why Parallel testing? Collecting data of the New Lot QC material In Parallel With The Currently (In-use)Lot of QC
Manufacturer stated mean and SD are to be verified before the QC material is used for patient reporting
System Should be Stable
Old/ running lot is run to assure that the system is stable
For patient results reporting
For validating the data from new lot
New Lot: To collect history (data points). A mean and an SD to use the new lot for monitoring the system
Parallel testing is performed whether the control is assayed or un-assayed<br>
slide9. How? Ideally a minimum of at least 20 measurements20 (to know inherent variability of the system) is ideal, to be done on separate days when the measurement system is known to be stable( based on QC results from existing lots)
Establish the Mean and SD and transport to a new LJ chart
Once verified and values are confidently assigned, the QC can be now used to monitor your analytical system’s performance<br>
slide10. An alternative : What if lab does not have the time or the resources for 20 parallel runs? Using the analyte’s old %CV and the new mean of 4-5 runs
Get 4-5 values of the new QC
Find the Mean and
Derive the SD by using the formula
SD = CV (from old lot) * Mean (from new lot)
Apply on the new control chart Ensure that the System is stable
Mean not drifting<br>
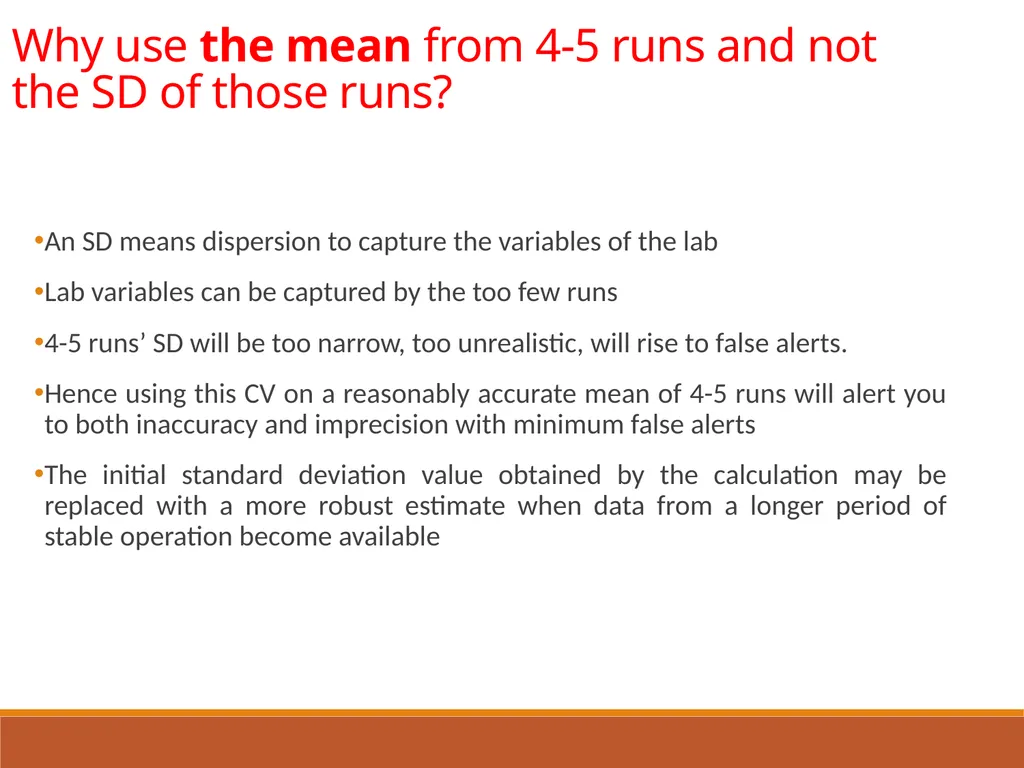
slide11. Why use the mean from 4-5 runs and not the SD of those runs? An SD means dispersion to capture the variables of the lab
Lab variables can be captured by the too few runs
4-5 runs’ SD will be too narrow, too unrealistic, will rise to false alerts.
Hence using this CV on a reasonably accurate mean of 4-5 runs will alert you to both inaccuracy and imprecision with minimum false alerts
The initial standard deviation value obtained by the calculation may be replaced with a more robust estimate when data from a longer period of stable operation become available<br>
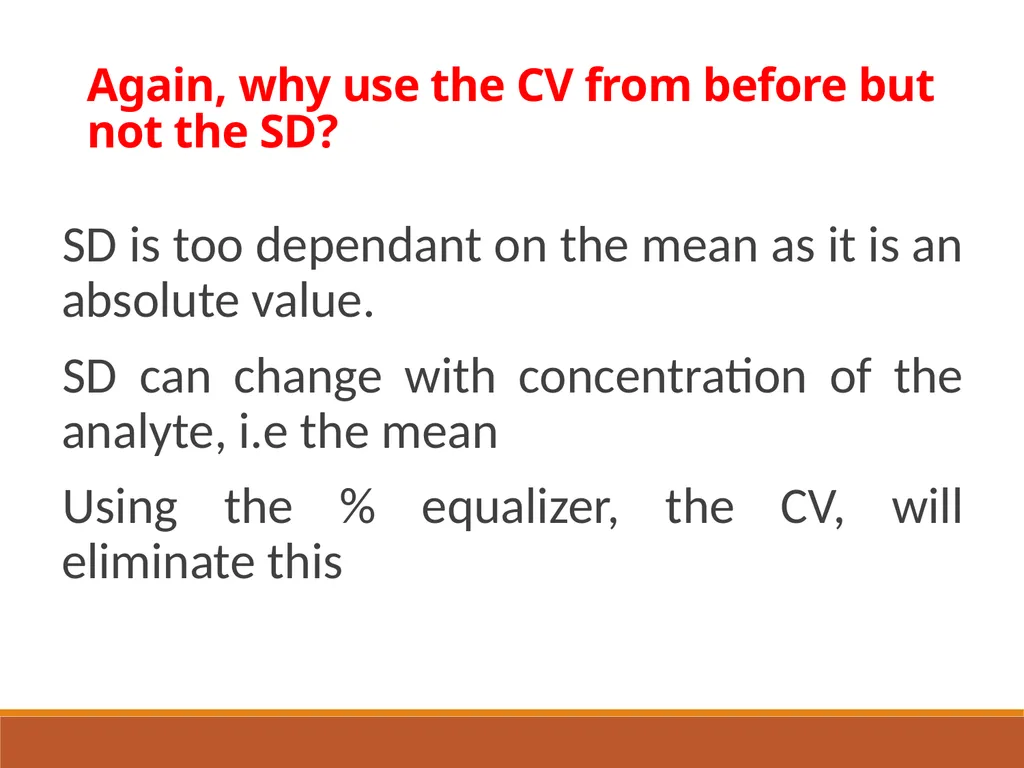
slide12. Again, why use the CV from before but not the SD? SD is too dependant on the mean as it is an absolute value.
SD can change with concentration of the analyte, i.e the mean
Using the % equalizer, the CV, will eliminate this<br>
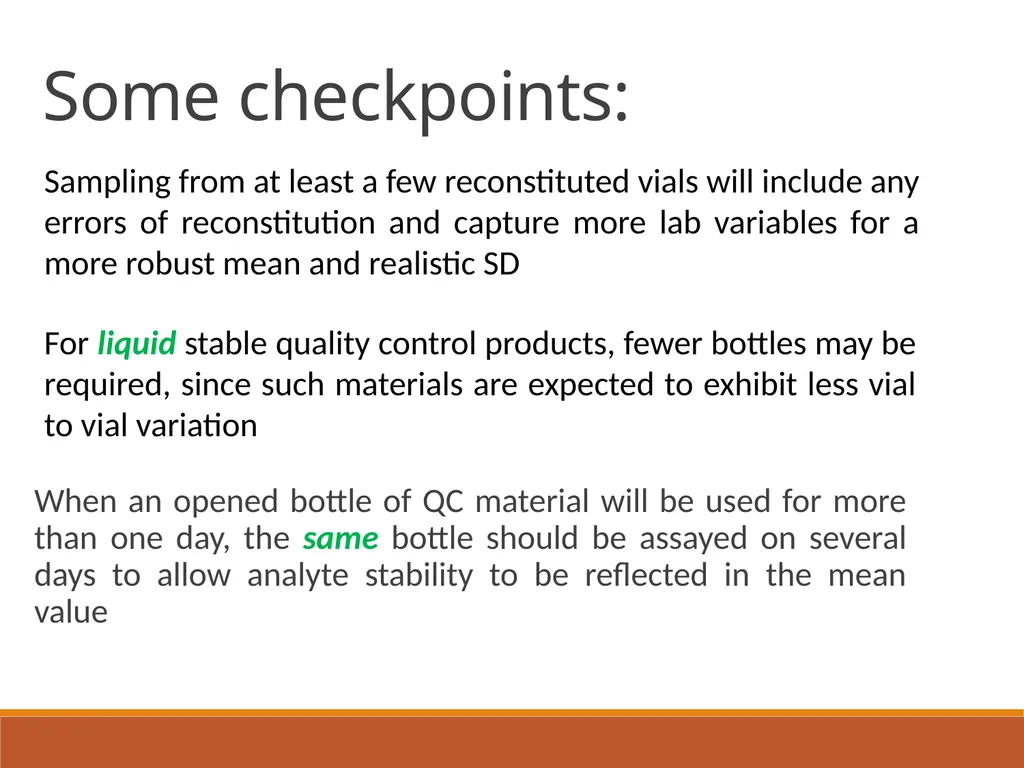
slide13. Some checkpoints: When an opened bottle of QC material will be used for more than one day, the same bottle should be assayed on several days to allow analyte stability to be reflected in the mean value Sampling from at least a few reconstituted vials will include any errors of reconstitution and capture more lab variables for a more robust mean and realistic SD For liquid stable quality control products, fewer bottles may be required, since such materials are expected to exhibit less vial to vial variation<br>
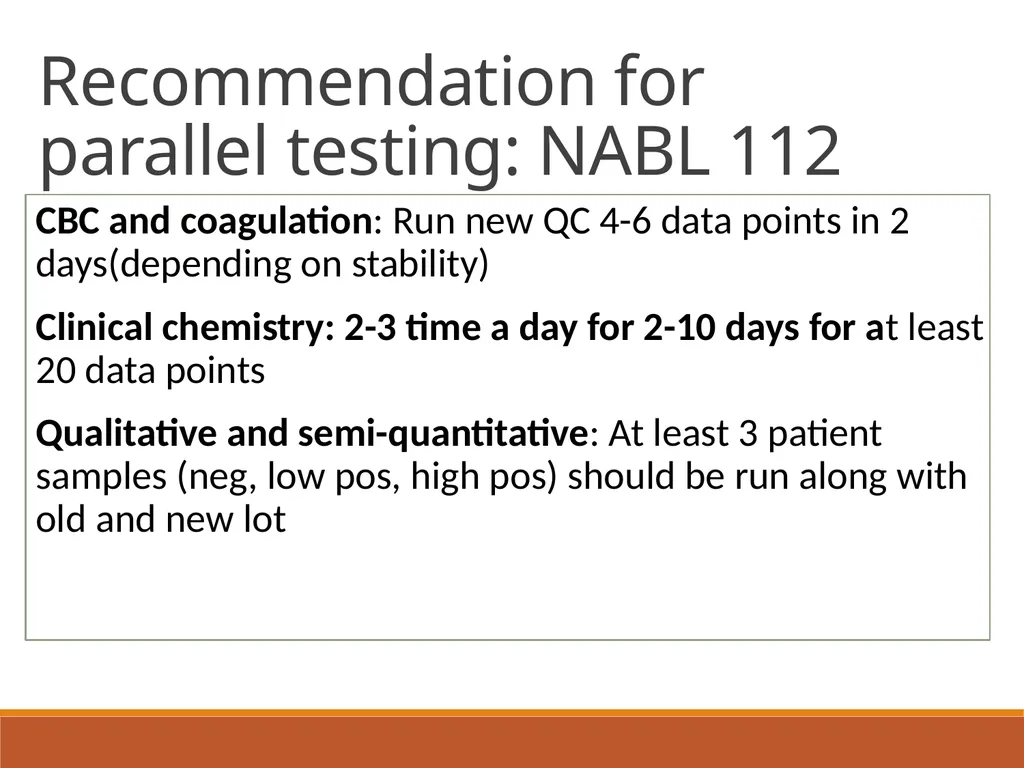
slide14. Recommendation for parallel testing: NABL 112 CBC and coagulation: Run new QC 4-6 data points in 2 days(depending on stability)
Clinical chemistry: 2-3 time a day for 2-10 days for at least 20 data points
Qualitative and semi-quantitative: At least 3 patient samples (neg, low pos, high pos) should be run along with old and new lot<br>
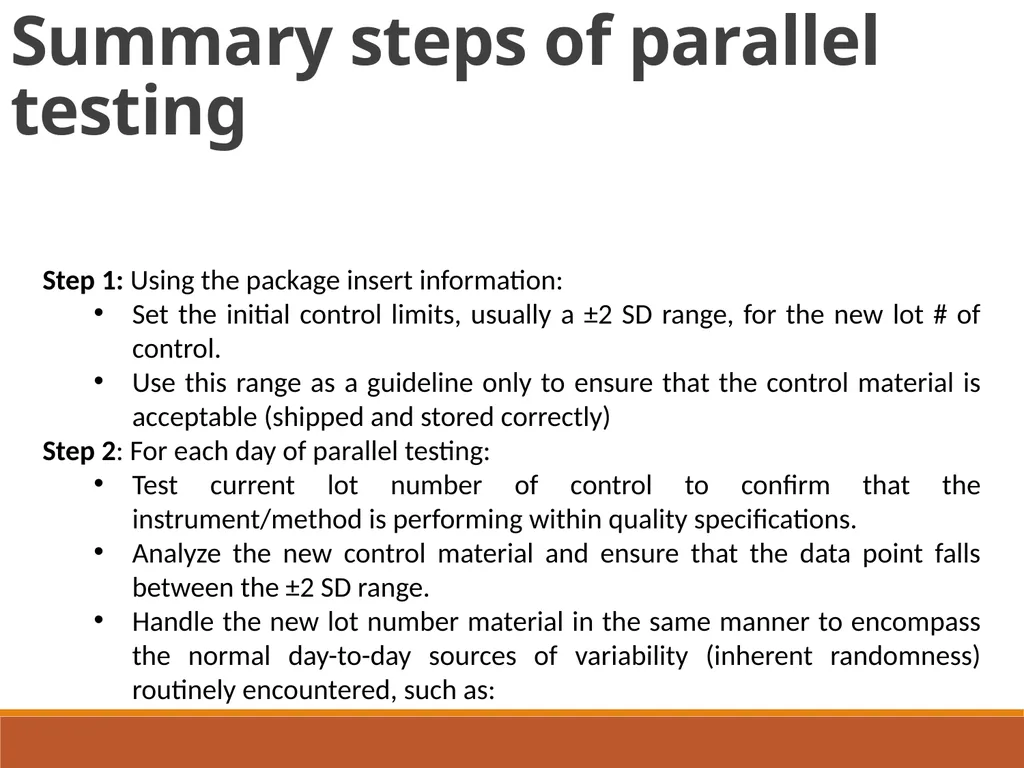
slide15. Summary steps of parallel testing Step 1: Using the package insert information:
Set the initial control limits, usually a ±2 SD range, for the new lot # of control.
Use this range as a guideline only to ensure that the control material is acceptable (shipped and stored correctly)
Step 2: For each day of parallel testing:
Test current lot number of control to confirm that the instrument/method is performing within quality specifications.
Analyze the new control material and ensure that the data point falls between the ±2 SD range.
Handle the new lot number material in the same manner to encompass the normal day-to-day sources of variability (inherent randomness) routinely encountered, such as:<br>
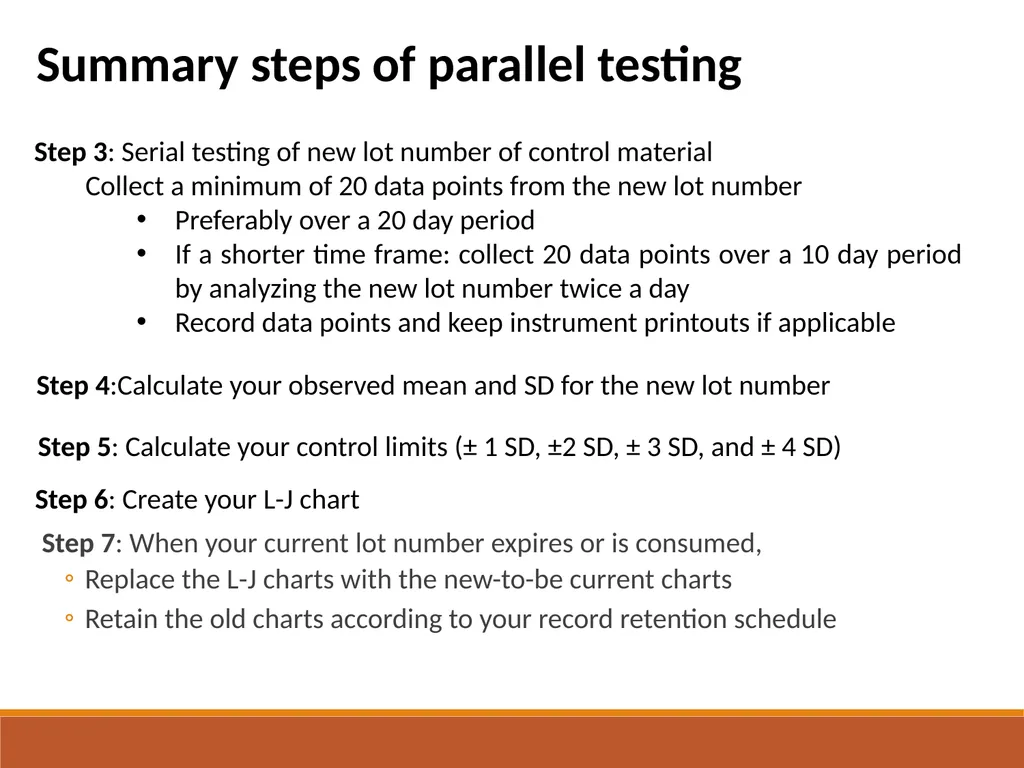
slide16. Step 7: When your current lot number expires or is consumed,
Replace the L-J charts with the new-to-be current charts
Retain the old charts according to your record retention schedule Step 3: Serial testing of new lot number of control material
Collect a minimum of 20 data points from the new lot number
Preferably over a 20 day period
If a shorter time frame: collect 20 data points over a 10 day period by analyzing the new lot number twice a day
Record data points and keep instrument printouts if applicable Step 4:Calculate your observed mean and SD for the new lot number Step 5: Calculate your control limits (± 1 SD, ±2 SD, ± 3 SD, and ± 4 SD) Step 6: Create your L-J chart Summary steps of parallel testing<br>
slide17. Thanks<br>
slide2. 2 When Do You Create a New LJ Chart? QC Lot changes
Major component change on the instrument
Change in the testing process, usually manufacturer-directed.<br>
slide3. Having the Right Control Chart Detects measurement errors with:
Minimum false accepts (an outlier accepted because the chart did not flag it as an outlier)
Minimum false rejections (a valid run rejected because the chart flagged it as an outlier)<br>
slide4. MEAN obs SD obs We did NOT expect this point(s) We did expect this point How SQC Works We compare today’s observed value with the past history of previous results to determine if the system is stable or undergoing a change.<br>
slide5. MEAN obs SD obs In parallel with the lot number currently in-use Overview: Introducing a New Lot Number into Service To obtain data to calculate the mean and SD<br>
slide6. Evaluate your
QC
with a stable analytical system
before your QC can evaluate your analytical system for instability!
True Democracy!<br>
slide7. 7/7/2017 QC Training - Labs for Life Project 7 Stable Analytical System Under evaluation!<br>
slide8. Why Parallel testing? Collecting data of the New Lot QC material In Parallel With The Currently (In-use)Lot of QC
Manufacturer stated mean and SD are to be verified before the QC material is used for patient reporting
System Should be Stable
Old/ running lot is run to assure that the system is stable
For patient results reporting
For validating the data from new lot
New Lot: To collect history (data points). A mean and an SD to use the new lot for monitoring the system
Parallel testing is performed whether the control is assayed or un-assayed<br>
slide9. How? Ideally a minimum of at least 20 measurements20 (to know inherent variability of the system) is ideal, to be done on separate days when the measurement system is known to be stable( based on QC results from existing lots)
Establish the Mean and SD and transport to a new LJ chart
Once verified and values are confidently assigned, the QC can be now used to monitor your analytical system’s performance<br>
slide10. An alternative : What if lab does not have the time or the resources for 20 parallel runs? Using the analyte’s old %CV and the new mean of 4-5 runs
Get 4-5 values of the new QC
Find the Mean and
Derive the SD by using the formula
SD = CV (from old lot) * Mean (from new lot)
Apply on the new control chart Ensure that the System is stable
Mean not drifting<br>
slide11. Why use the mean from 4-5 runs and not the SD of those runs? An SD means dispersion to capture the variables of the lab
Lab variables can be captured by the too few runs
4-5 runs’ SD will be too narrow, too unrealistic, will rise to false alerts.
Hence using this CV on a reasonably accurate mean of 4-5 runs will alert you to both inaccuracy and imprecision with minimum false alerts
The initial standard deviation value obtained by the calculation may be replaced with a more robust estimate when data from a longer period of stable operation become available<br>
slide12. Again, why use the CV from before but not the SD? SD is too dependant on the mean as it is an absolute value.
SD can change with concentration of the analyte, i.e the mean
Using the % equalizer, the CV, will eliminate this<br>
slide13. Some checkpoints: When an opened bottle of QC material will be used for more than one day, the same bottle should be assayed on several days to allow analyte stability to be reflected in the mean value Sampling from at least a few reconstituted vials will include any errors of reconstitution and capture more lab variables for a more robust mean and realistic SD For liquid stable quality control products, fewer bottles may be required, since such materials are expected to exhibit less vial to vial variation<br>
slide14. Recommendation for parallel testing: NABL 112 CBC and coagulation: Run new QC 4-6 data points in 2 days(depending on stability)
Clinical chemistry: 2-3 time a day for 2-10 days for at least 20 data points
Qualitative and semi-quantitative: At least 3 patient samples (neg, low pos, high pos) should be run along with old and new lot<br>
slide15. Summary steps of parallel testing Step 1: Using the package insert information:
Set the initial control limits, usually a ±2 SD range, for the new lot # of control.
Use this range as a guideline only to ensure that the control material is acceptable (shipped and stored correctly)
Step 2: For each day of parallel testing:
Test current lot number of control to confirm that the instrument/method is performing within quality specifications.
Analyze the new control material and ensure that the data point falls between the ±2 SD range.
Handle the new lot number material in the same manner to encompass the normal day-to-day sources of variability (inherent randomness) routinely encountered, such as:<br>
slide16. Step 7: When your current lot number expires or is consumed,
Replace the L-J charts with the new-to-be current charts
Retain the old charts according to your record retention schedule Step 3: Serial testing of new lot number of control material
Collect a minimum of 20 data points from the new lot number
Preferably over a 20 day period
If a shorter time frame: collect 20 data points over a 10 day period by analyzing the new lot number twice a day
Record data points and keep instrument printouts if applicable Step 4:Calculate your observed mean and SD for the new lot number Step 5: Calculate your control limits (± 1 SD, ±2 SD, ± 3 SD, and ± 4 SD) Step 6: Create your L-J chart Summary steps of parallel testing<br>
slide17. Thanks<br>