
NHL Player Development Modelling Means and Methods

Description: NHL Player Development Modelling Means and Methods to Projecting Player Contributions S. Burtch, 2017 Player Career Trajectory Description Useful for Generalization Player Production vs Age Cumulative Points (Krzywicki, 2008) Player Career
Related Topics
Download Presentation
"NHL Player Development Modelling Means and Methods" is the property of its rightful owner. Permission is granted to download and print the materials on this website for personal, non-commercial use only, and to display it on your personal computer provided you do not modify the materials and that you retain all copyright notices contained in the materials. By downloading content from our website, you accept the terms of this agreement.
Presentation Transcript
slide1. NHL Player Development Modelling Means and Methods to Projecting Player Contributions
S. Burtch, 2017<br>
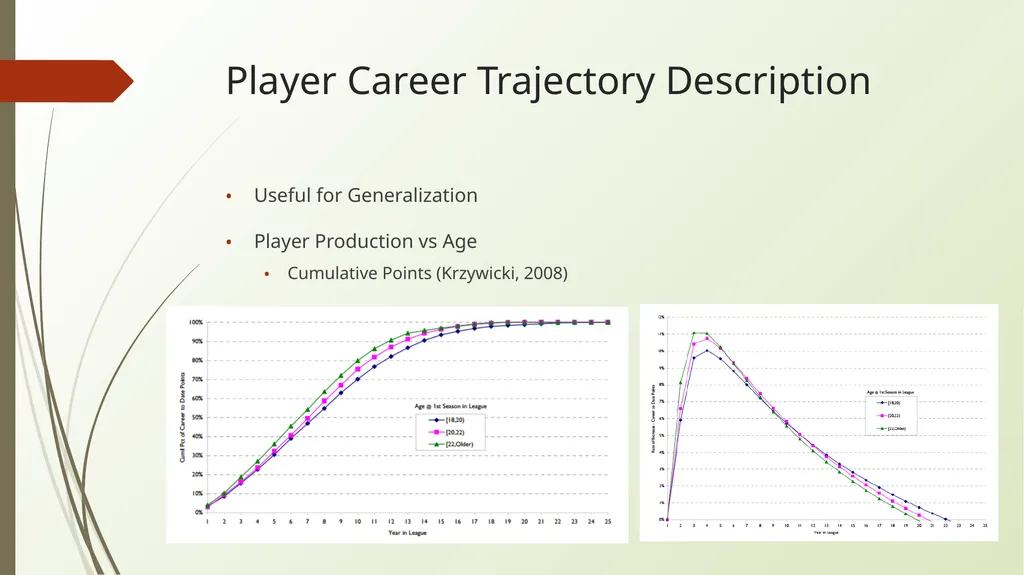
slide2. Player Career Trajectory Description Useful for Generalization
Player Production vs Age
Cumulative Points (Krzywicki, 2008)<br>
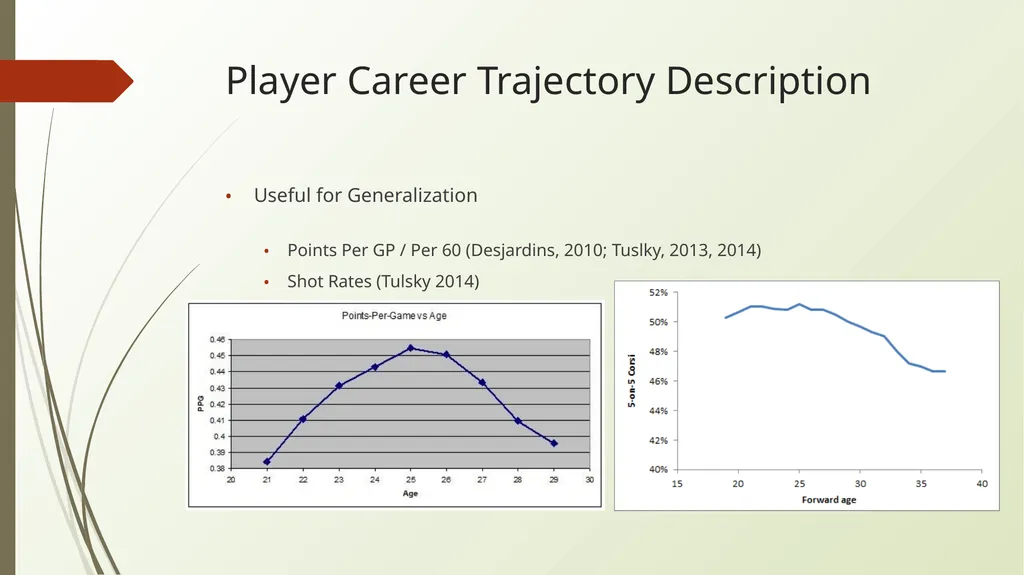
slide3. Player Career Trajectory Description Useful for Generalization
Points Per GP / Per 60 (Desjardins, 2010; Tuslky, 2013, 2014)
Shot Rates (Tulsky 2014)<br>
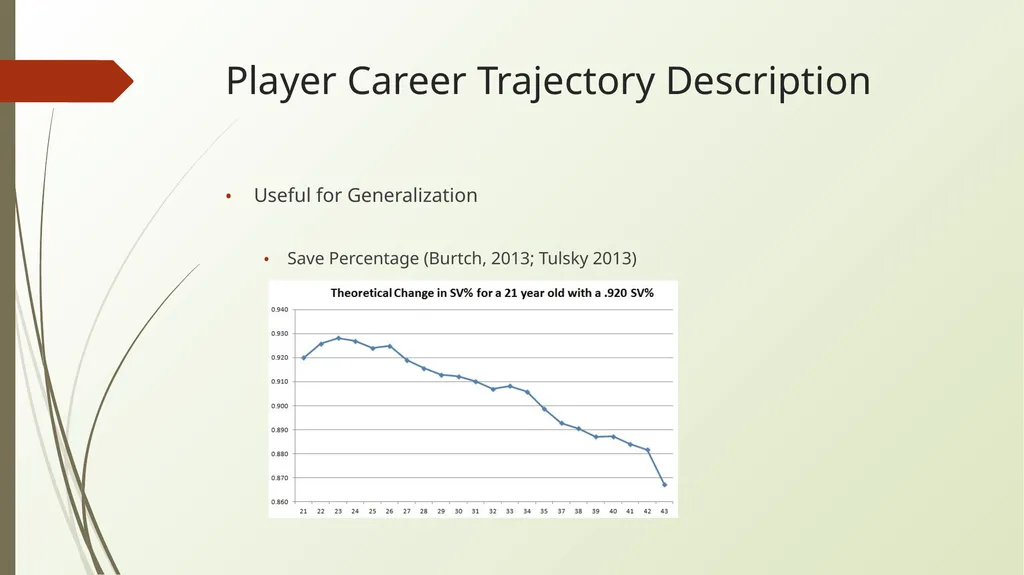
slide4. Player Career Trajectory Description Useful for Generalization
Save Percentage (Burtch, 2013; Tulsky 2013)<br>
slide5. Projection as a Statistical Exercise Marcel Projections
“The Marcel the Monkey Forecasting System (or the Marcels for short) is the most advanced forecasting system ever concieved.”
“Not.”
“Actually it is the most basic forecasting system you can have, that uses as little intelligence as possible.”
(Tom Tango, 2012 – Marcels first introduced in 2004)
Projecting Goaltender Performance
Marcels (Garik16, 2014; Tulsky, 2014)
Projecting Skater Performance
Marcels (Galimini, 2015)<br>
slide6. More Detailed Projections in Other Sports PECOTA / Steamer / ZiPs (baseball)
CARMELO (basketball)
APROPOS (soccer)
All employ a similar logic
Try to project player development by exploring trajectory of similar players
This raises 3 key questions…<br>
slide7. 1. How Do We Identify Similar Players? Player Similarity Scores
(Hockey/Basketball/Baseball/Football-Reference.com, 2008)
Uses overall career “score” and “shape” similarity
Does not account for variation by age
Euclidean Distance
Most recently applied in Hockey Statistics by
Corsica.Hockey Statistically Similar Players (Perry, 2016)
Identifying Playing Styles With Clustering (Stimson, 2017)
Examining Which Players are Most Similar To Current Red Wings (Iyer, 2017)<br>
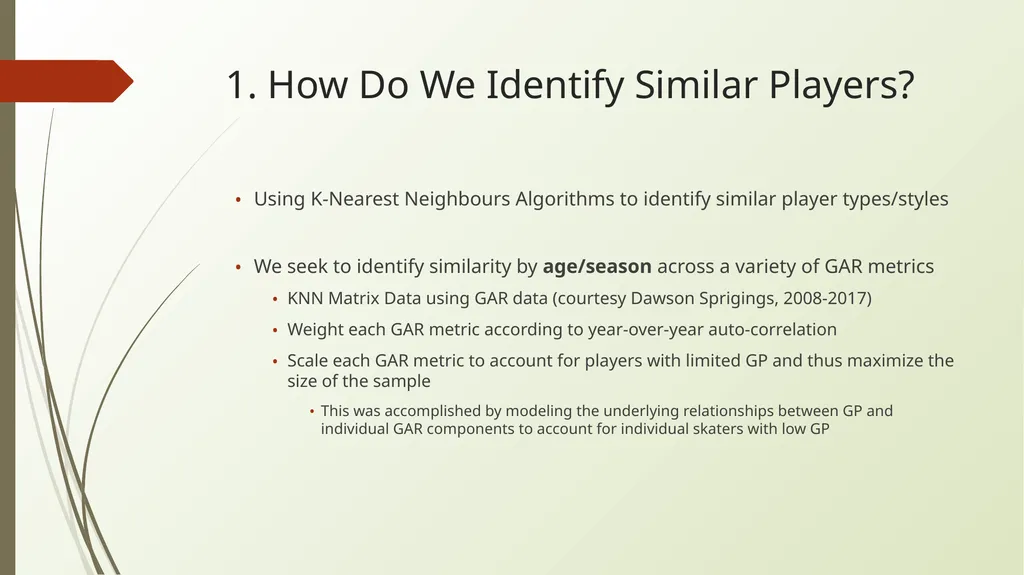
slide8. 1. How Do We Identify Similar Players? Using K-Nearest Neighbours Algorithms to identify similar player types/styles
We seek to identify similarity by age/season across a variety of GAR metrics
KNN Matrix Data using GAR data (courtesy Dawson Sprigings, 2008-2017)
Weight each GAR metric according to year-over-year auto-correlation
Scale each GAR metric to account for players with limited GP and thus maximize the size of the sample
This was accomplished by modeling the underlying relationships between GP and individual GAR components to account for individual skaters with low GP<br>
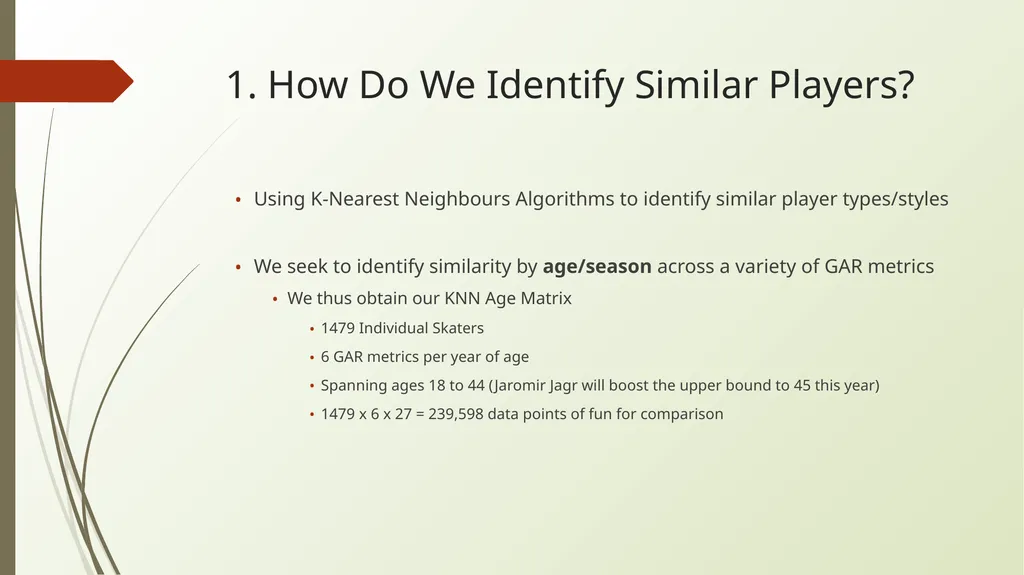
slide9. 1. How Do We Identify Similar Players? Using K-Nearest Neighbours Algorithms to identify similar player types/styles
We seek to identify similarity by age/season across a variety of GAR metrics
We thus obtain our KNN Age Matrix
1479 Individual Skaters
6 GAR metrics per year of age
Spanning ages 18 to 44 (Jaromir Jagr will boost the upper bound to 45 this year)
1479 x 6 x 27 = 239,598 data points of fun for comparison<br>
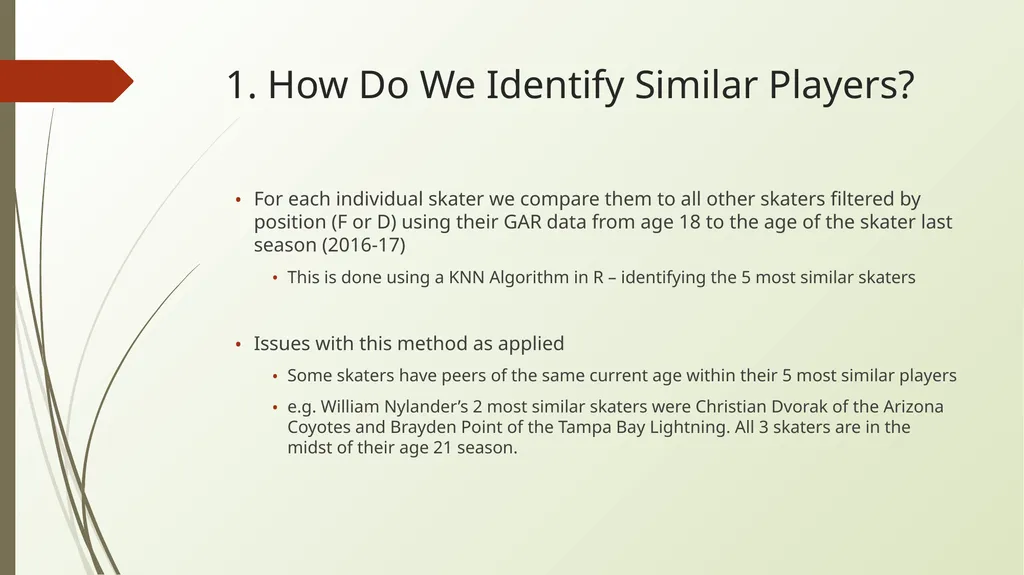
slide10. 1. How Do We Identify Similar Players? For each individual skater we compare them to all other skaters filtered by position (F or D) using their GAR data from age 18 to the age of the skater last season (2016-17)
This is done using a KNN Algorithm in R – identifying the 5 most similar skaters
Issues with this method as applied
Some skaters have peers of the same current age within their 5 most similar players
e.g. William Nylander’s 2 most similar skaters were Christian Dvorak of the Arizona Coyotes and Brayden Point of the Tampa Bay Lightning. All 3 skaters are in the midst of their age 21 season.<br>
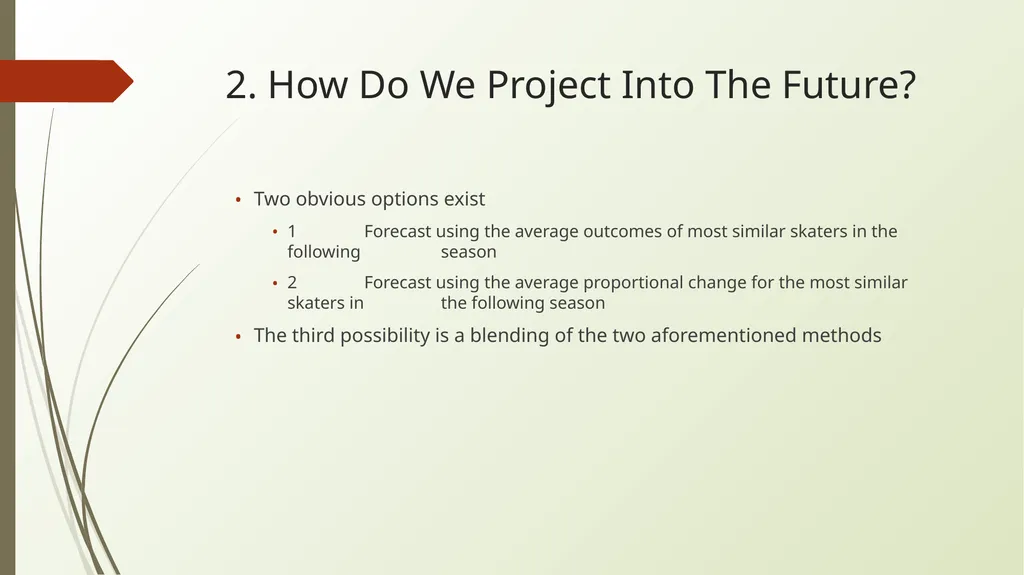
slide11. 2. How Do We Project Into The Future? Two obvious options exist
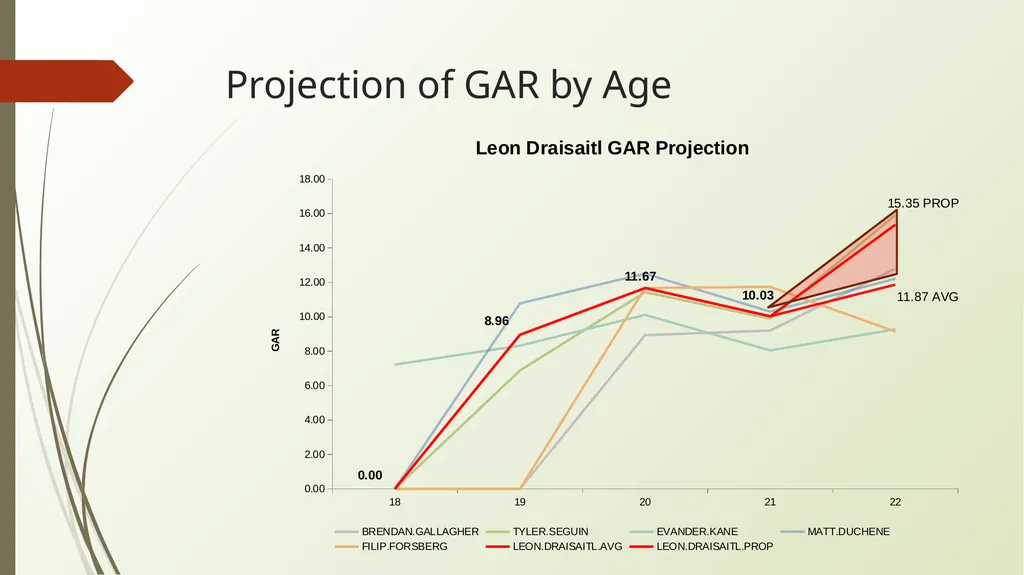
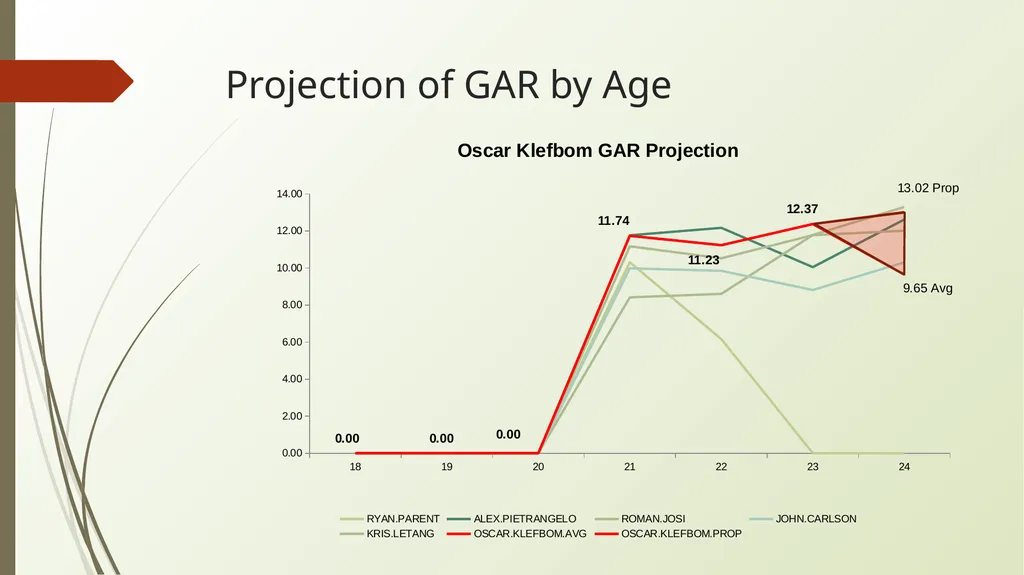
1 Forecast using the average outcomes of most similar skaters in the following season
2 Forecast using the average proportional change for the most similar skaters in the following season
The third possibility is a blending of the two aforementioned methods<br>
slide12. Projection of GAR by Age<br>
slide13. Projection of GAR by Age<br>
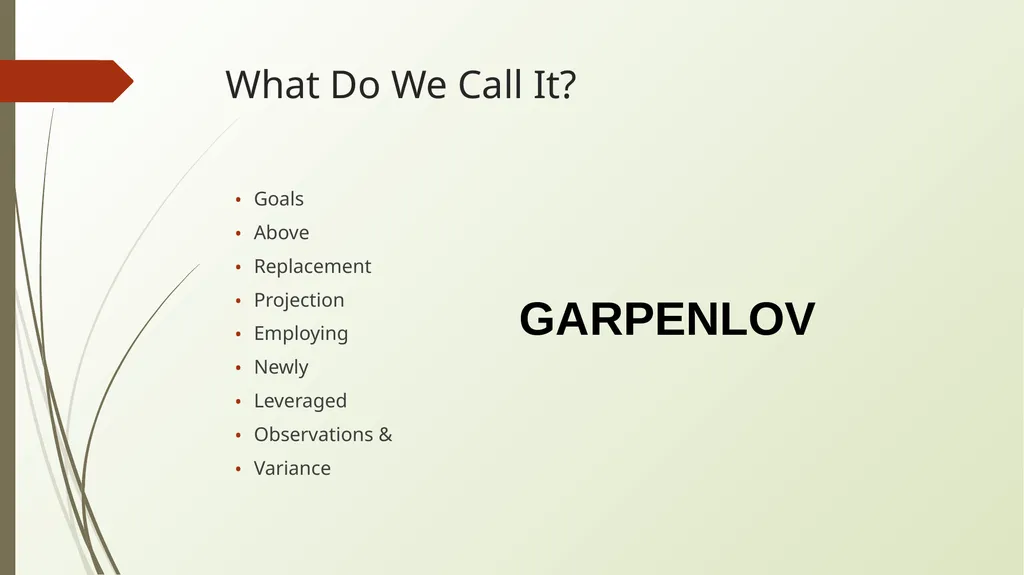
slide14. What Do We Call It? Goals
Above
Replacement
Projection
Employing
Newly
Leveraged
Observations &
Variance GARPENLOV<br>
slide15. Thank You<br>
S. Burtch, 2017<br>
slide2. Player Career Trajectory Description Useful for Generalization
Player Production vs Age
Cumulative Points (Krzywicki, 2008)<br>
slide3. Player Career Trajectory Description Useful for Generalization
Points Per GP / Per 60 (Desjardins, 2010; Tuslky, 2013, 2014)
Shot Rates (Tulsky 2014)<br>
slide4. Player Career Trajectory Description Useful for Generalization
Save Percentage (Burtch, 2013; Tulsky 2013)<br>
slide5. Projection as a Statistical Exercise Marcel Projections
“The Marcel the Monkey Forecasting System (or the Marcels for short) is the most advanced forecasting system ever concieved.”
“Not.”
“Actually it is the most basic forecasting system you can have, that uses as little intelligence as possible.”
(Tom Tango, 2012 – Marcels first introduced in 2004)
Projecting Goaltender Performance
Marcels (Garik16, 2014; Tulsky, 2014)
Projecting Skater Performance
Marcels (Galimini, 2015)<br>
slide6. More Detailed Projections in Other Sports PECOTA / Steamer / ZiPs (baseball)
CARMELO (basketball)
APROPOS (soccer)
All employ a similar logic
Try to project player development by exploring trajectory of similar players
This raises 3 key questions…<br>
slide7. 1. How Do We Identify Similar Players? Player Similarity Scores
(Hockey/Basketball/Baseball/Football-Reference.com, 2008)
Uses overall career “score” and “shape” similarity
Does not account for variation by age
Euclidean Distance
Most recently applied in Hockey Statistics by
Corsica.Hockey Statistically Similar Players (Perry, 2016)
Identifying Playing Styles With Clustering (Stimson, 2017)
Examining Which Players are Most Similar To Current Red Wings (Iyer, 2017)<br>
slide8. 1. How Do We Identify Similar Players? Using K-Nearest Neighbours Algorithms to identify similar player types/styles
We seek to identify similarity by age/season across a variety of GAR metrics
KNN Matrix Data using GAR data (courtesy Dawson Sprigings, 2008-2017)
Weight each GAR metric according to year-over-year auto-correlation
Scale each GAR metric to account for players with limited GP and thus maximize the size of the sample
This was accomplished by modeling the underlying relationships between GP and individual GAR components to account for individual skaters with low GP<br>
slide9. 1. How Do We Identify Similar Players? Using K-Nearest Neighbours Algorithms to identify similar player types/styles
We seek to identify similarity by age/season across a variety of GAR metrics
We thus obtain our KNN Age Matrix
1479 Individual Skaters
6 GAR metrics per year of age
Spanning ages 18 to 44 (Jaromir Jagr will boost the upper bound to 45 this year)
1479 x 6 x 27 = 239,598 data points of fun for comparison<br>
slide10. 1. How Do We Identify Similar Players? For each individual skater we compare them to all other skaters filtered by position (F or D) using their GAR data from age 18 to the age of the skater last season (2016-17)
This is done using a KNN Algorithm in R – identifying the 5 most similar skaters
Issues with this method as applied
Some skaters have peers of the same current age within their 5 most similar players
e.g. William Nylander’s 2 most similar skaters were Christian Dvorak of the Arizona Coyotes and Brayden Point of the Tampa Bay Lightning. All 3 skaters are in the midst of their age 21 season.<br>
slide11. 2. How Do We Project Into The Future? Two obvious options exist
1 Forecast using the average outcomes of most similar skaters in the following season
2 Forecast using the average proportional change for the most similar skaters in the following season
The third possibility is a blending of the two aforementioned methods<br>
slide12. Projection of GAR by Age<br>
slide13. Projection of GAR by Age<br>
slide14. What Do We Call It? Goals
Above
Replacement
Projection
Employing
Newly
Leveraged
Observations &
Variance GARPENLOV<br>
slide15. Thank You<br>