
Nicky Best (GSK), Aaron Dane (Danestat
LS
Published · 84 slides · 0 views

1 / 1



Description
Nicky Best (GSK), Aaron Dane (Danestat Consulting), Julia Niewczas (JJ), Oliver Sailer (BI), Gaëlle Saint-Hilary (Saryga), Simon Wandel (Novartis) A framework for evaluation of Bayesian Dynamic Borrowing designs in pivotal studies EFSPI
Related Topics
Share
Embed code
Download this presentation From Below
"Nicky Best (GSK), Aaron Dane (Danestat" is the property of its rightful owner. Permission is granted to download and print the materials on this website for personal, non-commercial use only, and to display it on your personal computer provided you do not modify the materials and that you retain all copyright notices contained in the materials. By downloading content from our website, you accept the terms of this agreement.
Presentation Transcript
01
Nicky Best (GSK), Aaron Dane (Danestat Consulting), Julia Niewczas (J&J),
Oliver Sailer (BI), Gaëlle Saint-Hilary (Saryga), Simon Wandel (Novartis) A framework for evaluation of Bayesian Dynamic Borrowing designs in pivotal studies EFSPI / PSI Special Interest Group Historical Data
PSI Conference, 13 June 2022<br>
Oliver Sailer (BI), Gaëlle Saint-Hilary (Saryga), Simon Wandel (Novartis) A framework for evaluation of Bayesian Dynamic Borrowing designs in pivotal studies EFSPI / PSI Special Interest Group Historical Data
PSI Conference, 13 June 2022<br>
02
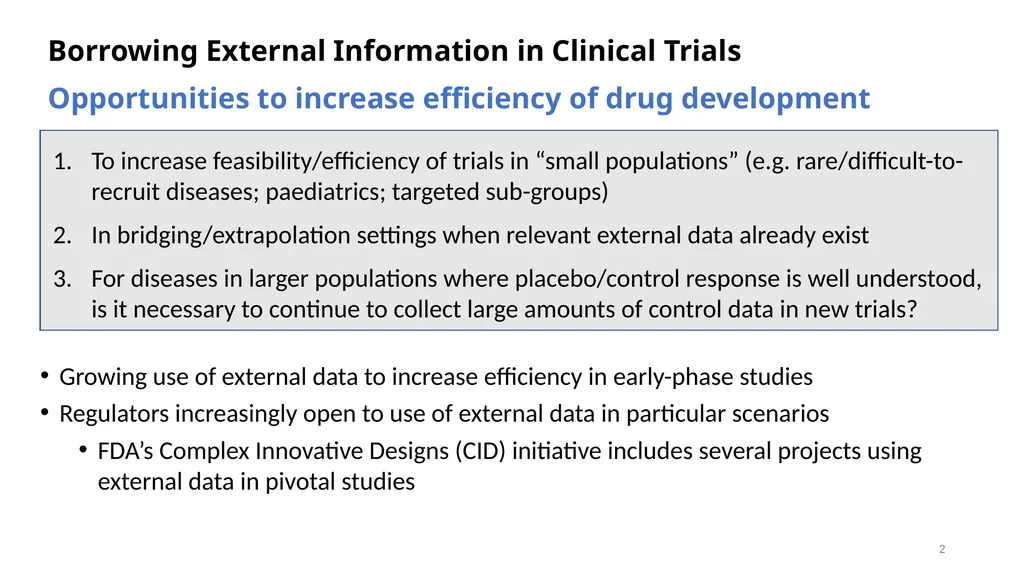
Growing use of external data to increase efficiency in early-phase studies
Regulators increasingly open to use of external data in particular scenarios
FDA’s Complex Innovative Designs (CID) initiative includes several projects using external data in pivotal studies Borrowing External Information in Clinical Trials 2 Opportunities to increase efficiency of drug development To increase feasibility/efficiency of trials in “small populations” (e.g. rare/difficult-to-recruit diseases; paediatrics; targeted sub-groups)
In bridging/extrapolation settings when relevant external data already exist
For diseases in larger populations where placebo/control response is well understood, is it necessary to continue to collect large amounts of control data in new trials?<br>
Regulators increasingly open to use of external data in particular scenarios
FDA’s Complex Innovative Designs (CID) initiative includes several projects using external data in pivotal studies Borrowing External Information in Clinical Trials 2 Opportunities to increase efficiency of drug development To increase feasibility/efficiency of trials in “small populations” (e.g. rare/difficult-to-recruit diseases; paediatrics; targeted sub-groups)
In bridging/extrapolation settings when relevant external data already exist
For diseases in larger populations where placebo/control response is well understood, is it necessary to continue to collect large amounts of control data in new trials?<br>
03
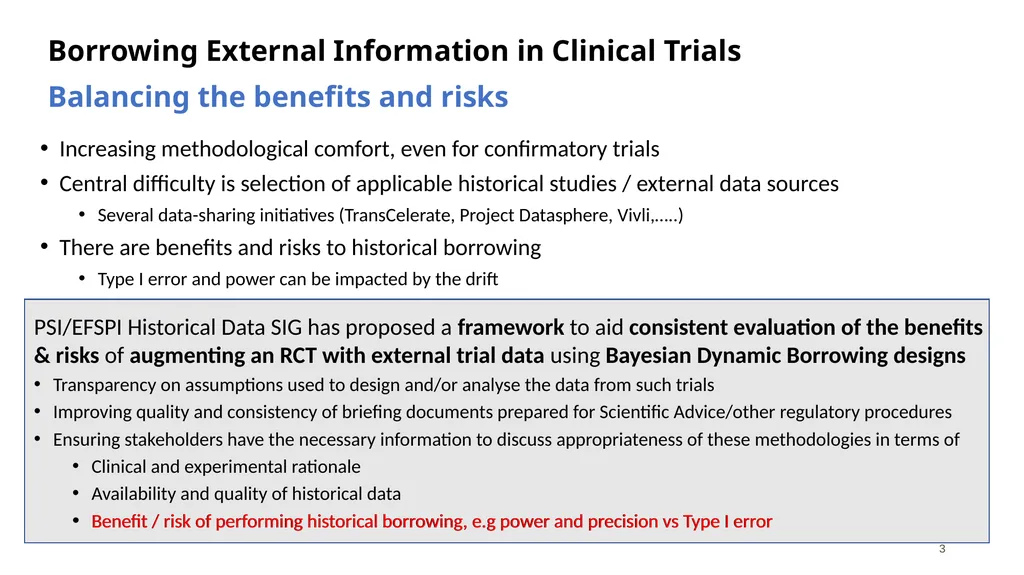
Increasing methodological comfort, even for confirmatory trials
Central difficulty is selection of applicable historical studies / external data sources
Several data-sharing initiatives (TransCelerate, Project Datasphere, Vivli,…..)
There are benefits and risks to historical borrowing
Type I error and power can be impacted by the drift Borrowing External Information in Clinical Trials 3 Balancing the benefits and risks PSI/EFSPI Historical Data SIG has proposed a framework to aid consistent evaluation of the benefits & risks of augmenting an RCT with external trial data using Bayesian Dynamic Borrowing designs
Transparency on assumptions used to design and/or analyse the data from such trials
Improving quality and consistency of briefing documents prepared for Scientific Advice/other regulatory procedures
Ensuring stakeholders have the necessary information to discuss appropriateness of these methodologies in terms of
Clinical and experimental rationale
Availability and quality of historical data
Benefit / risk of performing historical borrowing, e.g power and precision vs Type I error Benefit / risk of performing historical borrowing, e.g power and precision vs Type I error<br>
Central difficulty is selection of applicable historical studies / external data sources
Several data-sharing initiatives (TransCelerate, Project Datasphere, Vivli,…..)
There are benefits and risks to historical borrowing
Type I error and power can be impacted by the drift Borrowing External Information in Clinical Trials 3 Balancing the benefits and risks PSI/EFSPI Historical Data SIG has proposed a framework to aid consistent evaluation of the benefits & risks of augmenting an RCT with external trial data using Bayesian Dynamic Borrowing designs
Transparency on assumptions used to design and/or analyse the data from such trials
Improving quality and consistency of briefing documents prepared for Scientific Advice/other regulatory procedures
Ensuring stakeholders have the necessary information to discuss appropriateness of these methodologies in terms of
Clinical and experimental rationale
Availability and quality of historical data
Benefit / risk of performing historical borrowing, e.g power and precision vs Type I error Benefit / risk of performing historical borrowing, e.g power and precision vs Type I error<br>
04
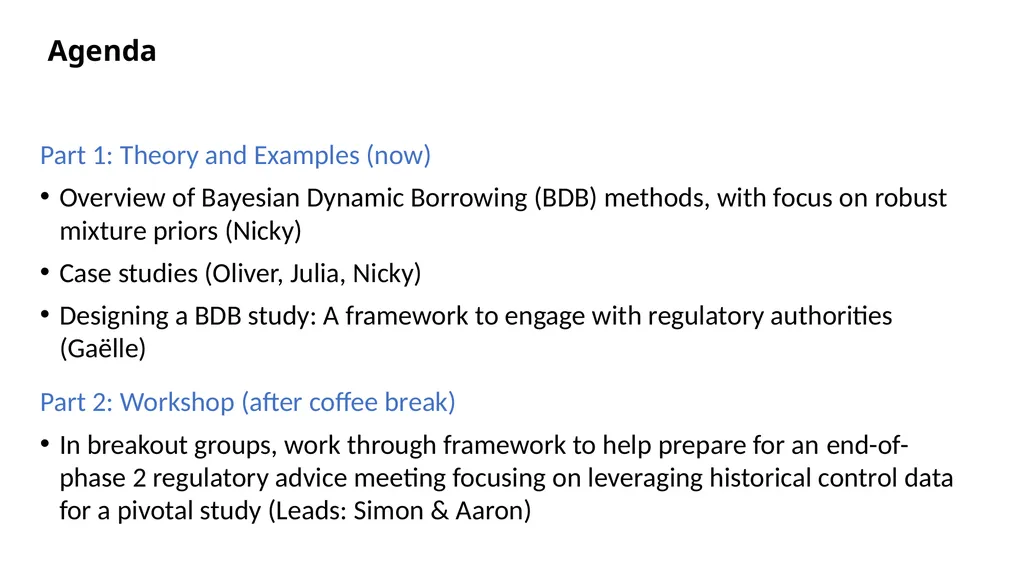
Part 1: Theory and Examples (now)
Overview of Bayesian Dynamic Borrowing (BDB) methods, with focus on robust mixture priors (Nicky)
Case studies (Oliver, Julia, Nicky)
Designing a BDB study: A framework to engage with regulatory authorities (Gaëlle)
Part 2: Workshop (after coffee break)
In breakout groups, work through framework to help prepare for an end-of-phase 2 regulatory advice meeting focusing on leveraging historical control data for a pivotal study (Leads: Simon & Aaron) Agenda<br>
Overview of Bayesian Dynamic Borrowing (BDB) methods, with focus on robust mixture priors (Nicky)
Case studies (Oliver, Julia, Nicky)
Designing a BDB study: A framework to engage with regulatory authorities (Gaëlle)
Part 2: Workshop (after coffee break)
In breakout groups, work through framework to help prepare for an end-of-phase 2 regulatory advice meeting focusing on leveraging historical control data for a pivotal study (Leads: Simon & Aaron) Agenda<br>
05
Overview of Bayesian Dynamic Borrowing Methods Presenter: Nicky Best (GSK)<br>
06
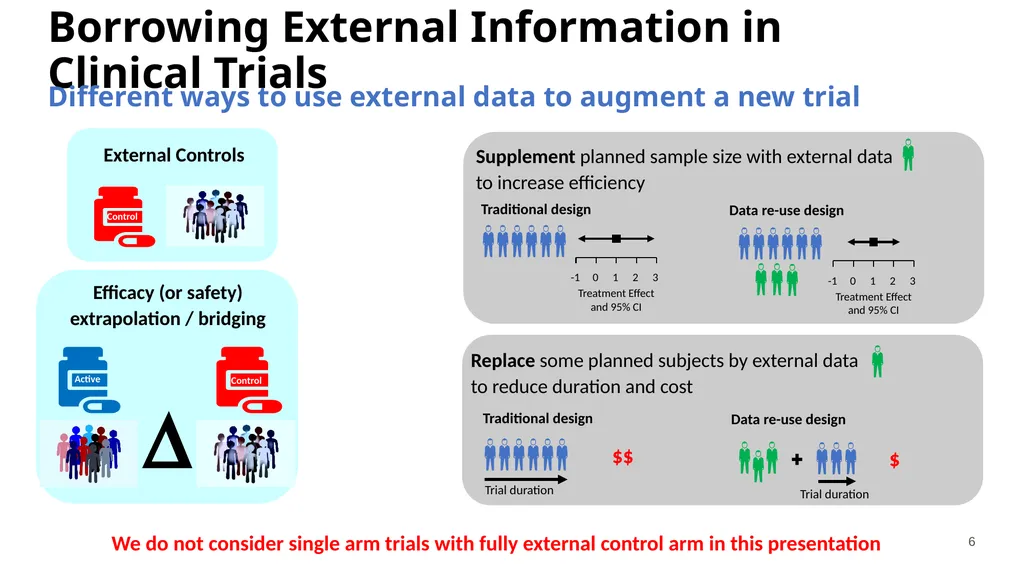
Borrowing External Information in Clinical Trials $$ Traditional design Trial duration $ Data re-use design Replace some planned subjects by external data
to reduce duration and cost Traditional design Data re-use design 6 Different ways to use external data to augment a new trial We do not consider single arm trials with fully external control arm in this presentation<br>
to reduce duration and cost Traditional design Data re-use design 6 Different ways to use external data to augment a new trial We do not consider single arm trials with fully external control arm in this presentation<br>
07
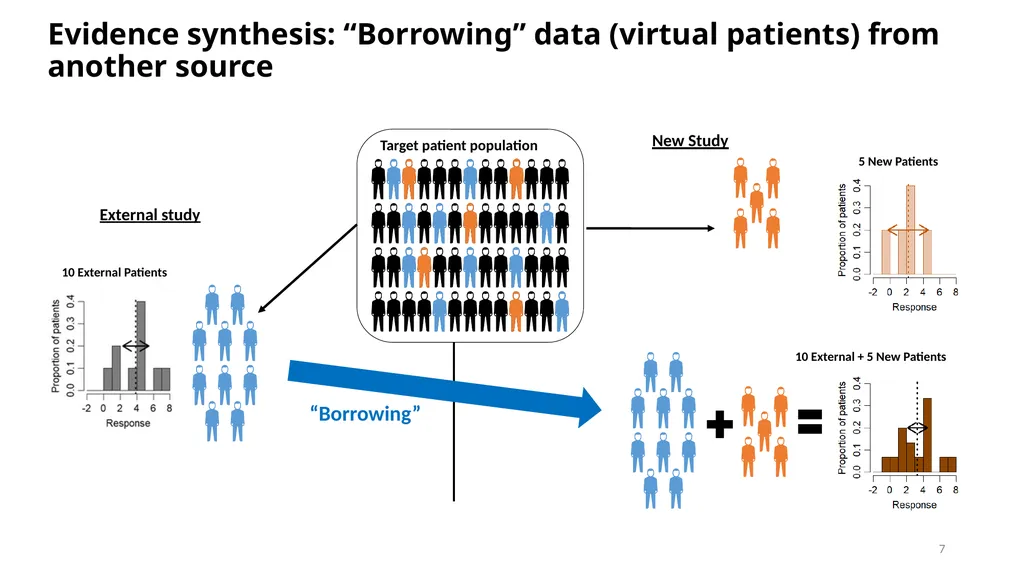
Evidence synthesis: “Borrowing” data (virtual patients) from another source 7 Target patient population External study 10 External Patients New Study 5 New Patients “Borrowing” 10 External + 5 New Patients<br>
08
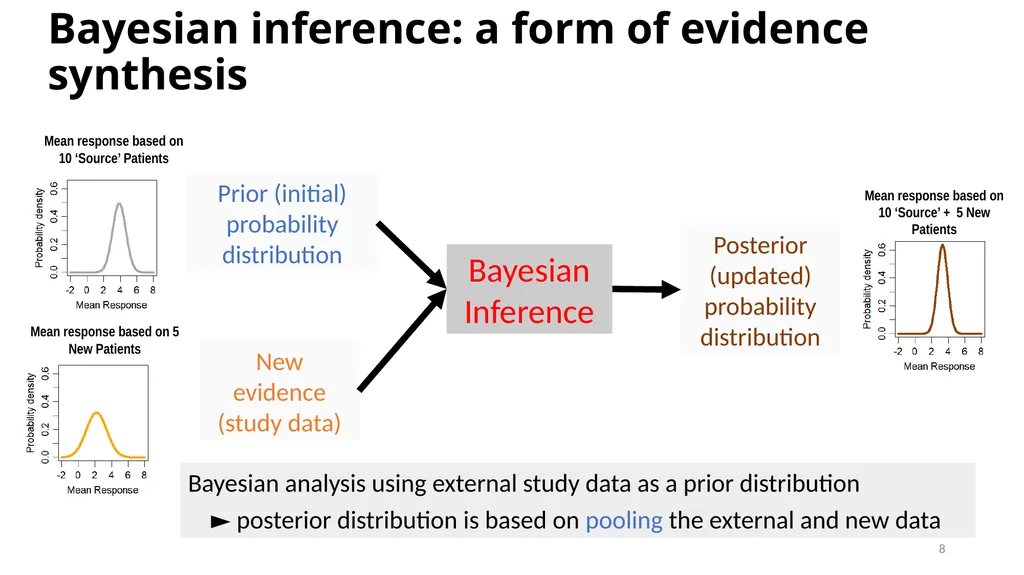
Prior (initial) probability distribution New evidence (study data) Posterior (updated) probability distribution Bayesian Inference Bayesian inference: a form of evidence synthesis Mean response based on 10 ‘Source’ Patients Mean response based on 5 New Patients Mean response based on 10 ‘Source’ + 5 New Patients Bayesian analysis using external study data as a prior distribution
► posterior distribution is based on pooling the external and new data 8<br>
► posterior distribution is based on pooling the external and new data 8<br>
09
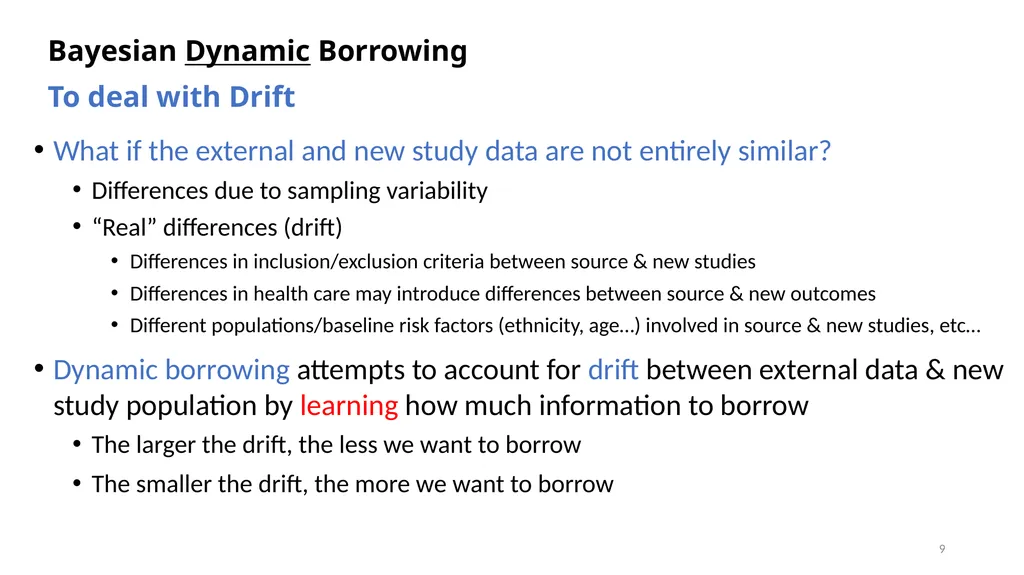
What if the external and new study data are not entirely similar?
Differences due to sampling variability
“Real” differences (drift)
Differences in inclusion/exclusion criteria between source & new studies
Differences in health care may introduce differences between source & new outcomes
Different populations/baseline risk factors (ethnicity, age…) involved in source & new studies, etc…
Dynamic borrowing attempts to account for drift between external data & new study population by learning how much information to borrow
The larger the drift, the less we want to borrow
The smaller the drift, the more we want to borrow Bayesian Dynamic Borrowing 9 To deal with Drift<br>
Differences due to sampling variability
“Real” differences (drift)
Differences in inclusion/exclusion criteria between source & new studies
Differences in health care may introduce differences between source & new outcomes
Different populations/baseline risk factors (ethnicity, age…) involved in source & new studies, etc…
Dynamic borrowing attempts to account for drift between external data & new study population by learning how much information to borrow
The larger the drift, the less we want to borrow
The smaller the drift, the more we want to borrow Bayesian Dynamic Borrowing 9 To deal with Drift<br>
10
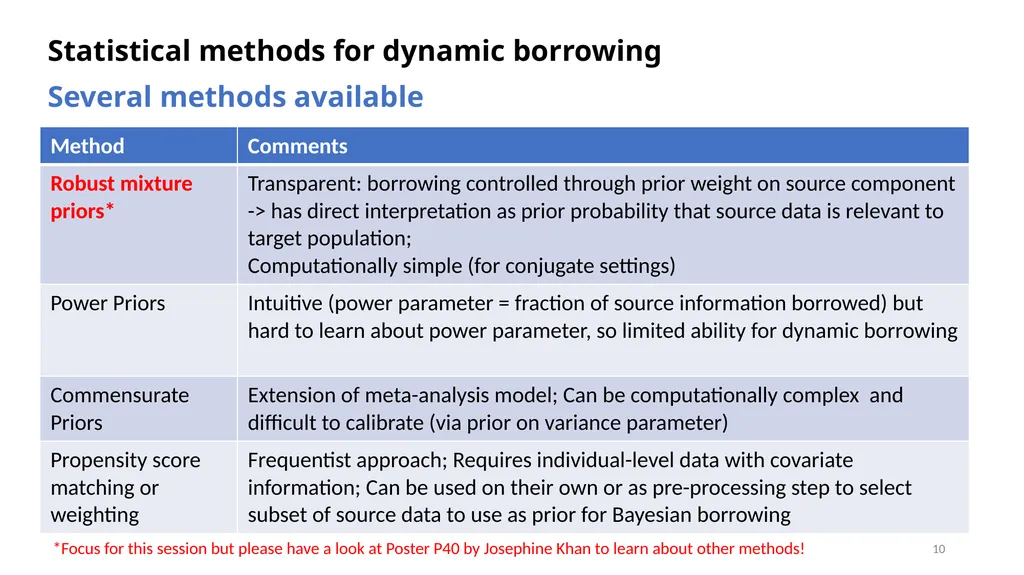
Statistical methods for dynamic borrowing 10 *Focus for this session but please have a look at Poster P40 by Josephine Khan to learn about other methods! Several methods available<br>
11
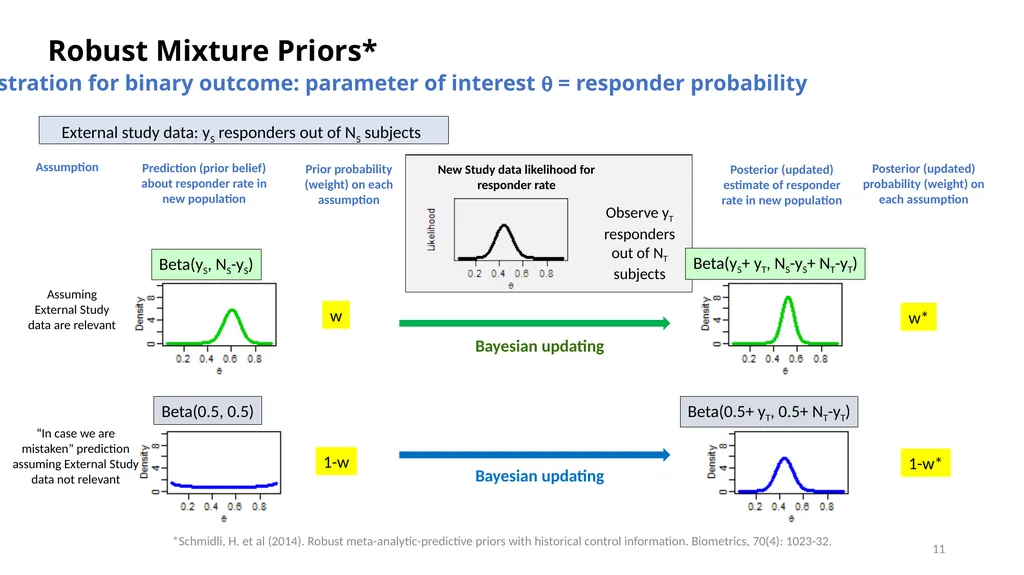
Robust Mixture Priors* *Schmidli, H. et al (2014). Robust meta-analytic-predictive priors with historical control information. Biometrics, 70(4): 1023-32. 11 Illustration for binary outcome: parameter of interest q = responder probability External study data: yS responders out of NS subjects<br>
12
Robust Mixture Priors 12 Beta(yS, NS-yS) External study data: yS responders out of NS subjects Illustration for binary outcome: parameter of interest q = responder probability<br>
13
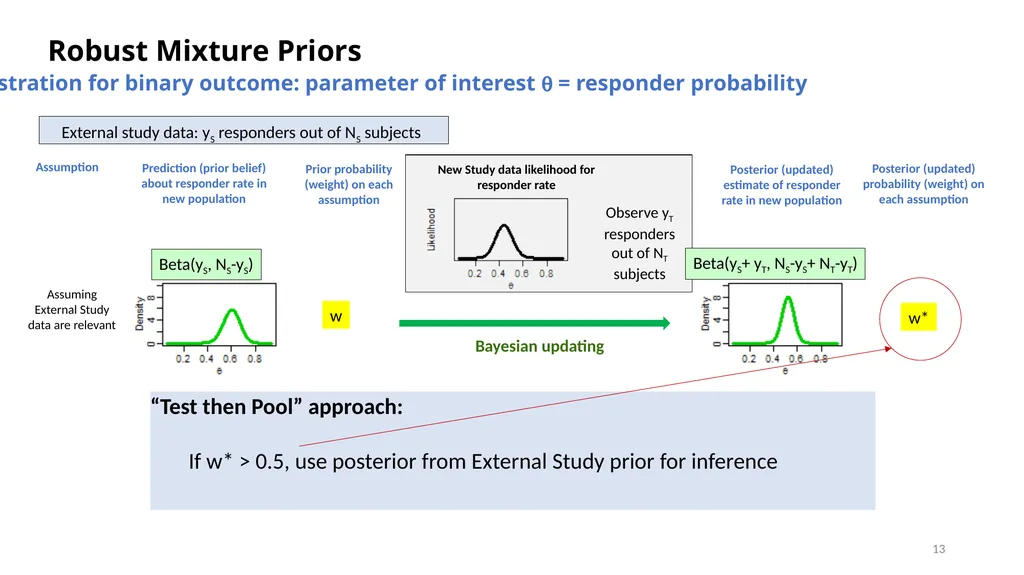
Robust Mixture Priors 13 Prior probability (weight) on each assumption w Posterior (updated) probability (weight) on each assumption w* Beta(yS, NS-yS) External study data: yS responders out of NS subjects “Test then Pool” approach:
If w* > 0.5, use posterior from External Study prior for inference Illustration for binary outcome: parameter of interest q = responder probability<br>
If w* > 0.5, use posterior from External Study prior for inference Illustration for binary outcome: parameter of interest q = responder probability<br>
14
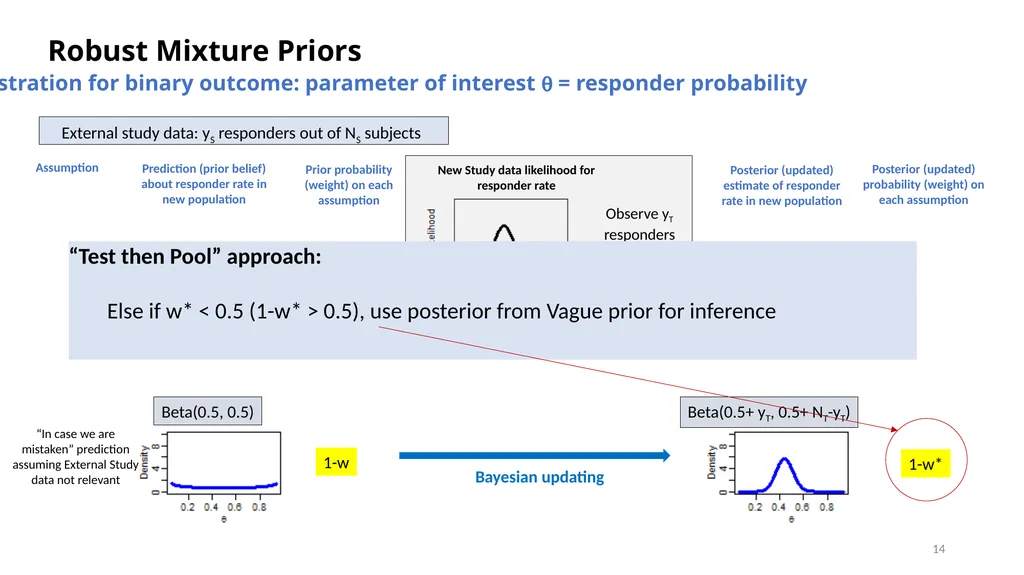
Robust Mixture Priors 14 Prior probability (weight) on each assumption 1-w External study data: yS responders out of NS subjects “Test then Pool” approach:
Else if w* < 0.5 (1-w* > 0.5), use posterior from Vague prior for inference Prediction (prior belief) about responder rate in new population Assumption Posterior (updated) estimate of responder rate in new population Illustration for binary outcome: parameter of interest q = responder probability<br>
Else if w* < 0.5 (1-w* > 0.5), use posterior from Vague prior for inference Prediction (prior belief) about responder rate in new population Assumption Posterior (updated) estimate of responder rate in new population Illustration for binary outcome: parameter of interest q = responder probability<br>
15
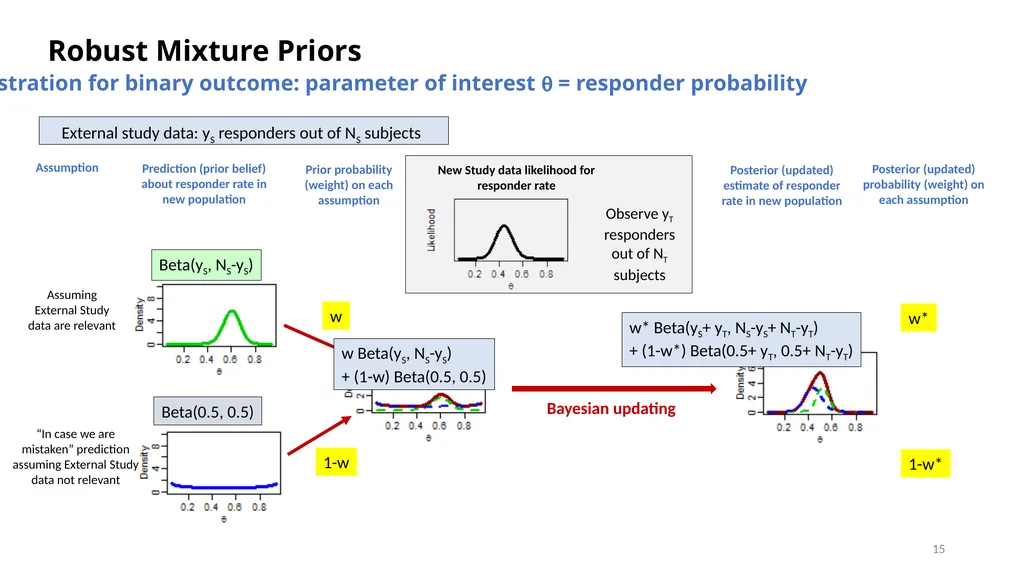
Robust Mixture Priors 15 Posterior (updated) probability (weight) on each assumption Beta(yS, NS-yS) Posterior (updated) estimate of responder rate in new population External study data: yS responders out of NS subjects w Beta(yS, NS-yS)
+ (1-w) Beta(0.5, 0.5) w* Beta(yS+ yT, NS-yS+ NT-yT)
+ (1-w*) Beta(0.5+ yT, 0.5+ NT-yT) Illustration for binary outcome: parameter of interest q = responder probability<br>
+ (1-w) Beta(0.5, 0.5) w* Beta(yS+ yT, NS-yS+ NT-yT)
+ (1-w*) Beta(0.5+ yT, 0.5+ NT-yT) Illustration for binary outcome: parameter of interest q = responder probability<br>
16
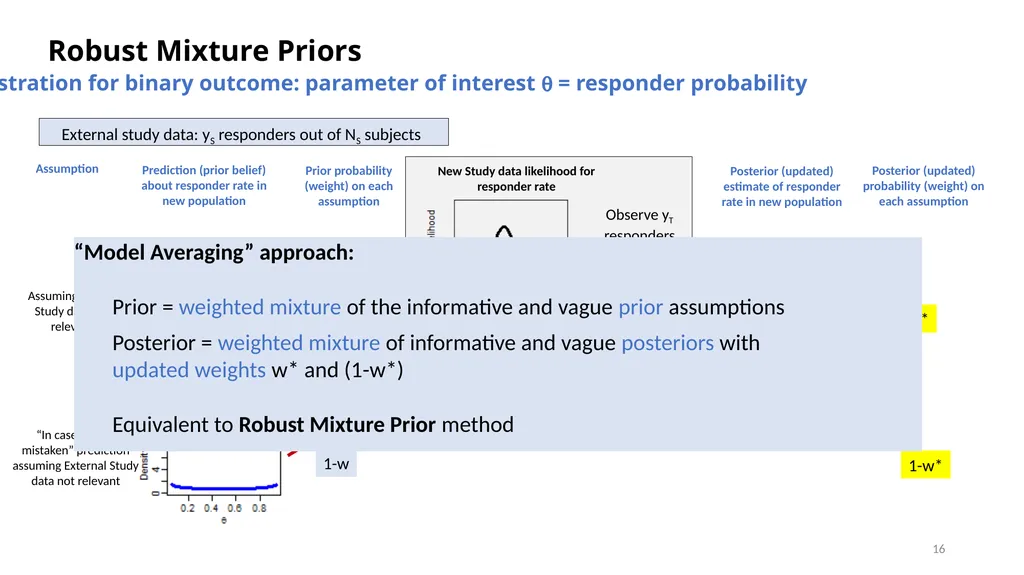
Robust Mixture Priors 16 Posterior (updated) probability (weight) on each assumption Beta(yS, NS-yS) Posterior (updated) estimate of responder rate in new population External study data: yS responders out of NS subjects w Beta(yS, NS-yS)
+ (1-w) Beta(0.5, 0.5) w* Beta(yS+ yT, NS-yS+ NT-yT)
+ (1-w*) Beta(0.5+ yT, 0.5+ NT-yT) “Model Averaging” approach:
Prior = weighted mixture of the informative and vague prior assumptions
Posterior = weighted mixture of informative and vague posteriors with
updated weights w* and (1-w*)
Equivalent to Robust Mixture Prior method Illustration for binary outcome: parameter of interest q = responder probability<br>
+ (1-w) Beta(0.5, 0.5) w* Beta(yS+ yT, NS-yS+ NT-yT)
+ (1-w*) Beta(0.5+ yT, 0.5+ NT-yT) “Model Averaging” approach:
Prior = weighted mixture of the informative and vague prior assumptions
Posterior = weighted mixture of informative and vague posteriors with
updated weights w* and (1-w*)
Equivalent to Robust Mixture Prior method Illustration for binary outcome: parameter of interest q = responder probability<br>
17
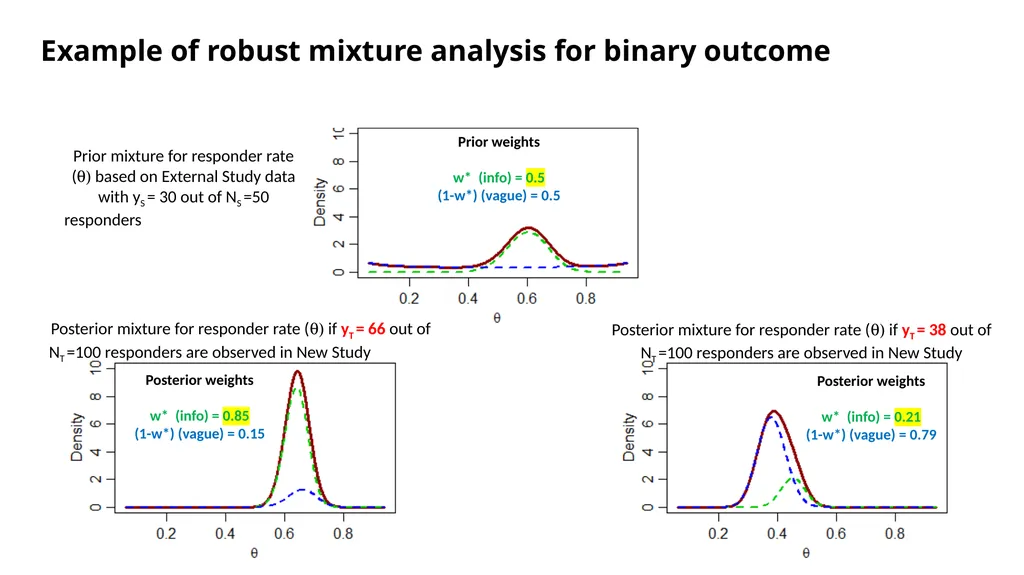
Example of robust mixture analysis for binary outcome 17 Posterior weights
w* (info) = 0.85
(1-w*) (vague) = 0.15 Posterior weights
w* (info) = 0.21
(1-w*) (vague) = 0.79 Posterior mixture for responder rate (q) if yT = 66 out of NT =100 responders are observed in New Study Posterior mixture for responder rate (q) if yT = 38 out of NT =100 responders are observed in New Study Prior weights
w* (info) = 0.5
(1-w*) (vague) = 0.5 Prior mixture for responder rate (q) based on External Study data with yS = 30 out of NS =50 responders<br>
w* (info) = 0.85
(1-w*) (vague) = 0.15 Posterior weights
w* (info) = 0.21
(1-w*) (vague) = 0.79 Posterior mixture for responder rate (q) if yT = 66 out of NT =100 responders are observed in New Study Posterior mixture for responder rate (q) if yT = 38 out of NT =100 responders are observed in New Study Prior weights
w* (info) = 0.5
(1-w*) (vague) = 0.5 Prior mixture for responder rate (q) based on External Study data with yS = 30 out of NS =50 responders<br>
18
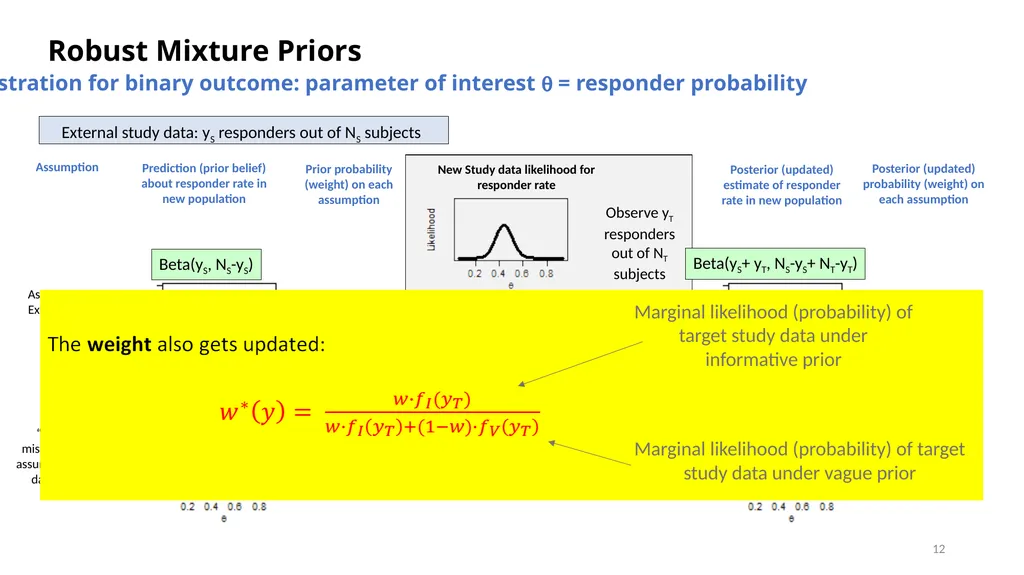
Posterior (updated) weight on the external data (informative component)
Can be interpreted as the probability that the external data are relevant (exchangeable) to the new study population, given the assumed prior probability of relevance and the observed level of consistency between the new and external data
Posterior weight of X% does not mean that X% of the external data sample size is borrowed How much information is borrowed from the prior? 18 2 useful metrics<br>
Can be interpreted as the probability that the external data are relevant (exchangeable) to the new study population, given the assumed prior probability of relevance and the observed level of consistency between the new and external data
Posterior weight of X% does not mean that X% of the external data sample size is borrowed How much information is borrowed from the prior? 18 2 useful metrics<br>
19
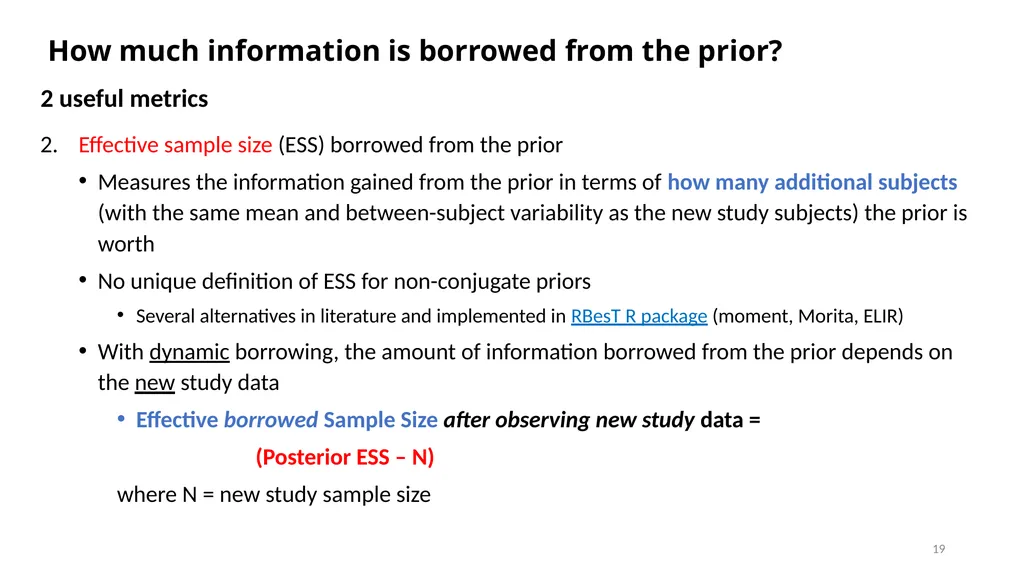
Effective sample size (ESS) borrowed from the prior
Measures the information gained from the prior in terms of how many additional subjects (with the same mean and between-subject variability as the new study subjects) the prior is worth
No unique definition of ESS for non-conjugate priors
Several alternatives in literature and implemented in RBesT R package (moment, Morita, ELIR)
With dynamic borrowing, the amount of information borrowed from the prior depends on the new study data
Effective borrowed Sample Size after observing new study data =
(Posterior ESS – N)
where N = new study sample size How much information is borrowed from the prior? 19 2 useful metrics<br>
Measures the information gained from the prior in terms of how many additional subjects (with the same mean and between-subject variability as the new study subjects) the prior is worth
No unique definition of ESS for non-conjugate priors
Several alternatives in literature and implemented in RBesT R package (moment, Morita, ELIR)
With dynamic borrowing, the amount of information borrowed from the prior depends on the new study data
Effective borrowed Sample Size after observing new study data =
(Posterior ESS – N)
where N = new study sample size How much information is borrowed from the prior? 19 2 useful metrics<br>
20
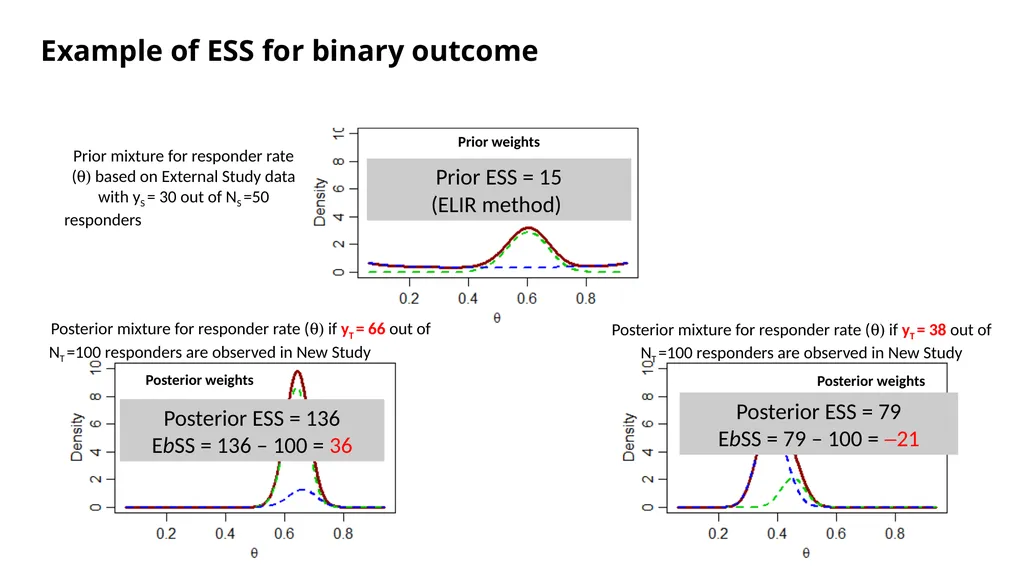
Example of ESS for binary outcome 20 Posterior weights
w* (info) = 0.85
(1-w*) (vague) = 0.15 Posterior weights
w* (info) = 0.21
(1-w*) (vague) = 0.79 Posterior mixture for responder rate (q) if yT = 66 out of NT =100 responders are observed in New Study Posterior mixture for responder rate (q) if yT = 38 out of NT =100 responders are observed in New Study Prior weights
w* (info) = 0.5
(1-w*) (vague) = 0.5 Prior mixture for responder rate (q) based on External Study data with yS = 30 out of NS =50 responders Posterior ESS = 136
EbSS = 136 – 100 = 36 Posterior ESS = 79
EbSS = 79 – 100 = -21 Prior ESS = 15
(ELIR method)<br>
w* (info) = 0.85
(1-w*) (vague) = 0.15 Posterior weights
w* (info) = 0.21
(1-w*) (vague) = 0.79 Posterior mixture for responder rate (q) if yT = 66 out of NT =100 responders are observed in New Study Posterior mixture for responder rate (q) if yT = 38 out of NT =100 responders are observed in New Study Prior weights
w* (info) = 0.5
(1-w*) (vague) = 0.5 Prior mixture for responder rate (q) based on External Study data with yS = 30 out of NS =50 responders Posterior ESS = 136
EbSS = 136 – 100 = 36 Posterior ESS = 79
EbSS = 79 – 100 = -21 Prior ESS = 15
(ELIR method)<br>
21
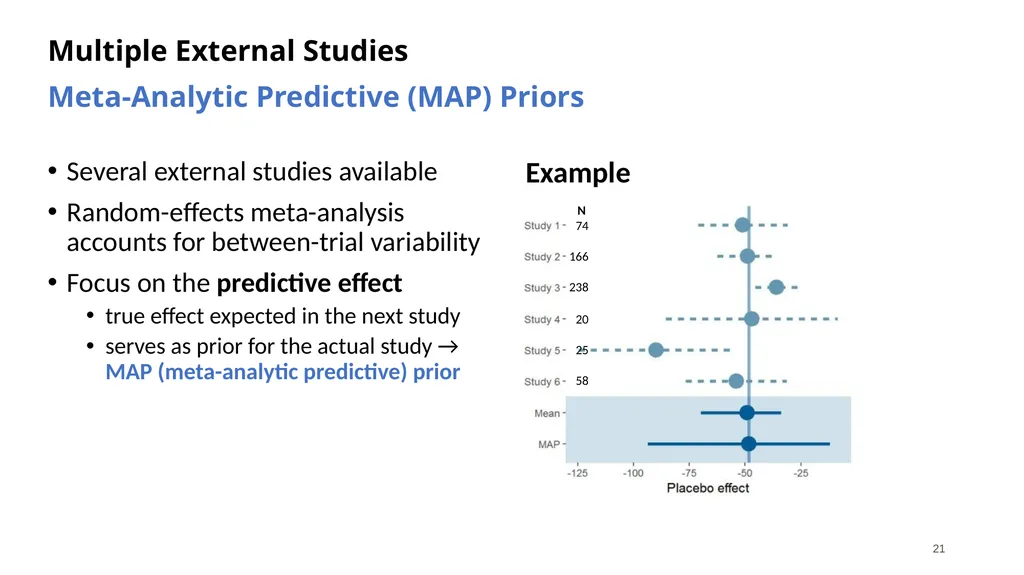
Multiple External Studies 21 Meta-Analytic Predictive (MAP) Priors Several external studies available
Random-effects meta-analysis accounts for between-trial variability
Focus on the predictive effect
true effect expected in the next study
serves as prior for the actual study → MAP (meta-analytic predictive) prior Example N
74
166
238
20
25
58<br>
Random-effects meta-analysis accounts for between-trial variability
Focus on the predictive effect
true effect expected in the next study
serves as prior for the actual study → MAP (meta-analytic predictive) prior Example N
74
166
238
20
25
58<br>
22
Case Studies<br>
23
PSI Conference Gothenburg 23 13.06.2022 Example 1: Bayesian dynamic borrowing of historical control data in a randomised phase II study
Presenter: Oliver Sailer (Boehringer Ingelheim)
Content: Luca Richeldi et al. NEJM 2022,
Florian Voss & BI 1015550 Statistics team at Boehringer Ingelheim<br>
Presenter: Oliver Sailer (Boehringer Ingelheim)
Content: Luca Richeldi et al. NEJM 2022,
Florian Voss & BI 1015550 Statistics team at Boehringer Ingelheim<br>
24
Trial of a Preferential Phosphodiesterase 4B Inhibitor for Idiopathic Pulmonary Fibrosis Luca Richeldi
Fondazione Policlinico Universitario A. Gemelli IRCCS, Università Cattolica del Sacro Cuore, Rome, Italy
On behalf of Arata Azuma, Vincent Cottin, Christian Hesslinger, Susanne Stowasser, Claudia Valenzuela, Marlies S. Wijsenbeek, Donald F. Zoz, Florian Voss, Toby M. Maher 15th May 2022<br>
Fondazione Policlinico Universitario A. Gemelli IRCCS, Università Cattolica del Sacro Cuore, Rome, Italy
On behalf of Arata Azuma, Vincent Cottin, Christian Hesslinger, Susanne Stowasser, Claudia Valenzuela, Marlies S. Wijsenbeek, Donald F. Zoz, Florian Voss, Toby M. Maher 15th May 2022<br>
25
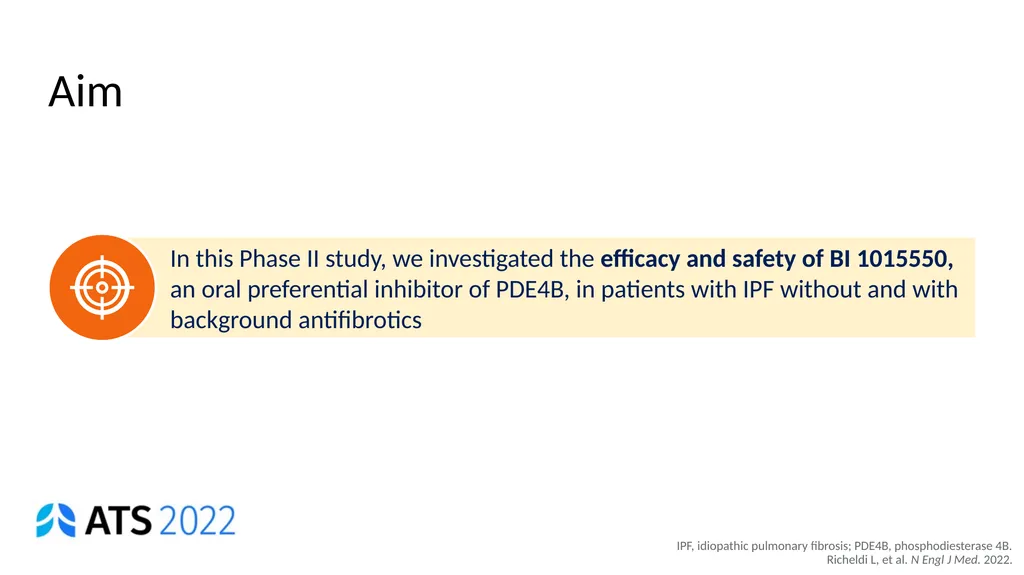
Aim IPF, idiopathic pulmonary fibrosis; PDE4B, phosphodiesterase 4B.
Richeldi L, et al. N Engl J Med. 2022.<br>
26
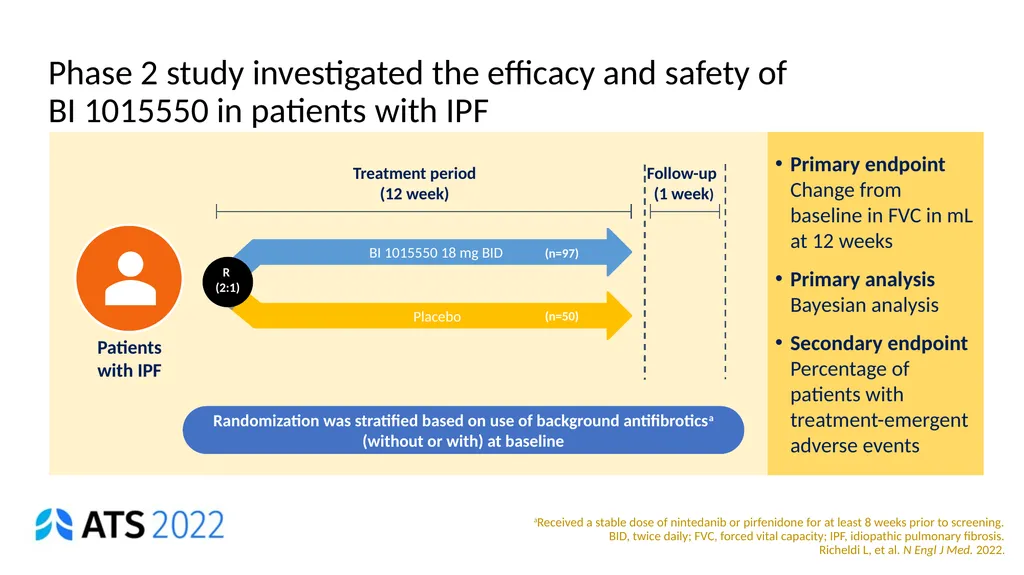
aReceived a stable dose of nintedanib or pirfenidone for at least 8 weeks prior to screening.
BID, twice daily; FVC, forced vital capacity; IPF, idiopathic pulmonary fibrosis.
Richeldi L, et al. N Engl J Med. 2022. Phase 2 study investigated the efficacy and safety of BI 1015550 in patients with IPF Primary endpoint Change from baseline in FVC in mL at 12 weeks
Primary analysis Bayesian analysis
Secondary endpoint Percentage of patients with treatment-emergent adverse events Randomization was stratified based on use of background antifibroticsa (without or with) at baseline<br>
BID, twice daily; FVC, forced vital capacity; IPF, idiopathic pulmonary fibrosis.
Richeldi L, et al. N Engl J Med. 2022. Phase 2 study investigated the efficacy and safety of BI 1015550 in patients with IPF Primary endpoint Change from baseline in FVC in mL at 12 weeks
Primary analysis Bayesian analysis
Secondary endpoint Percentage of patients with treatment-emergent adverse events Randomization was stratified based on use of background antifibroticsa (without or with) at baseline<br>
27
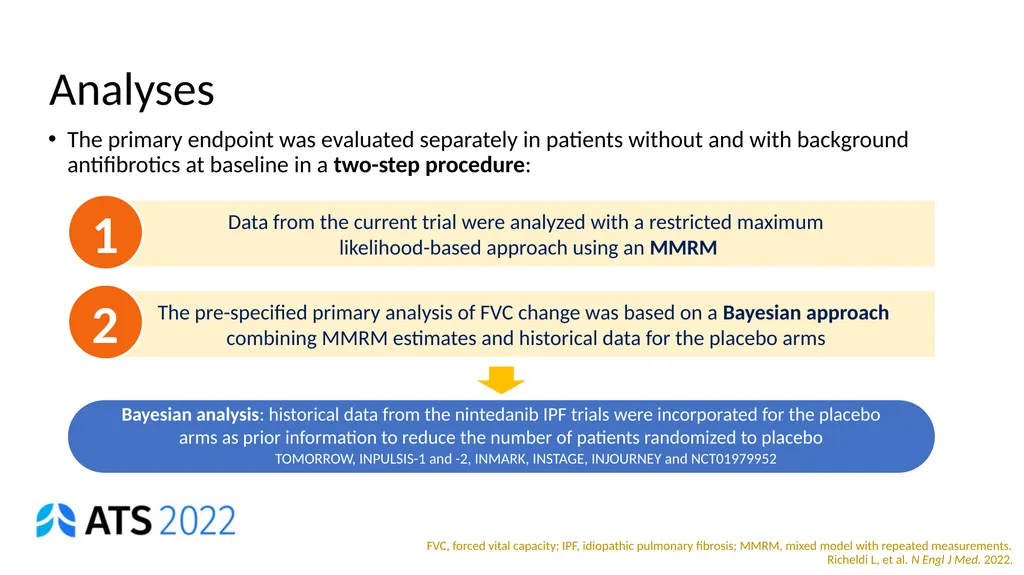
Analyses The primary endpoint was evaluated separately in patients without and with background antifibrotics at baseline in a two-step procedure: FVC, forced vital capacity; IPF, idiopathic pulmonary fibrosis; MMRM, mixed model with repeated measurements.
Richeldi L, et al. N Engl J Med. 2022.<br>
Richeldi L, et al. N Engl J Med. 2022.<br>
28
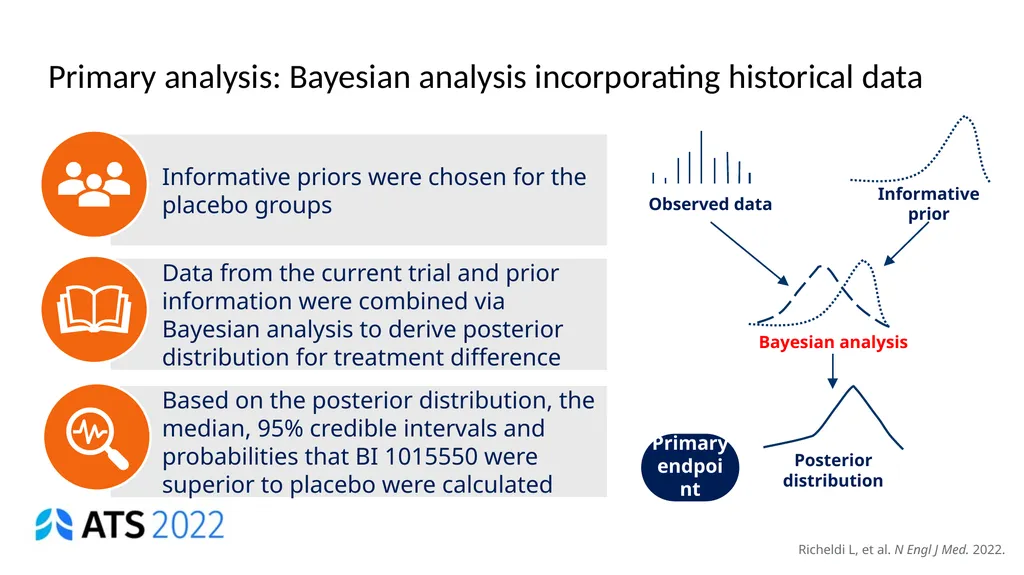
Primary analysis: Bayesian analysis incorporating historical data Richeldi L, et al. N Engl J Med. 2022.<br>
29
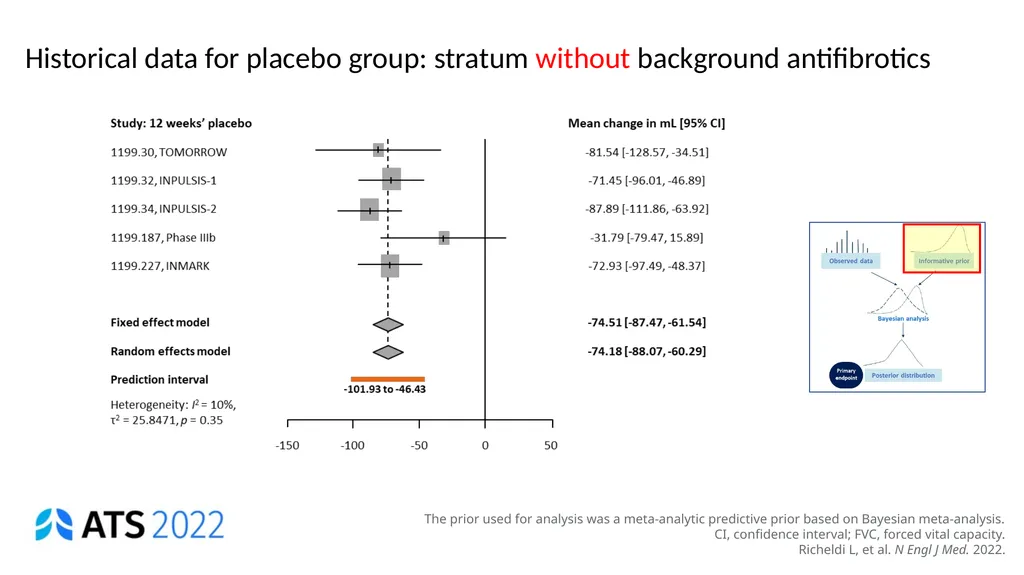
Historical data for placebo group: stratum without background antifibrotics The prior used for analysis was a meta-analytic predictive prior based on Bayesian meta-analysis.
CI, confidence interval; FVC, forced vital capacity.
Richeldi L, et al. N Engl J Med. 2022.<br>
Richeldi L, et al. N Engl J Med. 2022.<br>
30
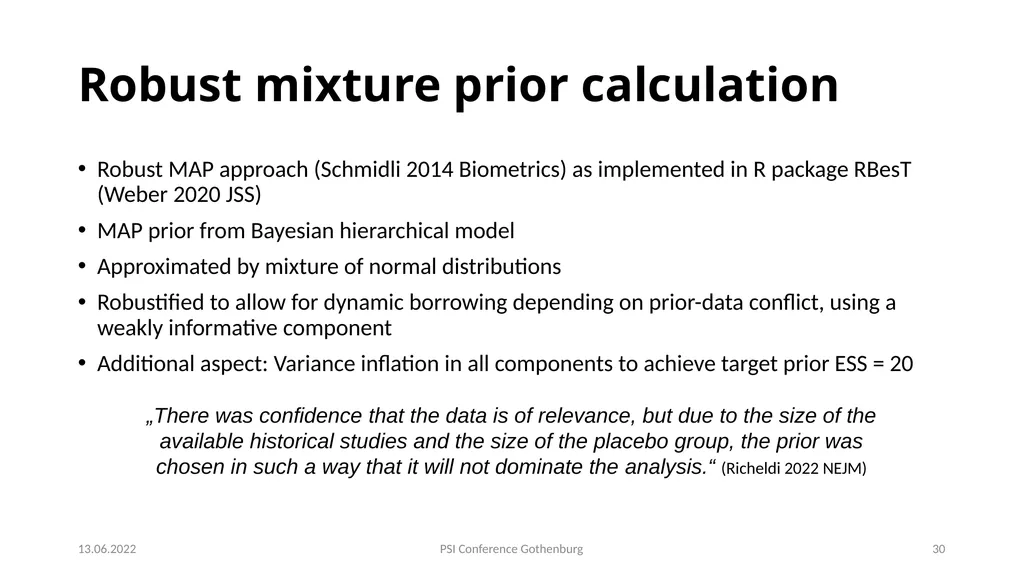
Robust MAP approach (Schmidli 2014 Biometrics) as implemented in R package RBesT (Weber 2020 JSS)
MAP prior from Bayesian hierarchical model
Approximated by mixture of normal distributions
Robustified to allow for dynamic borrowing depending on prior-data conflict, using a weakly informative component
Additional aspect: Variance inflation in all components to achieve target prior ESS = 20 Robust mixture prior calculation PSI Conference Gothenburg 30 13.06.2022 „There was confidence that the data is of relevance, but due to the size of the available historical studies and the size of the placebo group, the prior was chosen in such a way that it will not dominate the analysis.“ (Richeldi 2022 NEJM)<br>
MAP prior from Bayesian hierarchical model
Approximated by mixture of normal distributions
Robustified to allow for dynamic borrowing depending on prior-data conflict, using a weakly informative component
Additional aspect: Variance inflation in all components to achieve target prior ESS = 20 Robust mixture prior calculation PSI Conference Gothenburg 30 13.06.2022 „There was confidence that the data is of relevance, but due to the size of the available historical studies and the size of the placebo group, the prior was chosen in such a way that it will not dominate the analysis.“ (Richeldi 2022 NEJM)<br>
31
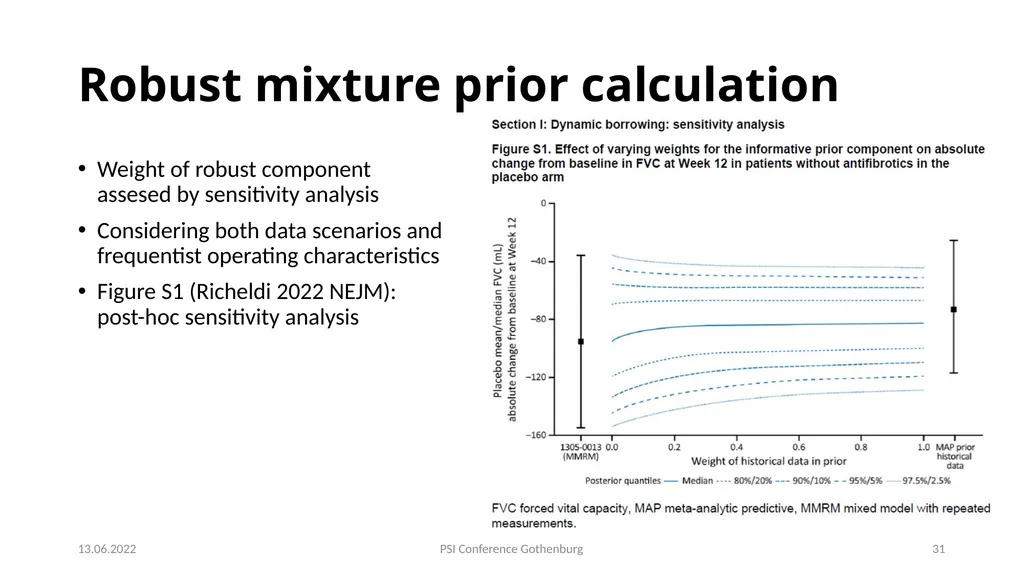
Weight of robust component assesed by sensitivity analysis
Considering both data scenarios and frequentist operating characteristics
Figure S1 (Richeldi 2022 NEJM): post-hoc sensitivity analysis Robust mixture prior calculation PSI Conference Gothenburg 31 13.06.2022<br>
Considering both data scenarios and frequentist operating characteristics
Figure S1 (Richeldi 2022 NEJM): post-hoc sensitivity analysis Robust mixture prior calculation PSI Conference Gothenburg 31 13.06.2022<br>
32
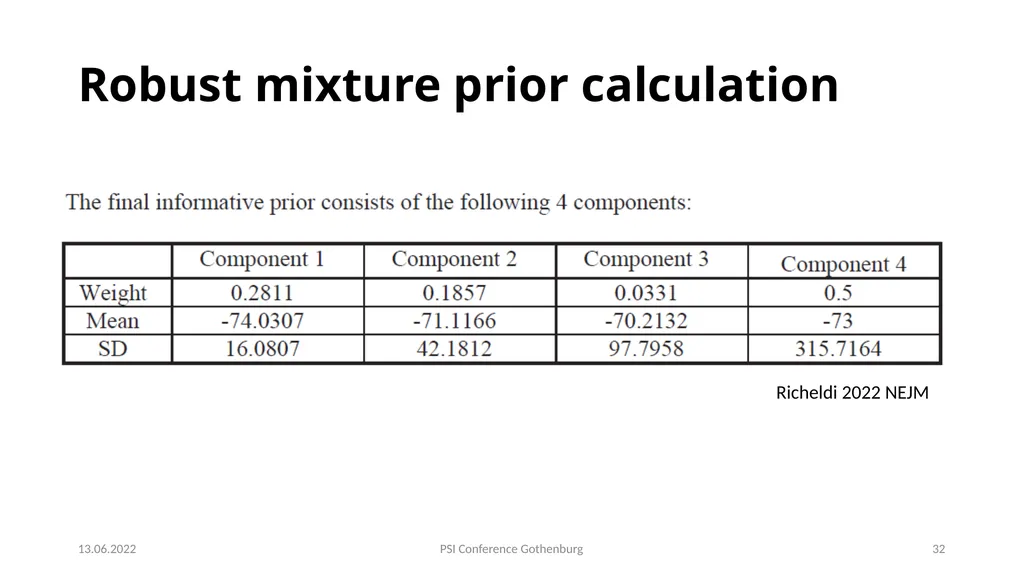
Robust mixture prior calculation PSI Conference Gothenburg 32 13.06.2022 Richeldi 2022 NEJM<br>
33
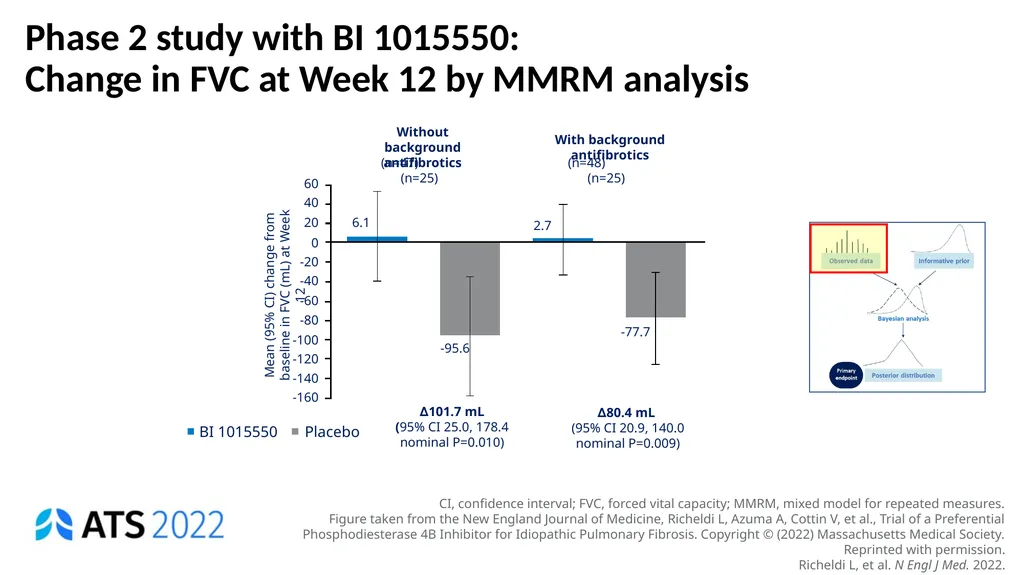
Phase 2 study with BI 1015550:
Change in FVC at Week 12 by MMRM analysis CI, confidence interval; FVC, forced vital capacity; MMRM, mixed model for repeated measures.
Figure taken from the New England Journal of Medicine, Richeldi L, Azuma A, Cottin V, et al., Trial of a Preferential Phosphodiesterase 4B Inhibitor for Idiopathic Pulmonary Fibrosis. Copyright © (2022) Massachusetts Medical Society. Reprinted with permission.
Richeldi L, et al. N Engl J Med. 2022.<br>
Figure taken from the New England Journal of Medicine, Richeldi L, Azuma A, Cottin V, et al., Trial of a Preferential Phosphodiesterase 4B Inhibitor for Idiopathic Pulmonary Fibrosis. Copyright © (2022) Massachusetts Medical Society. Reprinted with permission.
Richeldi L, et al. N Engl J Med. 2022.<br>
34
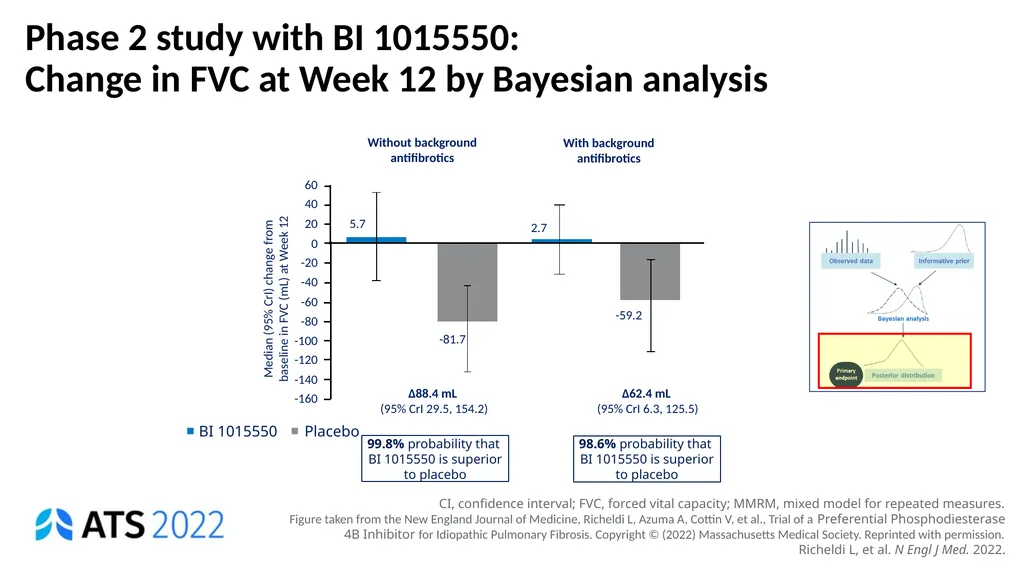
Phase 2 study with BI 1015550:
Change in FVC at Week 12 by Bayesian analysis CI, confidence interval; FVC, forced vital capacity; MMRM, mixed model for repeated measures.
Figure taken from the New England Journal of Medicine, Richeldi L, Azuma A, Cottin V, et al., Trial of a Preferential Phosphodiesterase 4B Inhibitor for Idiopathic Pulmonary Fibrosis. Copyright © (2022) Massachusetts Medical Society. Reprinted with permission.
Richeldi L, et al. N Engl J Med. 2022.<br>
Figure taken from the New England Journal of Medicine, Richeldi L, Azuma A, Cottin V, et al., Trial of a Preferential Phosphodiesterase 4B Inhibitor for Idiopathic Pulmonary Fibrosis. Copyright © (2022) Massachusetts Medical Society. Reprinted with permission.
Richeldi L, et al. N Engl J Med. 2022.<br>
35
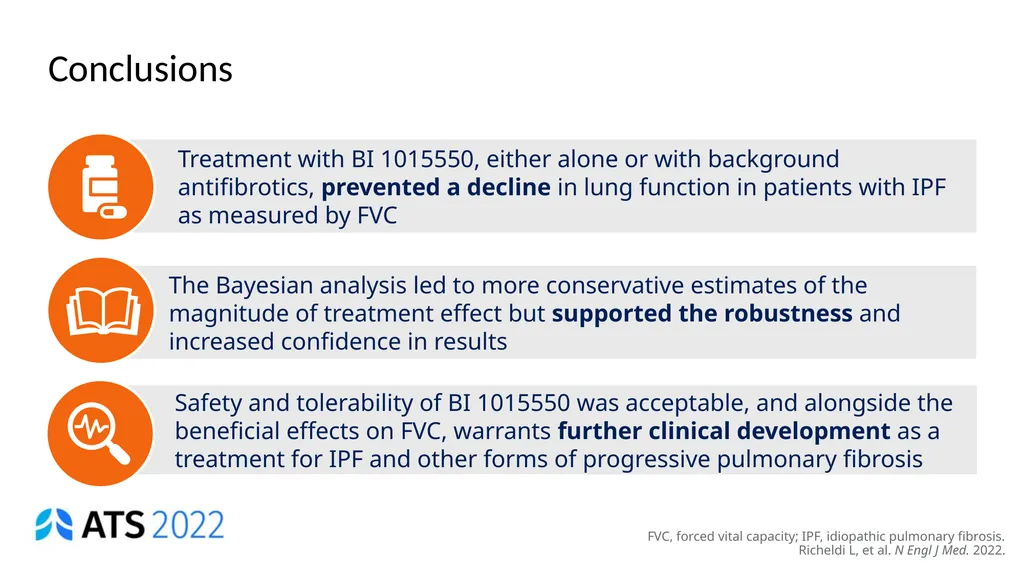
Conclusions FVC, forced vital capacity; IPF, idiopathic pulmonary fibrosis.
Richeldi L, et al. N Engl J Med. 2022.<br>
Richeldi L, et al. N Engl J Med. 2022.<br>
36
PSI Conference Gothenburg 36 13.06.2022 Example 2: Bayesian dynamic borrowing of external control data as a supportive OS analysis
Presenter: Julia Niewczas (J&J)<br>
Presenter: Julia Niewczas (J&J)<br>
37
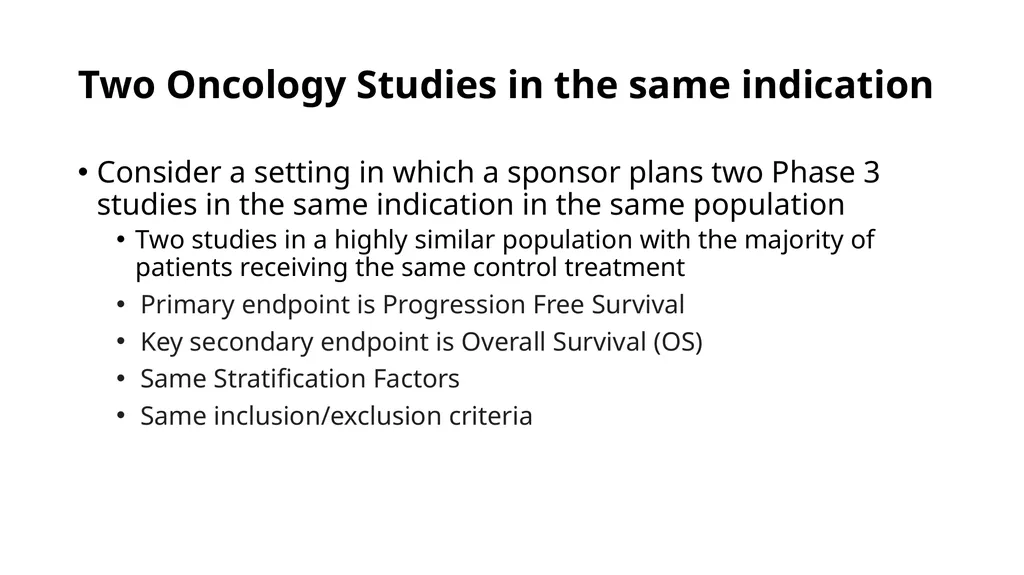
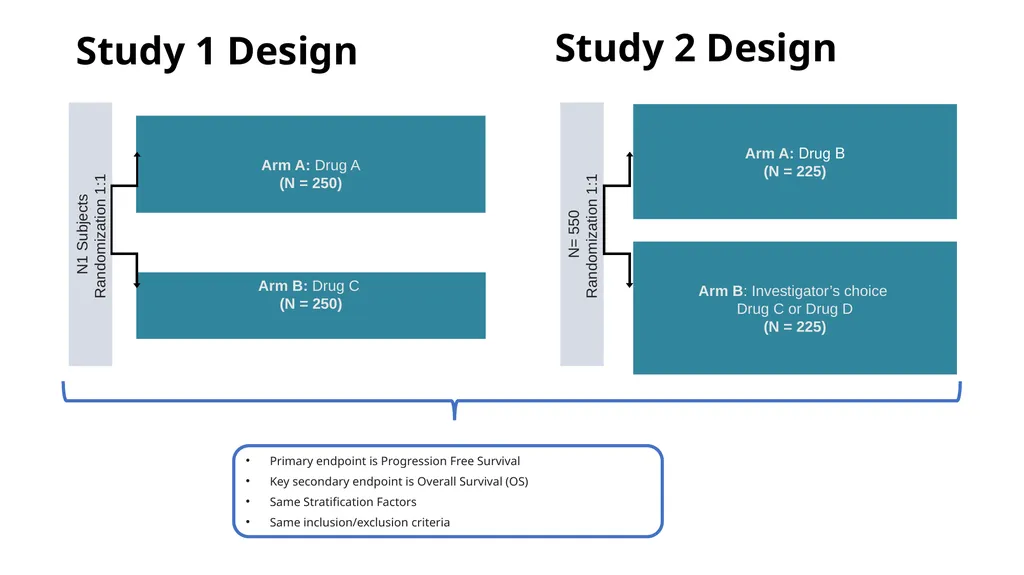
Two Oncology Studies in the same indication Consider a setting in which a sponsor plans two Phase 3 studies in the same indication in the same population
Two studies in a highly similar population with the majority of patients receiving the same control treatment
Primary endpoint is Progression Free Survival
Key secondary endpoint is Overall Survival (OS)
Same Stratification Factors
Same inclusion/exclusion criteria<br>
Two studies in a highly similar population with the majority of patients receiving the same control treatment
Primary endpoint is Progression Free Survival
Key secondary endpoint is Overall Survival (OS)
Same Stratification Factors
Same inclusion/exclusion criteria<br>
38
Study 1 Design Arm A: Drug A
(N = 250) N1 Subjects
Randomization 1:1 Arm B: Drug C
(N = 250) Study 2 Design N= 550
Randomization 1:1 Arm A: Drug B
(N = 225) Arm B: Investigator’s choice Drug C or Drug D
(N = 225) Primary endpoint is Progression Free Survival
Key secondary endpoint is Overall Survival (OS)
Same Stratification Factors
Same inclusion/exclusion criteria<br>
(N = 250) N1 Subjects
Randomization 1:1 Arm B: Drug C
(N = 250) Study 2 Design N= 550
Randomization 1:1 Arm A: Drug B
(N = 225) Arm B: Investigator’s choice Drug C or Drug D
(N = 225) Primary endpoint is Progression Free Survival
Key secondary endpoint is Overall Survival (OS)
Same Stratification Factors
Same inclusion/exclusion criteria<br>
39
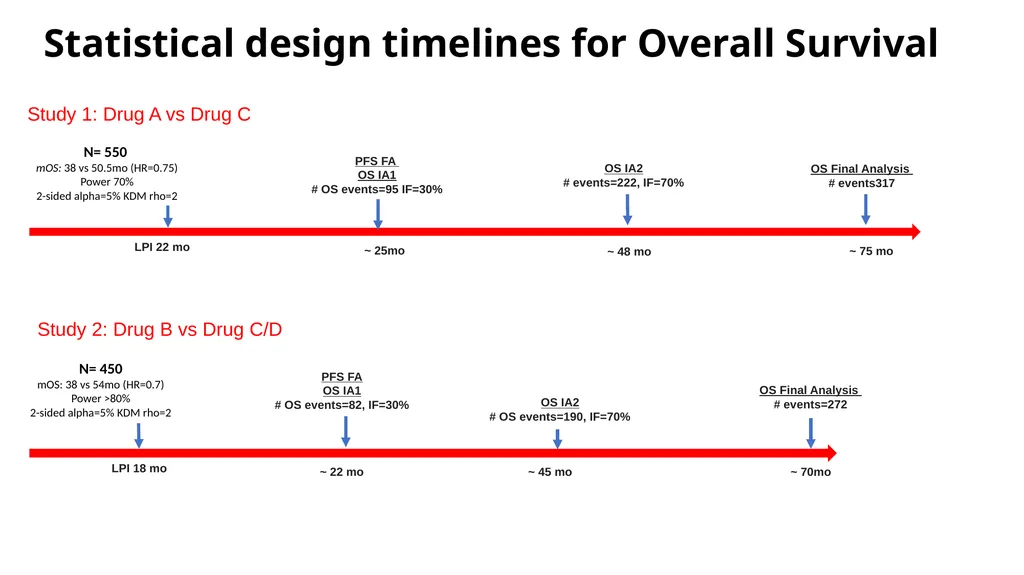
LPI 22 mo ~ 75 mo OS IA2
# events=222, IF=70% PFS FA OS IA1
# OS events=95 IF=30% ~ 25mo LPI 18 mo ~ 70mo OS Final Analysis
# events=272 OS IA2
# OS events=190, IF=70% ~ 45 mo Study 2: Drug B vs Drug C/D OS Final Analysis
# events317 Study 1: Drug A vs Drug C N= 550
mOS: 38 vs 50.5mo (HR=0.75)
Power 70%
2-sided alpha=5% KDM rho=2 N= 450
mOS: 38 vs 54mo (HR=0.7)
Power >80%
2-sided alpha=5% KDM rho=2 Statistical design timelines for Overall Survival ~ 48 mo<br>
# events=222, IF=70% PFS FA OS IA1
# OS events=95 IF=30% ~ 25mo LPI 18 mo ~ 70mo OS Final Analysis
# events=272 OS IA2
# OS events=190, IF=70% ~ 45 mo Study 2: Drug B vs Drug C/D OS Final Analysis
# events317 Study 1: Drug A vs Drug C N= 550
mOS: 38 vs 50.5mo (HR=0.75)
Power 70%
2-sided alpha=5% KDM rho=2 N= 450
mOS: 38 vs 54mo (HR=0.7)
Power >80%
2-sided alpha=5% KDM rho=2 Statistical design timelines for Overall Survival ~ 48 mo<br>
40
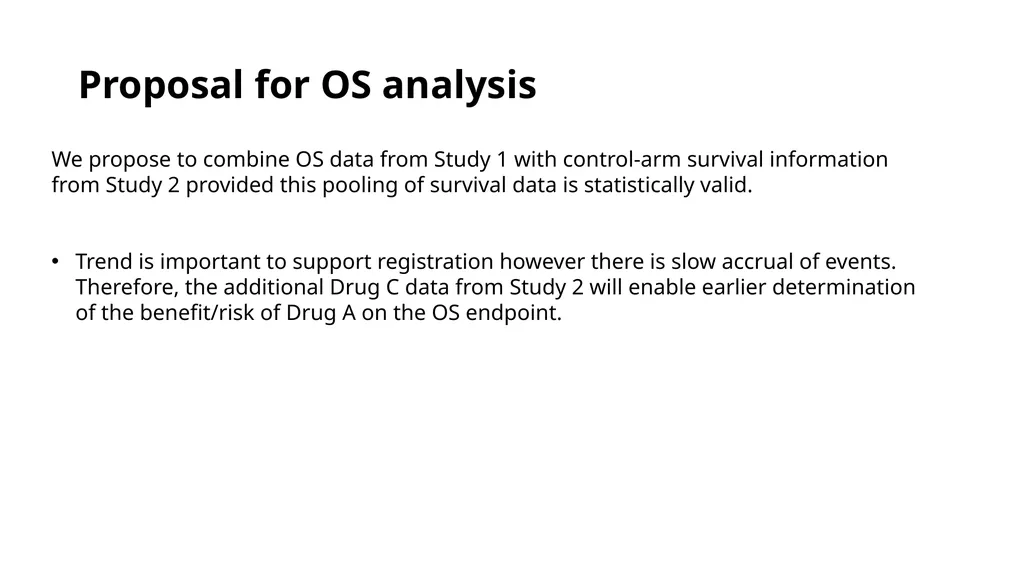
Proposal for OS analysis 40 We propose to combine OS data from Study 1 with control-arm survival information from Study 2 provided this pooling of survival data is statistically valid.
Trend is important to support registration however there is slow accrual of events. Therefore, the additional Drug C data from Study 2 will enable earlier determination of the benefit/risk of Drug A on the OS endpoint.<br>
Trend is important to support registration however there is slow accrual of events. Therefore, the additional Drug C data from Study 2 will enable earlier determination of the benefit/risk of Drug A on the OS endpoint.<br>
41
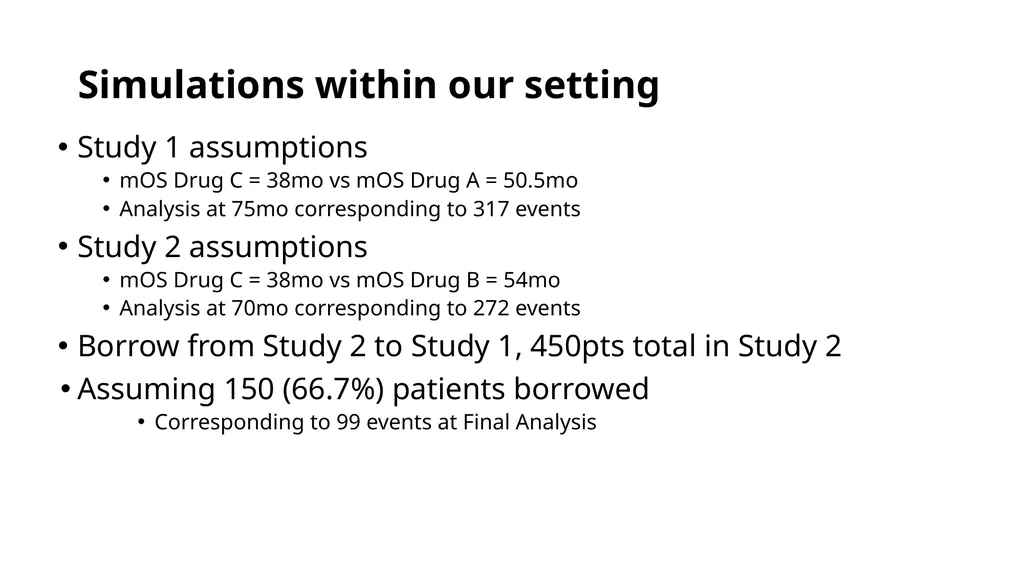
Simulations within our setting Study 1 assumptions
mOS Drug C = 38mo vs mOS Drug A = 50.5mo
Analysis at 75mo corresponding to 317 events
Study 2 assumptions
mOS Drug C = 38mo vs mOS Drug B = 54mo
Analysis at 70mo corresponding to 272 events
Borrow from Study 2 to Study 1, 450pts total in Study 2
Assuming 150 (66.7%) patients borrowed
Corresponding to 99 events at Final Analysis<br>
mOS Drug C = 38mo vs mOS Drug A = 50.5mo
Analysis at 75mo corresponding to 317 events
Study 2 assumptions
mOS Drug C = 38mo vs mOS Drug B = 54mo
Analysis at 70mo corresponding to 272 events
Borrow from Study 2 to Study 1, 450pts total in Study 2
Assuming 150 (66.7%) patients borrowed
Corresponding to 99 events at Final Analysis<br>
42
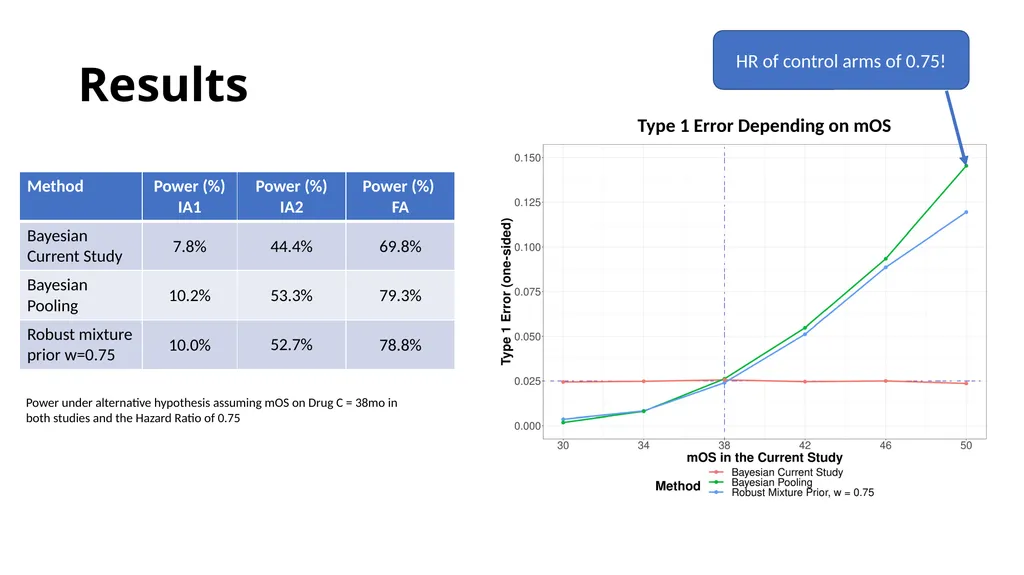
Results Power under alternative hypothesis assuming mOS on Drug C = 38mo in both studies and the Hazard Ratio of 0.75 Type 1 Error Depending on mOS HR of control arms of 0.75!<br>
43
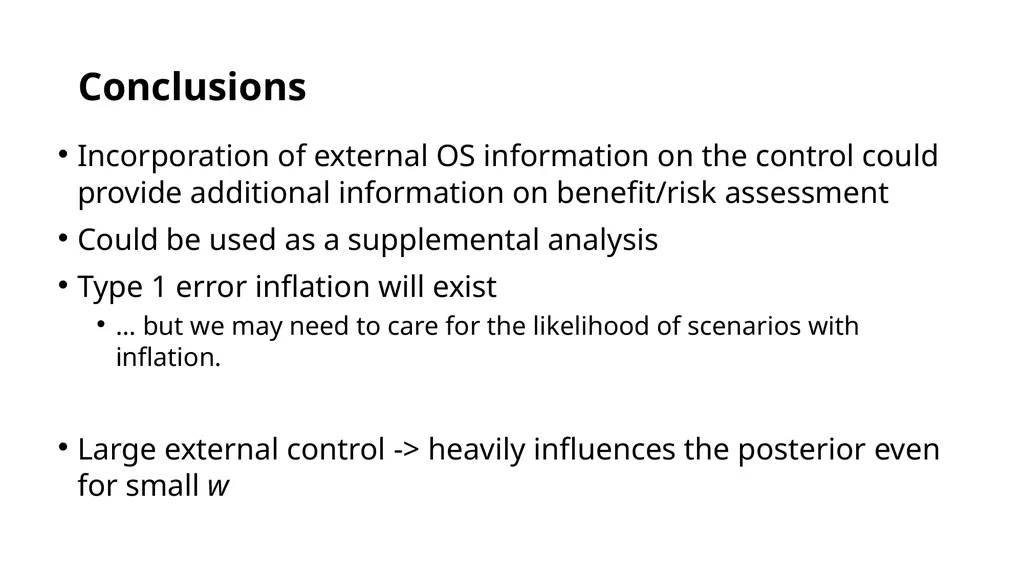
Conclusions Incorporation of external OS information on the control could provide additional information on benefit/risk assessment
Could be used as a supplemental analysis
Type 1 error inflation will exist
... but we may need to care for the likelihood of scenarios with inflation.
Large external control -> heavily influences the posterior even for small w<br>
Could be used as a supplemental analysis
Type 1 error inflation will exist
... but we may need to care for the likelihood of scenarios with inflation.
Large external control -> heavily influences the posterior even for small w<br>
44
PSI Conference Gothenburg 44 13.06.2022 Example 3: Benlysta for Systemic lupus erythematosus (SLE) in paediatric patients
Presenter: Nicky Best (GSK)<br>
Presenter: Nicky Best (GSK)<br>
45
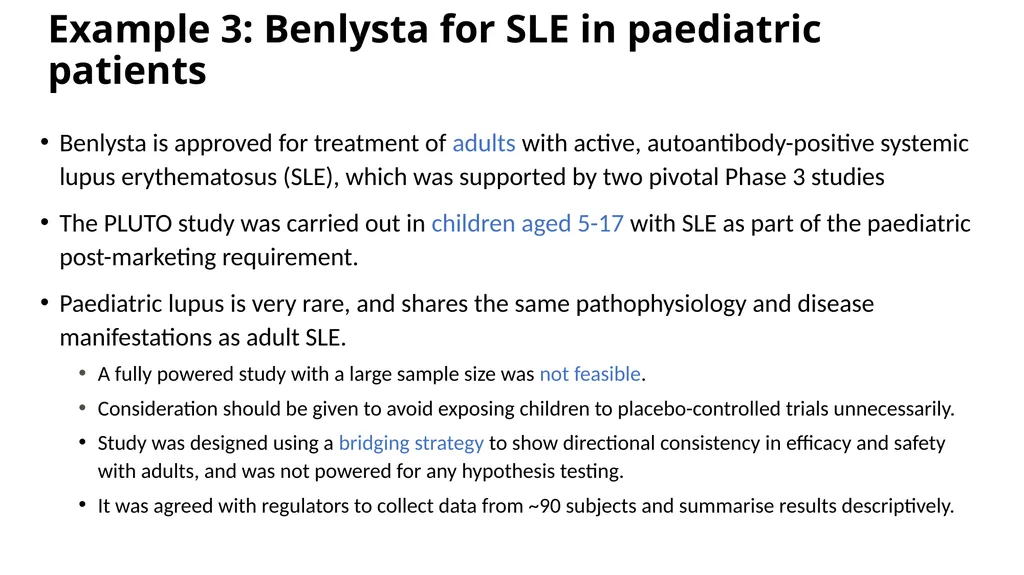
Example 3: Benlysta for SLE in paediatric patients Benlysta is approved for treatment of adults with active, autoantibody-positive systemic lupus erythematosus (SLE), which was supported by two pivotal Phase 3 studies
The PLUTO study was carried out in children aged 5-17 with SLE as part of the paediatric post-marketing requirement.
Paediatric lupus is very rare, and shares the same pathophysiology and disease manifestations as adult SLE.
A fully powered study with a large sample size was not feasible.
Consideration should be given to avoid exposing children to placebo-controlled trials unnecessarily.
Study was designed using a bridging strategy to show directional consistency in efficacy and safety with adults, and was not powered for any hypothesis testing.
It was agreed with regulators to collect data from ~90 subjects and summarise results descriptively.<br>
The PLUTO study was carried out in children aged 5-17 with SLE as part of the paediatric post-marketing requirement.
Paediatric lupus is very rare, and shares the same pathophysiology and disease manifestations as adult SLE.
A fully powered study with a large sample size was not feasible.
Consideration should be given to avoid exposing children to placebo-controlled trials unnecessarily.
Study was designed using a bridging strategy to show directional consistency in efficacy and safety with adults, and was not powered for any hypothesis testing.
It was agreed with regulators to collect data from ~90 subjects and summarise results descriptively.<br>
46
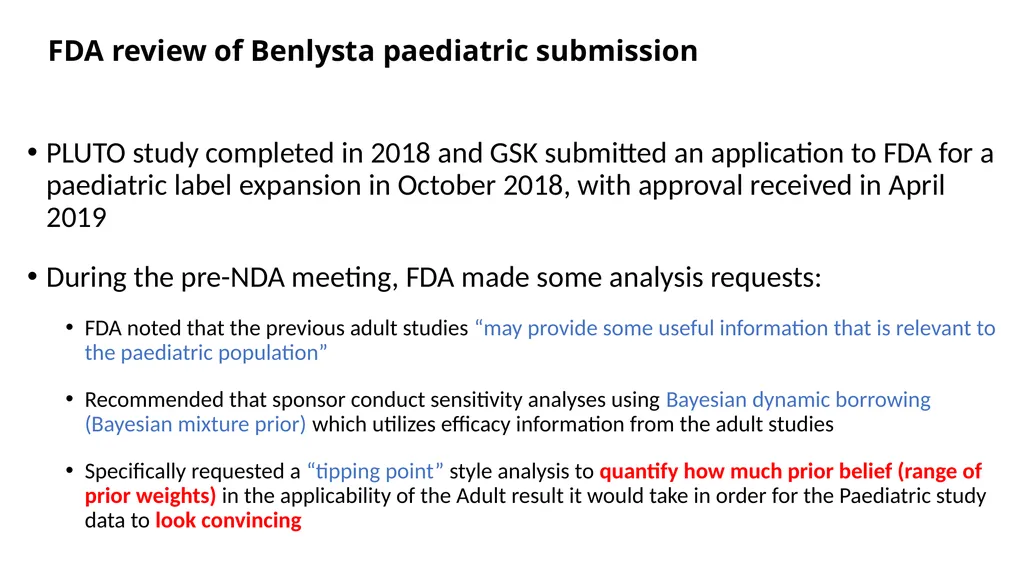
FDA review of Benlysta paediatric submission PLUTO study completed in 2018 and GSK submitted an application to FDA for a paediatric label expansion in October 2018, with approval received in April 2019
During the pre-NDA meeting, FDA made some analysis requests:
FDA noted that the previous adult studies “may provide some useful information that is relevant to the paediatric population”
Recommended that sponsor conduct sensitivity analyses using Bayesian dynamic borrowing (Bayesian mixture prior) which utilizes efficacy information from the adult studies
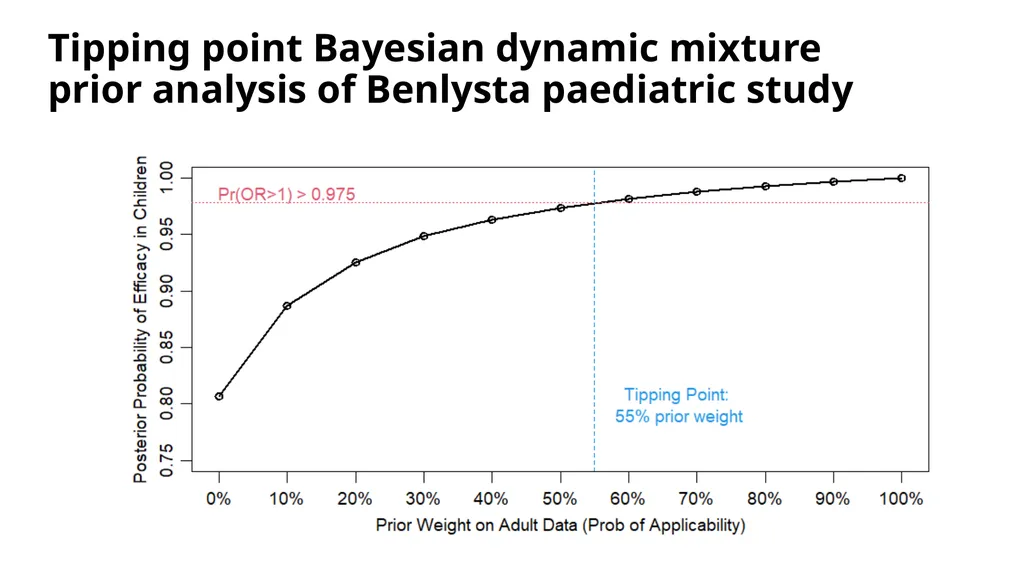
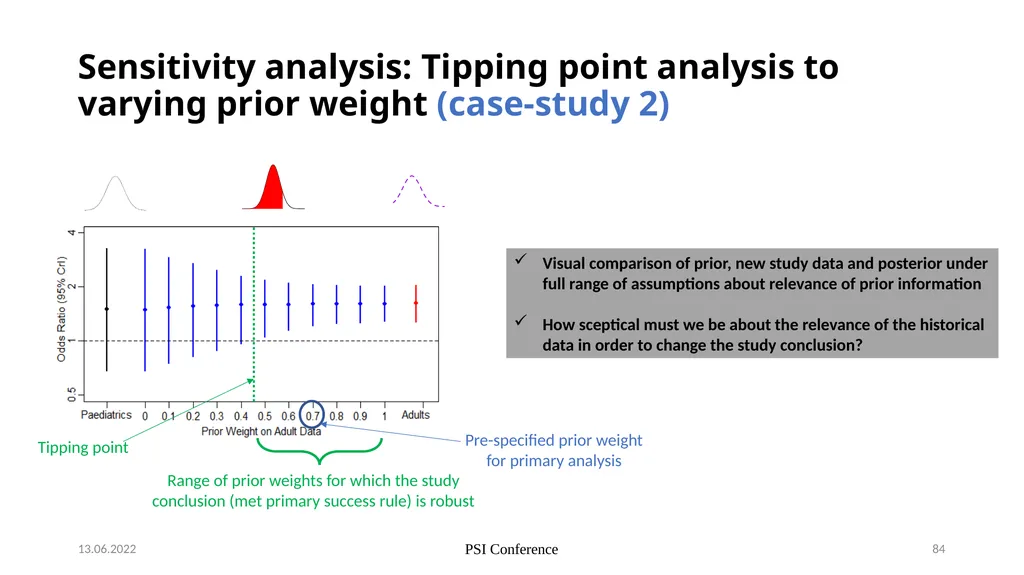
Specifically requested a “tipping point” style analysis to quantify how much prior belief (range of prior weights) in the applicability of the Adult result it would take in order for the Paediatric study data to look convincing<br>
During the pre-NDA meeting, FDA made some analysis requests:
FDA noted that the previous adult studies “may provide some useful information that is relevant to the paediatric population”
Recommended that sponsor conduct sensitivity analyses using Bayesian dynamic borrowing (Bayesian mixture prior) which utilizes efficacy information from the adult studies
Specifically requested a “tipping point” style analysis to quantify how much prior belief (range of prior weights) in the applicability of the Adult result it would take in order for the Paediatric study data to look convincing<br>
47
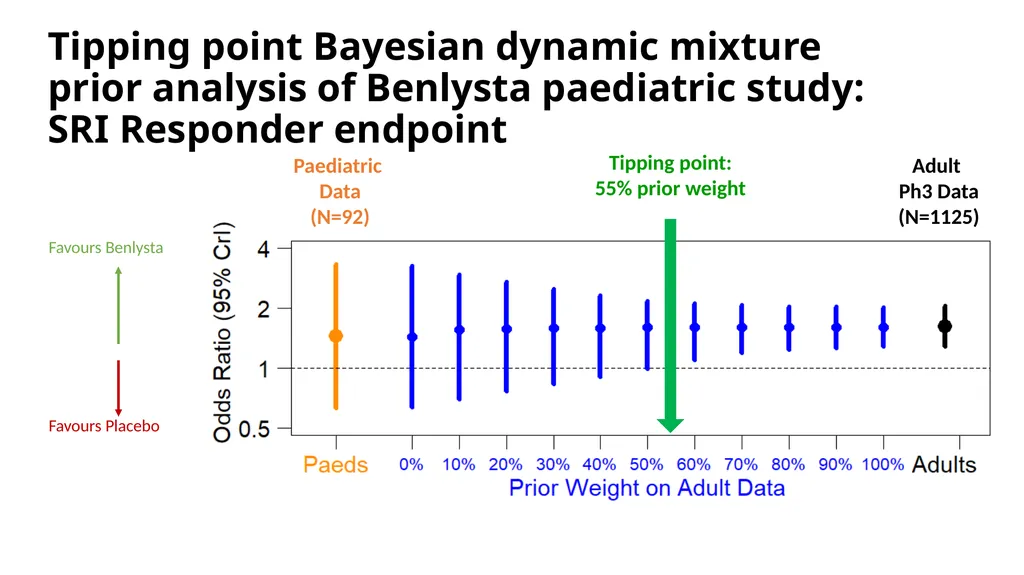
Tipping point Bayesian dynamic mixture prior analysis of Benlysta paediatric study: SRI Responder endpoint Paediatric
Data
(N=92) Adult
Ph3 Data
(N=1125) Favours Benlysta Favours Placebo<br>
Data
(N=92) Adult
Ph3 Data
(N=1125) Favours Benlysta Favours Placebo<br>
48
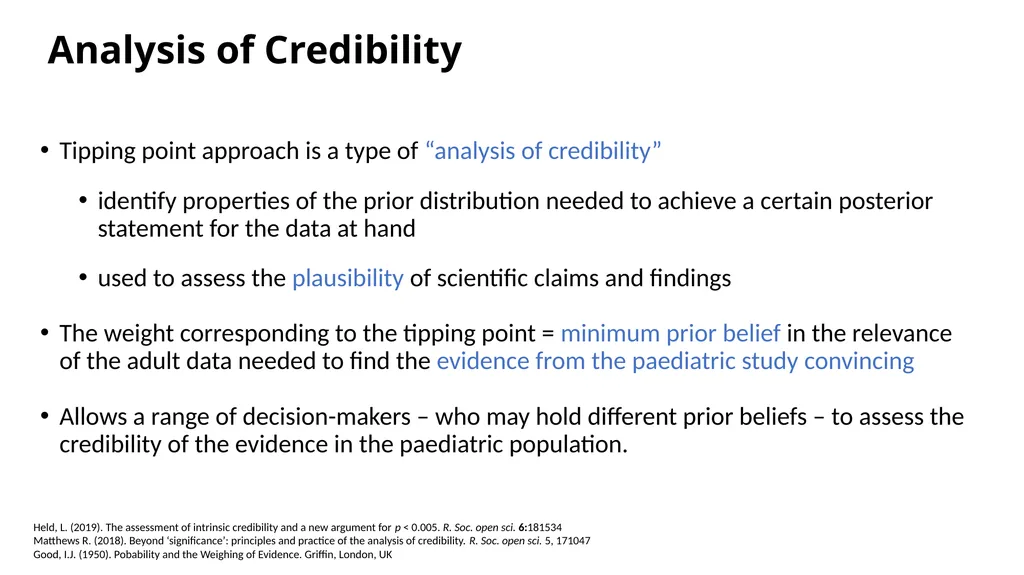
Tipping point approach is a type of “analysis of credibility”
identify properties of the prior distribution needed to achieve a certain posterior statement for the data at hand
used to assess the plausibility of scientific claims and findings
The weight corresponding to the tipping point = minimum prior belief in the relevance of the adult data needed to find the evidence from the paediatric study convincing
Allows a range of decision-makers – who may hold different prior beliefs – to assess the credibility of the evidence in the paediatric population. Analysis of Credibility Held, L. (2019). The assessment of intrinsic credibility and a new argument for p < 0.005. R. Soc. open sci. 6:181534
Matthews R. (2018). Beyond ‘significance’: principles and practice of the analysis of credibility. R. Soc. open sci. 5, 171047
Good, I.J. (1950). Pobability and the Weighing of Evidence. Griffin, London, UK<br>
identify properties of the prior distribution needed to achieve a certain posterior statement for the data at hand
used to assess the plausibility of scientific claims and findings
The weight corresponding to the tipping point = minimum prior belief in the relevance of the adult data needed to find the evidence from the paediatric study convincing
Allows a range of decision-makers – who may hold different prior beliefs – to assess the credibility of the evidence in the paediatric population. Analysis of Credibility Held, L. (2019). The assessment of intrinsic credibility and a new argument for p < 0.005. R. Soc. open sci. 6:181534
Matthews R. (2018). Beyond ‘significance’: principles and practice of the analysis of credibility. R. Soc. open sci. 5, 171047
Good, I.J. (1950). Pobability and the Weighing of Evidence. Griffin, London, UK<br>
49
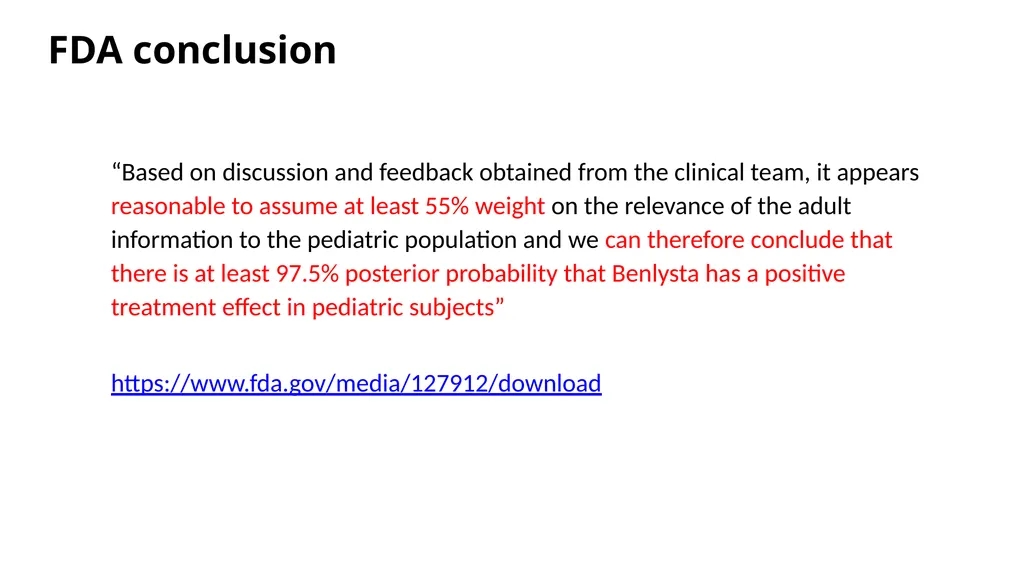
“Based on discussion and feedback obtained from the clinical team, it appears reasonable to assume at least 55% weight on the relevance of the adult information to the pediatric population and we can therefore conclude that there is at least 97.5% posterior probability that Benlysta has a positive treatment effect in pediatric subjects”
https://www.fda.gov/media/127912/download FDA conclusion<br>
https://www.fda.gov/media/127912/download FDA conclusion<br>
50
PSI Conference Gothenburg 50 13.06.2022 Example 4: B-SAFE App: integrating historical clinical trial safety data in the adverse event analysis of a new clinical trial
Presenter: Oliver Sailer (Boehringer Ingelheim) QUIC
A Global BDS-TMCP Initiative<br>
Presenter: Oliver Sailer (Boehringer Ingelheim) QUIC
A Global BDS-TMCP Initiative<br>
51
B-SAFE App: integrating historical clinical trial safety data in the adverse event analysis of a new clinical trial B-SAFE is a cross-functional collaboration integrating historical clinical trial safety data in the adverse event analysis of a new clinical trial at Boehringer Ingelheim.
Pilot R Shiny App developed for a RCT comparing a new respiratory compound to SOC.
Interactively guides users through a Bayesian safety analysis of adverse event (AE) incidence proportions and incidence rates
MAP prior models for binary data and exponential distribution (Schmidli 2014 Biometrics, Roychoudhury & Neuenschwander 2020 StatMed)
Summary tables are provided that correspond to traditional AE summary tables and that also allow probabilistic comparisons of safety between treatment arms. PSI Conference Gothenburg 51 13.06.2022<br>
Pilot R Shiny App developed for a RCT comparing a new respiratory compound to SOC.
Interactively guides users through a Bayesian safety analysis of adverse event (AE) incidence proportions and incidence rates
MAP prior models for binary data and exponential distribution (Schmidli 2014 Biometrics, Roychoudhury & Neuenschwander 2020 StatMed)
Summary tables are provided that correspond to traditional AE summary tables and that also allow probabilistic comparisons of safety between treatment arms. PSI Conference Gothenburg 51 13.06.2022<br>
52
Robust MAP prior to borrow adult data on investigational treatment and adult & paediatric data on active comparator for NI Ph3 trial in paediatric MS (Novartis)
Robust mixture prior to borrow treatment effect of approved respiratory medicine from pivotal Ph3 trial in bridging study for China (GSK – presented at PSI 2021)
Robust mixture prior to borrow healthy volunteers data on receptor occupancy to design a PoC study in patients in immuno-inflammation (Servier – see poster) Other examples<br>
Robust mixture prior to borrow treatment effect of approved respiratory medicine from pivotal Ph3 trial in bridging study for China (GSK – presented at PSI 2021)
Robust mixture prior to borrow healthy volunteers data on receptor occupancy to design a PoC study in patients in immuno-inflammation (Servier – see poster) Other examples<br>
53
Designing a BDB study:
A framework to engage with regulatory authorities Presenter: Gaëlle Saint-Hilary (Saryga)<br>
54
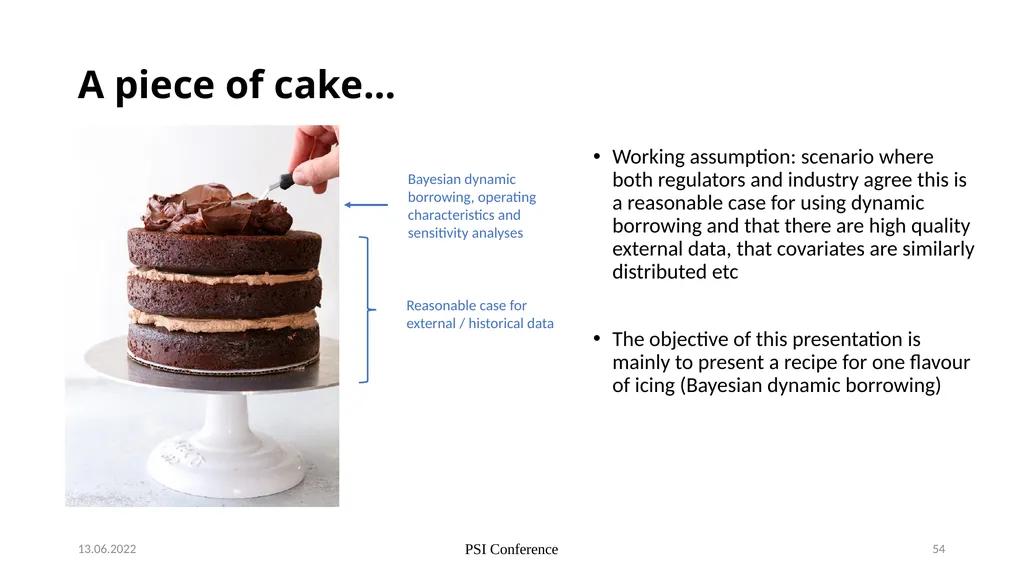
A piece of cake... Working assumption: scenario where both regulators and industry agree this is a reasonable case for using dynamic borrowing and that there are high quality external data, that covariates are similarly distributed etc
The objective of this presentation is mainly to present a recipe for one flavour of icing (Bayesian dynamic borrowing) PSI Conference 54 13.06.2022 Reasonable case for external / historical data Bayesian dynamic borrowing, operating characteristics and sensitivity analyses<br>
The objective of this presentation is mainly to present a recipe for one flavour of icing (Bayesian dynamic borrowing) PSI Conference 54 13.06.2022 Reasonable case for external / historical data Bayesian dynamic borrowing, operating characteristics and sensitivity analyses<br>
55
Focus of this presentation Case-studies to illustrate a proposed framework
to evaluate and present an augmented RCT for one ‘flavour’ of icing
(Bayesian dynamic borrowing)
Recipe to evaluate and present design characteristics
Recipe to evaluate and present results 13.06.2022 PSI Conference 55<br>
to evaluate and present an augmented RCT for one ‘flavour’ of icing
(Bayesian dynamic borrowing)
Recipe to evaluate and present design characteristics
Recipe to evaluate and present results 13.06.2022 PSI Conference 55<br>
56
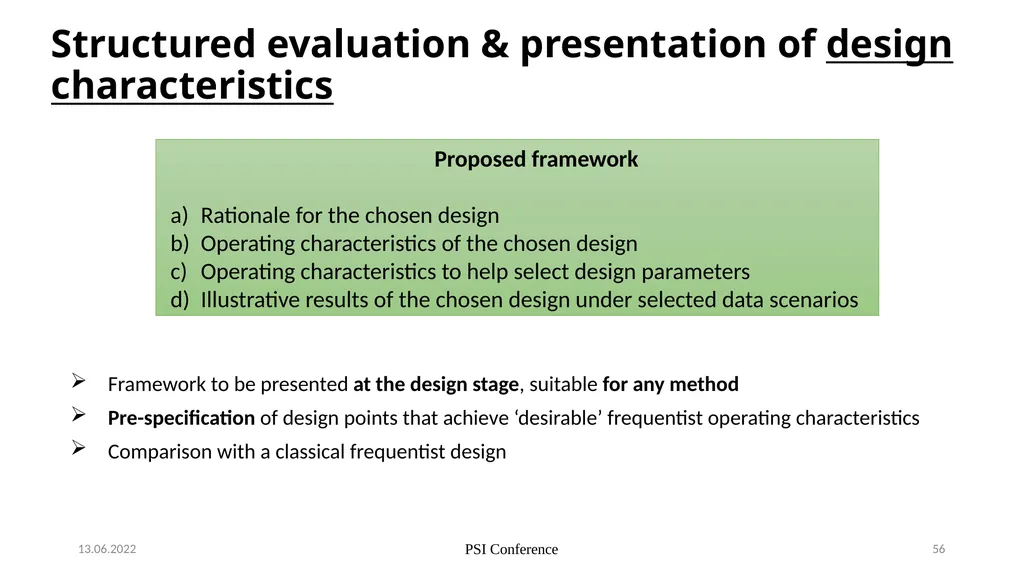
Structured evaluation & presentation of design characteristics PSI Conference 56 Framework to be presented at the design stage, suitable for any method
Pre-specification of design points that achieve ‘desirable’ frequentist operating characteristics
Comparison with a classical frequentist design Proposed framework
Rationale for the chosen design
Operating characteristics of the chosen design
Operating characteristics to help select design parameters
Illustrative results of the chosen design under selected data scenarios 13.06.2022<br>
Pre-specification of design points that achieve ‘desirable’ frequentist operating characteristics
Comparison with a classical frequentist design Proposed framework
Rationale for the chosen design
Operating characteristics of the chosen design
Operating characteristics to help select design parameters
Illustrative results of the chosen design under selected data scenarios 13.06.2022<br>
57
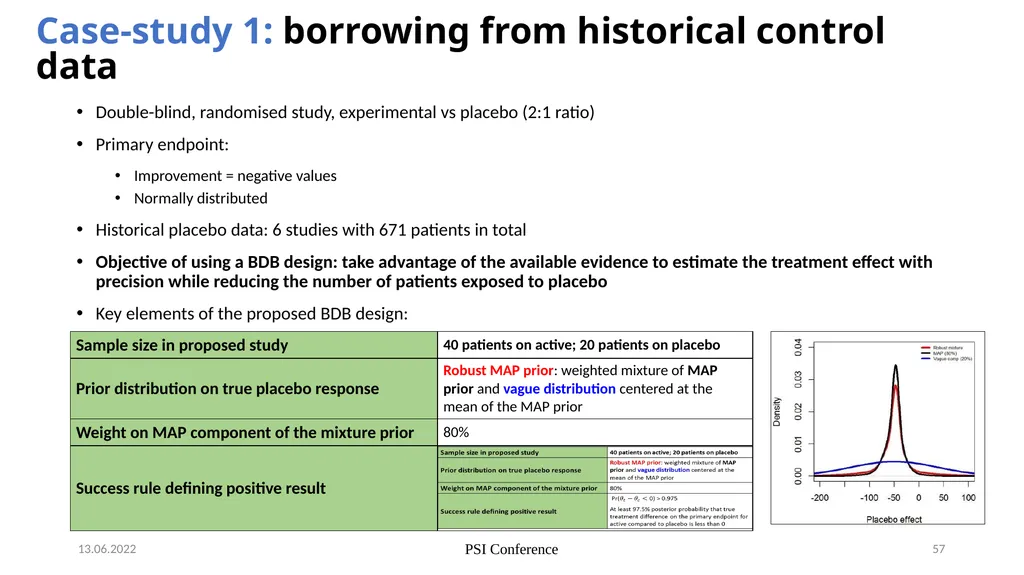
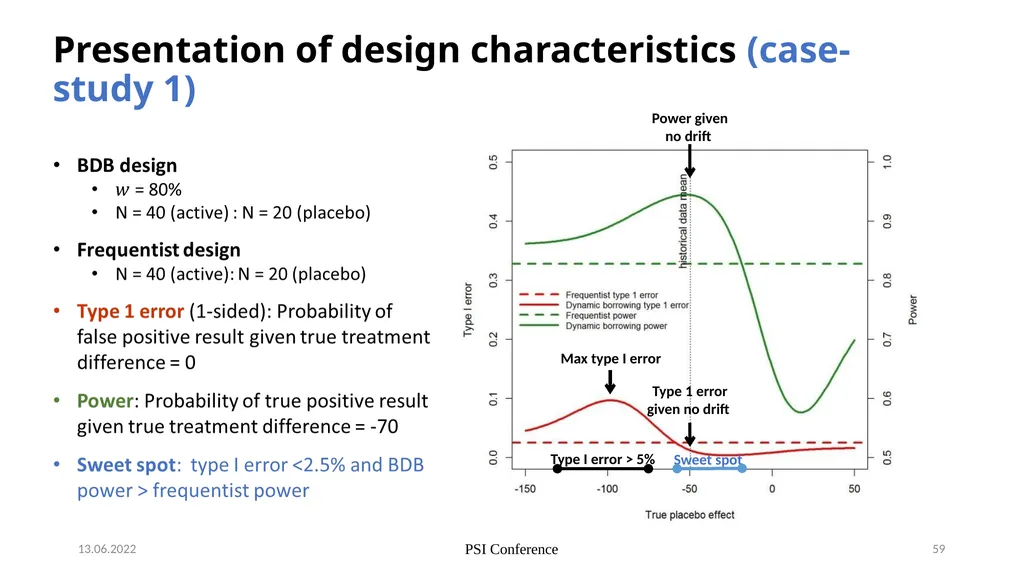
Double-blind, randomised study, experimental vs placebo (2:1 ratio)
Primary endpoint:
Improvement = negative values
Normally distributed
Historical placebo data: 6 studies with 671 patients in total
Objective of using a BDB design: take advantage of the available evidence to estimate the treatment effect with precision while reducing the number of patients exposed to placebo
Key elements of the proposed BDB design: Case-study 1: borrowing from historical control data PSI Conference 57 13.06.2022<br>
Primary endpoint:
Improvement = negative values
Normally distributed
Historical placebo data: 6 studies with 671 patients in total
Objective of using a BDB design: take advantage of the available evidence to estimate the treatment effect with precision while reducing the number of patients exposed to placebo
Key elements of the proposed BDB design: Case-study 1: borrowing from historical control data PSI Conference 57 13.06.2022<br>
58
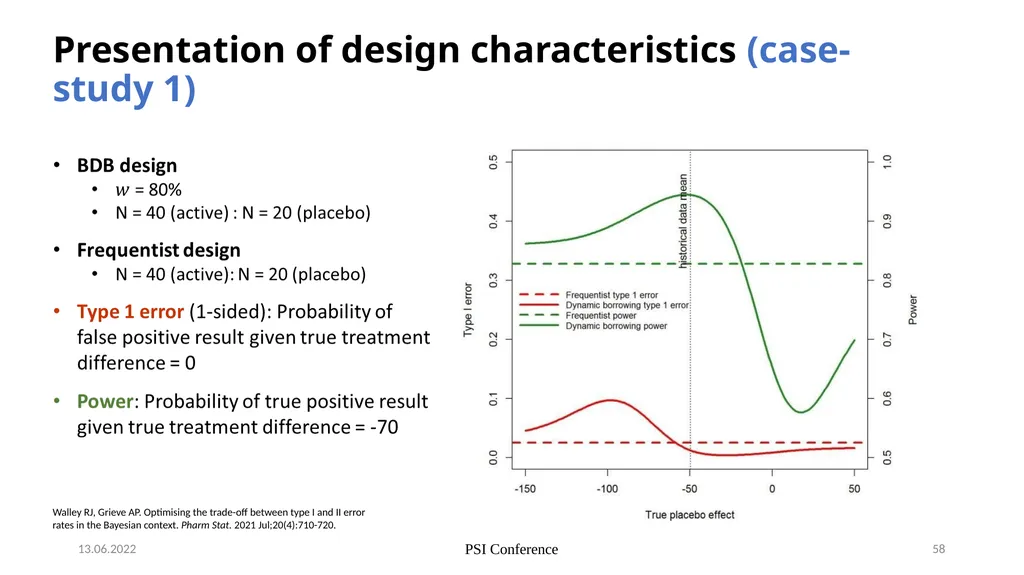
Presentation of design characteristics (case-study 1) PSI Conference 58 13.06.2022 Walley RJ, Grieve AP. Optimising the trade-off between type I and II error rates in the Bayesian context. Pharm Stat. 2021 Jul;20(4):710-720.<br>
59
PSI Conference 59 13.06.2022 Max type I error Type I error > 5% Sweet spot Type 1 error given no drift Power given no drift Presentation of design characteristics (case-study 1)<br>
60
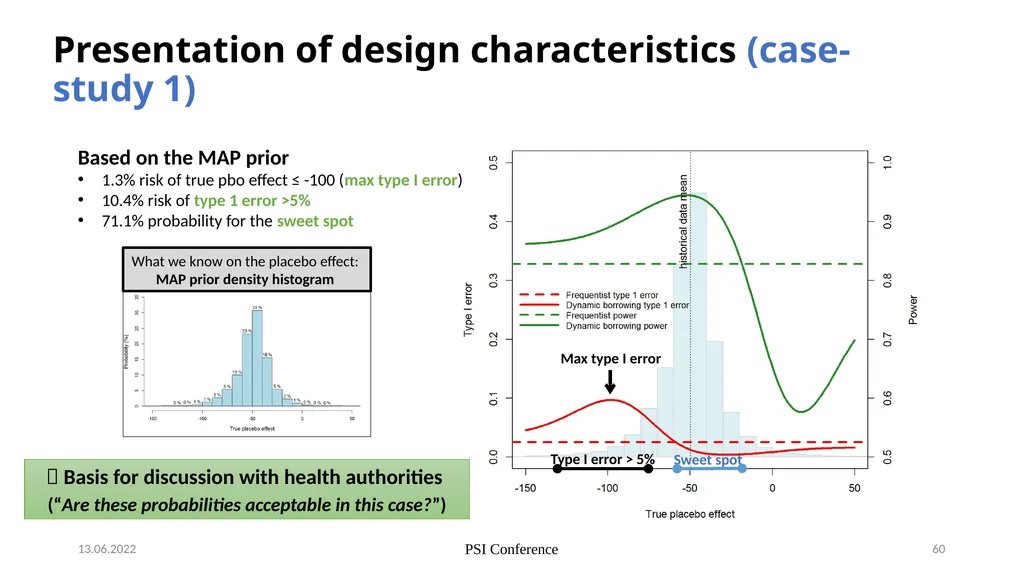
PSI Conference 60 Based on the MAP prior
1.3% risk of true pbo effect ≤ -100 (max type I error)
10.4% risk of type 1 error >5%
71.1% probability for the sweet spot 13.06.2022 Sweet spot Type I error > 5% What we know on the placebo effect:
MAP prior density histogram Basis for discussion with health authorities
(“Are these probabilities acceptable in this case?”) Max type I error Presentation of design characteristics (case-study 1)<br>
1.3% risk of true pbo effect ≤ -100 (max type I error)
10.4% risk of type 1 error >5%
71.1% probability for the sweet spot 13.06.2022 Sweet spot Type I error > 5% What we know on the placebo effect:
MAP prior density histogram Basis for discussion with health authorities
(“Are these probabilities acceptable in this case?”) Max type I error Presentation of design characteristics (case-study 1)<br>
61
Focus on Type I error metrics (case-study 1) PSI Conference 61 13.06.2022 Type 1 error given no drift Max type I error Discussion with health authorities to agree what scenarios are possible
Summarises the risk of making an incorrect decision in favour of treatment benefit Averaged over plausible distributions Power given no drift<br>
Summarises the risk of making an incorrect decision in favour of treatment benefit Averaged over plausible distributions Power given no drift<br>
62
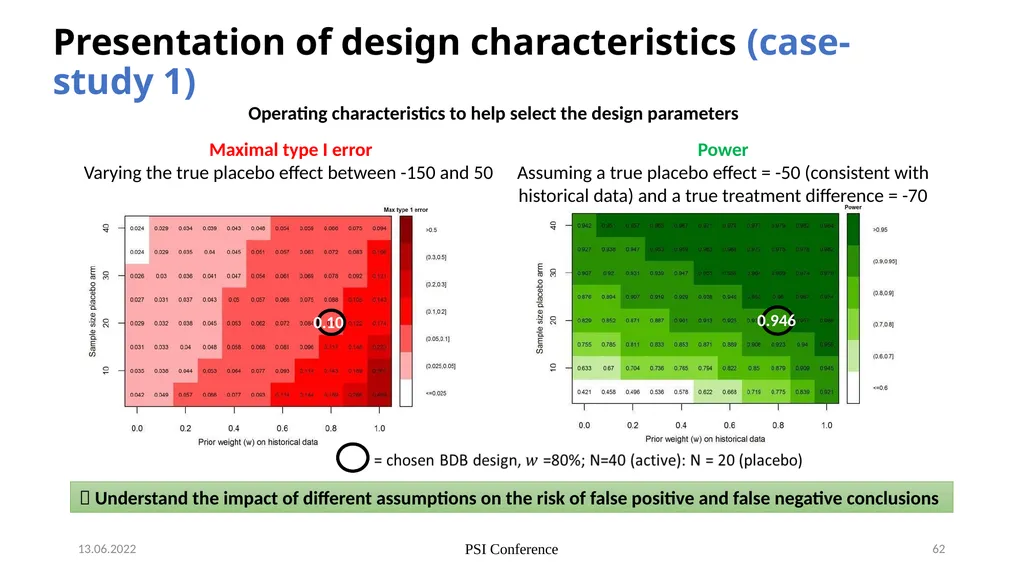
13.06.2022 PSI Conference 62 Maximal type I error
Varying the true placebo effect between -150 and 50 Power
Assuming a true placebo effect = -50 (consistent with historical data) and a true treatment difference = -70 Understand the impact of different assumptions on the risk of false positive and false negative conclusions 0.10 0.946 Operating characteristics to help select the design parameters Presentation of design characteristics (case-study 1)<br>
Varying the true placebo effect between -150 and 50 Power
Assuming a true placebo effect = -50 (consistent with historical data) and a true treatment difference = -70 Understand the impact of different assumptions on the risk of false positive and false negative conclusions 0.10 0.946 Operating characteristics to help select the design parameters Presentation of design characteristics (case-study 1)<br>
63
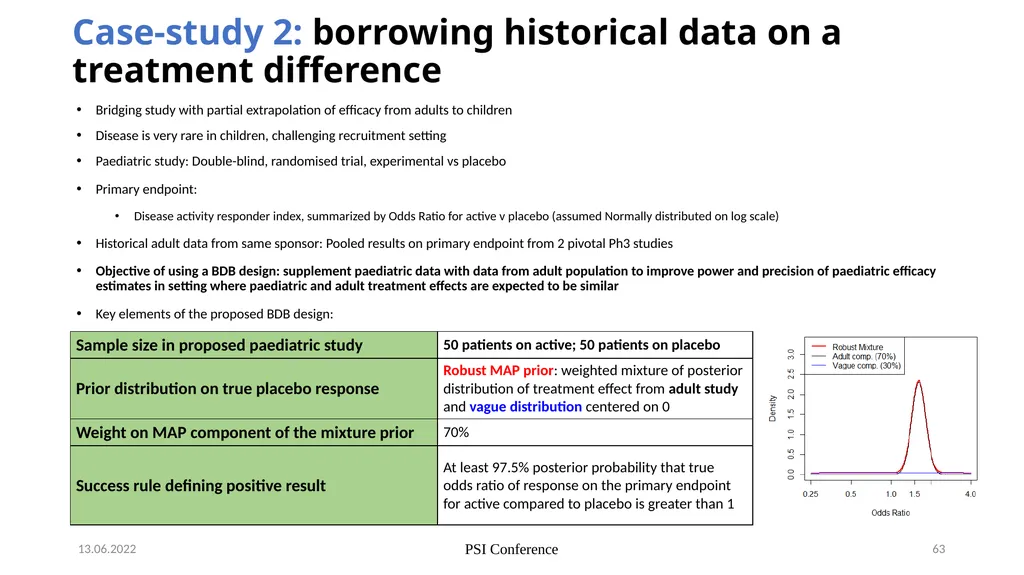
Bridging study with partial extrapolation of efficacy from adults to children
Disease is very rare in children, challenging recruitment setting
Paediatric study: Double-blind, randomised trial, experimental vs placebo
Primary endpoint:
Disease activity responder index, summarized by Odds Ratio for active v placebo (assumed Normally distributed on log scale)
Historical adult data from same sponsor: Pooled results on primary endpoint from 2 pivotal Ph3 studies
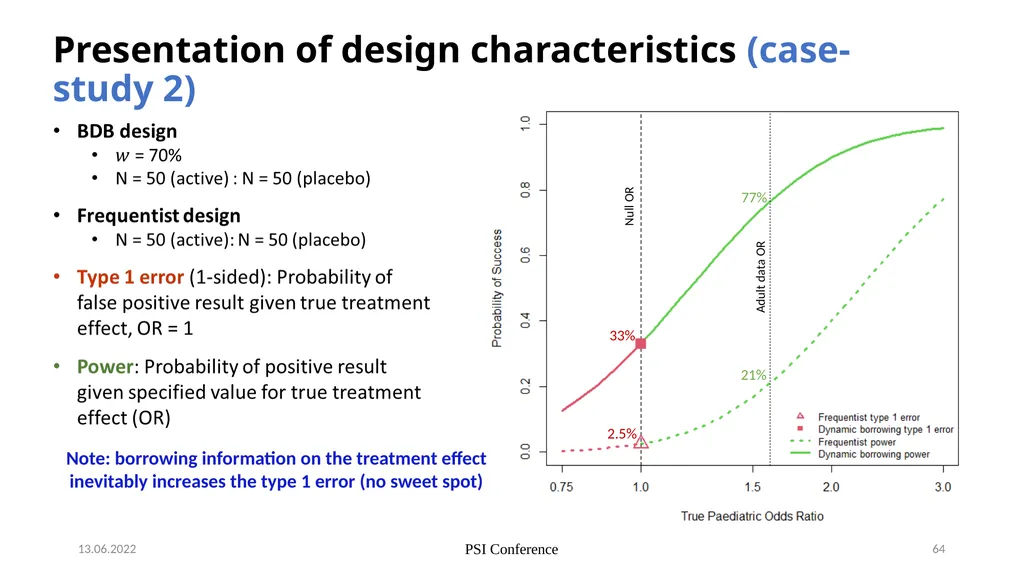
Objective of using a BDB design: supplement paediatric data with data from adult population to improve power and precision of paediatric efficacy estimates in setting where paediatric and adult treatment effects are expected to be similar
Key elements of the proposed BDB design: Case-study 2: borrowing historical data on a treatment difference PSI Conference 63 13.06.2022<br>
Disease is very rare in children, challenging recruitment setting
Paediatric study: Double-blind, randomised trial, experimental vs placebo
Primary endpoint:
Disease activity responder index, summarized by Odds Ratio for active v placebo (assumed Normally distributed on log scale)
Historical adult data from same sponsor: Pooled results on primary endpoint from 2 pivotal Ph3 studies
Objective of using a BDB design: supplement paediatric data with data from adult population to improve power and precision of paediatric efficacy estimates in setting where paediatric and adult treatment effects are expected to be similar
Key elements of the proposed BDB design: Case-study 2: borrowing historical data on a treatment difference PSI Conference 63 13.06.2022<br>
64
PSI Conference 64 13.06.2022 Adult data OR 2.5% 33% 77% 21% Null OR Presentation of design characteristics (case-study 2) Note: borrowing information on the treatment effect inevitably increases the type 1 error (no sweet spot)<br>
65
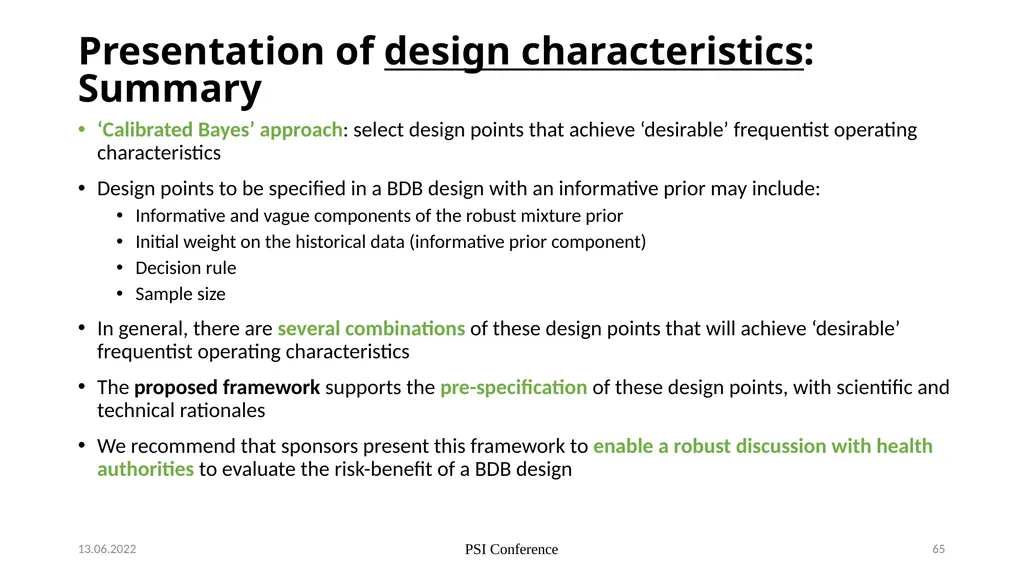
Presentation of design characteristics: Summary ‘Calibrated Bayes’ approach: select design points that achieve ‘desirable’ frequentist operating characteristics
Design points to be specified in a BDB design with an informative prior may include:
Informative and vague components of the robust mixture prior
Initial weight on the historical data (informative prior component)
Decision rule
Sample size
In general, there are several combinations of these design points that will achieve ‘desirable’ frequentist operating characteristics
The proposed framework supports the pre-specification of these design points, with scientific and technical rationales
We recommend that sponsors present this framework to enable a robust discussion with health authorities to evaluate the risk-benefit of a BDB design 13.06.2022 PSI Conference 65<br>
Design points to be specified in a BDB design with an informative prior may include:
Informative and vague components of the robust mixture prior
Initial weight on the historical data (informative prior component)
Decision rule
Sample size
In general, there are several combinations of these design points that will achieve ‘desirable’ frequentist operating characteristics
The proposed framework supports the pre-specification of these design points, with scientific and technical rationales
We recommend that sponsors present this framework to enable a robust discussion with health authorities to evaluate the risk-benefit of a BDB design 13.06.2022 PSI Conference 65<br>
66
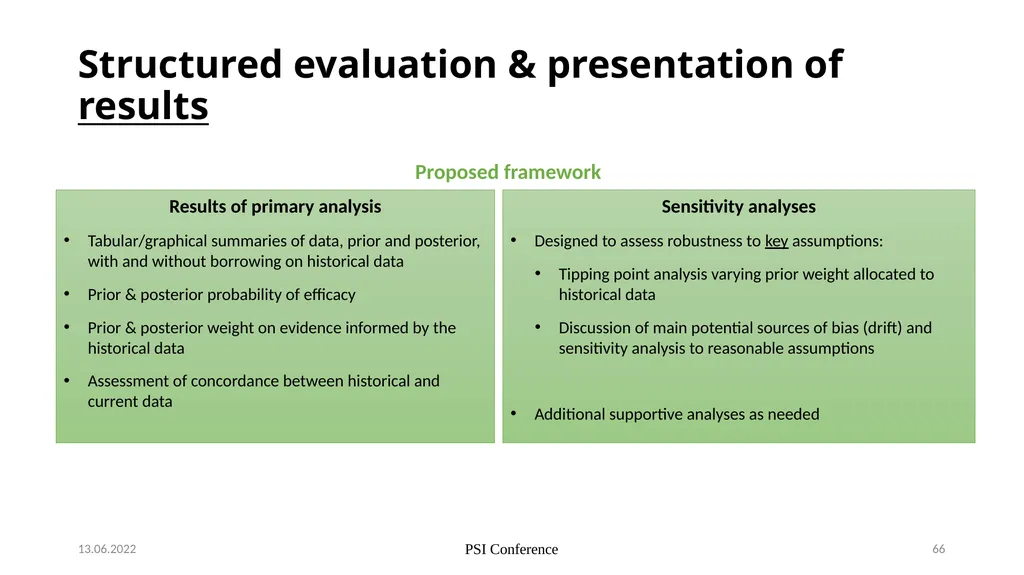
Structured evaluation & presentation of results PSI Conference 66 13.06.2022 Results of primary analysis
Tabular/graphical summaries of data, prior and posterior, with and without borrowing on historical data
Prior & posterior probability of efficacy
Prior & posterior weight on evidence informed by the historical data
Assessment of concordance between historical and current data Proposed framework Sensitivity analyses
Designed to assess robustness to key assumptions:
Tipping point analysis varying prior weight allocated to historical data
Discussion of main potential sources of bias (drift) and sensitivity analysis to reasonable assumptions
Additional supportive analyses as needed<br>
Tabular/graphical summaries of data, prior and posterior, with and without borrowing on historical data
Prior & posterior probability of efficacy
Prior & posterior weight on evidence informed by the historical data
Assessment of concordance between historical and current data Proposed framework Sensitivity analyses
Designed to assess robustness to key assumptions:
Tipping point analysis varying prior weight allocated to historical data
Discussion of main potential sources of bias (drift) and sensitivity analysis to reasonable assumptions
Additional supportive analyses as needed<br>
67
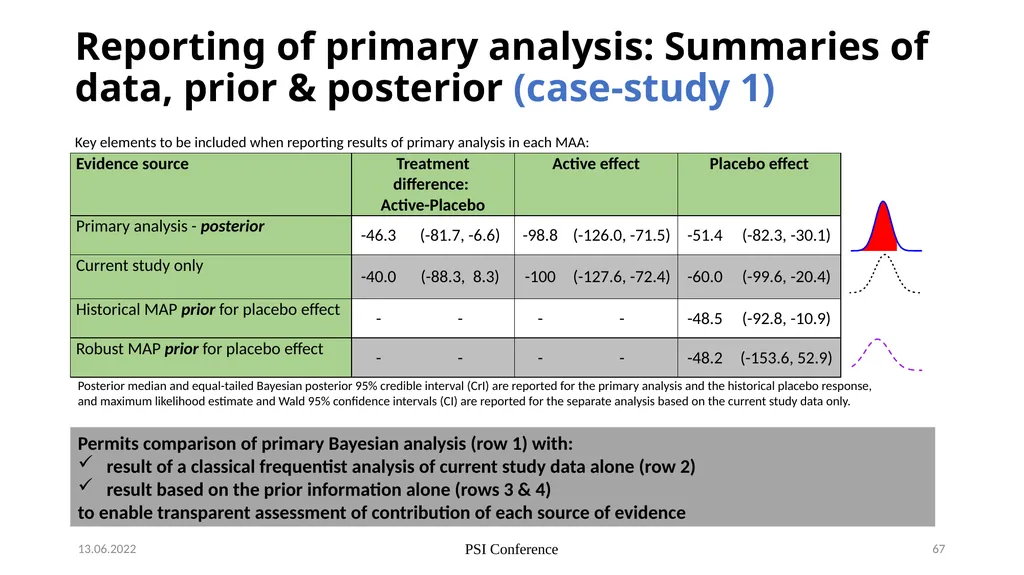
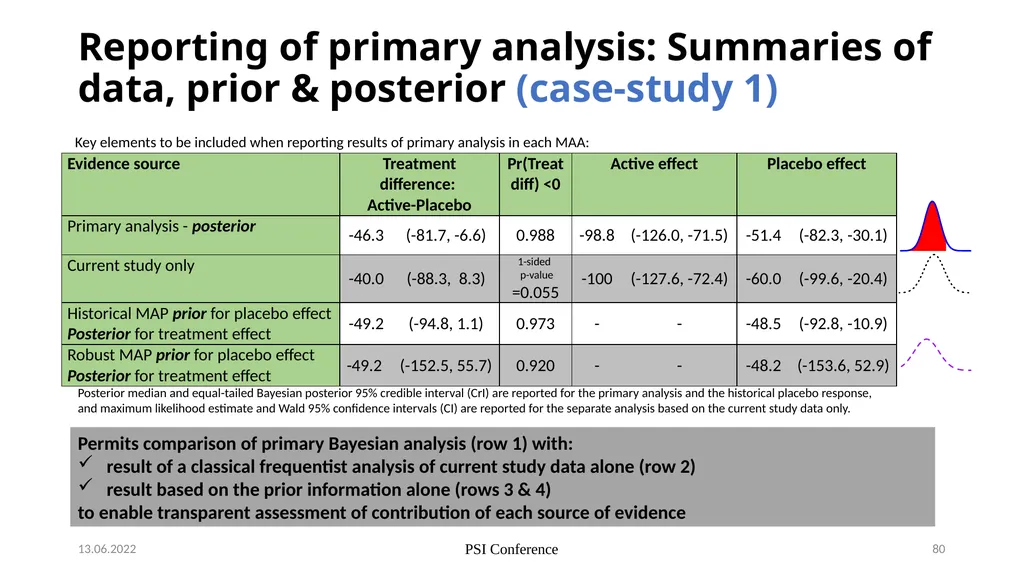
Reporting of primary analysis: Summaries of data, prior & posterior (case-study 1) 13.06.2022 PSI Conference 67 Posterior median and equal-tailed Bayesian posterior 95% credible interval (CrI) are reported for the primary analysis and the historical placebo response, and maximum likelihood estimate and Wald 95% confidence intervals (CI) are reported for the separate analysis based on the current study data only. Permits comparison of primary Bayesian analysis (row 1) with:
result of a classical frequentist analysis of current study data alone (row 2)
result based on the prior information alone (rows 3 & 4)
to enable transparent assessment of contribution of each source of evidence Key elements to be included when reporting results of primary analysis in each MAA:<br>
result of a classical frequentist analysis of current study data alone (row 2)
result based on the prior information alone (rows 3 & 4)
to enable transparent assessment of contribution of each source of evidence Key elements to be included when reporting results of primary analysis in each MAA:<br>
68
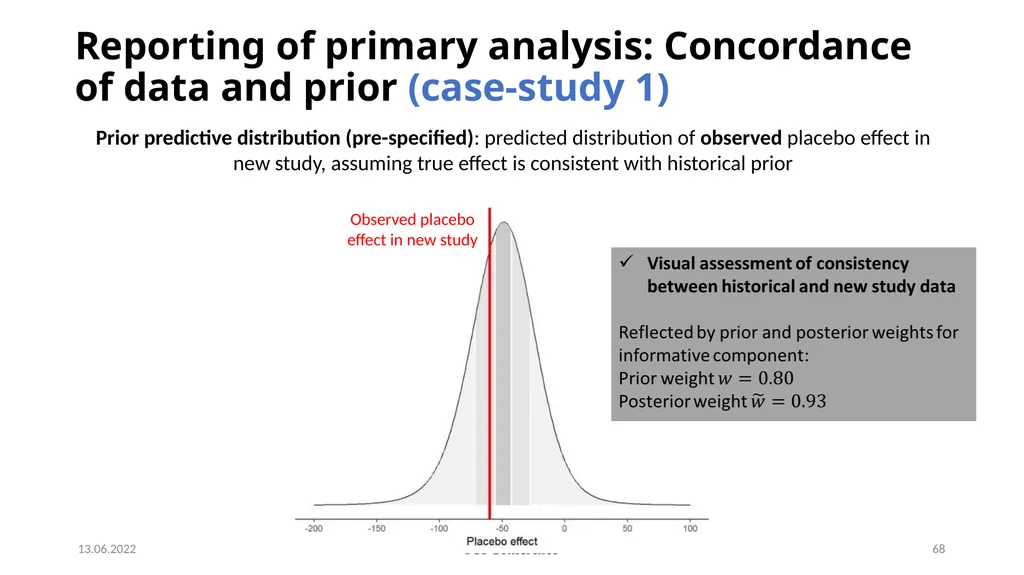
Reporting of primary analysis: Concordance of data and prior (case-study 1) 13.06.2022 PSI Conference 68 Prior predictive distribution (pre-specified): predicted distribution of observed placebo effect in new study, assuming true effect is consistent with historical prior Observed placebo effect in new study<br>
69
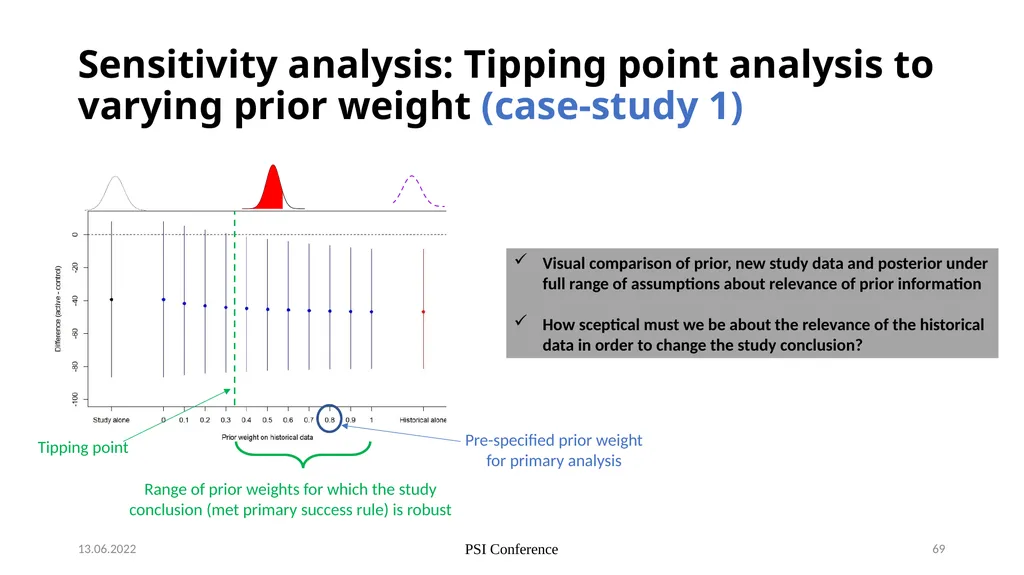
13.06.2022 PSI Conference 69 Sensitivity analysis: Tipping point analysis to varying prior weight (case-study 1) Tipping point Visual comparison of prior, new study data and posterior under full range of assumptions about relevance of prior information
How sceptical must we be about the relevance of the historical data in order to change the study conclusion? Range of prior weights for which the study conclusion (met primary success rule) is robust Pre-specified prior weight for primary analysis<br>
How sceptical must we be about the relevance of the historical data in order to change the study conclusion? Range of prior weights for which the study conclusion (met primary success rule) is robust Pre-specified prior weight for primary analysis<br>
70
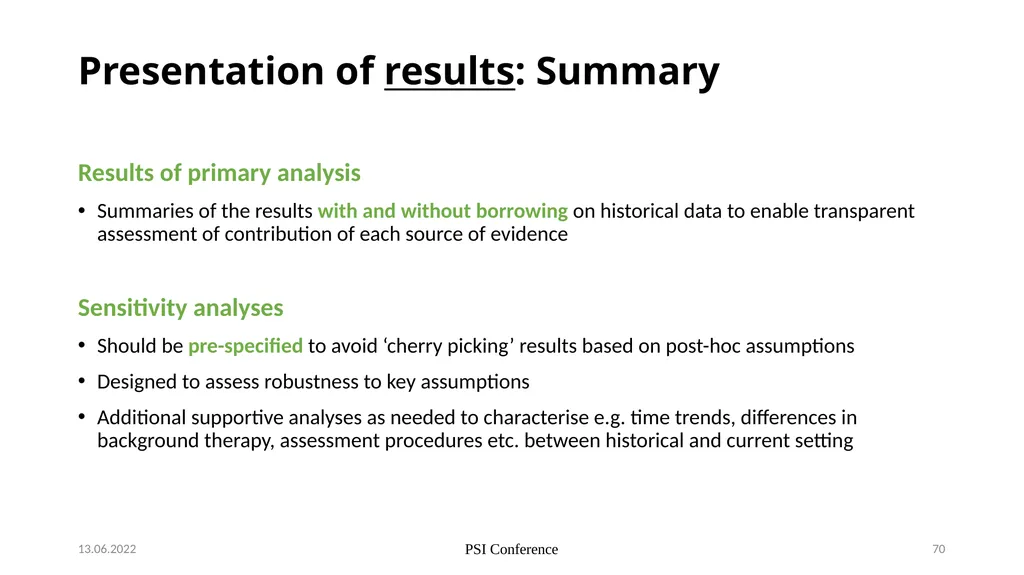
Presentation of results: Summary Results of primary analysis
Summaries of the results with and without borrowing on historical data to enable transparent assessment of contribution of each source of evidence
Sensitivity analyses
Should be pre-specified to avoid ‘cherry picking’ results based on post-hoc assumptions
Designed to assess robustness to key assumptions
Additional supportive analyses as needed to characterise e.g. time trends, differences in background therapy, assessment procedures etc. between historical and current setting 13.06.2022 PSI Conference 70<br>
Summaries of the results with and without borrowing on historical data to enable transparent assessment of contribution of each source of evidence
Sensitivity analyses
Should be pre-specified to avoid ‘cherry picking’ results based on post-hoc assumptions
Designed to assess robustness to key assumptions
Additional supportive analyses as needed to characterise e.g. time trends, differences in background therapy, assessment procedures etc. between historical and current setting 13.06.2022 PSI Conference 70<br>
71
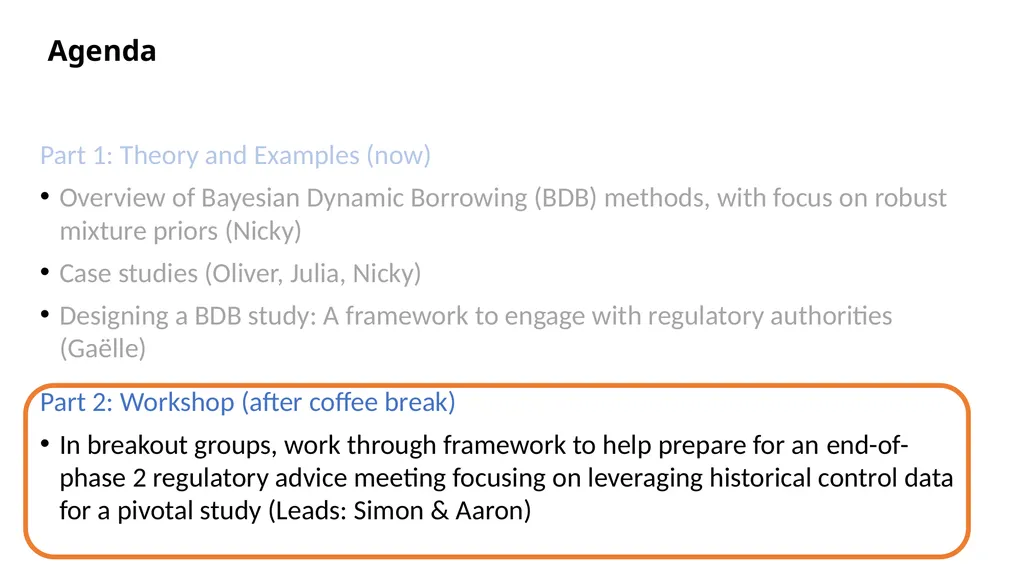
Part 1: Theory and Examples (now)
Overview of Bayesian Dynamic Borrowing (BDB) methods, with focus on robust mixture priors (Nicky)
Case studies (Oliver, Julia, Nicky)
Designing a BDB study: A framework to engage with regulatory authorities (Gaëlle)
Part 2: Workshop (after coffee break)
In breakout groups, work through framework to help prepare for an end-of-phase 2 regulatory advice meeting focusing on leveraging historical control data for a pivotal study (Leads: Simon & Aaron) Agenda<br>
Overview of Bayesian Dynamic Borrowing (BDB) methods, with focus on robust mixture priors (Nicky)
Case studies (Oliver, Julia, Nicky)
Designing a BDB study: A framework to engage with regulatory authorities (Gaëlle)
Part 2: Workshop (after coffee break)
In breakout groups, work through framework to help prepare for an end-of-phase 2 regulatory advice meeting focusing on leveraging historical control data for a pivotal study (Leads: Simon & Aaron) Agenda<br>
72
Back-up 13.06.2022 PSI Conference 72<br>
73
Tipping point Bayesian dynamic mixture prior analysis of Benlysta paediatric study<br>
74
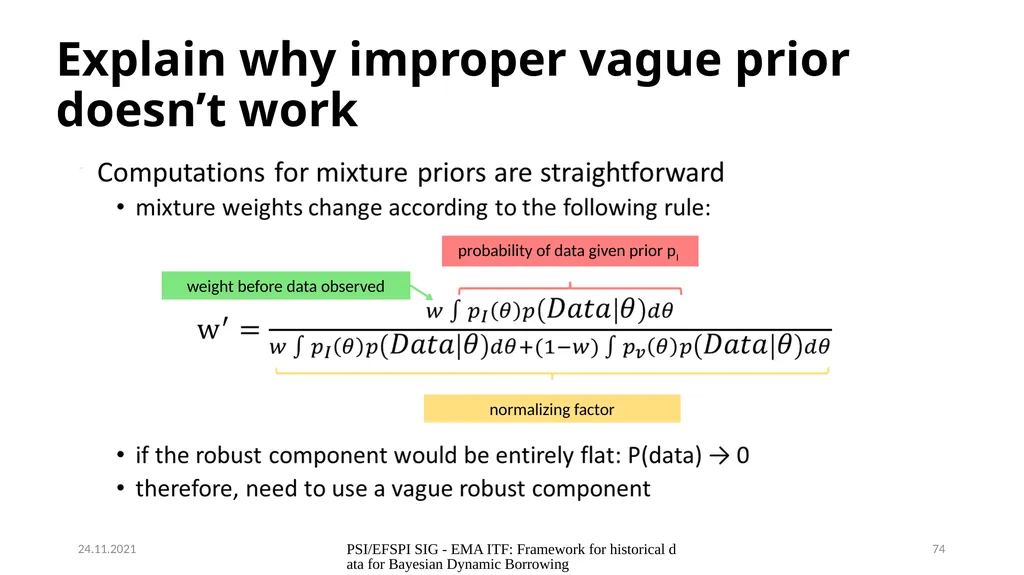
Explain why improper vague prior doesn’t work PSI/EFSPI SIG - EMA ITF: Framework for historical data for Bayesian Dynamic Borrowing 74 24.11.2021 weight before data observed probability of data given prior pI normalizing factor<br>
75
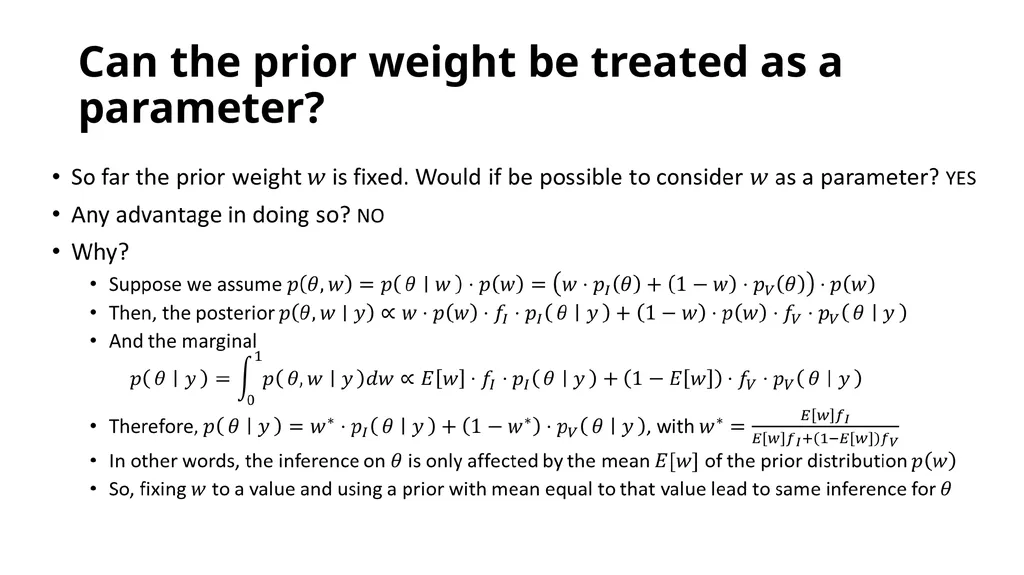
Can the prior weight be treated as a parameter?<br>
76
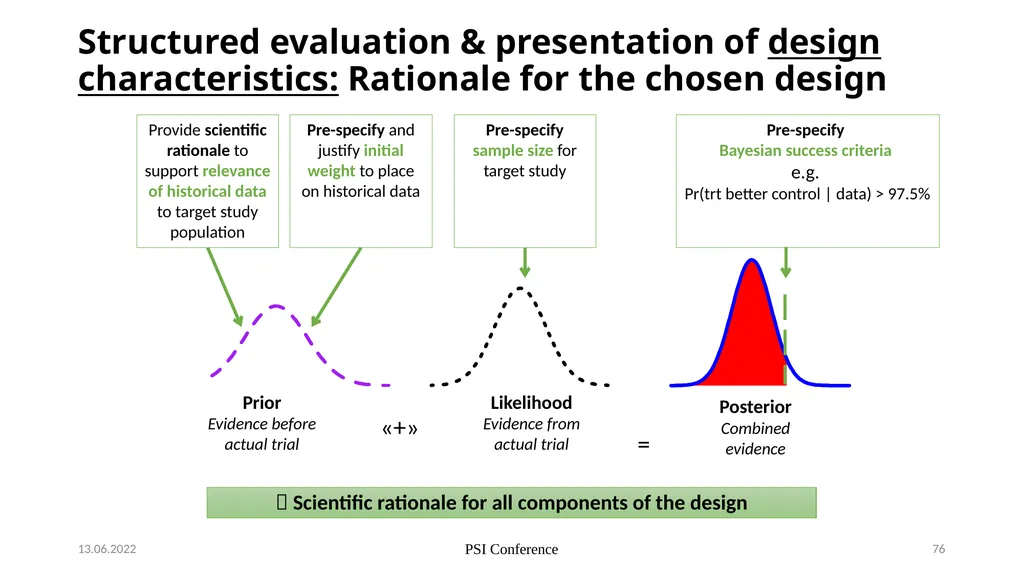
Structured evaluation & presentation of design characteristics: Rationale for the chosen design PSI Conference 76 Scientific rationale for all components of the design Prior
Evidence before actual trial Likelihood
Evidence from actual trial Posterior
Combined evidence «+» = Provide scientific rationale to support relevance of historical data to target study population Pre-specify and justify initial weight to place on historical data Pre-specify
Bayesian success criteria
e.g.
Pr(trt better control | data) > 97.5% Pre-specify sample size for target study 13.06.2022<br>
Evidence before actual trial Likelihood
Evidence from actual trial Posterior
Combined evidence «+» = Provide scientific rationale to support relevance of historical data to target study population Pre-specify and justify initial weight to place on historical data Pre-specify
Bayesian success criteria
e.g.
Pr(trt better control | data) > 97.5% Pre-specify sample size for target study 13.06.2022<br>
77
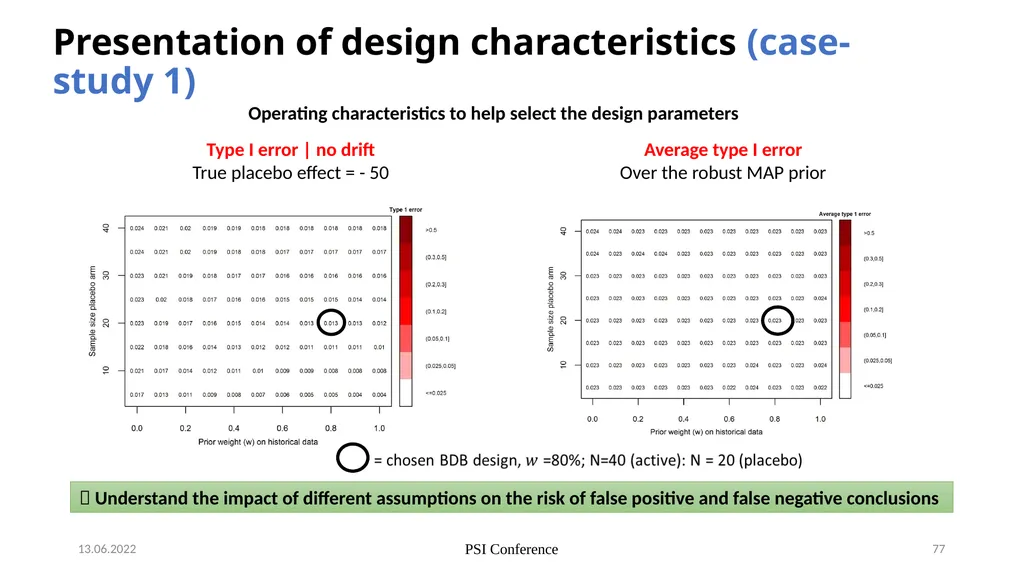
13.06.2022 PSI Conference 77 Type I error | no drift
True placebo effect = - 50 Average type I error
Over the robust MAP prior Understand the impact of different assumptions on the risk of false positive and false negative conclusions Operating characteristics to help select the design parameters Presentation of design characteristics (case-study 1)<br>
True placebo effect = - 50 Average type I error
Over the robust MAP prior Understand the impact of different assumptions on the risk of false positive and false negative conclusions Operating characteristics to help select the design parameters Presentation of design characteristics (case-study 1)<br>
78
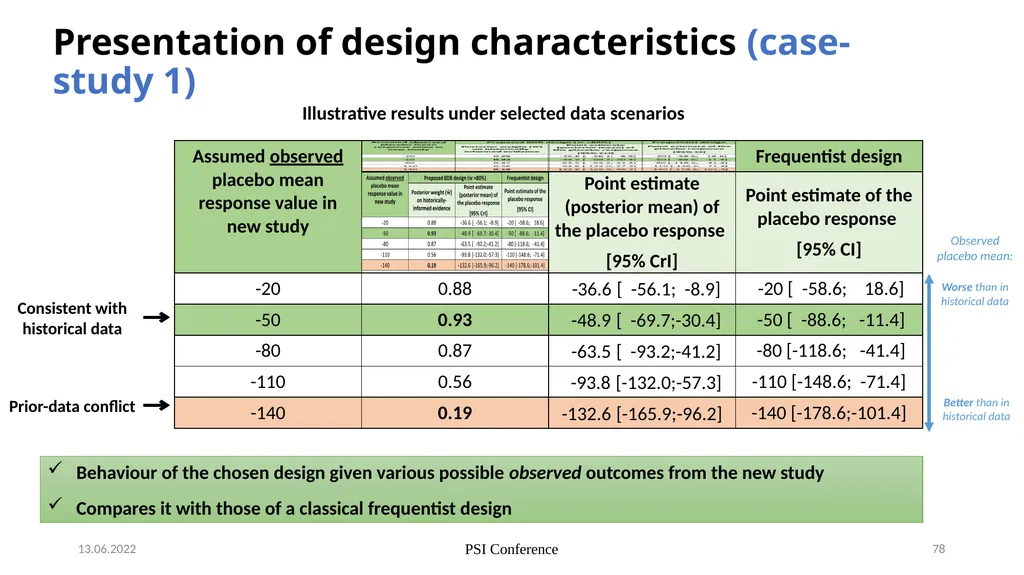
13.06.2022 PSI Conference 78 Consistent with historical data Prior-data conflict Behaviour of the chosen design given various possible observed outcomes from the new study
Compares it with those of a classical frequentist design Worse than in historical data Observed placebo mean: Better than in historical data Presentation of design characteristics (case-study 1) Illustrative results under selected data scenarios<br>
Compares it with those of a classical frequentist design Worse than in historical data Observed placebo mean: Better than in historical data Presentation of design characteristics (case-study 1) Illustrative results under selected data scenarios<br>
79
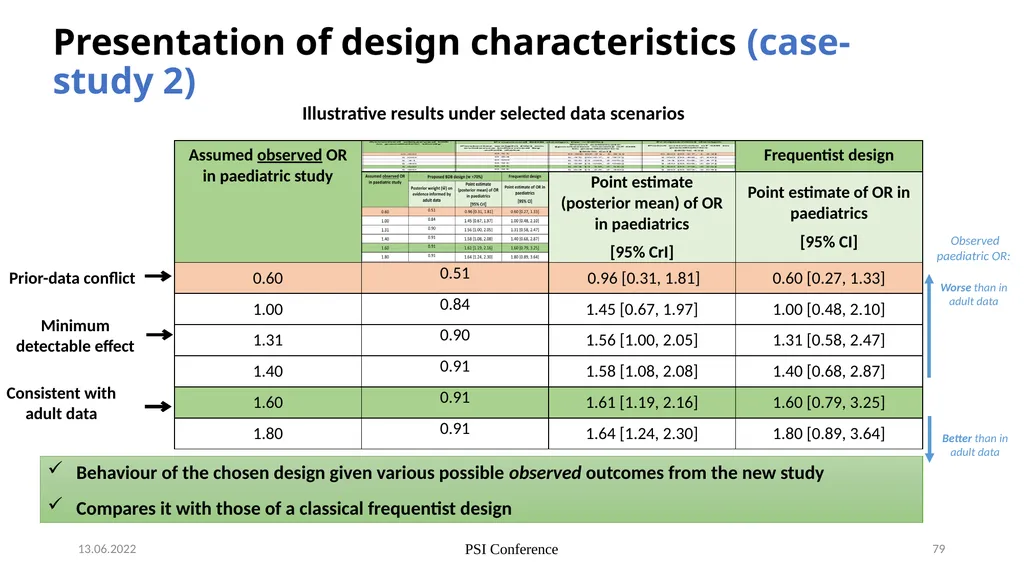
13.06.2022 PSI Conference 79 Consistent with adult data Prior-data conflict Behaviour of the chosen design given various possible observed outcomes from the new study
Compares it with those of a classical frequentist design Worse than in adult data Observed paediatric OR: Better than in adult data Minimum detectable effect Presentation of design characteristics (case-study 2) Illustrative results under selected data scenarios<br>
Compares it with those of a classical frequentist design Worse than in adult data Observed paediatric OR: Better than in adult data Minimum detectable effect Presentation of design characteristics (case-study 2) Illustrative results under selected data scenarios<br>
80
Reporting of primary analysis: Summaries of data, prior & posterior (case-study 1) 13.06.2022 PSI Conference 80 Posterior median and equal-tailed Bayesian posterior 95% credible interval (CrI) are reported for the primary analysis and the historical placebo response, and maximum likelihood estimate and Wald 95% confidence intervals (CI) are reported for the separate analysis based on the current study data only. Permits comparison of primary Bayesian analysis (row 1) with:
result of a classical frequentist analysis of current study data alone (row 2)
result based on the prior information alone (rows 3 & 4)
to enable transparent assessment of contribution of each source of evidence Key elements to be included when reporting results of primary analysis in each MAA:<br>
result of a classical frequentist analysis of current study data alone (row 2)
result based on the prior information alone (rows 3 & 4)
to enable transparent assessment of contribution of each source of evidence Key elements to be included when reporting results of primary analysis in each MAA:<br>
81
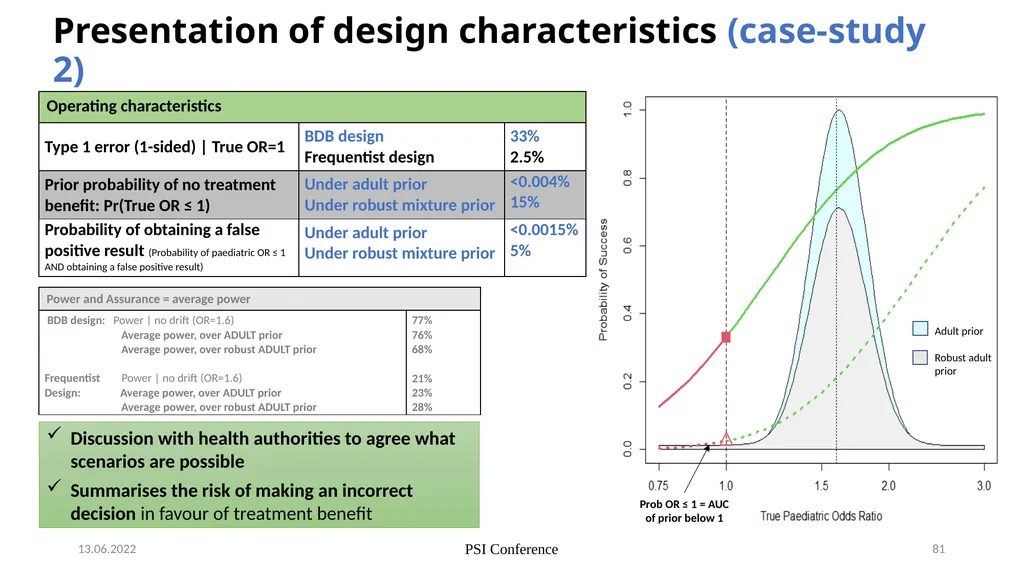
PSI Conference 81 13.06.2022 Discussion with health authorities to agree what scenarios are possible
Summarises the risk of making an incorrect decision in favour of treatment benefit Prob OR ≤ 1 = AUC of prior below 1 Adult prior
Robust adult prior Presentation of design characteristics (case-study 2)<br>
Summarises the risk of making an incorrect decision in favour of treatment benefit Prob OR ≤ 1 = AUC of prior below 1 Adult prior
Robust adult prior Presentation of design characteristics (case-study 2)<br>
82
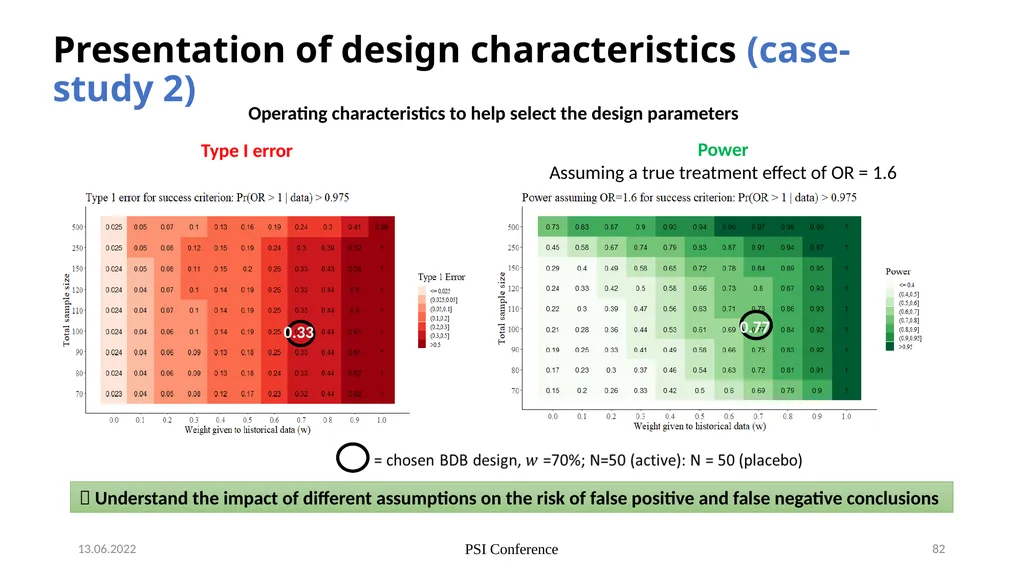
13.06.2022 PSI Conference 82 Type I error Power
Assuming a true treatment effect of OR = 1.6 Understand the impact of different assumptions on the risk of false positive and false negative conclusions 0.33 0.77 Presentation of design characteristics (case-study 2) Operating characteristics to help select the design parameters<br>
Assuming a true treatment effect of OR = 1.6 Understand the impact of different assumptions on the risk of false positive and false negative conclusions 0.33 0.77 Presentation of design characteristics (case-study 2) Operating characteristics to help select the design parameters<br>
83
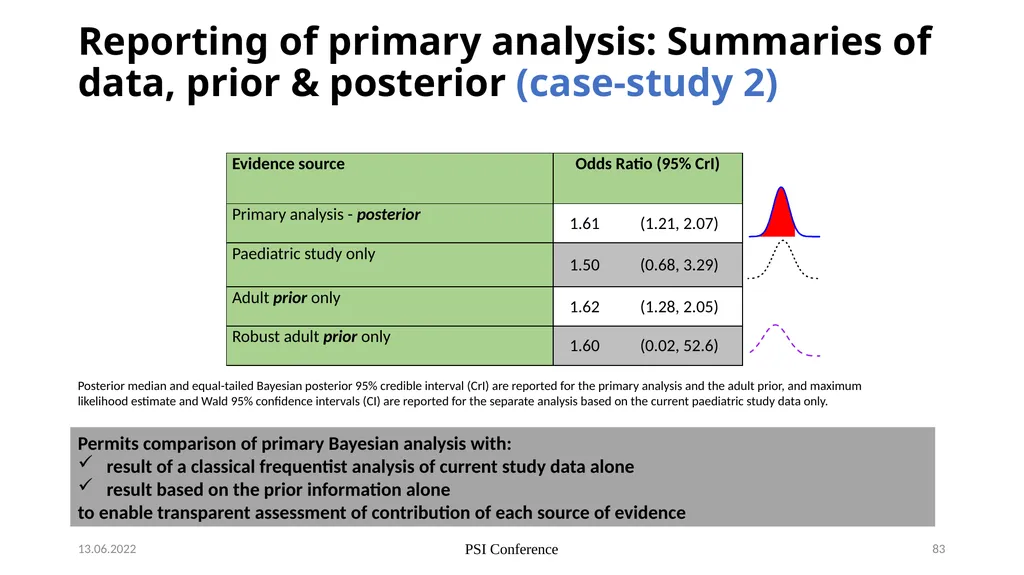
Reporting of primary analysis: Summaries of data, prior & posterior (case-study 2) 13.06.2022 PSI Conference 83 Posterior median and equal-tailed Bayesian posterior 95% credible interval (CrI) are reported for the primary analysis and the adult prior, and maximum likelihood estimate and Wald 95% confidence intervals (CI) are reported for the separate analysis based on the current paediatric study data only. Permits comparison of primary Bayesian analysis with:
result of a classical frequentist analysis of current study data alone
result based on the prior information alone
to enable transparent assessment of contribution of each source of evidence<br>
result of a classical frequentist analysis of current study data alone
result based on the prior information alone
to enable transparent assessment of contribution of each source of evidence<br>
84
13.06.2022 PSI Conference 84 Sensitivity analysis: Tipping point analysis to varying prior weight (case-study 2) Tipping point Visual comparison of prior, new study data and posterior under full range of assumptions about relevance of prior information
How sceptical must we be about the relevance of the historical data in order to change the study conclusion? Range of prior weights for which the study conclusion (met primary success rule) is robust Pre-specified prior weight for primary analysis<br>
How sceptical must we be about the relevance of the historical data in order to change the study conclusion? Range of prior weights for which the study conclusion (met primary success rule) is robust Pre-specified prior weight for primary analysis<br>