
Nigeria HPN Multi-Activity Evaluation Ebonyi
A
Published · 100 slides · 0 views

1 / 1










Description
Nigeria HPN Multi-Activity Evaluation Ebonyi Results Review Meeting July 21, 2022 Meeting objectives 01 Share highlights from the Ebonyi state findings of the Nigeria health, population, and nutrition (HPN) multi-activity evaluation. 02
Related Topics
Share
Embed code
Download this presentation From Below
"Nigeria HPN Multi-Activity Evaluation Ebonyi" is the property of its rightful owner. Permission is granted to download and print the materials on this website for personal, non-commercial use only, and to display it on your personal computer provided you do not modify the materials and that you retain all copyright notices contained in the materials. By downloading content from our website, you accept the terms of this agreement.
Presentation Transcript
01
Nigeria HPN Multi-Activity Evaluation
Ebonyi Results Review Meeting July 21, 2022<br>
02
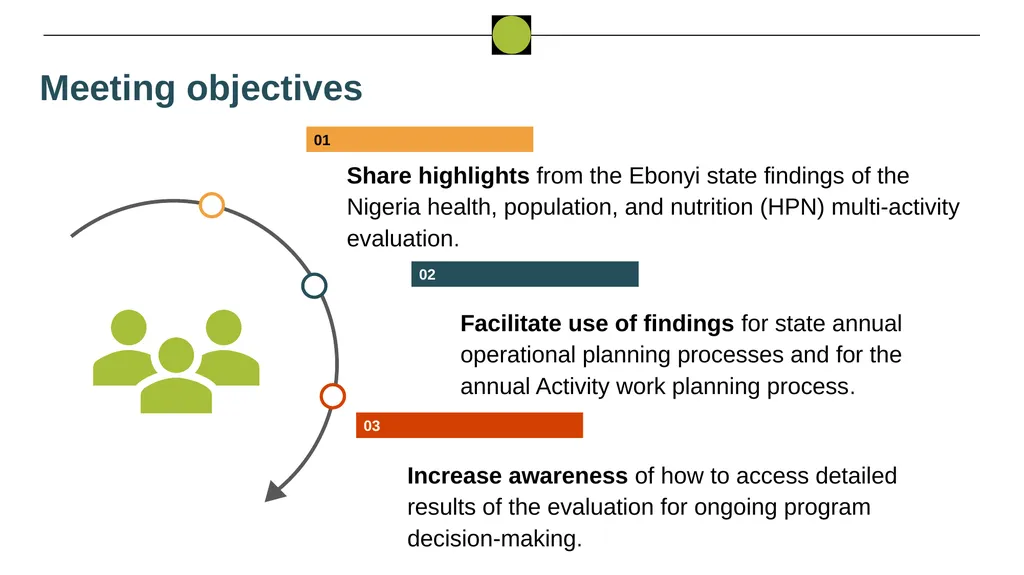
Meeting objectives 01 Share highlights from the Ebonyi state findings of the Nigeria health, population, and nutrition (HPN) multi-activity evaluation. 02 Facilitate use of findings for state annual operational planning processes and for the annual Activity work planning process. 03 Increase awareness of how to access detailed results of the evaluation for ongoing program decision-making.<br>
03
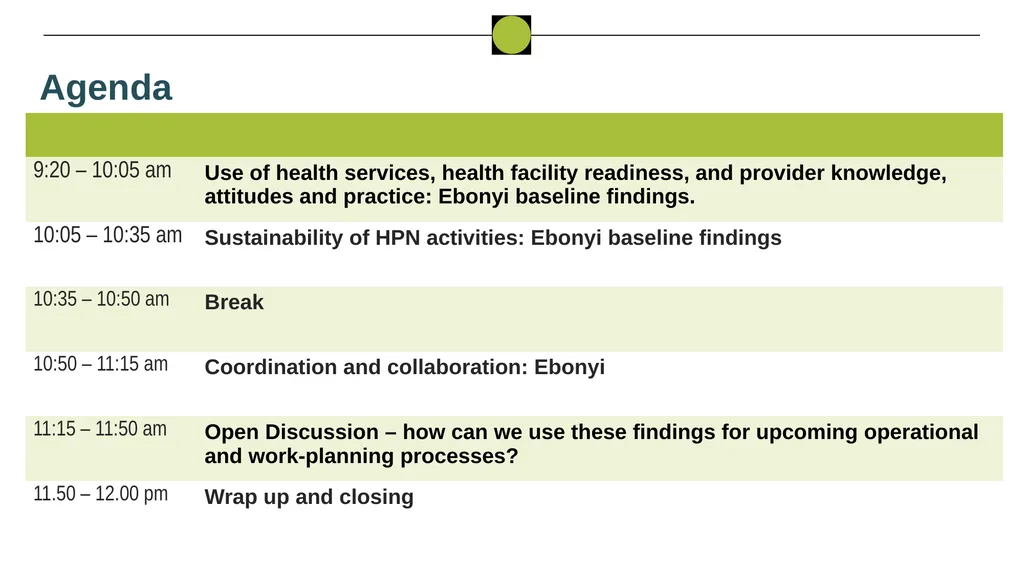
Agenda<br>
04
Use of health services, health facility readiness, and provider knowledge, attitudes and practice
Ebonyi baseline quantitative findings<br>
Ebonyi baseline quantitative findings<br>
05
Assessing the effectiveness of HPN Activities on the use of health services
Preliminary DHIS2 analysis<br>
Preliminary DHIS2 analysis<br>
06
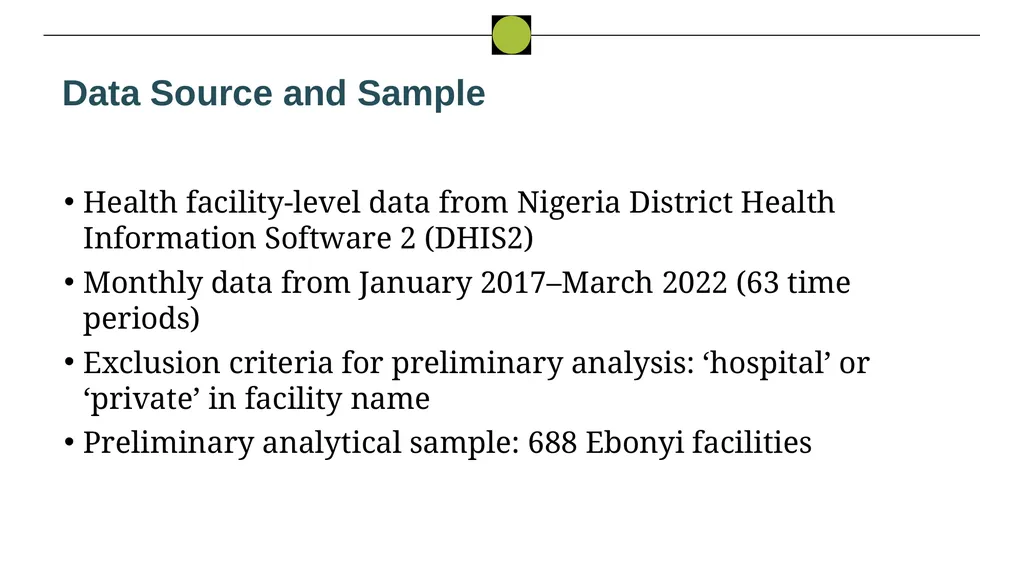
Data Source and Sample Health facility-level data from Nigeria District Health Information Software 2 (DHIS2)
Monthly data from January 2017–March 2022 (63 time periods)
Exclusion criteria for preliminary analysis: ‘hospital’ or ‘private’ in facility name
Preliminary analytical sample: 688 Ebonyi facilities<br>
Monthly data from January 2017–March 2022 (63 time periods)
Exclusion criteria for preliminary analysis: ‘hospital’ or ‘private’ in facility name
Preliminary analytical sample: 688 Ebonyi facilities<br>
07
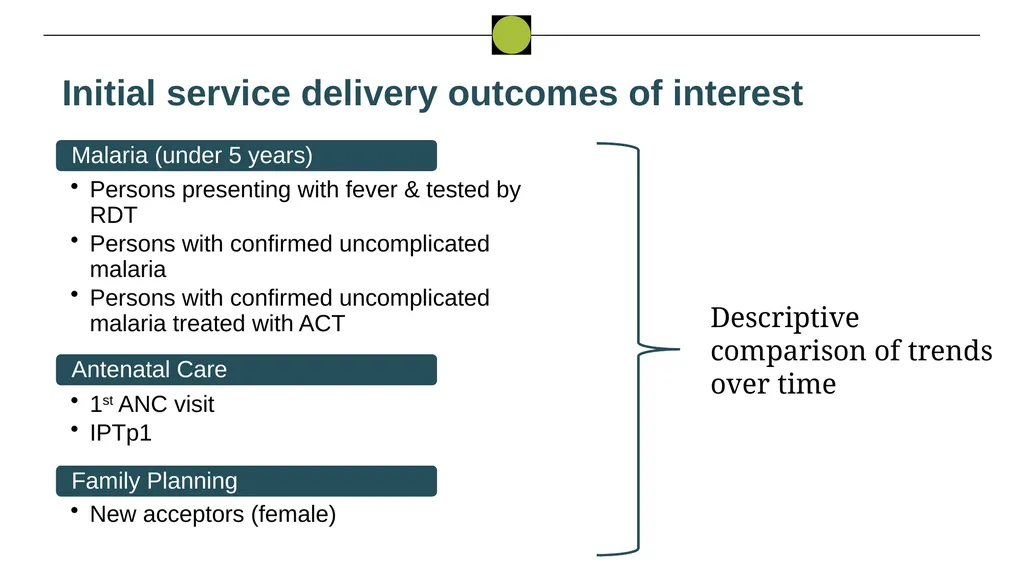
Initial service delivery outcomes of interest Malaria (under 5 years) Persons presenting with fever & tested by RDT
Persons with confirmed uncomplicated malaria
Persons with confirmed uncomplicated malaria treated with ACT Antenatal Care 1st ANC visit
IPTp1 Family Planning New acceptors (female) Descriptive comparison of trends over time<br>
Persons with confirmed uncomplicated malaria
Persons with confirmed uncomplicated malaria treated with ACT Antenatal Care 1st ANC visit
IPTp1 Family Planning New acceptors (female) Descriptive comparison of trends over time<br>
08
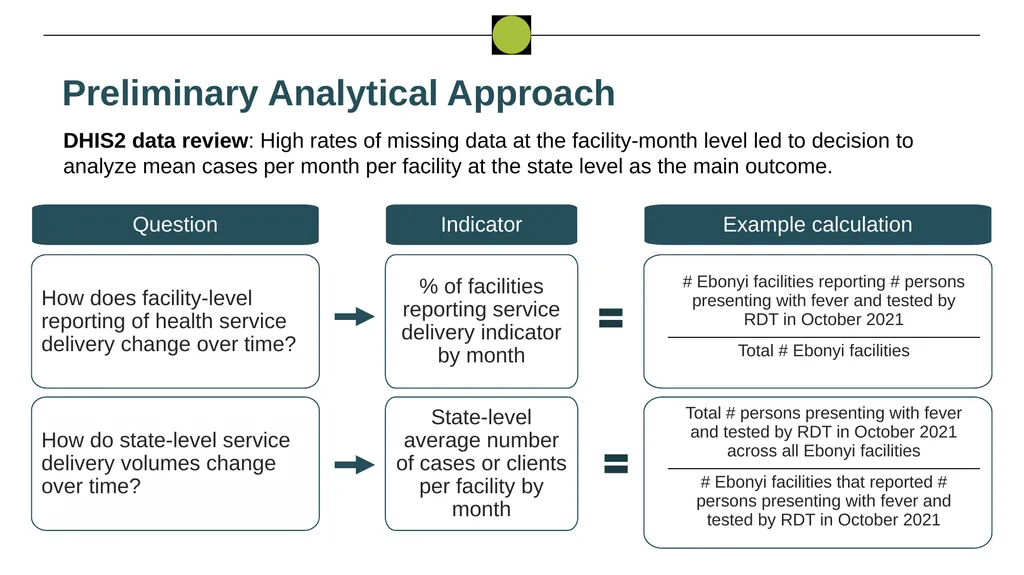
Preliminary Analytical Approach DHIS2 data review: High rates of missing data at the facility-month level led to decision to analyze mean cases per month per facility at the state level as the main outcome. Question How does facility-level reporting of health service delivery change over time? % of facilities reporting service delivery indicator by month How do state-level service delivery volumes change over time? Indicator State-level average number of cases or clients per facility by month Example calculation<br>
09
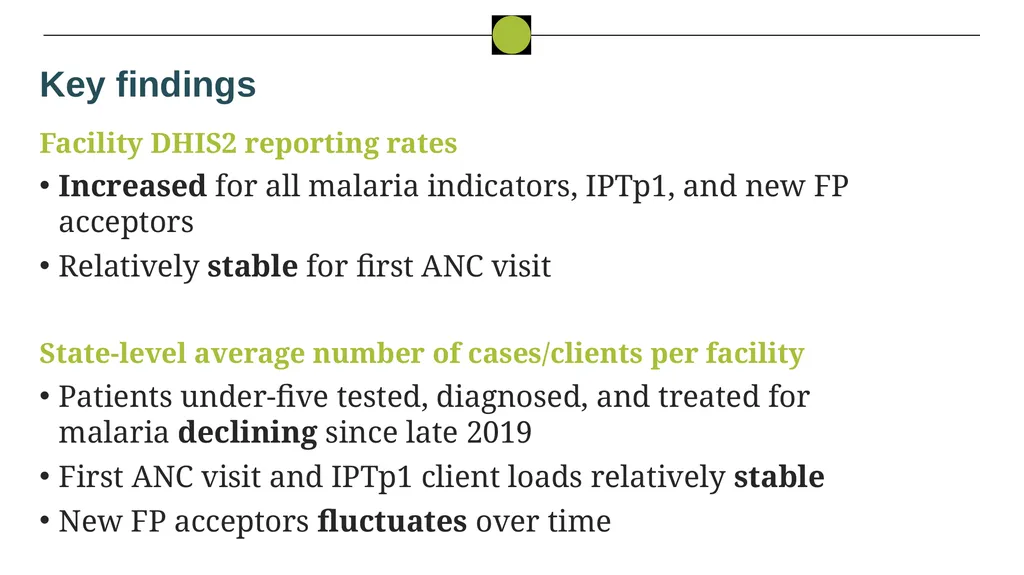
Key findings Facility DHIS2 reporting rates
Increased for all malaria indicators, IPTp1, and new FP acceptors
Relatively stable for first ANC visit
State-level average number of cases/clients per facility
Patients under-five tested, diagnosed, and treated for malaria declining since late 2019
First ANC visit and IPTp1 client loads relatively stable
New FP acceptors fluctuates over time<br>
Increased for all malaria indicators, IPTp1, and new FP acceptors
Relatively stable for first ANC visit
State-level average number of cases/clients per facility
Patients under-five tested, diagnosed, and treated for malaria declining since late 2019
First ANC visit and IPTp1 client loads relatively stable
New FP acceptors fluctuates over time<br>
10
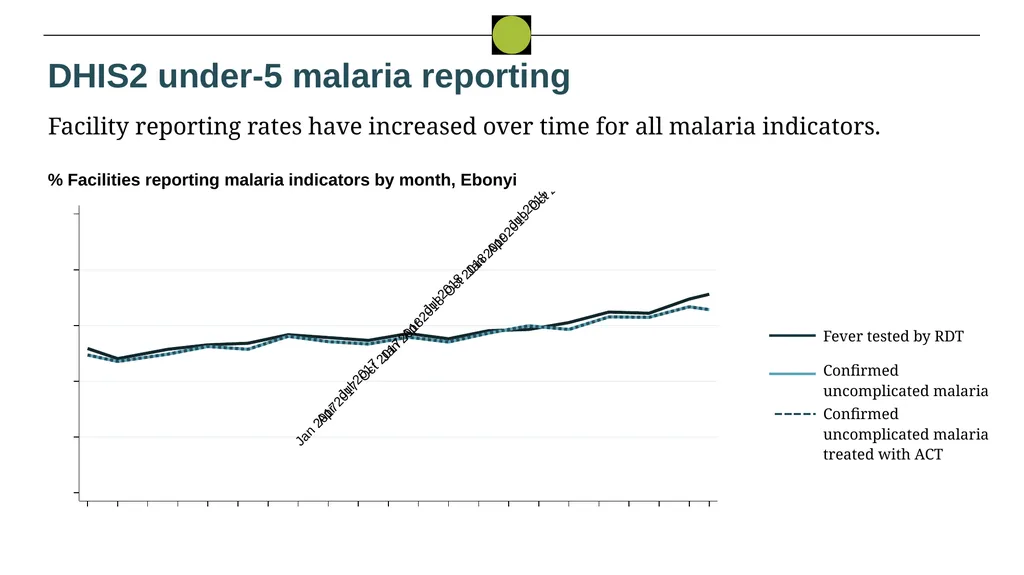
DHIS2 under-5 malaria reporting Facility reporting rates have increased over time for all malaria indicators. % Facilities reporting malaria indicators by month, Ebonyi<br>
11
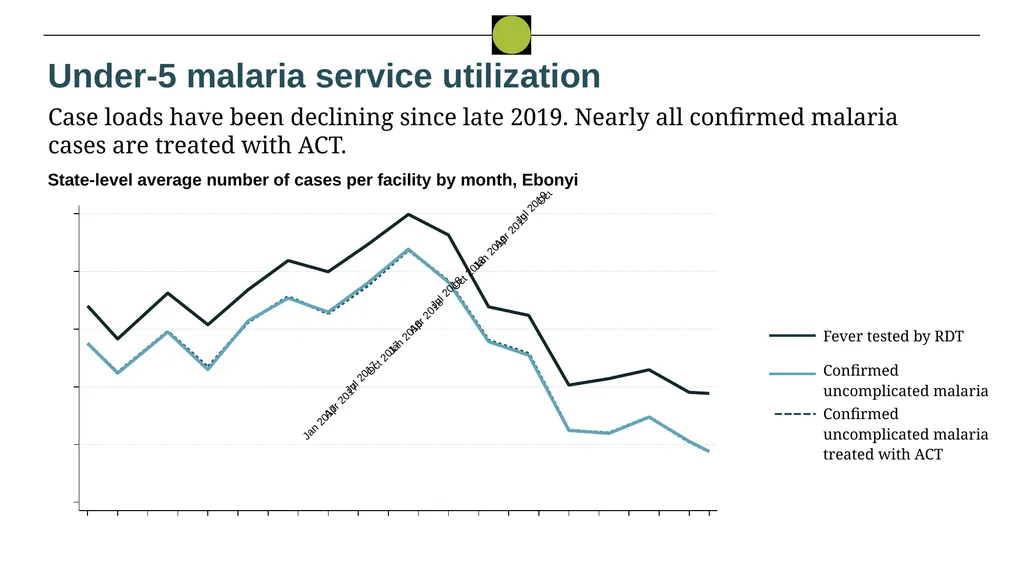
Under-5 malaria service utilization Case loads have been declining since late 2019. Nearly all confirmed malaria cases are treated with ACT. State-level average number of cases per facility by month, Ebonyi<br>
12
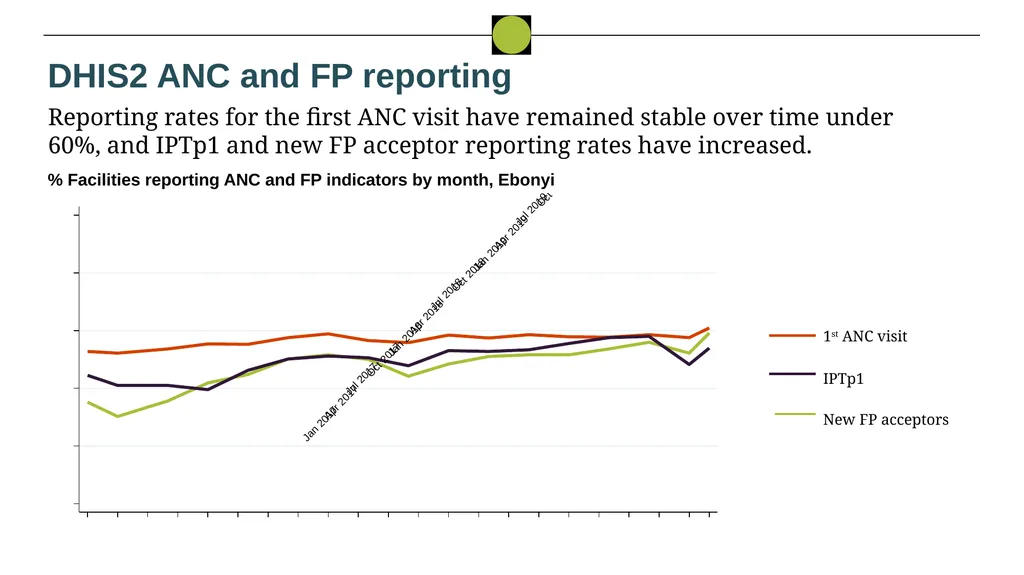
DHIS2 ANC and FP reporting Reporting rates for the first ANC visit have remained stable over time under 60%, and IPTp1 and new FP acceptor reporting rates have increased. % Facilities reporting ANC and FP indicators by month, Ebonyi<br>
13
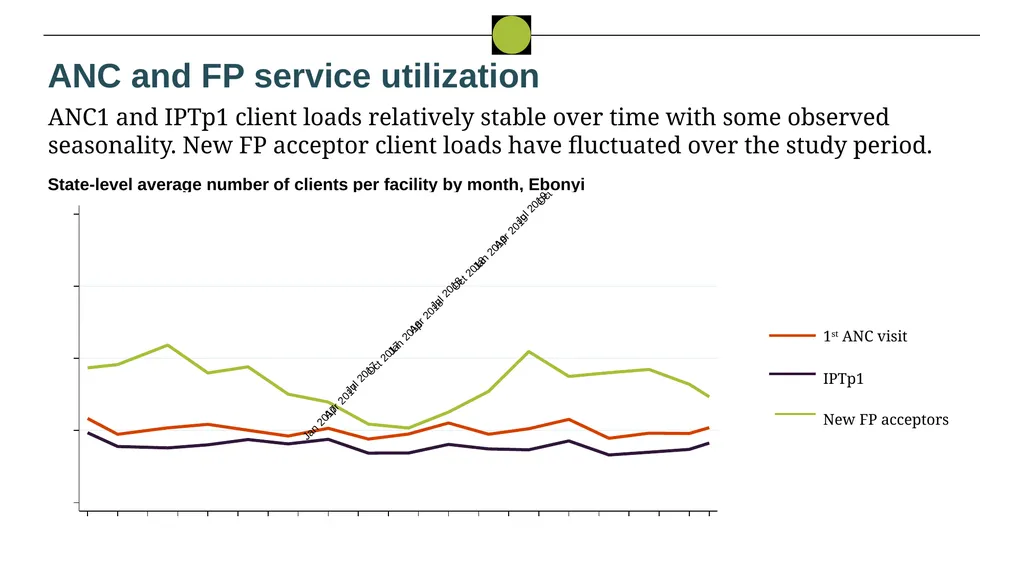
ANC and FP service utilization ANC1 and IPTp1 client loads relatively stable over time with some observed seasonality. New FP acceptor client loads have fluctuated over the study period. State-level average number of clients per facility by month, Ebonyi<br>
14
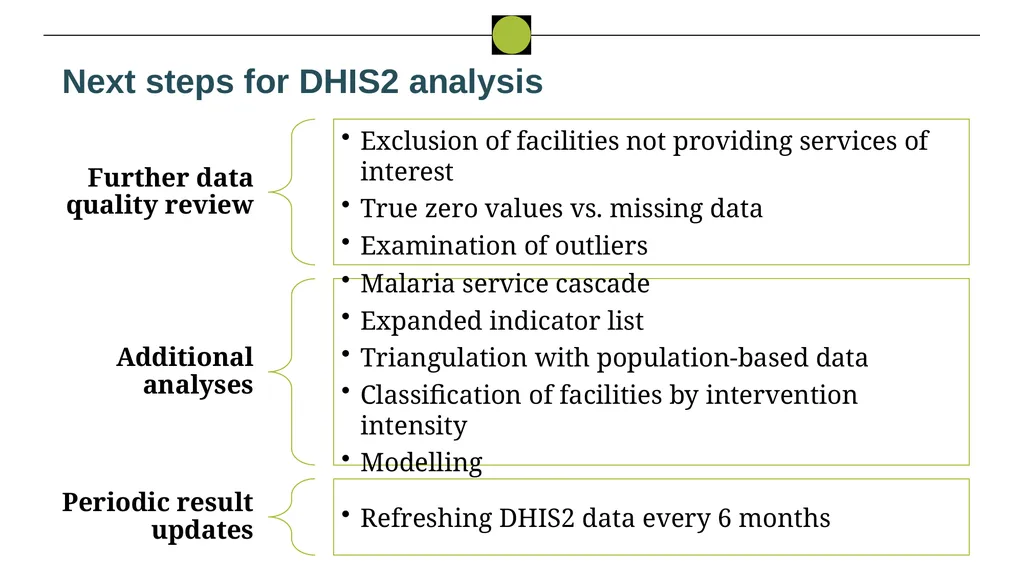
Next steps for DHIS2 analysis Further data quality review Exclusion of facilities not providing services of interest
True zero values vs. missing data
Examination of outliers Additional analyses Malaria service cascade
Expanded indicator list
Triangulation with population-based data
Classification of facilities by intervention intensity
Modelling Periodic result updates Refreshing DHIS2 data every 6 months<br>
True zero values vs. missing data
Examination of outliers Additional analyses Malaria service cascade
Expanded indicator list
Triangulation with population-based data
Classification of facilities by intervention intensity
Modelling Periodic result updates Refreshing DHIS2 data every 6 months<br>
15
Assessing the effectiveness of HPN activities on health facility readiness
Evaluation baseline health facility assessment (HFA) results<br>
Evaluation baseline health facility assessment (HFA) results<br>
16
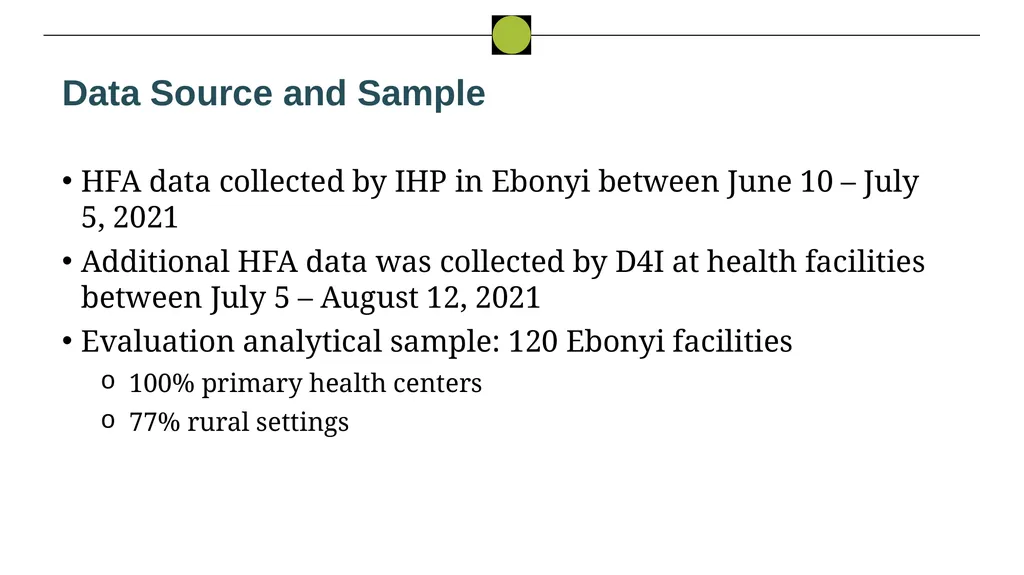
Data Source and Sample HFA data collected by IHP in Ebonyi between June 10 – July 5, 2021
Additional HFA data was collected by D4I at health facilities between July 5 – August 12, 2021
Evaluation analytical sample: 120 Ebonyi facilities
100% primary health centers
77% rural settings<br>
Additional HFA data was collected by D4I at health facilities between July 5 – August 12, 2021
Evaluation analytical sample: 120 Ebonyi facilities
100% primary health centers
77% rural settings<br>
17
HFA results:
A. General service readiness<br>
A. General service readiness<br>
18
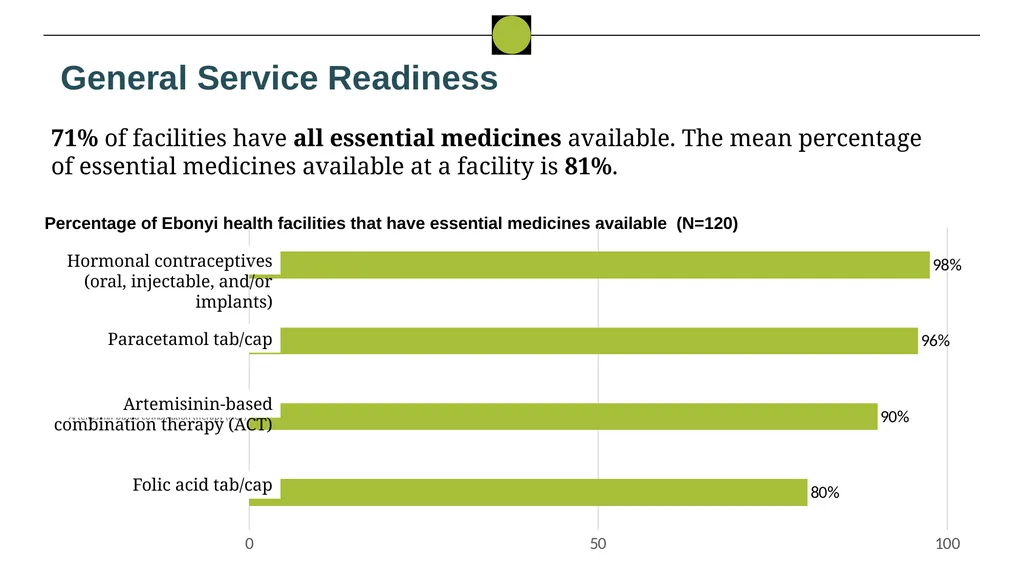
General Service Readiness 71% of facilities have all essential medicines available. The mean percentage of essential medicines available at a facility is 81%. Percentage of Ebonyi health facilities that have essential medicines available (N=120) Hormonal contraceptives (oral, injectable, and/or implants) Paracetamol tab/cap Artemisinin-based combination therapy (ACT) Folic acid tab/cap<br>
19
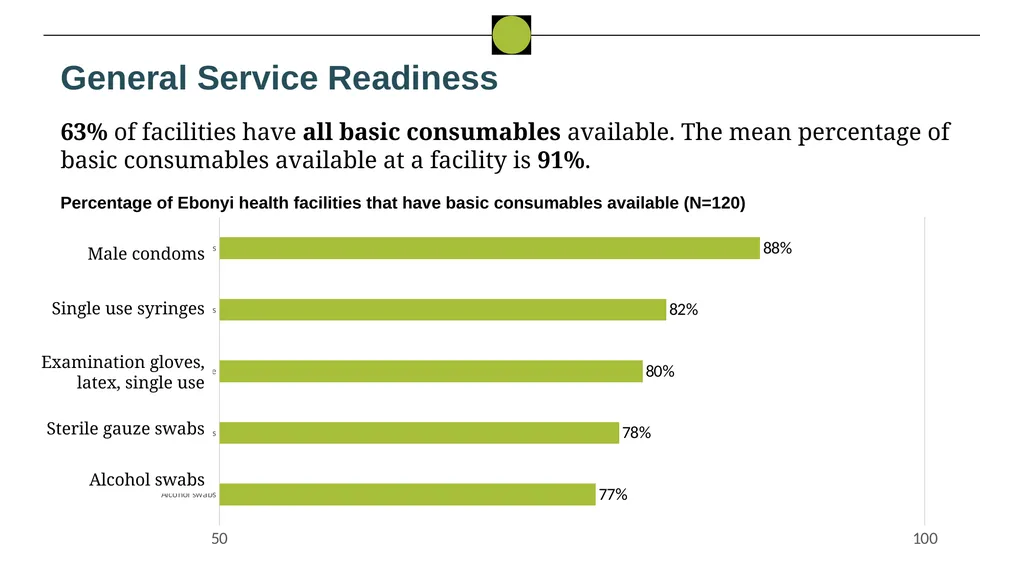
General Service Readiness 63% of facilities have all basic consumables available. The mean percentage of basic consumables available at a facility is 91%. Percentage of Ebonyi health facilities that have basic consumables available (N=120) Male condoms Single use syringes Examination gloves, latex, single use Sterile gauze swabs Alcohol swabs<br>
20
HFA results:
B. Malaria service availability and readiness<br>
B. Malaria service availability and readiness<br>
21
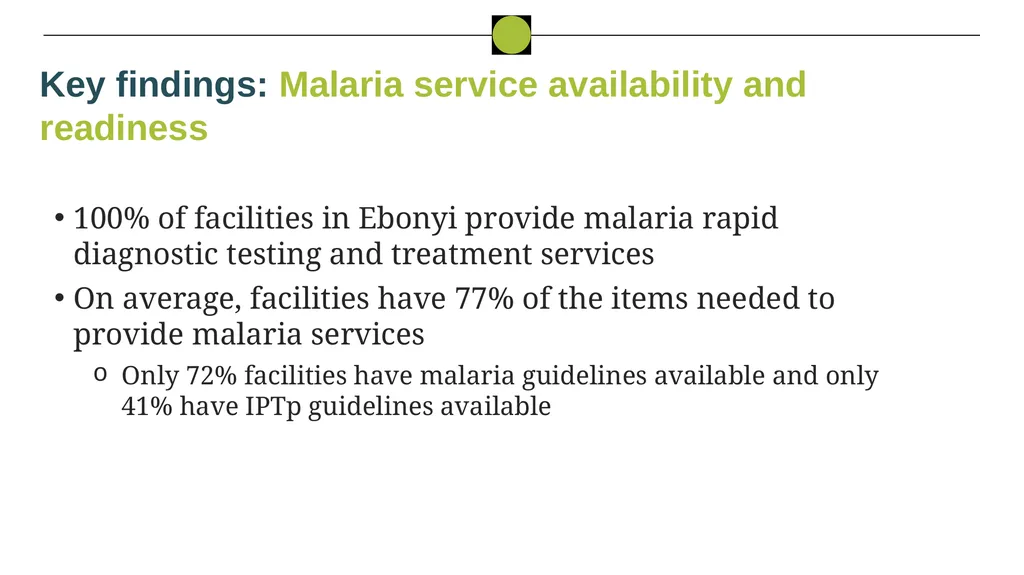
Key findings: Malaria service availability and readiness 100% of facilities in Ebonyi provide malaria rapid diagnostic testing and treatment services
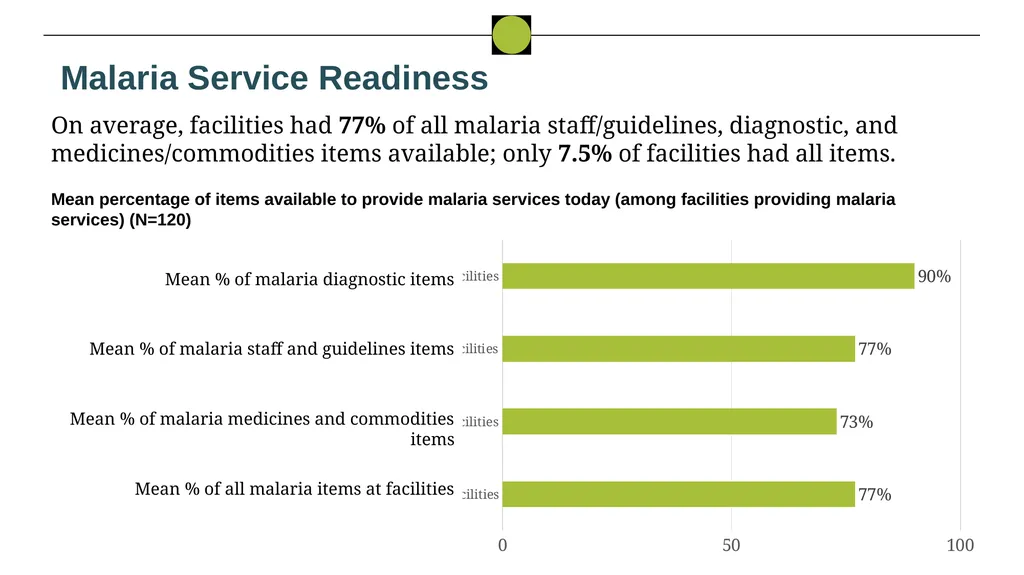
On average, facilities have 77% of the items needed to provide malaria services
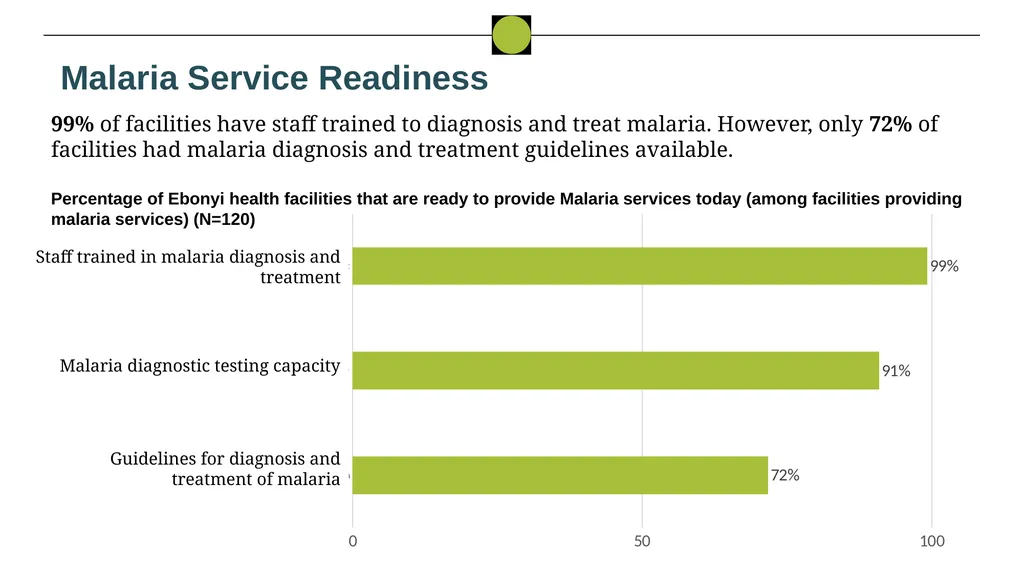
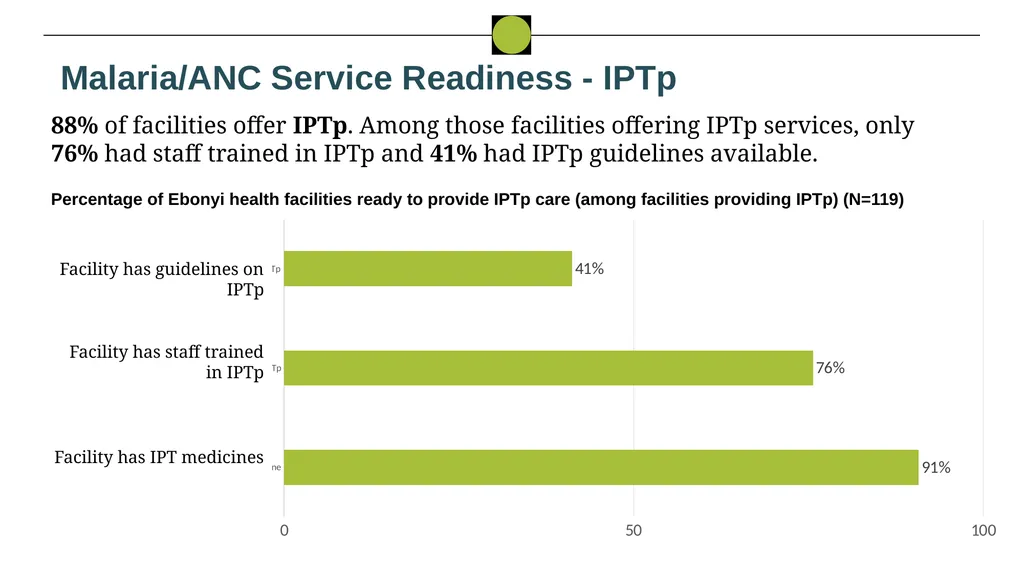
Only 72% facilities have malaria guidelines available and only 41% have IPTp guidelines available<br>
On average, facilities have 77% of the items needed to provide malaria services
Only 72% facilities have malaria guidelines available and only 41% have IPTp guidelines available<br>
22
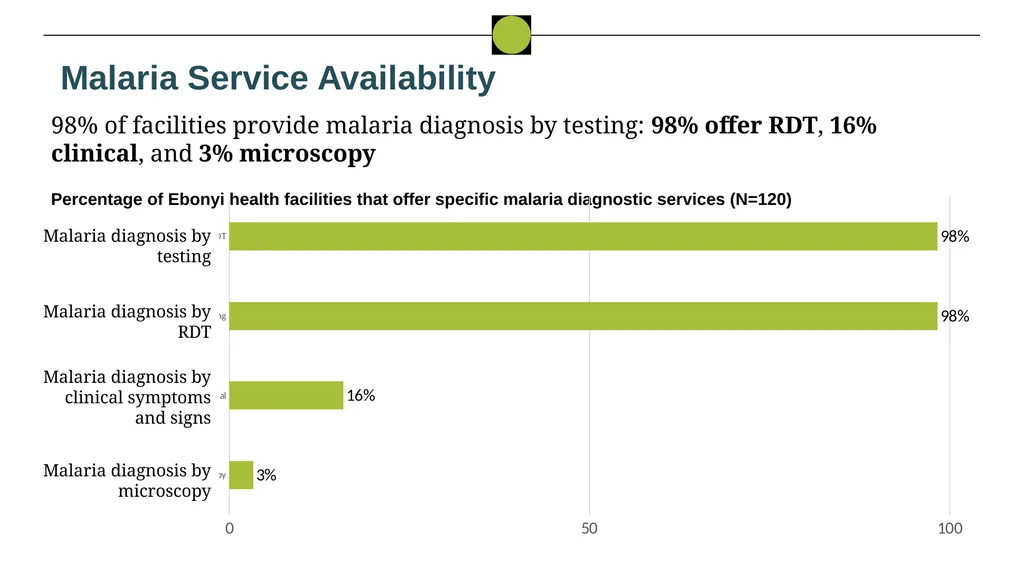
Malaria Service Availability 98% of facilities provide malaria diagnosis by testing: 98% offer RDT, 16% clinical, and 3% microscopy Percentage of Ebonyi health facilities that offer specific malaria diagnostic services (N=120) Malaria diagnosis by testing Malaria diagnosis by RDT Malaria diagnosis by clinical symptoms and signs Malaria diagnosis by microscopy<br>
23
Malaria Service Readiness 99% of facilities have staff trained to diagnosis and treat malaria. However, only 72% of facilities had malaria diagnosis and treatment guidelines available. Percentage of Ebonyi health facilities that are ready to provide Malaria services today (among facilities providing malaria services) (N=120) Staff trained in malaria diagnosis and treatment Malaria diagnostic testing capacity Guidelines for diagnosis and treatment of malaria<br>
24
Malaria/ANC Service Readiness - IPTp 88% of facilities offer IPTp. Among those facilities offering IPTp services, only 76% had staff trained in IPTp and 41% had IPTp guidelines available. Percentage of Ebonyi health facilities ready to provide IPTp care (among facilities providing IPTp) (N=119) Facility has guidelines on IPTp Facility has staff trained in IPTp Facility has IPT medicines<br>
25
Malaria Service Readiness On average, facilities had 77% of all malaria staff/guidelines, diagnostic, and medicines/commodities items available; only 7.5% of facilities had all items. Mean percentage of items available to provide malaria services today (among facilities providing malaria services) (N=120) Mean % of malaria diagnostic items Mean % of malaria staff and guidelines items Mean % of malaria medicines and commodities items Mean % of all malaria items at facilities<br>
26
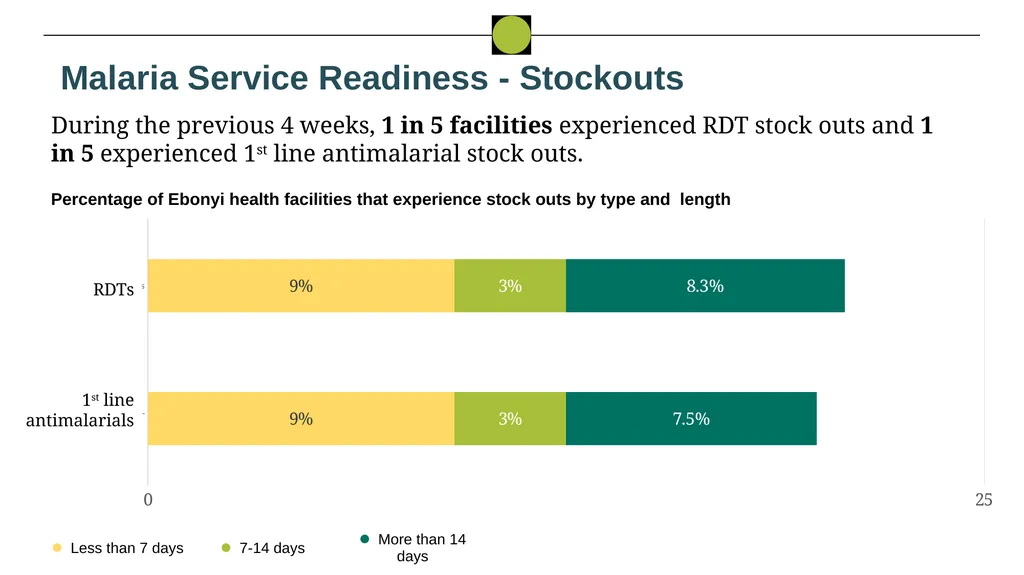
Malaria Service Readiness - Stockouts During the previous 4 weeks, 1 in 5 facilities experienced RDT stock outs and 1 in 5 experienced 1st line antimalarial stock outs. Percentage of Ebonyi health facilities that experience stock outs by type and length RDTs 1st line antimalarials<br>
27
HFA results:
C. Antenatal care and family planning service availability and readiness<br>
C. Antenatal care and family planning service availability and readiness<br>
28
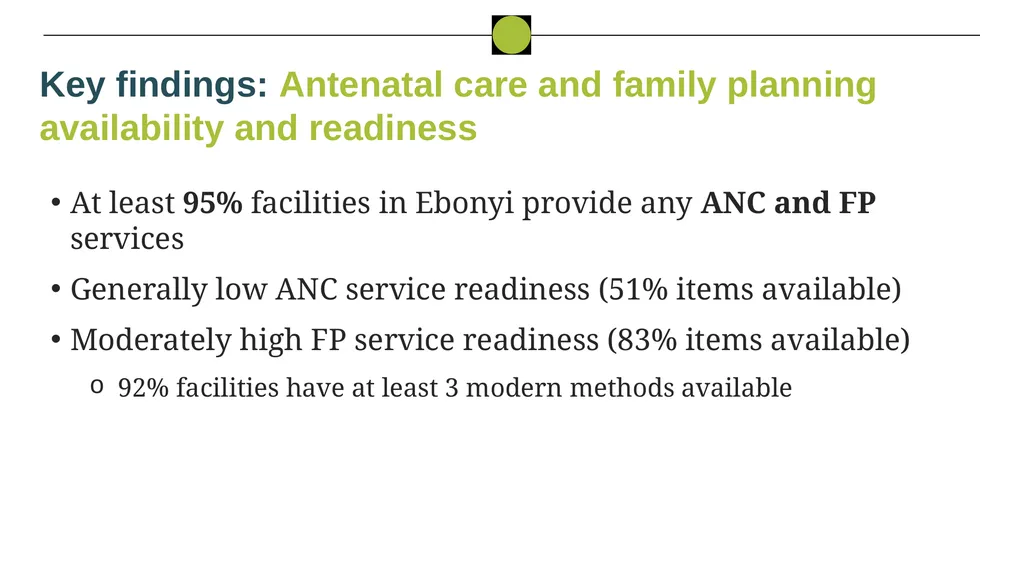
Key findings: Antenatal care and family planning availability and readiness At least 95% facilities in Ebonyi provide any ANC and FP services
Generally low ANC service readiness (51% items available)
Moderately high FP service readiness (83% items available)
92% facilities have at least 3 modern methods available<br>
Generally low ANC service readiness (51% items available)
Moderately high FP service readiness (83% items available)
92% facilities have at least 3 modern methods available<br>
29
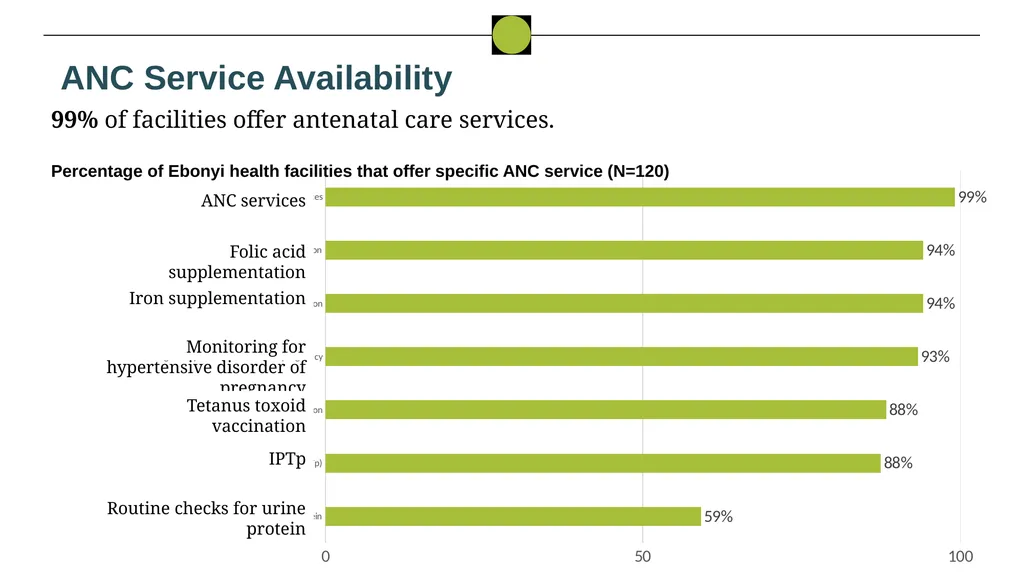
ANC Service Availability 99% of facilities offer antenatal care services.<br>
30
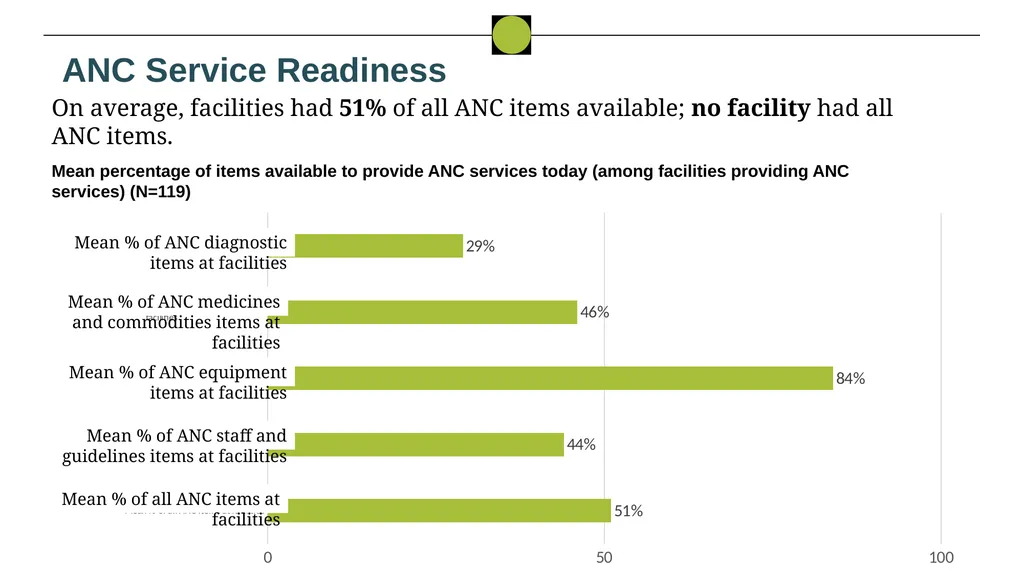
ANC Service Readiness On average, facilities had 51% of all ANC items available; no facility had all ANC items. Mean percentage of items available to provide ANC services today (among facilities providing ANC services) (N=119) Mean % of ANC diagnostic items at facilities Mean % of ANC medicines and commodities items at facilities Mean % of ANC equipment items at facilities Mean % of ANC staff and guidelines items at facilities Mean % of all ANC items at facilities<br>
31
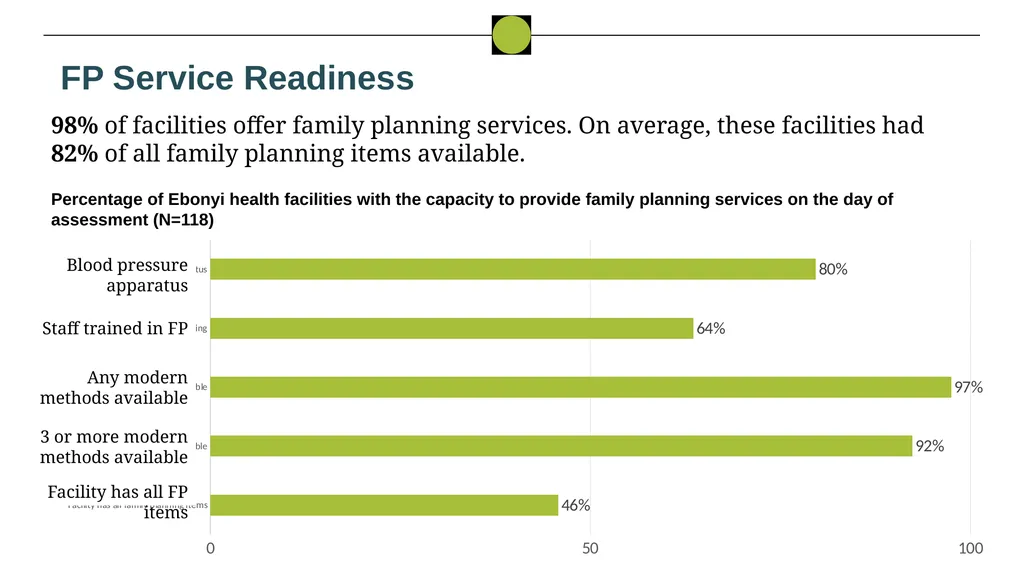
FP Service Readiness 98% of facilities offer family planning services. On average, these facilities had 82% of all family planning items available. Percentage of Ebonyi health facilities with the capacity to provide family planning services on the day of assessment (N=118) Blood pressure apparatus Staff trained in FP Any modern methods available 3 or more modern methods available Facility has all FP items<br>
32
Assessing the effectiveness of HPN activities on providers’ knowledge, attitudes, and practices
Evaluation baseline provider survey results<br>
Evaluation baseline provider survey results<br>
33
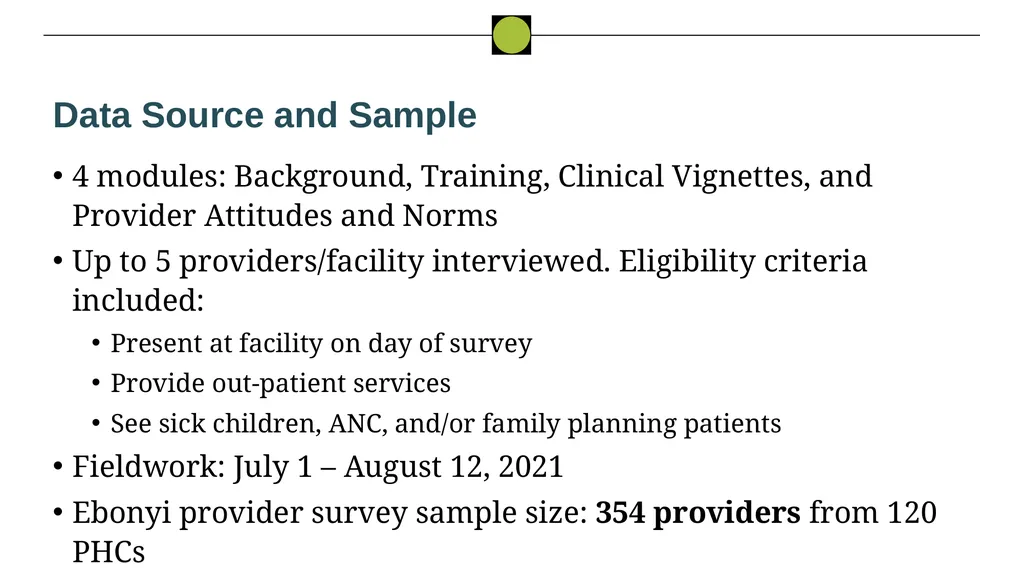
Data Source and Sample 4 modules: Background, Training, Clinical Vignettes, and Provider Attitudes and Norms
Up to 5 providers/facility interviewed. Eligibility criteria included:
Present at facility on day of survey
Provide out-patient services
See sick children, ANC, and/or family planning patients
Fieldwork: July 1 – August 12, 2021
Ebonyi provider survey sample size: 354 providers from 120 PHCs<br>
Up to 5 providers/facility interviewed. Eligibility criteria included:
Present at facility on day of survey
Provide out-patient services
See sick children, ANC, and/or family planning patients
Fieldwork: July 1 – August 12, 2021
Ebonyi provider survey sample size: 354 providers from 120 PHCs<br>
34
Provider survey results:
A. Provider Background<br>
A. Provider Background<br>
35
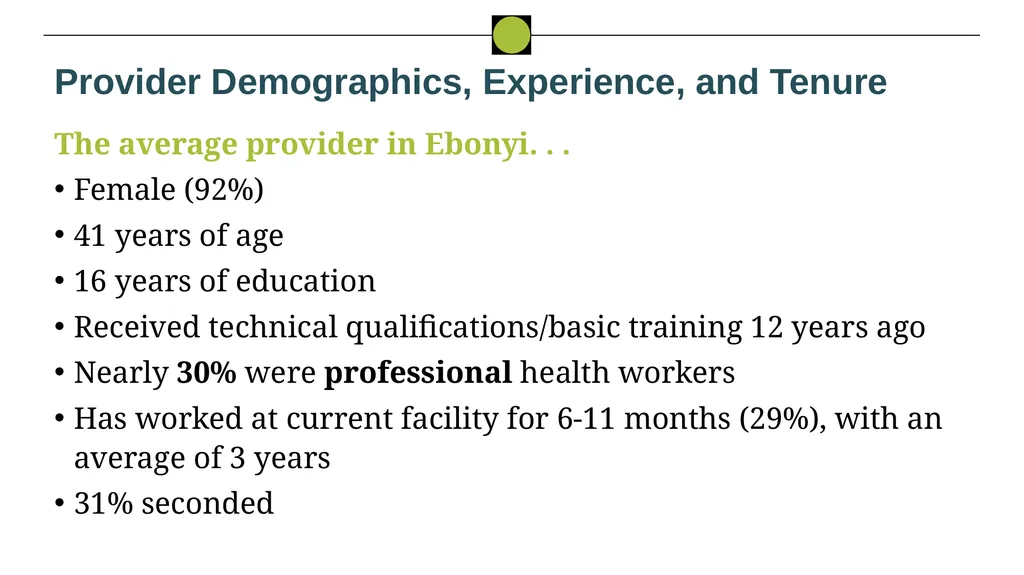
Provider Demographics, Experience, and Tenure The average provider in Ebonyi. . .
Female (92%)
41 years of age
16 years of education
Received technical qualifications/basic training 12 years ago
Nearly 30% were professional health workers
Has worked at current facility for 6-11 months (29%), with an average of 3 years
31% seconded<br>
Female (92%)
41 years of age
16 years of education
Received technical qualifications/basic training 12 years ago
Nearly 30% were professional health workers
Has worked at current facility for 6-11 months (29%), with an average of 3 years
31% seconded<br>
36
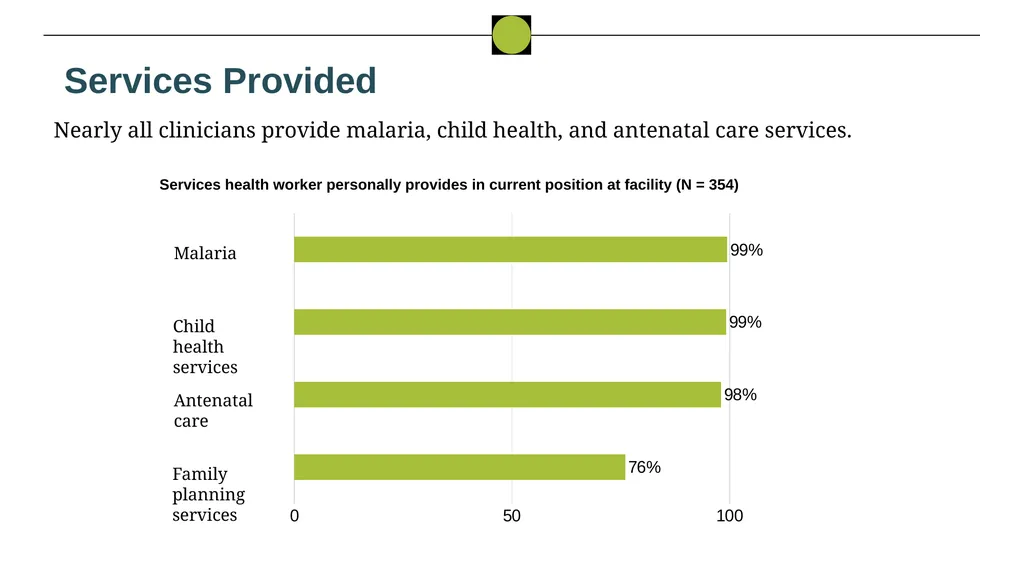
Services Provided Nearly all clinicians provide malaria, child health, and antenatal care services. Services health worker personally provides in current position at facility (N = 354) Malaria Child health services Antenatal care Family planning services<br>
37
Provider survey results:
B. Training<br>
B. Training<br>
38
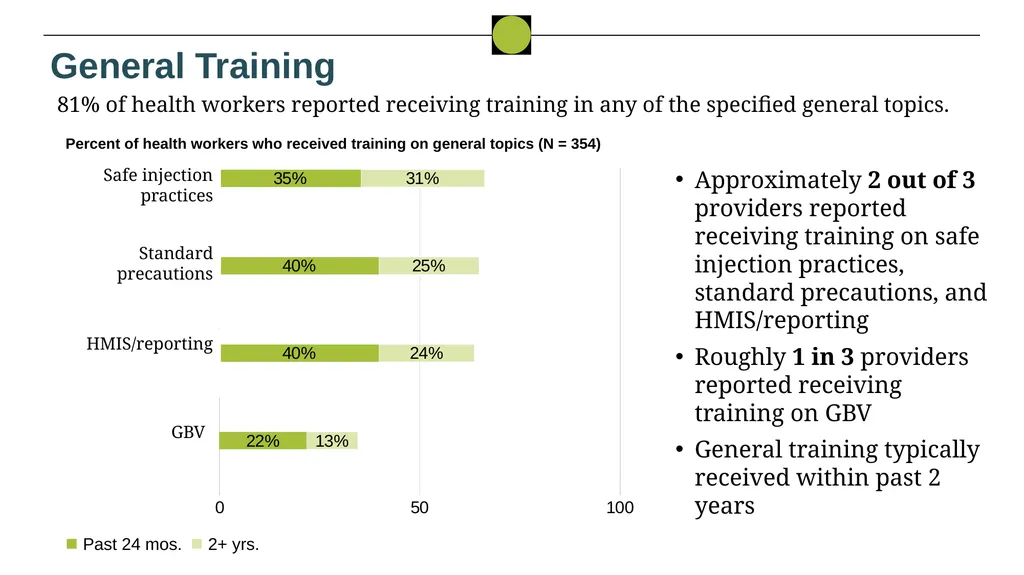
General Training 81% of health workers reported receiving training in any of the specified general topics. Percent of health workers who received training on general topics (N = 354) Safe injection practices Standard precautions HMIS/reporting GBV Approximately 2 out of 3 providers reported receiving training on safe injection practices, standard precautions, and HMIS/reporting
Roughly 1 in 3 providers reported receiving training on GBV
General training typically received within past 2 years<br>
Roughly 1 in 3 providers reported receiving training on GBV
General training typically received within past 2 years<br>
39
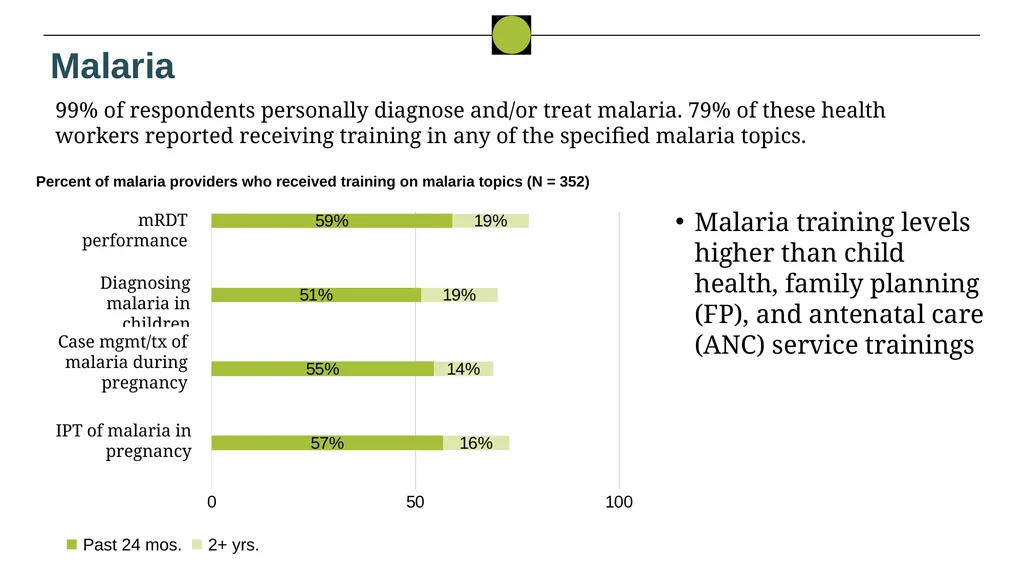
Malaria 99% of respondents personally diagnose and/or treat malaria. 79% of these health workers reported receiving training in any of the specified malaria topics. Percent of malaria providers who received training on malaria topics (N = 352) mRDT performance Diagnosing malaria in children Case mgmt/tx of malaria during pregnancy IPT of malaria in pregnancy Malaria training levels higher than child health, family planning (FP), and antenatal care (ANC) service trainings<br>
40
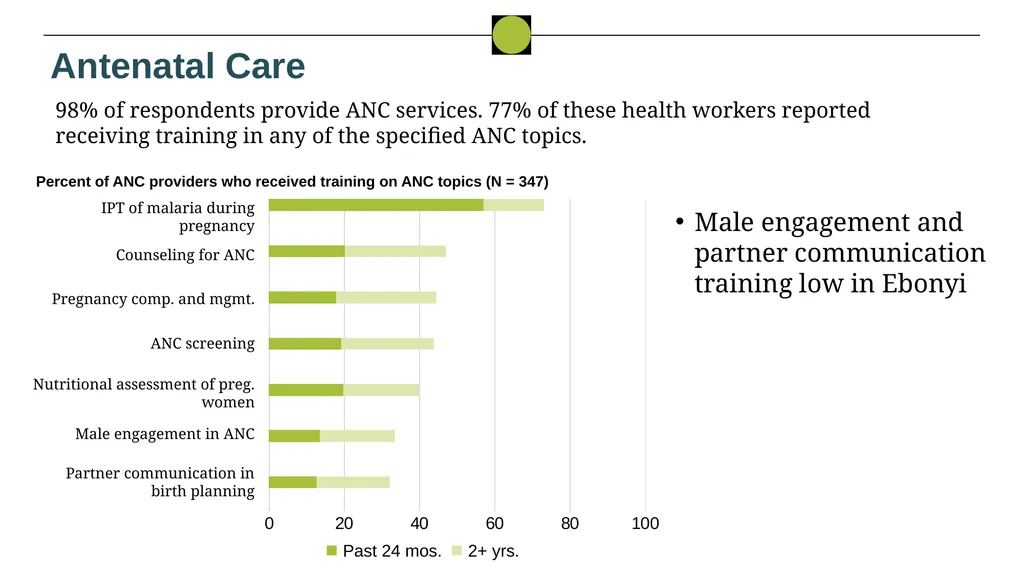
Antenatal Care 98% of respondents provide ANC services. 77% of these health workers reported receiving training in any of the specified ANC topics. Percent of ANC providers who received training on ANC topics (N = 347) IPT of malaria during pregnancy Counseling for ANC Pregnancy comp. and mgmt. ANC screening Nutritional assessment of preg. women Male engagement in ANC Partner communication in birth planning Male engagement and partner communication training low in Ebonyi<br>
41
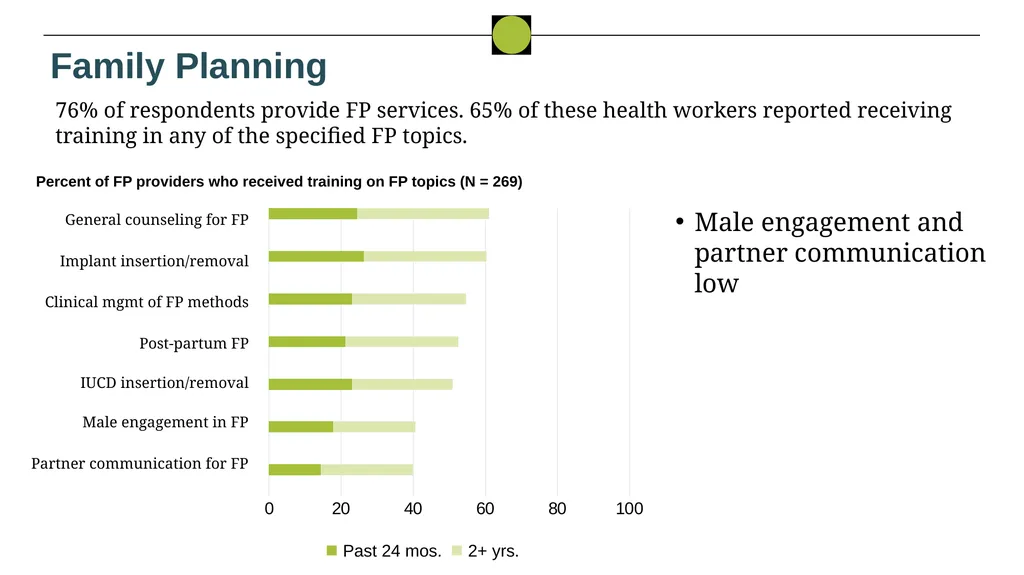
Family Planning 76% of respondents provide FP services. 65% of these health workers reported receiving training in any of the specified FP topics. Percent of FP providers who received training on FP topics (N = 269) Male engagement and partner communication low<br>
42
Provider survey results:
C. Attitudes and Norms<br>
C. Attitudes and Norms<br>
43
Provider Attitudes and Norms Are provider attitudes different from perceived professional community norms among other providers in LGA?
Topic 1. Malaria, ANC, and FP attitudes, practices, and norms
Topic 2. Gender attitudes and gender-sensitive quality of care norms<br>
Topic 1. Malaria, ANC, and FP attitudes, practices, and norms
Topic 2. Gender attitudes and gender-sensitive quality of care norms<br>
44
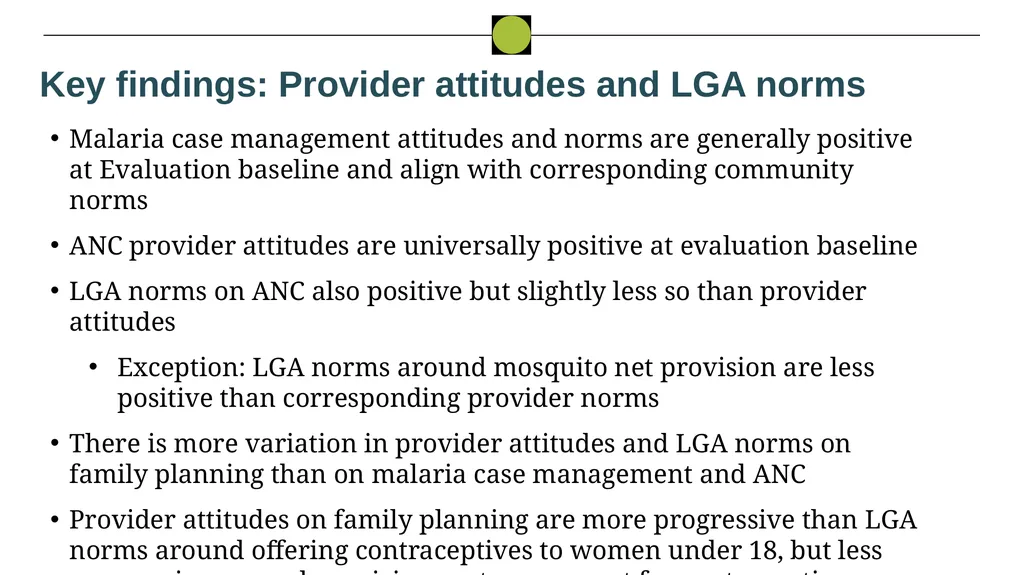
Key findings: Provider attitudes and LGA norms Malaria case management attitudes and norms are generally positive at Evaluation baseline and align with corresponding community norms
ANC provider attitudes are universally positive at evaluation baseline
LGA norms on ANC also positive but slightly less so than provider attitudes
Exception: LGA norms around mosquito net provision are less positive than corresponding provider norms
There is more variation in provider attitudes and LGA norms on family planning than on malaria case management and ANC
Provider attitudes on family planning are more progressive than LGA norms around offering contraceptives to women under 18, but less progressive around requiring partner consent for contraceptives<br>
ANC provider attitudes are universally positive at evaluation baseline
LGA norms on ANC also positive but slightly less so than provider attitudes
Exception: LGA norms around mosquito net provision are less positive than corresponding provider norms
There is more variation in provider attitudes and LGA norms on family planning than on malaria case management and ANC
Provider attitudes on family planning are more progressive than LGA norms around offering contraceptives to women under 18, but less progressive around requiring partner consent for contraceptives<br>
45
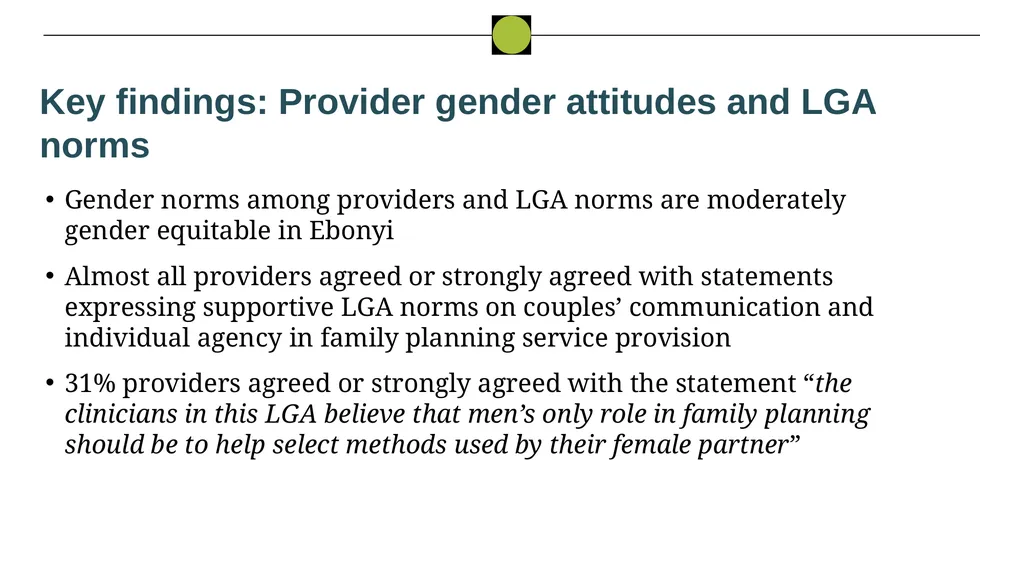
Key findings: Provider gender attitudes and LGA norms Gender norms among providers and LGA norms are moderately gender equitable in Ebonyi
Almost all providers agreed or strongly agreed with statements expressing supportive LGA norms on couples’ communication and individual agency in family planning service provision
31% providers agreed or strongly agreed with the statement “the clinicians in this LGA believe that men’s only role in family planning should be to help select methods used by their female partner”<br>
Almost all providers agreed or strongly agreed with statements expressing supportive LGA norms on couples’ communication and individual agency in family planning service provision
31% providers agreed or strongly agreed with the statement “the clinicians in this LGA believe that men’s only role in family planning should be to help select methods used by their female partner”<br>
46
Provider survey results:
D. Clinical Vignettes<br>
D. Clinical Vignettes<br>
47
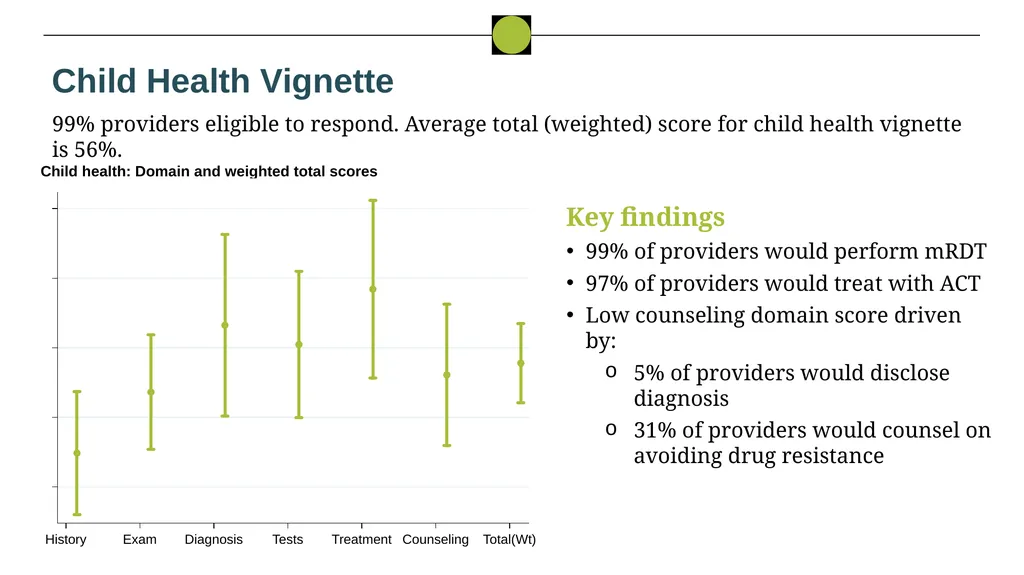
Child Health Vignette 99% providers eligible to respond. Average total (weighted) score for child health vignette is 56%. Child health: Domain and weighted total scores Key findings
99% of providers would perform mRDT
97% of providers would treat with ACT
Low counseling domain score driven by:
5% of providers would disclose diagnosis
31% of providers would counsel on avoiding drug resistance<br>
99% of providers would perform mRDT
97% of providers would treat with ACT
Low counseling domain score driven by:
5% of providers would disclose diagnosis
31% of providers would counsel on avoiding drug resistance<br>
48
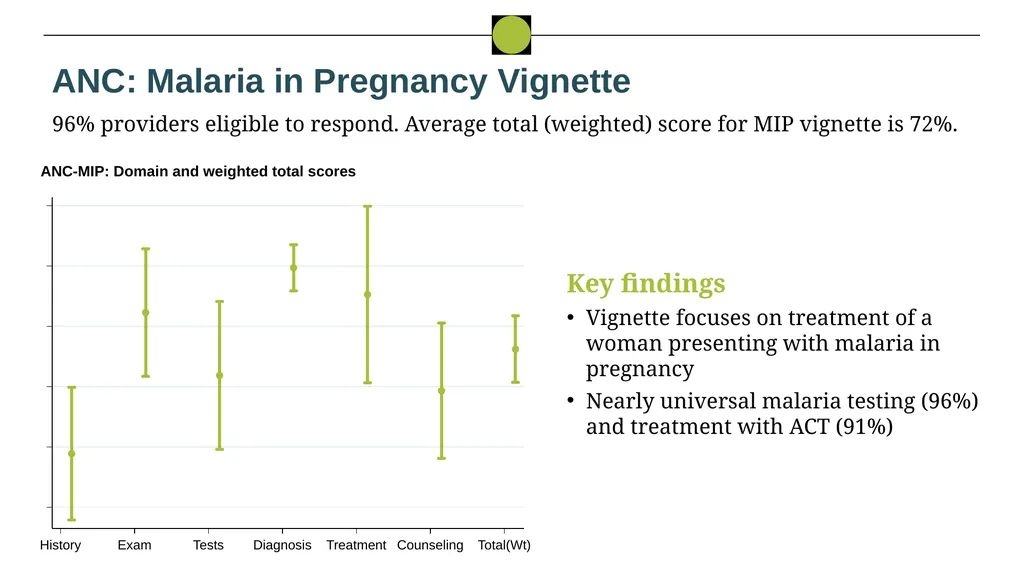
ANC: Malaria in Pregnancy Vignette 96% providers eligible to respond. Average total (weighted) score for MIP vignette is 72%. ANC-MIP: Domain and weighted total scores Key findings
Vignette focuses on treatment of a woman presenting with malaria in pregnancy
Nearly universal malaria testing (96%) and treatment with ACT (91%)<br>
Vignette focuses on treatment of a woman presenting with malaria in pregnancy
Nearly universal malaria testing (96%) and treatment with ACT (91%)<br>
49
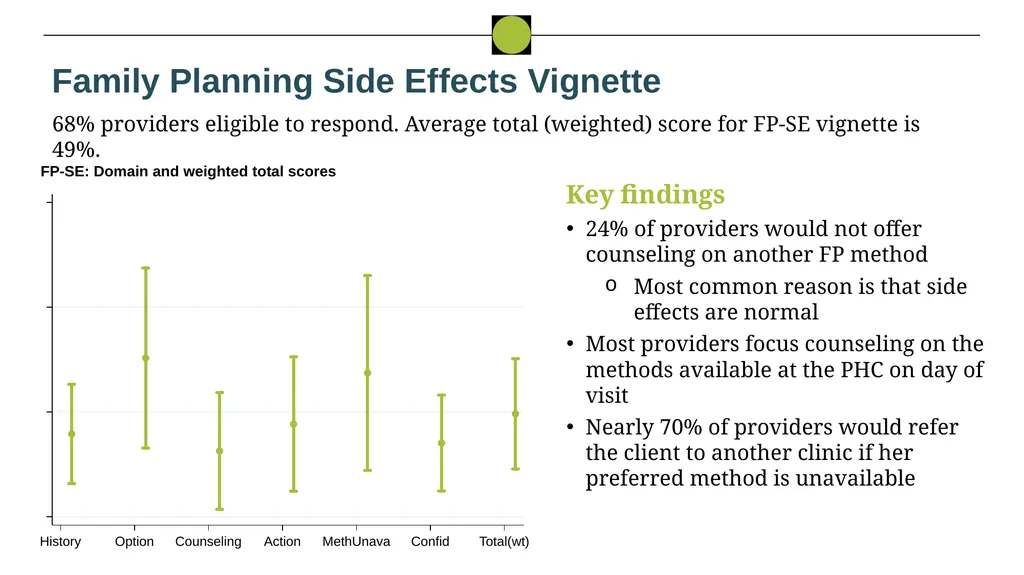
Family Planning Side Effects Vignette 68% providers eligible to respond. Average total (weighted) score for FP-SE vignette is 49%. FP-SE: Domain and weighted total scores Key findings
24% of providers would not offer counseling on another FP method
Most common reason is that side effects are normal
Most providers focus counseling on the methods available at the PHC on day of visit
Nearly 70% of providers would refer the client to another clinic if her preferred method is unavailable<br>
24% of providers would not offer counseling on another FP method
Most common reason is that side effects are normal
Most providers focus counseling on the methods available at the PHC on day of visit
Nearly 70% of providers would refer the client to another clinic if her preferred method is unavailable<br>
50
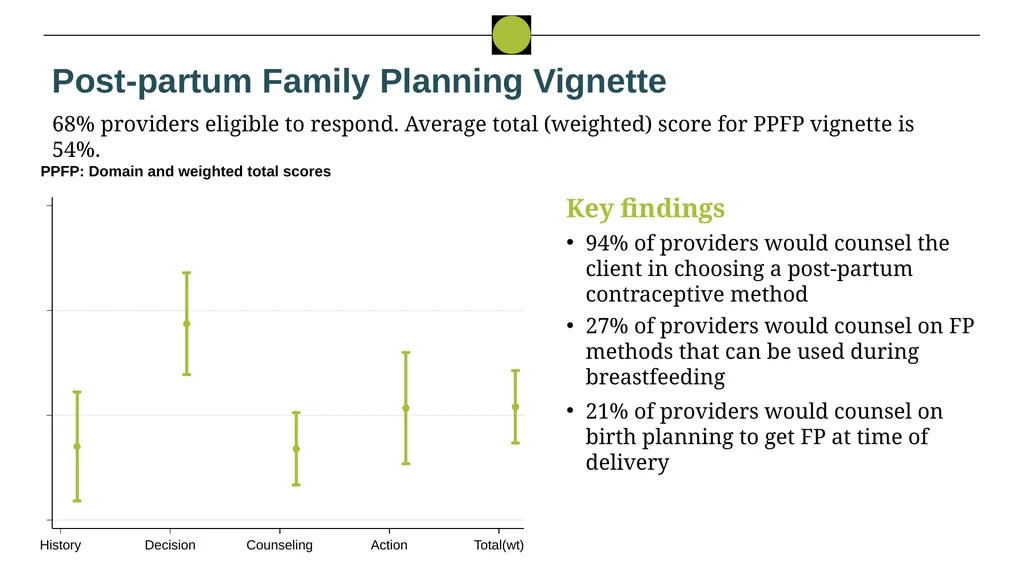
Post-partum Family Planning Vignette 68% providers eligible to respond. Average total (weighted) score for PPFP vignette is 54%. PPFP: Domain and weighted total scores Key findings
94% of providers would counsel the client in choosing a post-partum contraceptive method
27% of providers would counsel on FP methods that can be used during breastfeeding
21% of providers would counsel on birth planning to get FP at time of delivery<br>
94% of providers would counsel the client in choosing a post-partum contraceptive method
27% of providers would counsel on FP methods that can be used during breastfeeding
21% of providers would counsel on birth planning to get FP at time of delivery<br>
51
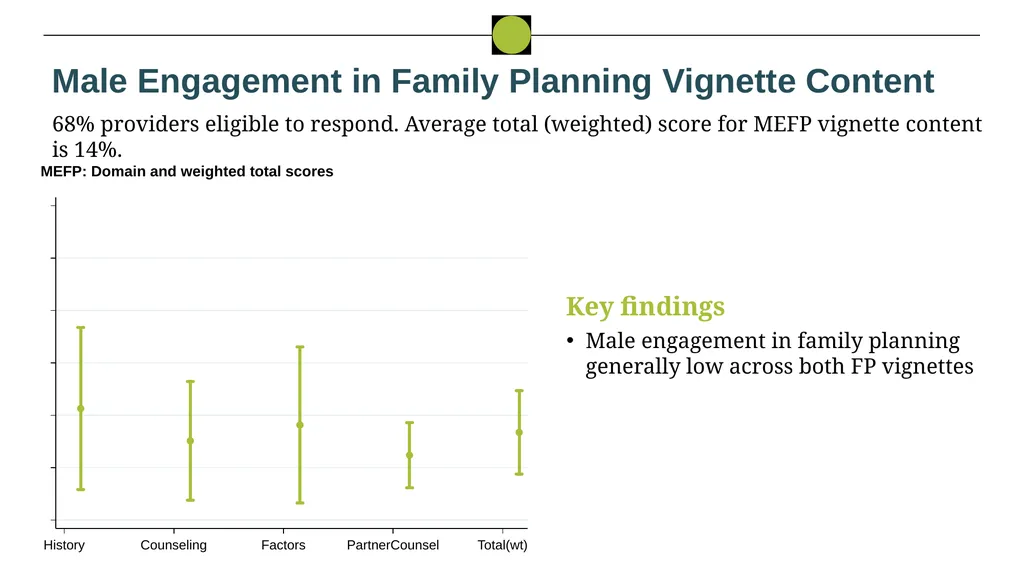
Male Engagement in Family Planning Vignette Content 68% providers eligible to respond. Average total (weighted) score for MEFP vignette content is 14%. MEFP: Domain and weighted total scores Key findings
Male engagement in family planning generally low across both FP vignettes<br>
Male engagement in family planning generally low across both FP vignettes<br>
52
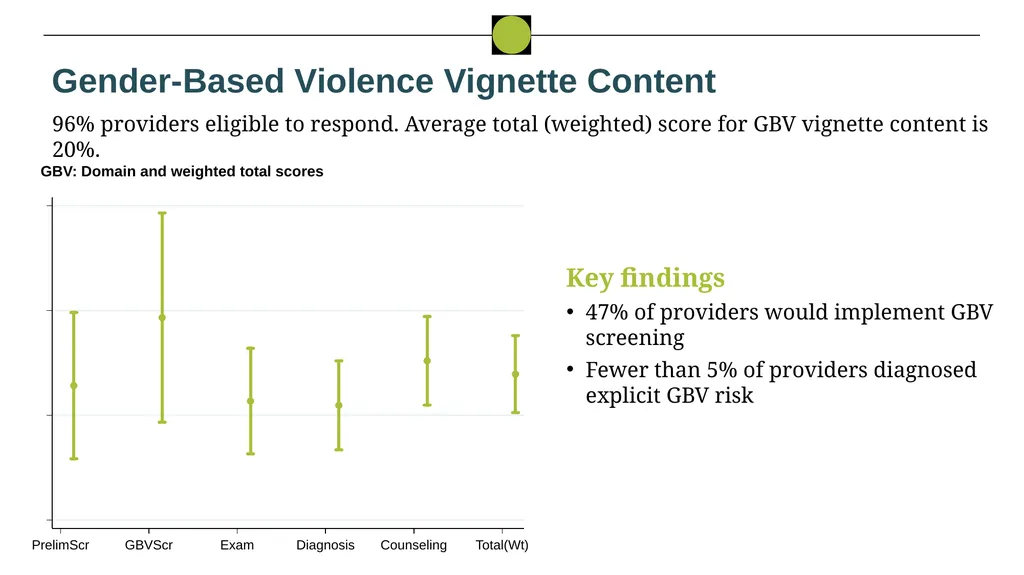
Gender-Based Violence Vignette Content 96% providers eligible to respond. Average total (weighted) score for GBV vignette content is 20%. GBV: Domain and weighted total scores Key findings
47% of providers would implement GBV screening
Fewer than 5% of providers diagnosed explicit GBV risk<br>
47% of providers would implement GBV screening
Fewer than 5% of providers diagnosed explicit GBV risk<br>
53
Provider survey results:
Conclusions<br>
Conclusions<br>
54
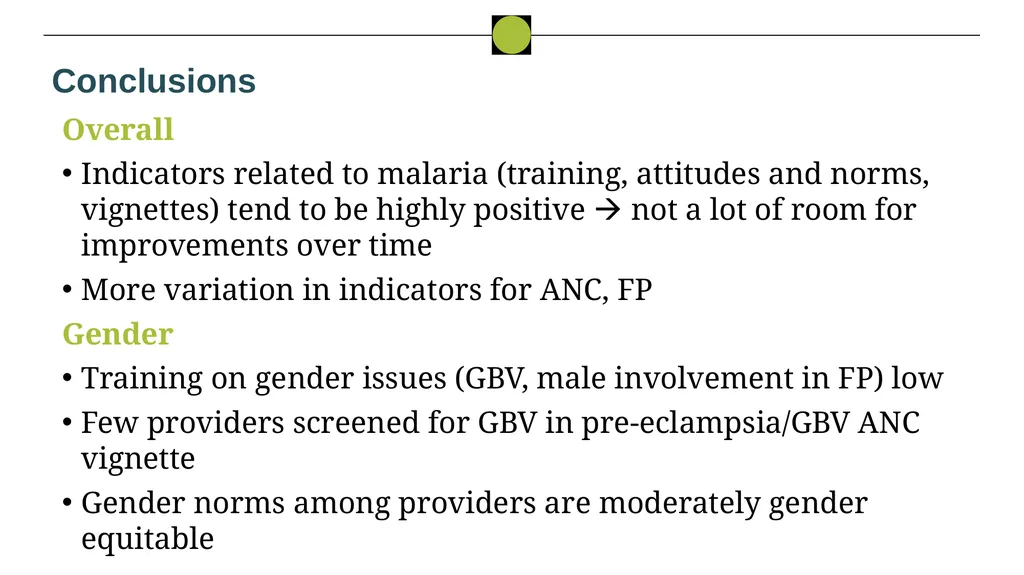
Conclusions Overall
Indicators related to malaria (training, attitudes and norms, vignettes) tend to be highly positive not a lot of room for improvements over time
More variation in indicators for ANC, FP
Gender
Training on gender issues (GBV, male involvement in FP) low
Few providers screened for GBV in pre-eclampsia/GBV ANC vignette
Gender norms among providers are moderately gender equitable<br>
Indicators related to malaria (training, attitudes and norms, vignettes) tend to be highly positive not a lot of room for improvements over time
More variation in indicators for ANC, FP
Gender
Training on gender issues (GBV, male involvement in FP) low
Few providers screened for GBV in pre-eclampsia/GBV ANC vignette
Gender norms among providers are moderately gender equitable<br>
55
Baseline findings on sustainability: Ebonyi
A. Methods<br>
A. Methods<br>
56
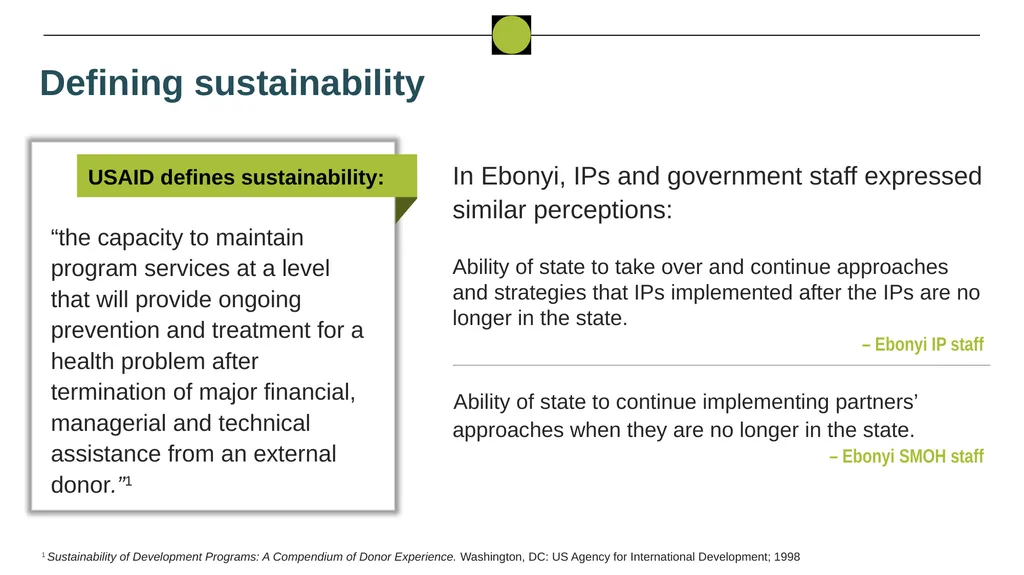
Defining sustainability USAID defines sustainability: “the capacity to maintain program services at a level that will provide ongoing prevention and treatment for a health problem after termination of major financial, managerial and technical assistance from an external donor.”1 In Ebonyi, IPs and government staff expressed similar perceptions: Ability of state to take over and continue approaches and strategies that IPs implemented after the IPs are no longer in the state.
– Ebonyi IP staff Ability of state to continue implementing partners’ approaches when they are no longer in the state.
– Ebonyi SMOH staff 1 Sustainability of Development Programs: A Compendium of Donor Experience. Washington, DC: US Agency for International Development; 1998<br>
– Ebonyi IP staff Ability of state to continue implementing partners’ approaches when they are no longer in the state.
– Ebonyi SMOH staff 1 Sustainability of Development Programs: A Compendium of Donor Experience. Washington, DC: US Agency for International Development; 1998<br>
57
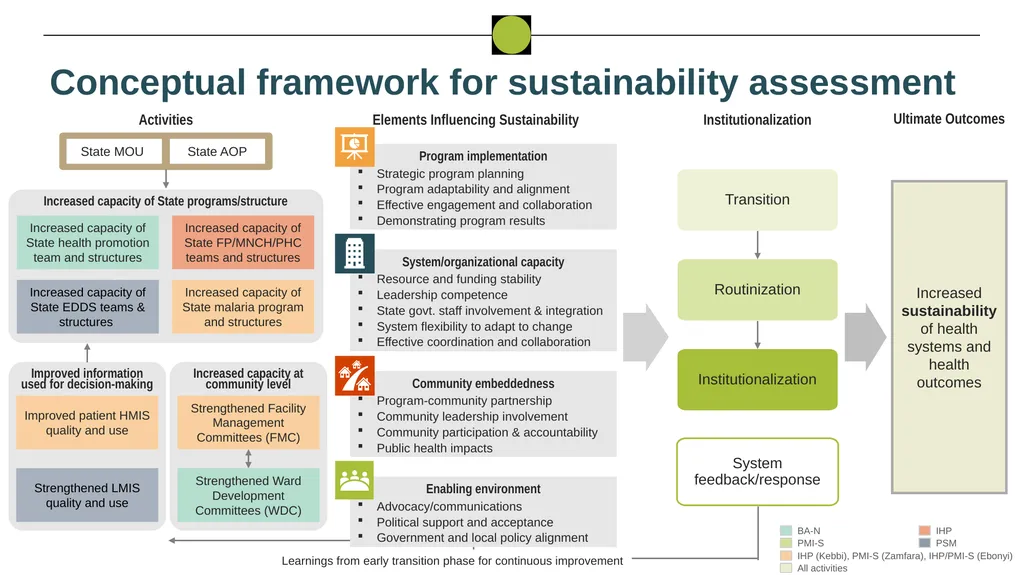
Conceptual framework for sustainability assessment<br>
58
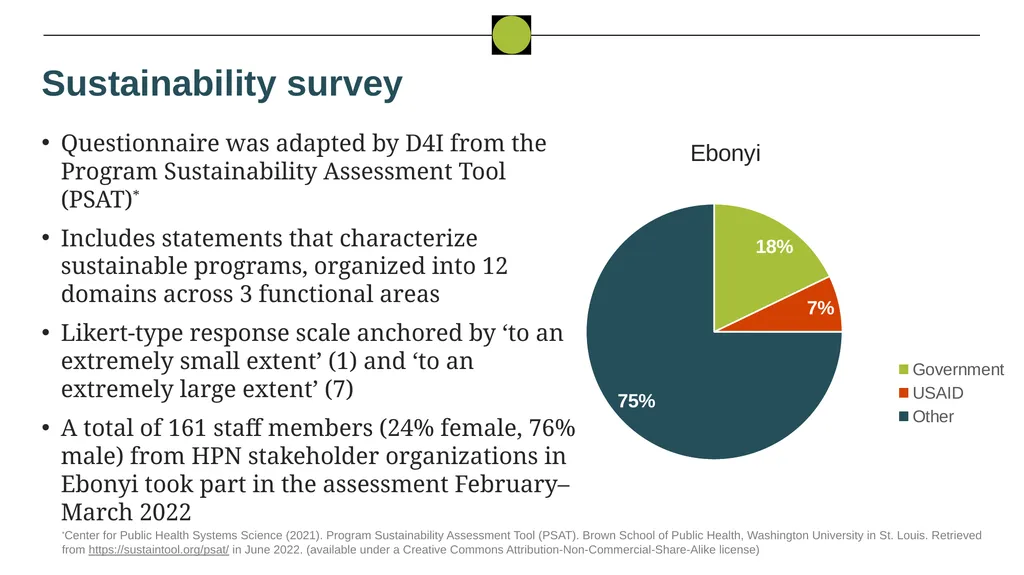
Sustainability survey Questionnaire was adapted by D4I from the Program Sustainability Assessment Tool (PSAT)*
Includes statements that characterize sustainable programs, organized into 12 domains across 3 functional areas
Likert-type response scale anchored by ‘to an extremely small extent’ (1) and ‘to an extremely large extent’ (7)
A total of 161 staff members (24% female, 76% male) from HPN stakeholder organizations in Ebonyi took part in the assessment February–March 2022 *Center for Public Health Systems Science (2021). Program Sustainability Assessment Tool (PSAT). Brown School of Public Health, Washington University in St. Louis. Retrieved from https://sustaintool.org/psat/ in June 2022. (available under a Creative Commons Attribution-Non-Commercial-Share-Alike license)<br>
Includes statements that characterize sustainable programs, organized into 12 domains across 3 functional areas
Likert-type response scale anchored by ‘to an extremely small extent’ (1) and ‘to an extremely large extent’ (7)
A total of 161 staff members (24% female, 76% male) from HPN stakeholder organizations in Ebonyi took part in the assessment February–March 2022 *Center for Public Health Systems Science (2021). Program Sustainability Assessment Tool (PSAT). Brown School of Public Health, Washington University in St. Louis. Retrieved from https://sustaintool.org/psat/ in June 2022. (available under a Creative Commons Attribution-Non-Commercial-Share-Alike license)<br>
59
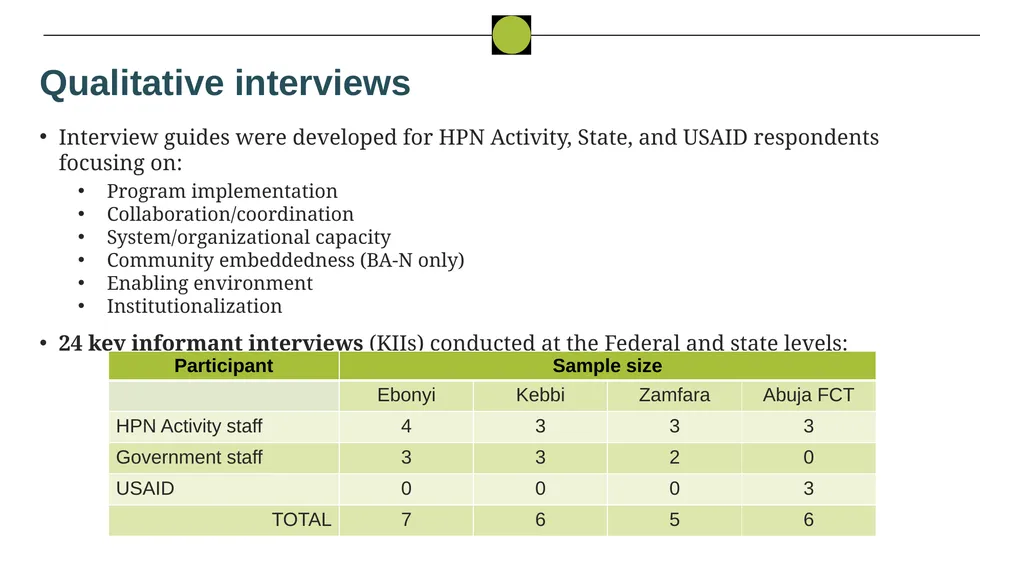
Qualitative interviews Interview guides were developed for HPN Activity, State, and USAID respondents focusing on:
Program implementation
Collaboration/coordination
System/organizational capacity
Community embeddedness (BA-N only)
Enabling environment
Institutionalization
24 key informant interviews (KIIs) conducted at the Federal and state levels:<br>
Program implementation
Collaboration/coordination
System/organizational capacity
Community embeddedness (BA-N only)
Enabling environment
Institutionalization
24 key informant interviews (KIIs) conducted at the Federal and state levels:<br>
60
Baseline findings on sustainability: Ebonyi
B. Program implementation<br>
B. Program implementation<br>
61
What sustainability strategies are implementers using? Communicate the purpose and goals of the sustainability plan with stakeholders at the beginning of the design process Align interventions that include a sustainability plan alongside state’s annual operational plans Engage and support not only state-level stakeholders but also LGA- and grassroot-level leaders in the implementation process Co-locate activity office
within state Ministry of Health’s office complex Integrate gender aspect in practice and interventions by including a gender focal person to facilitate gender incorporation into scope of activities<br>
62
Key survey findings Score are largely consistent across all measures on program implementation.
Average ratings were generally 5.5 (“to a large extent”) or higher for survey items in this domain.<br>
Average ratings were generally 5.5 (“to a large extent”) or higher for survey items in this domain.<br>
63
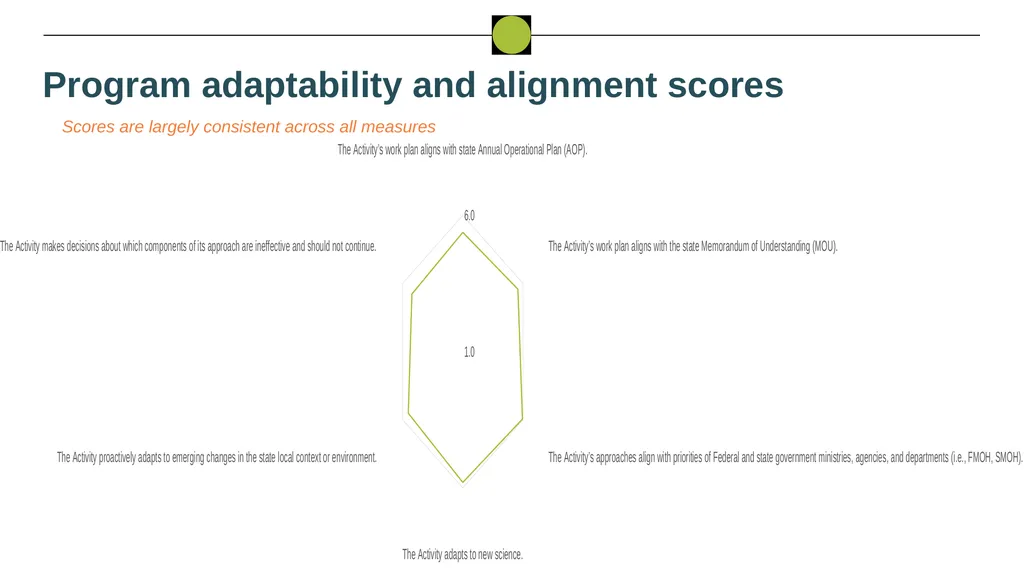
Program adaptability and alignment scores Scores are largely consistent across all measures<br>
64
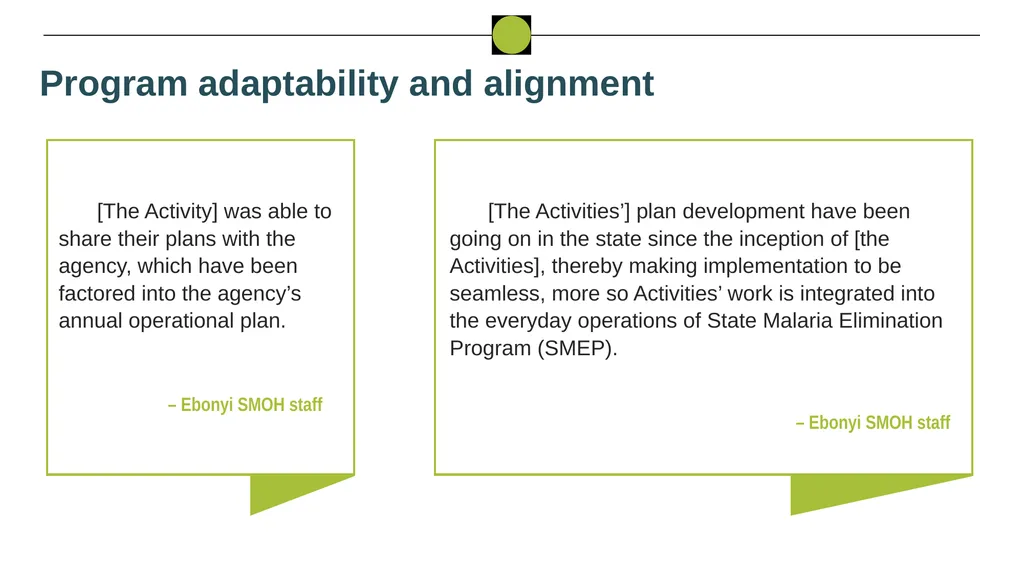
Program adaptability and alignment [The Activity] was able to share their plans with the agency, which have been factored into the agency’s annual operational plan. – Ebonyi SMOH staff [The Activities’] plan development have been going on in the state since the inception of [the Activities], thereby making implementation to be seamless, more so Activities’ work is integrated into the everyday operations of State Malaria Elimination Program (SMEP). – Ebonyi SMOH staff<br>
65
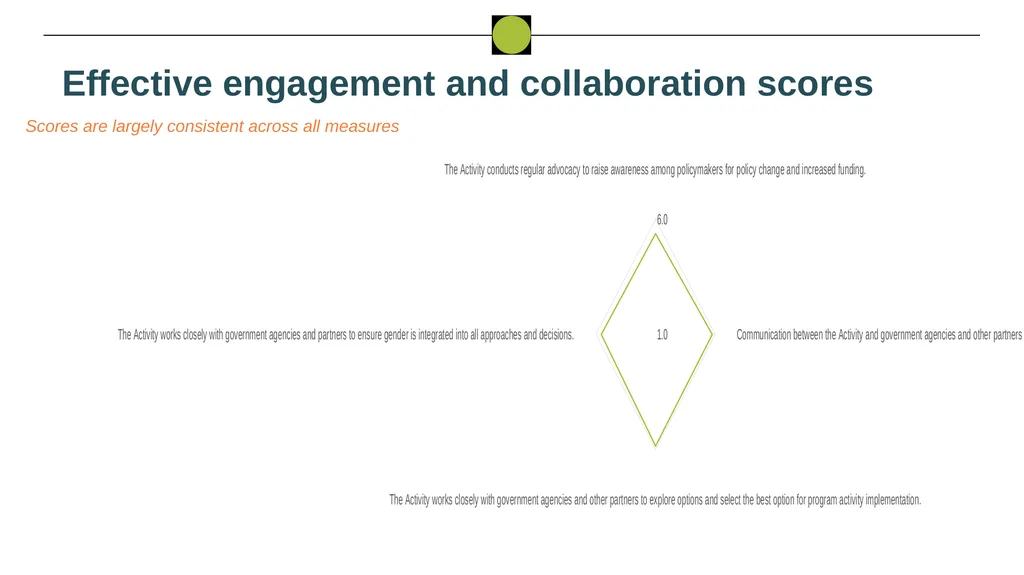
Effective engagement and collaboration scores Scores are largely consistent across all measures<br>
66
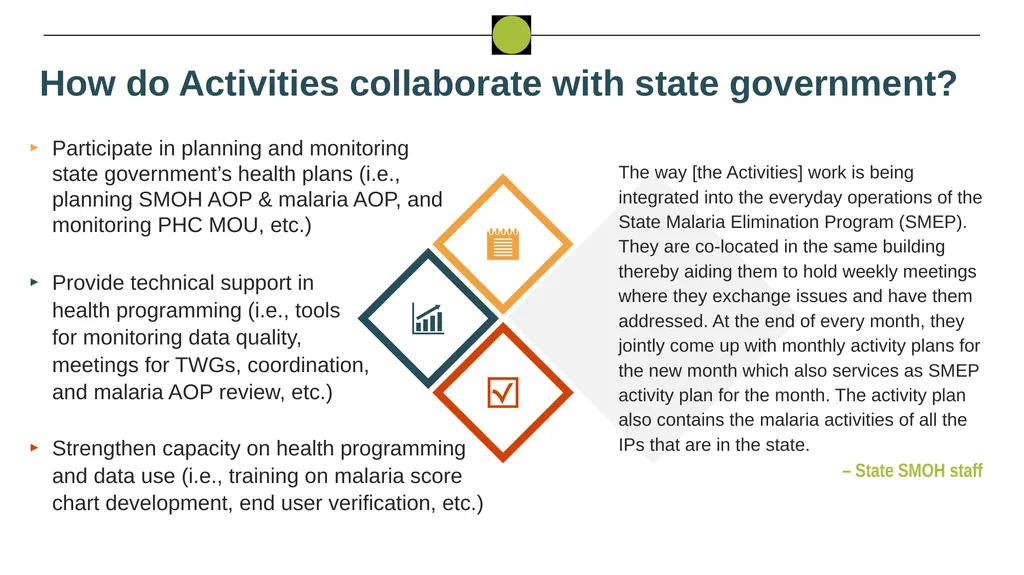
How do Activities collaborate with state government? Participate in planning and monitoring state government’s health plans (i.e., planning SMOH AOP & malaria AOP, and monitoring PHC MOU, etc.) Provide technical support in health programming (i.e., tools for monitoring data quality, meetings for TWGs, coordination, and malaria AOP review, etc.) Strengthen capacity on health programming and data use (i.e., training on malaria score chart development, end user verification, etc.) The way [the Activities] work is being integrated into the everyday operations of the State Malaria Elimination Program (SMEP). They are co-located in the same building thereby aiding them to hold weekly meetings where they exchange issues and have them addressed. At the end of every month, they jointly come up with monthly activity plans for the new month which also services as SMEP activity plan for the month. The activity plan also contains the malaria activities of all the IPs that are in the state.
– State SMOH staff<br>
– State SMOH staff<br>
67
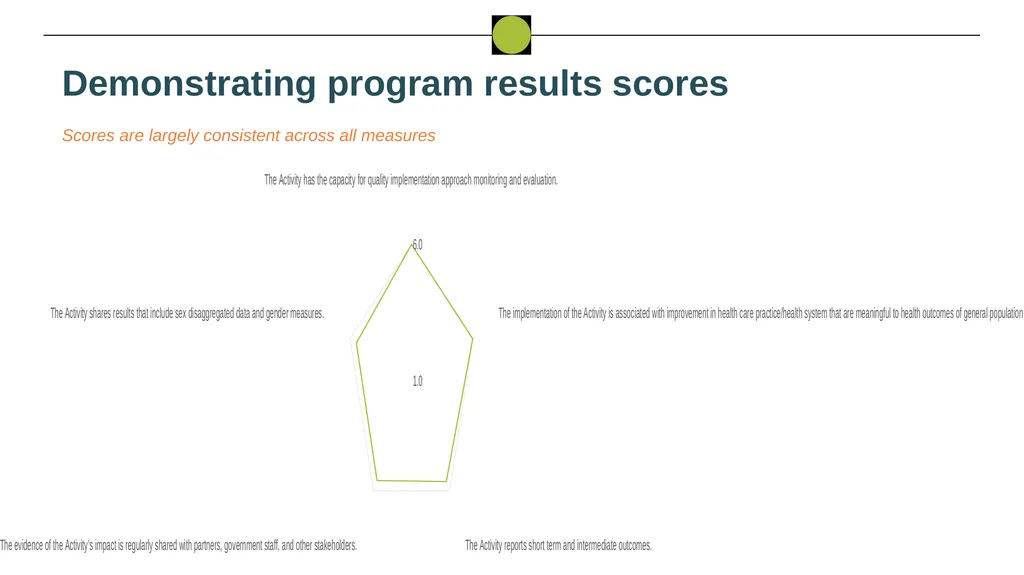
Demonstrating program results scores Scores are largely consistent across all measures<br>
68
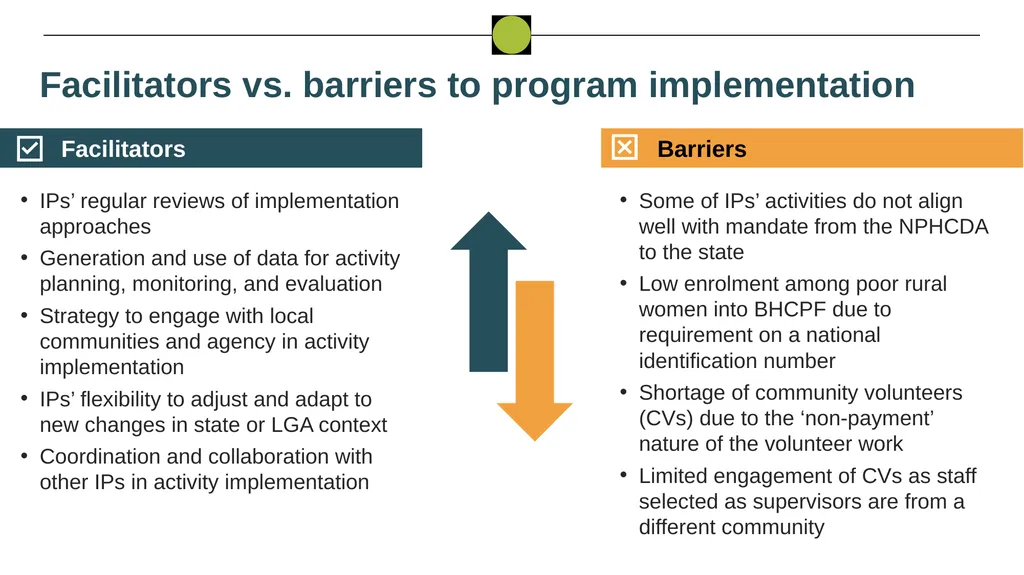
Facilitators vs. barriers to program implementation Facilitators IPs’ regular reviews of implementation approaches
Generation and use of data for activity planning, monitoring, and evaluation
Strategy to engage with local communities and agency in activity implementation
IPs’ flexibility to adjust and adapt to new changes in state or LGA context
Coordination and collaboration with other IPs in activity implementation Barriers Some of IPs’ activities do not align well with mandate from the NPHCDA to the state
Low enrolment among poor rural women into BHCPF due to requirement on a national identification number
Shortage of community volunteers (CVs) due to the ‘non-payment’ nature of the volunteer work
Limited engagement of CVs as staff selected as supervisors are from a different community<br>
Generation and use of data for activity planning, monitoring, and evaluation
Strategy to engage with local communities and agency in activity implementation
IPs’ flexibility to adjust and adapt to new changes in state or LGA context
Coordination and collaboration with other IPs in activity implementation Barriers Some of IPs’ activities do not align well with mandate from the NPHCDA to the state
Low enrolment among poor rural women into BHCPF due to requirement on a national identification number
Shortage of community volunteers (CVs) due to the ‘non-payment’ nature of the volunteer work
Limited engagement of CVs as staff selected as supervisors are from a different community<br>
69
Baseline findings on sustainability: Ebonyi
C. System/organizational capacity<br>
C. System/organizational capacity<br>
70
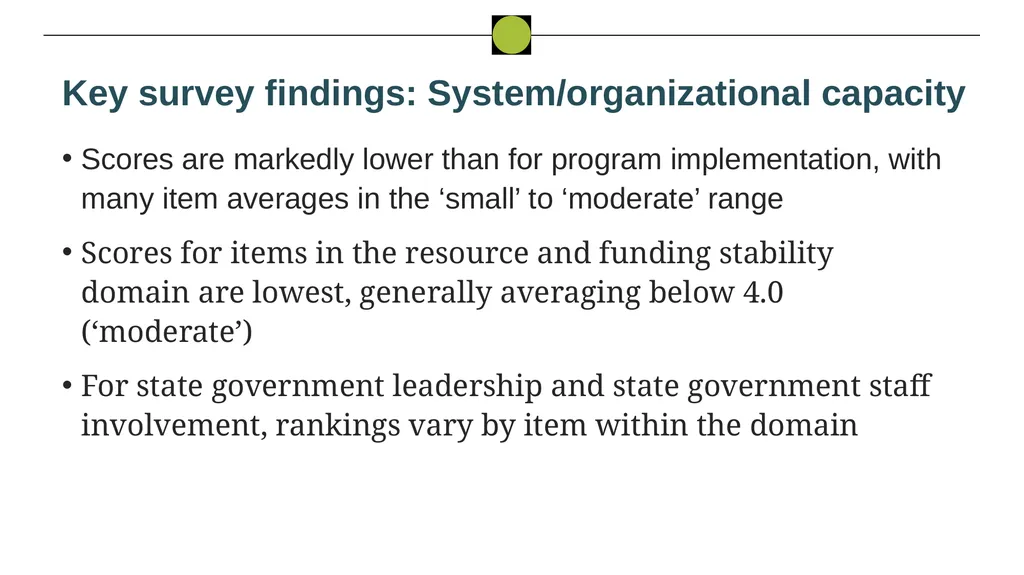
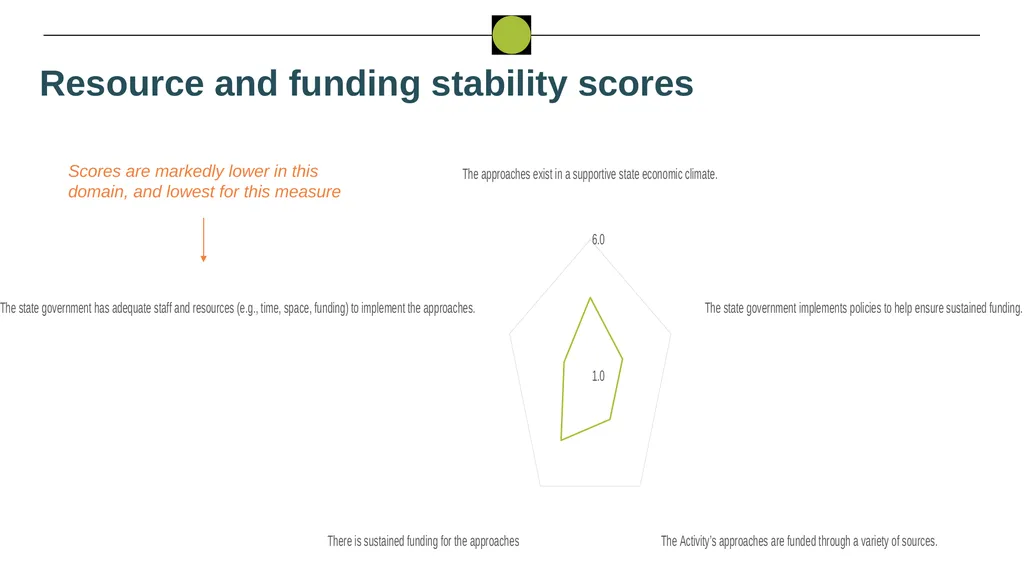
Key survey findings: System/organizational capacity Scores are markedly lower than for program implementation, with many item averages in the ‘small’ to ‘moderate’ range
Scores for items in the resource and funding stability domain are lowest, generally averaging below 4.0 (‘moderate’)
For state government leadership and state government staff involvement, rankings vary by item within the domain<br>
Scores for items in the resource and funding stability domain are lowest, generally averaging below 4.0 (‘moderate’)
For state government leadership and state government staff involvement, rankings vary by item within the domain<br>
71
Resource and funding stability scores Scores are markedly lower in this domain, and lowest for this measure<br>
72
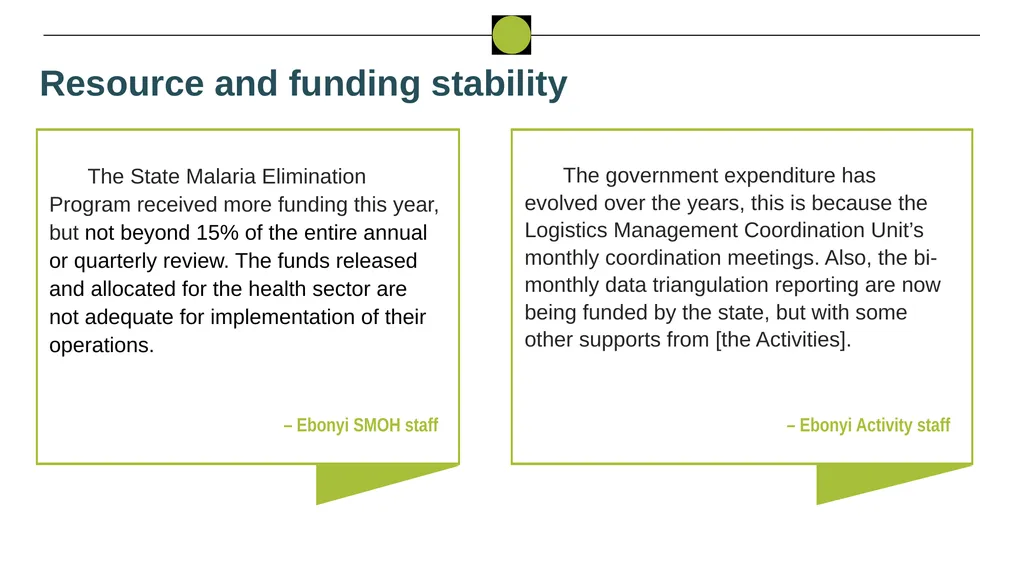
Resource and funding stability The State Malaria Elimination Program received more funding this year, but not beyond 15% of the entire annual or quarterly review. The funds released and allocated for the health sector are not adequate for implementation of their operations. – Ebonyi SMOH staff The government expenditure has evolved over the years, this is because the Logistics Management Coordination Unit’s monthly coordination meetings. Also, the bi-monthly data triangulation reporting are now being funded by the state, but with some other supports from [the Activities]. – Ebonyi Activity staff<br>
73
State government leadership competence scores Scores are highest on this measure Scores are lowest on this measure<br>
74
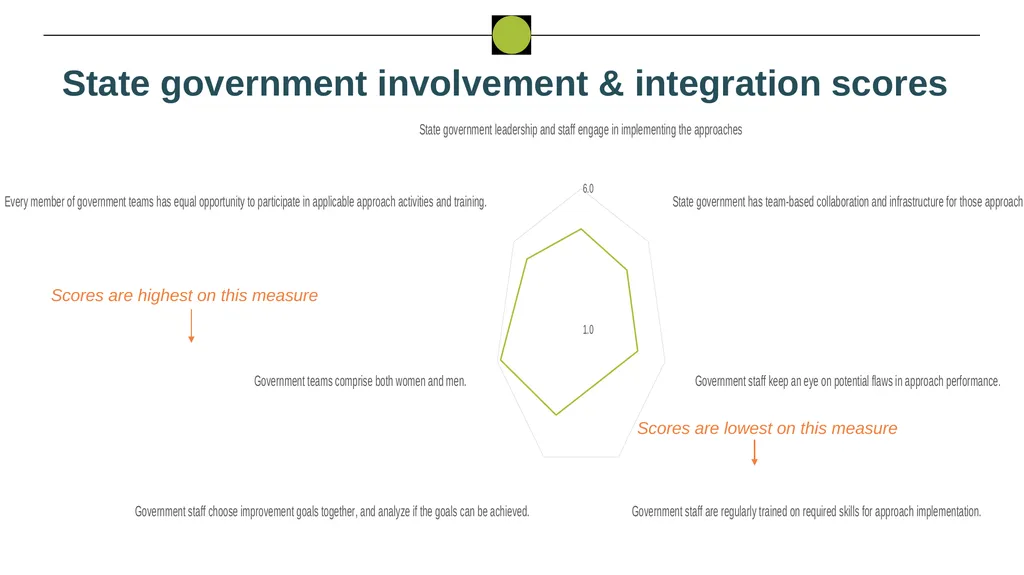
State government involvement & integration scores Scores are highest on this measure Scores are lowest on this measure<br>
75
Baseline findings on sustainability: Ebonyi
D. Enabling environment<br>
D. Enabling environment<br>
76
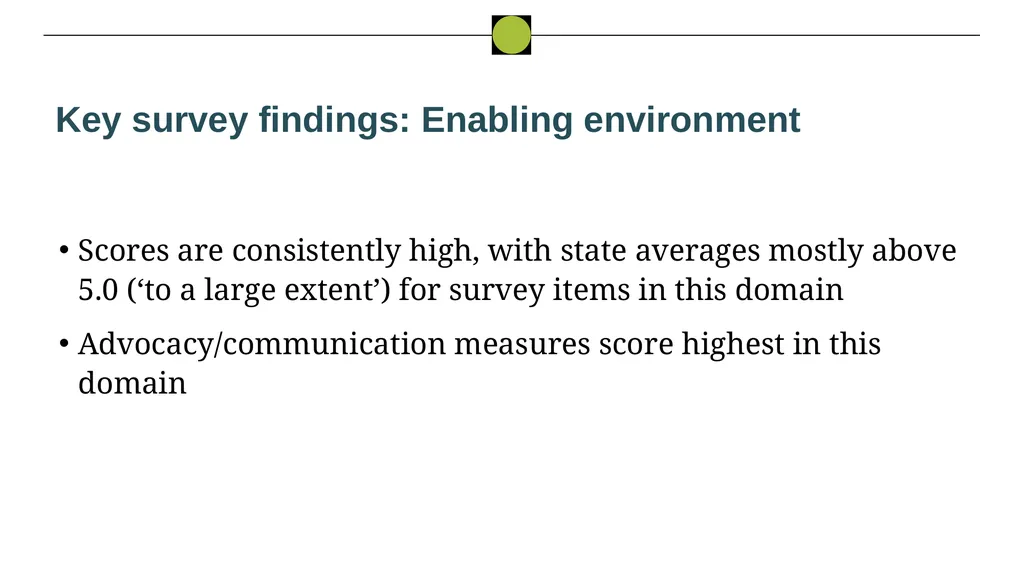
Key survey findings: Enabling environment Scores are consistently high, with state averages mostly above 5.0 (‘to a large extent’) for survey items in this domain
Advocacy/communication measures score highest in this domain<br>
Advocacy/communication measures score highest in this domain<br>
77
Advocacy/communications scores Scores are largely consistent across all measures<br>
78
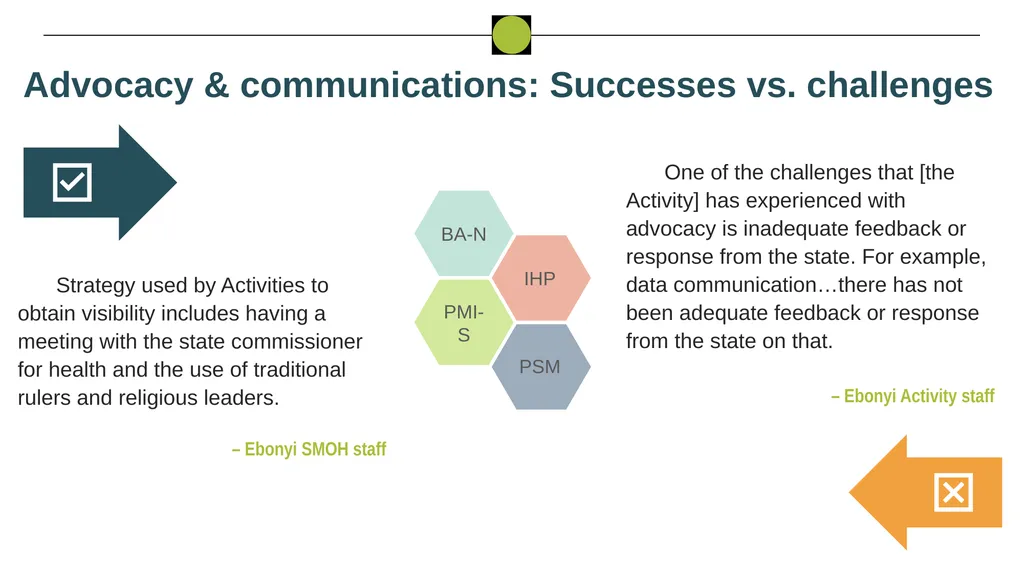
Advocacy & communications: Successes vs. challenges Strategy used by Activities to obtain visibility includes having a meeting with the state commissioner for health and the use of traditional rulers and religious leaders.
– Ebonyi SMOH staff One of the challenges that [the Activity] has experienced with advocacy is inadequate feedback or response from the state. For example, data communication…there has not been adequate feedback or response from the state on that.
– Ebonyi Activity staff<br>
– Ebonyi SMOH staff One of the challenges that [the Activity] has experienced with advocacy is inadequate feedback or response from the state. For example, data communication…there has not been adequate feedback or response from the state on that.
– Ebonyi Activity staff<br>
79
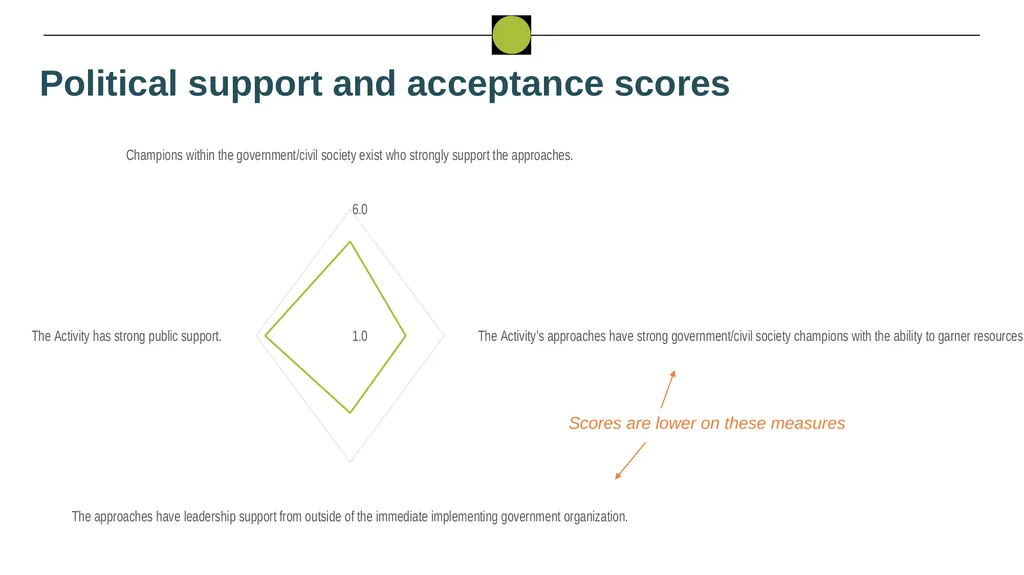
Political support and acceptance scores Scores are lower on these measures<br>
80
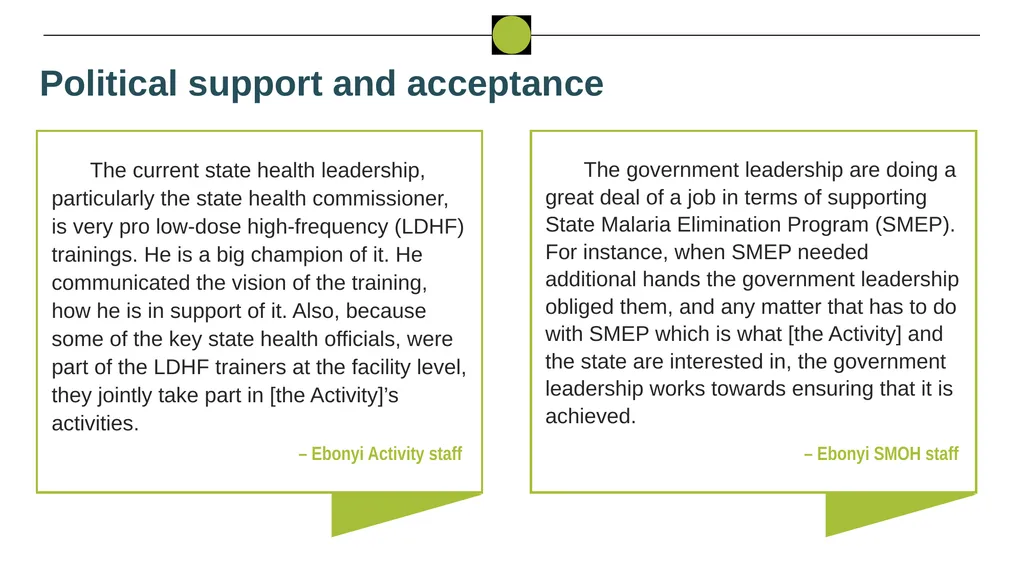
Political support and acceptance The current state health leadership, particularly the state health commissioner, is very pro low-dose high-frequency (LDHF) trainings. He is a big champion of it. He communicated the vision of the training, how he is in support of it. Also, because some of the key state health officials, were part of the LDHF trainers at the facility level, they jointly take part in [the Activity]’s activities. – Ebonyi Activity staff The government leadership are doing a great deal of a job in terms of supporting State Malaria Elimination Program (SMEP). For instance, when SMEP needed additional hands the government leadership obliged them, and any matter that has to do with SMEP which is what [the Activity] and the state are interested in, the government leadership works towards ensuring that it is achieved. – Ebonyi SMOH staff<br>
81
Baseline findings on sustainability: Ebonyi
E. Fostering sustainability in practice<br>
E. Fostering sustainability in practice<br>
82
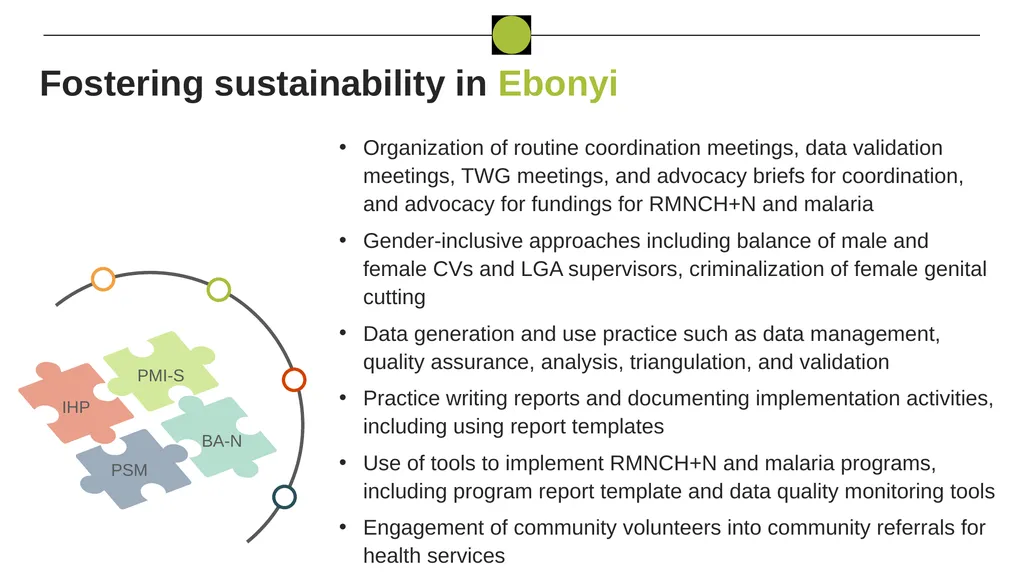
Fostering sustainability in Ebonyi Organization of routine coordination meetings, data validation meetings, TWG meetings, and advocacy briefs for coordination, and advocacy for fundings for RMNCH+N and malaria
Gender-inclusive approaches including balance of male and female CVs and LGA supervisors, criminalization of female genital cutting
Data generation and use practice such as data management, quality assurance, analysis, triangulation, and validation
Practice writing reports and documenting implementation activities, including using report templates
Use of tools to implement RMNCH+N and malaria programs, including program report template and data quality monitoring tools
Engagement of community volunteers into community referrals for health services<br>
Gender-inclusive approaches including balance of male and female CVs and LGA supervisors, criminalization of female genital cutting
Data generation and use practice such as data management, quality assurance, analysis, triangulation, and validation
Practice writing reports and documenting implementation activities, including using report templates
Use of tools to implement RMNCH+N and malaria programs, including program report template and data quality monitoring tools
Engagement of community volunteers into community referrals for health services<br>
83
Collaboration and coordination<br>
84
Steps in the organizational network analysis (ONA) HPN Activity implementers each identified up to 10 collaborating organizations; implementers and collaborators completed the survey
At the start of the survey, each respondent named “the 10 main organizations that your organization coordinates with [for HPN Activities]” – some of these nominees were also respondents
Respondents were asked about resource and information exchange with each organization they nominated in step 2, and the responses were used to generate network data and diagrams<br>
At the start of the survey, each respondent named “the 10 main organizations that your organization coordinates with [for HPN Activities]” – some of these nominees were also respondents
Respondents were asked about resource and information exchange with each organization they nominated in step 2, and the responses were used to generate network data and diagrams<br>
85
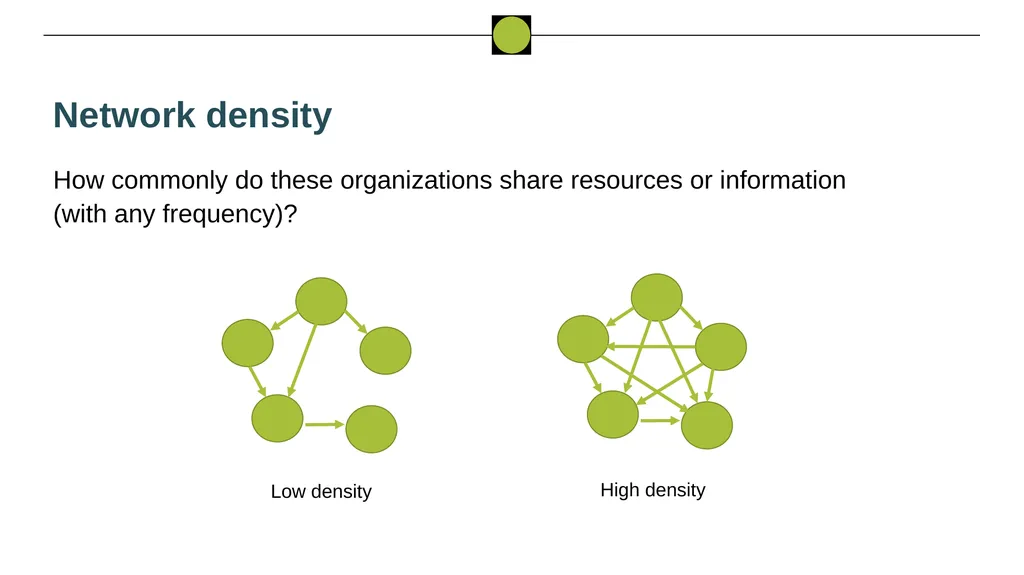
Network density How commonly do these organizations share resources or information (with any frequency)? Low density High density<br>
86
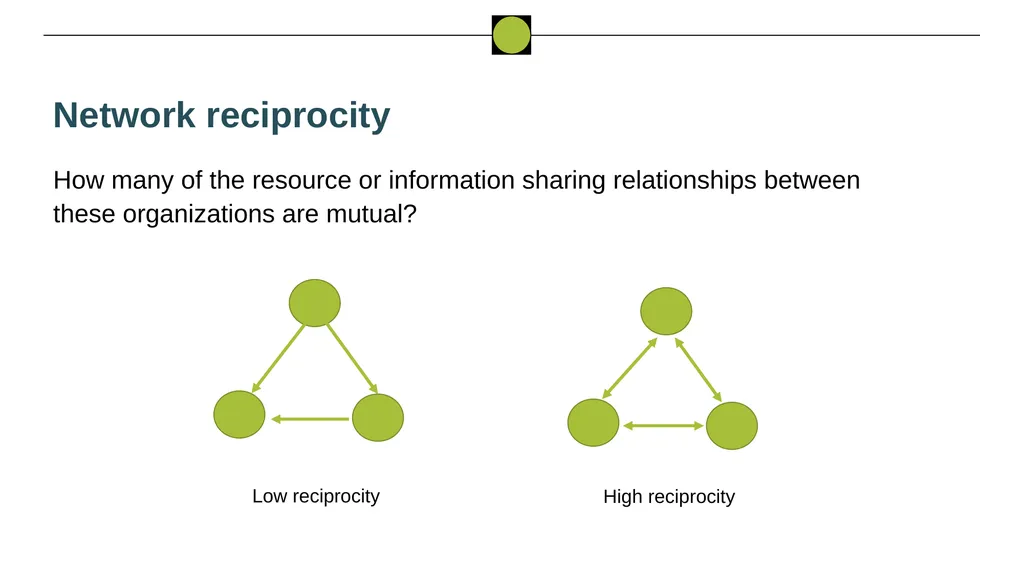
Network reciprocity How many of the resource or information sharing relationships between these organizations are mutual? Low reciprocity High reciprocity<br>
87
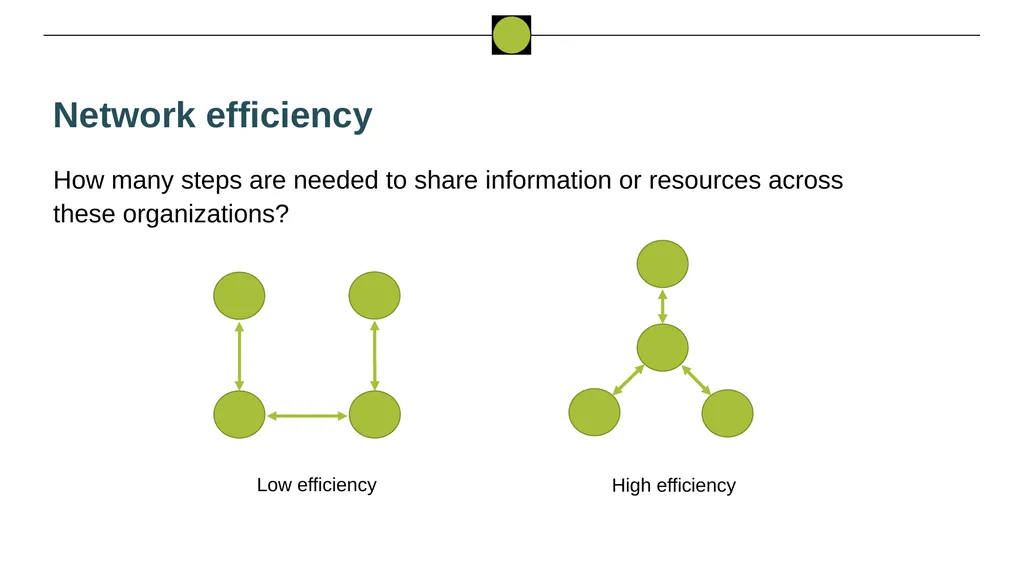
Network efficiency How many steps are needed to share information or resources across these organizations? Low efficiency High efficiency<br>
88
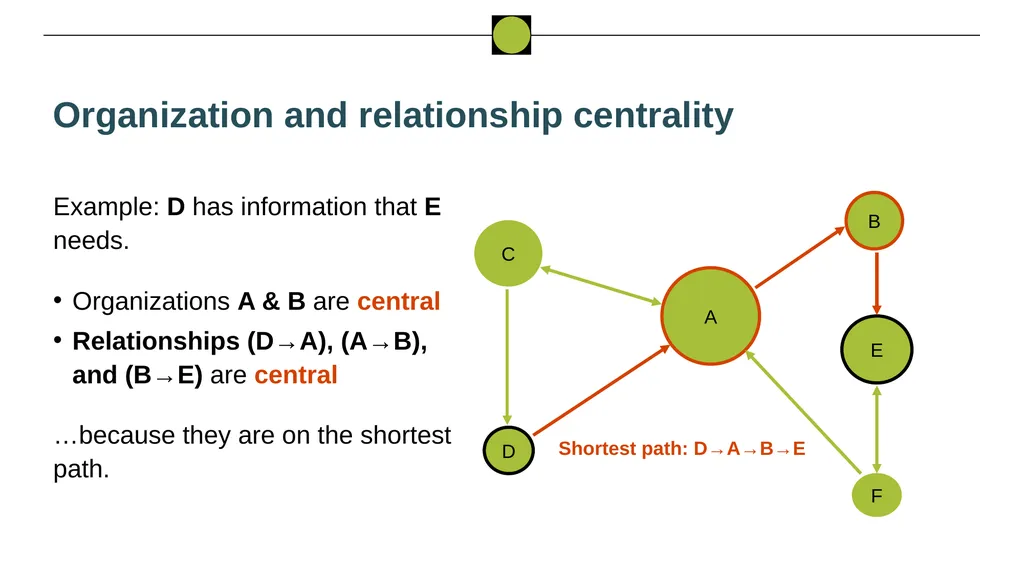
Organization and relationship centrality Example: D has information that E needs.
Organizations A & B are central
Relationships (D→A), (A→B), and (B→E) are central
…because they are on the shortest path. Shortest path: D→A→B→E<br>
Organizations A & B are central
Relationships (D→A), (A→B), and (B→E) are central
…because they are on the shortest path. Shortest path: D→A→B→E<br>
89
ONA is primarily a tool for discussion Network Survey Limitations
The survey only asked about selected kinds of networking
The number of respondents and nominees was limited for practicality
Different individuals representing the same organizations might have nominated different collaborators and answered other questions differently
Challenges with network modeling
No standard exists for “good” results on network measures; observing changes over time can be more instructive
Network characteristics involve trade-offs: efficiency versus resilience, costs associated with increasing the number of connections
Networks are not a perfect model of the world – they can be used as a tool for thinking about and discussing practical activities.<br>
The survey only asked about selected kinds of networking
The number of respondents and nominees was limited for practicality
Different individuals representing the same organizations might have nominated different collaborators and answered other questions differently
Challenges with network modeling
No standard exists for “good” results on network measures; observing changes over time can be more instructive
Network characteristics involve trade-offs: efficiency versus resilience, costs associated with increasing the number of connections
Networks are not a perfect model of the world – they can be used as a tool for thinking about and discussing practical activities.<br>
90
What questions does this ONA answer (and raise)? Generally, is there a lot of resource and information exchange happening? Which organizations and relationships are most central to it?
Ask: what did you expect to see, and how does this compare to what the analysis showed? What are the possible reasons for any differences?
Which potential relationships would have the largest positive effects on the efficiency of resource and information exchange?
Ask: is higher efficiency important? Why? Are these relationships feasible?
Which potential relationships involving an HPN Activity implementer would increase the centrality of government organizations the most?
Ask: is government centrality a good proxy for sustainability? What else might be?<br>
Ask: what did you expect to see, and how does this compare to what the analysis showed? What are the possible reasons for any differences?
Which potential relationships would have the largest positive effects on the efficiency of resource and information exchange?
Ask: is higher efficiency important? Why? Are these relationships feasible?
Which potential relationships involving an HPN Activity implementer would increase the centrality of government organizations the most?
Ask: is government centrality a good proxy for sustainability? What else might be?<br>
91
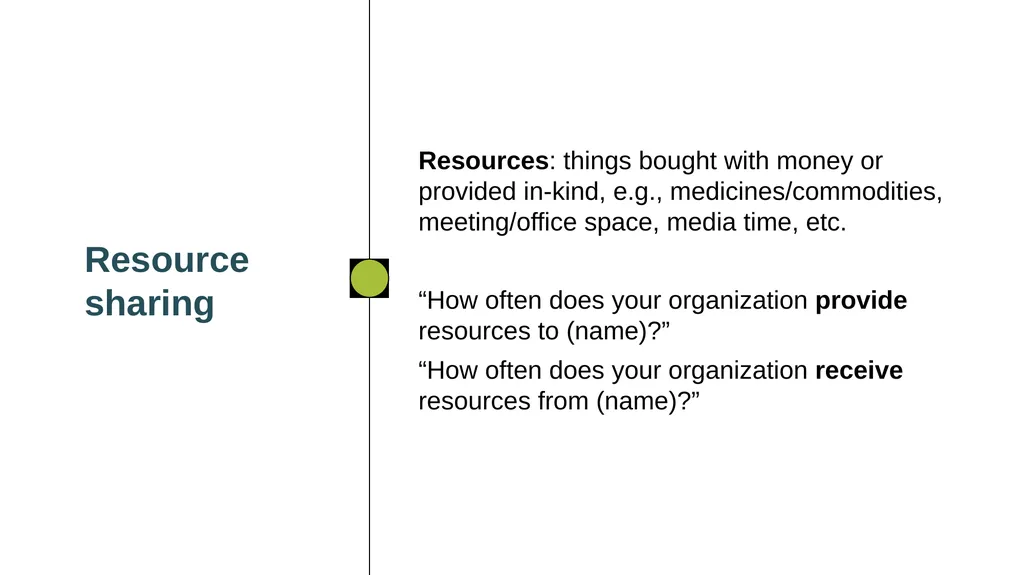
Resource sharing Resources: things bought with money or provided in-kind, e.g., medicines/commodities, meeting/office space, media time, etc.
“How often does your organization provide resources to (name)?”
“How often does your organization receive resources from (name)?”<br>
“How often does your organization provide resources to (name)?”
“How often does your organization receive resources from (name)?”<br>
92
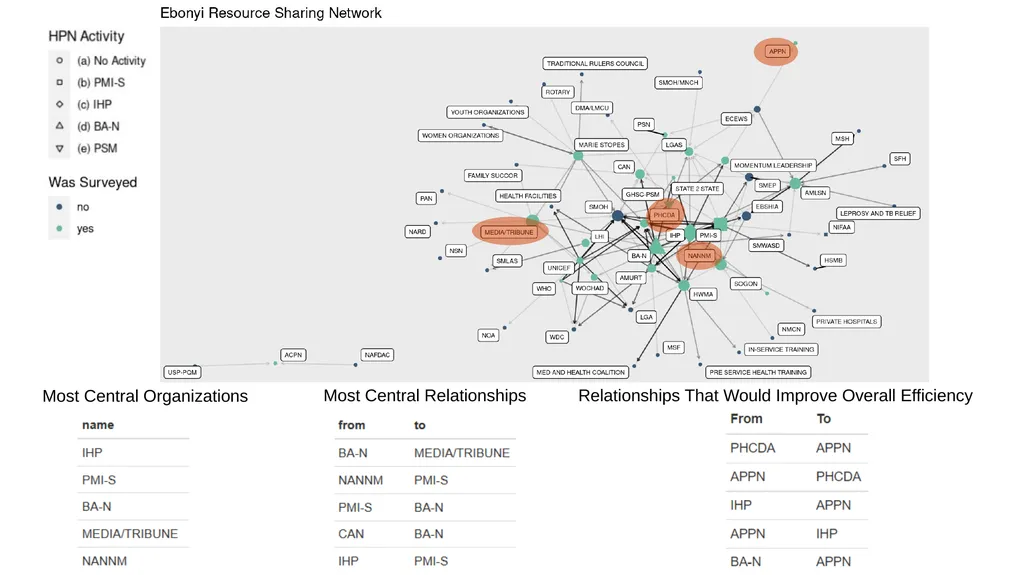
Most Central Organizations Most Central Relationships Relationships That Would Improve Overall Efficiency<br>
93
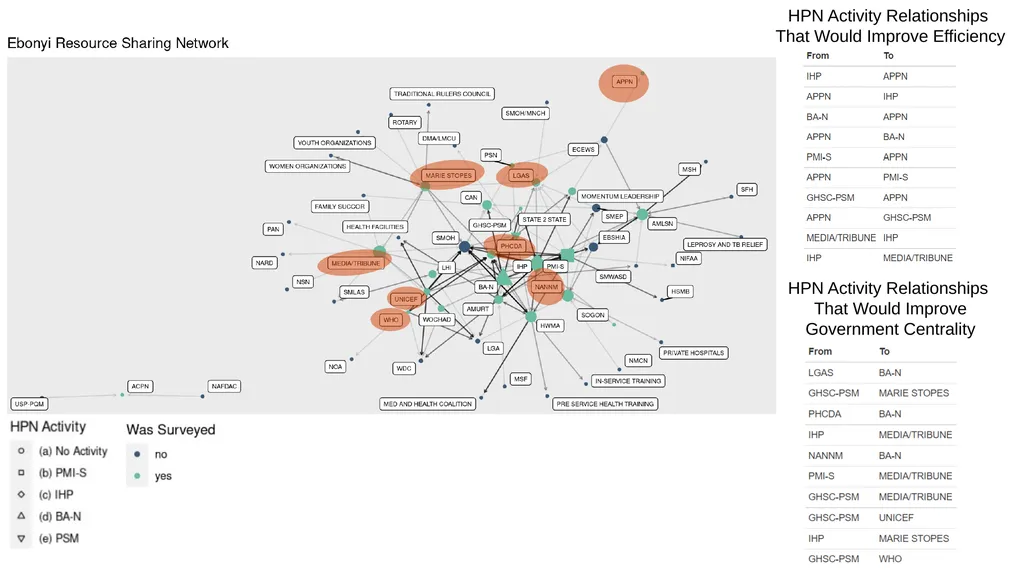
HPN Activity Relationships
That Would Improve Efficiency HPN Activity Relationships
That Would Improve Government Centrality<br>
That Would Improve Efficiency HPN Activity Relationships
That Would Improve Government Centrality<br>
94
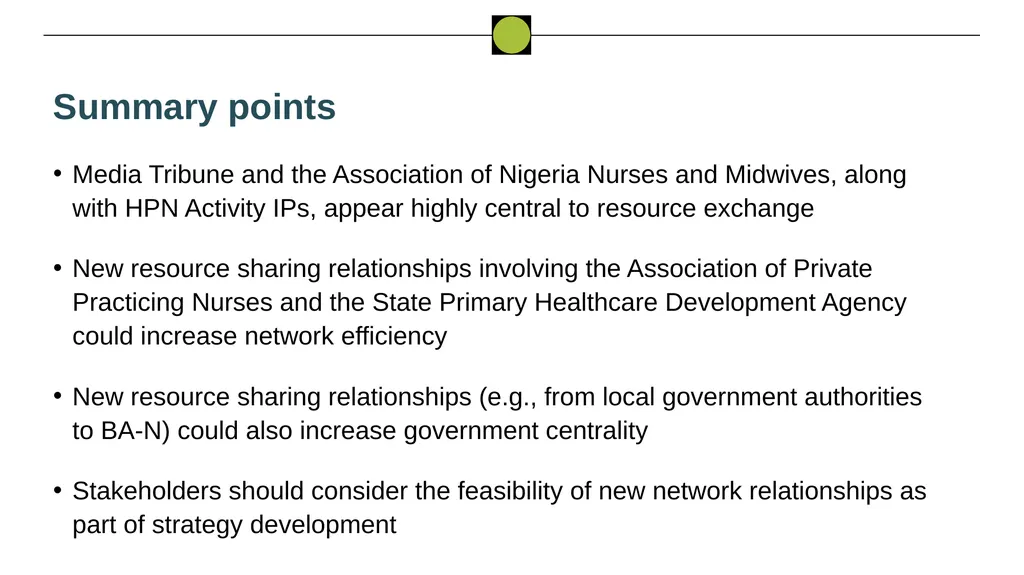
Summary points Media Tribune and the Association of Nigeria Nurses and Midwives, along with HPN Activity IPs, appear highly central to resource exchange
New resource sharing relationships involving the Association of Private Practicing Nurses and the State Primary Healthcare Development Agency could increase network efficiency
New resource sharing relationships (e.g., from local government authorities to BA-N) could also increase government centrality
Stakeholders should consider the feasibility of new network relationships as part of strategy development<br>
New resource sharing relationships involving the Association of Private Practicing Nurses and the State Primary Healthcare Development Agency could increase network efficiency
New resource sharing relationships (e.g., from local government authorities to BA-N) could also increase government centrality
Stakeholders should consider the feasibility of new network relationships as part of strategy development<br>
95
Information sharing Information: technical, training, educational, both formal and informal.
“How often does your organization provide information to (name)?”
“How often does your organization receive information from (name)?”<br>
“How often does your organization provide information to (name)?”
“How often does your organization receive information from (name)?”<br>
96
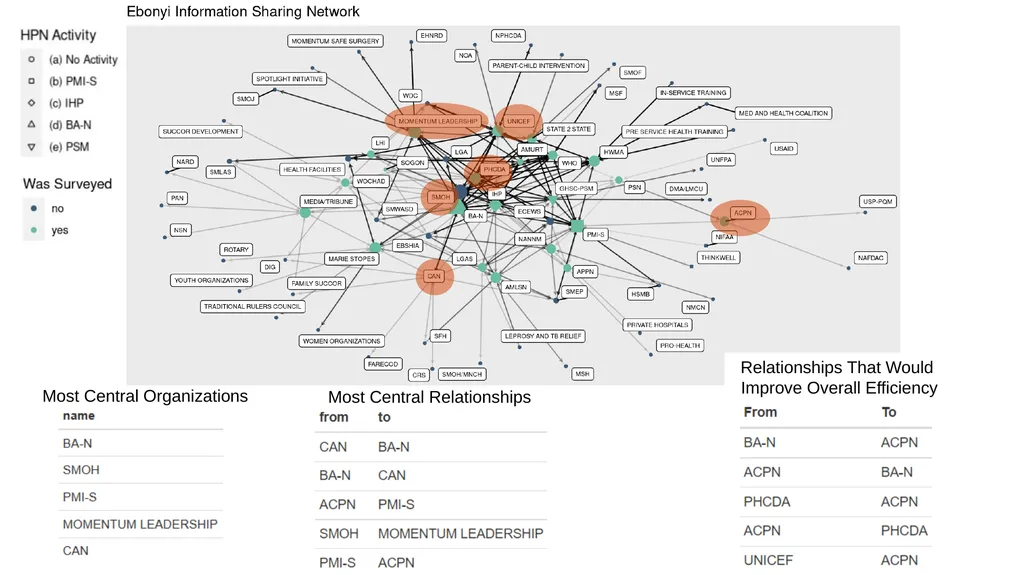
Most Central Organizations Most Central Relationships Relationships That Would
Improve Overall Efficiency<br>
Improve Overall Efficiency<br>
97
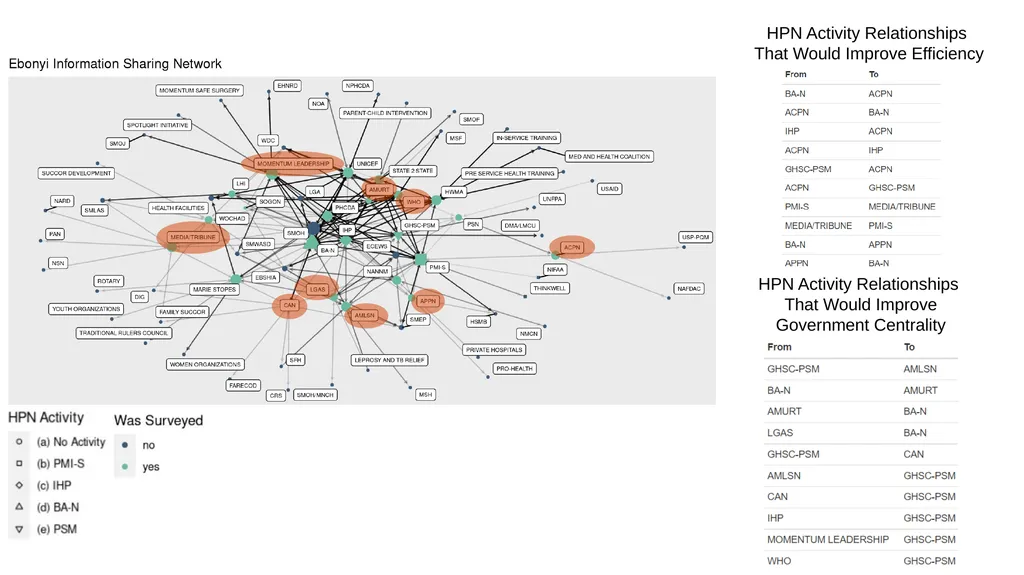
HPN Activity Relationships
That Would Improve Efficiency HPN Activity Relationships
That Would Improve Government Centrality<br>
That Would Improve Efficiency HPN Activity Relationships
That Would Improve Government Centrality<br>
98
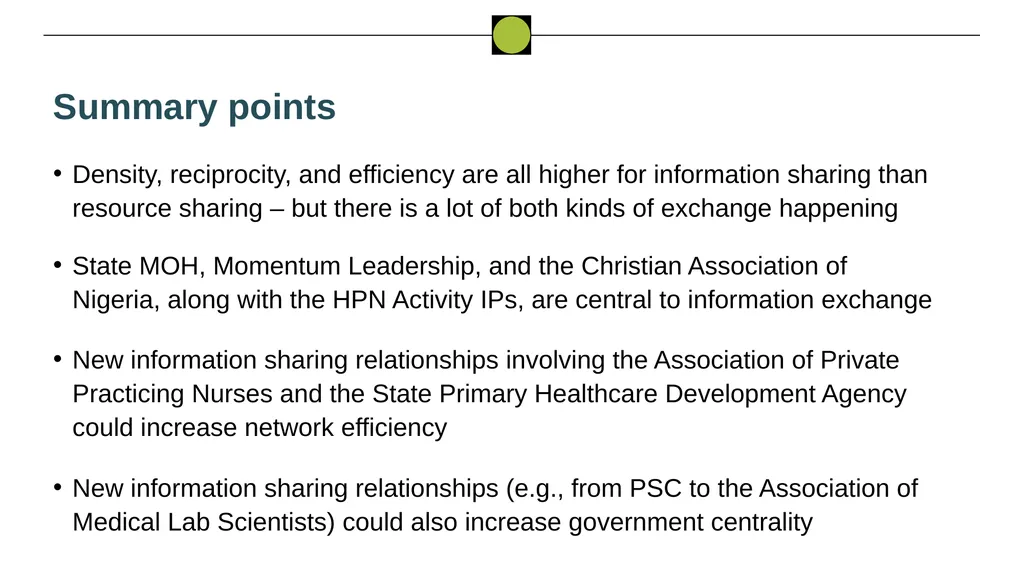
Summary points Density, reciprocity, and efficiency are all higher for information sharing than resource sharing – but there is a lot of both kinds of exchange happening
State MOH, Momentum Leadership, and the Christian Association of Nigeria, along with the HPN Activity IPs, are central to information exchange
New information sharing relationships involving the Association of Private Practicing Nurses and the State Primary Healthcare Development Agency could increase network efficiency
New information sharing relationships (e.g., from PSC to the Association of Medical Lab Scientists) could also increase government centrality<br>
State MOH, Momentum Leadership, and the Christian Association of Nigeria, along with the HPN Activity IPs, are central to information exchange
New information sharing relationships involving the Association of Private Practicing Nurses and the State Primary Healthcare Development Agency could increase network efficiency
New information sharing relationships (e.g., from PSC to the Association of Medical Lab Scientists) could also increase government centrality<br>
99
For more information, contact: Emmanuel Adegbe
eadegbe.fpcape@gmail.com
08036243309
Milissa Markiewicz
milissa@unc.edu
Data for Impact (D4I)
https://www.data4impactproject.org/<br>
eadegbe.fpcape@gmail.com
08036243309
Milissa Markiewicz
milissa@unc.edu
Data for Impact (D4I)
https://www.data4impactproject.org/<br>
100
This presentation was produced with the support of the United States Agency for International Development (USAID) under the terms of the Data for Impact (D4I) associate award 7200AA18LA00008, which is implemented by the Carolina Population Center at the University of North Carolina at Chapel Hill, in partnership with Palladium International, LLC; ICF Macro, Inc.; John Snow, Inc.; and Tulane University. The views expressed in this publication do not necessarily reflect the views of USAID or the United States government.
www.data4impactproject.org<br>
www.data4impactproject.org<br>
101
Malaria Service Availability All facilities offer malaria diagnostic and treatment services, and 99% provide IPTp. Percentage of Ebonyi health facilities that offer specific malaria services (N=120) Malaria diagnosis Malaria treatment IPTp<br>
102
General Service Readiness GEN-SR: Percentage of Ebonyi health facilities that have essential medicines available (N=120) 71% of facilities have all essential medicines available
Mean percentage of essential medicines available at a facility: 81% GEN-SR: Percentage of Ebonyi health facilities that have basic consumables available (N=120) 63% of facilities have all basic consumables available
Mean percentage of basic consumables available at a facility: 91%<br>
Mean percentage of essential medicines available at a facility: 81% GEN-SR: Percentage of Ebonyi health facilities that have basic consumables available (N=120) 63% of facilities have all basic consumables available
Mean percentage of basic consumables available at a facility: 91%<br>
103
Malaria Services Availability 100% of facilities in Ebonyi offer malaria services MA-SA: Percentage of Ebonyi health facilities that offer specific malaria services (N=120) MA-DT: Percentage of Ebonyi health facilities that offer specific malaria diagnostic services (N=120)<br>
104
Analytical Approaches Quantitative Performance Evaluation Design:
Trend analysis between baseline and endline in each state
Comparison of trends across the three case study states
Baseline results: descriptive statistics by state Limitations Evaluation baseline is not a baseline for individual Activities
Clinical vignette, provider norms, and gender attitudes measurement approaches capture hypothetical reported behaviors, not actual behaviors
Providers may not report everything they would do spontaneously in the vignettes (front of mind responses)<br>
Trend analysis between baseline and endline in each state
Comparison of trends across the three case study states
Baseline results: descriptive statistics by state Limitations Evaluation baseline is not a baseline for individual Activities
Clinical vignette, provider norms, and gender attitudes measurement approaches capture hypothetical reported behaviors, not actual behaviors
Providers may not report everything they would do spontaneously in the vignettes (front of mind responses)<br>
105
Provider Gender Attitudes 13 statements related to RMNH service provision and QOC EFA resulted in nine-item gender attitude scale (Cronbach’s alpha = 0.74)
Higher score/disagreement indicates more gender equitable attitude, range 1-4
Ebonyi: 3.1 Example Statements:
Percent of providers who disagree/strongly disagree with statement, by state Distribution of EFA-adjusted provider gender attitudes scores, Ebonyi (N = 354) Notes: Vertical dashed lines indicate state-level mean scores. Doyle K, Kazimbaya S, Levtov R, et al. The relationship between inequitable gender norms and provider attitudes and quality of care in maternal health services in Rwanda: a mixed methods study. BMC Pregnancy and Childbirth. 2021;21(156).<br>
Higher score/disagreement indicates more gender equitable attitude, range 1-4
Ebonyi: 3.1 Example Statements:
Percent of providers who disagree/strongly disagree with statement, by state Distribution of EFA-adjusted provider gender attitudes scores, Ebonyi (N = 354) Notes: Vertical dashed lines indicate state-level mean scores. Doyle K, Kazimbaya S, Levtov R, et al. The relationship between inequitable gender norms and provider attitudes and quality of care in maternal health services in Rwanda: a mixed methods study. BMC Pregnancy and Childbirth. 2021;21(156).<br>
106
Gender-Sensitive Community RMNH QOC Norms Nine statements: Attitudes and beliefs about gender-sensitive communication, addressing GBV, and promoting individual agency EFA yielded six-item scale (Cronbach’s alpha = 0.77)
Higher score/disagreement indicates more gender equitable norms, range 1-4
Ebonyi: 3.3 Example Statements:
Percent of providers who disagree/strongly disagree with statement Distribution of EFA-adjusted LGA Gender Norms Score , Ebonyi (N = 354) Notes: Vertical dashed lines indicate state-level mean scores. Doyle K, Kazimbaya S, Levtov R, et al. The relationship between inequitable gender norms and provider attitudes and quality of care in maternal health services in Rwanda: a mixed methods study. BMC Pregnancy and Childbirth. 2021;21(156).
D4I Family Planning Provider Gender Competency Assessment Tool. (under development)<br>
Higher score/disagreement indicates more gender equitable norms, range 1-4
Ebonyi: 3.3 Example Statements:
Percent of providers who disagree/strongly disagree with statement Distribution of EFA-adjusted LGA Gender Norms Score , Ebonyi (N = 354) Notes: Vertical dashed lines indicate state-level mean scores. Doyle K, Kazimbaya S, Levtov R, et al. The relationship between inequitable gender norms and provider attitudes and quality of care in maternal health services in Rwanda: a mixed methods study. BMC Pregnancy and Childbirth. 2021;21(156).
D4I Family Planning Provider Gender Competency Assessment Tool. (under development)<br>