
Nitrous Oxide (N2O) and Stratospheric Ozone Layer
OM
Published · 26 slides · 0 views

1 / 1


Description
Nitrous Oxide (N2O) and Stratospheric Ozone Layer Depletion Nitrous Oxide (N2O): The Dominant Ozone-Depleting Substance Emitted in the 21st Century, A. R. Ravishankara, John S. Daniel, and Robert W. Portmann, SCIENCE, Vol. 326, Pages:
Related Topics
Download this presentation From Below
"Nitrous Oxide (N2O) and Stratospheric Ozone Layer" is the property of its rightful owner. Permission is granted to download and print the materials on this website for personal, non-commercial use only, and to display it on your personal computer provided you do not modify the materials and that you retain all copyright notices contained in the materials. By downloading content from our website, you accept the terms of this agreement.
Share
Embed code
Presentation Transcript
01
Nitrous Oxide (N2O) and Stratospheric Ozone Layer Depletion Nitrous Oxide (N2O): The Dominant Ozone-Depleting Substance Emitted in the 21st Century, A. R. Ravishankara, John S. Daniel, and Robert W. Portmann, SCIENCE, Vol. 326, Pages: 123-125, 2009 (OCT 2)
Options to accelerate ozone recovery: ozone and climate benefits, J. S. Daniel, E. L. Fleming, G. J. M. Velders, C. H. Jackman, and A. R. Ravishankara, Atoms. Chem. Phys., 10, 7697-7707, 2010.
Ozone depletion due to N2O: influences of other gases, R. W. Portmann, J. S. Daniel, A. R. Ravishankara, Phil. Trans. .Royal Soc., B (Biology), The proceedings of the discussion meeting entitled ‘Nitrous oxide, the forgotten greenhouse gas’, held between 23-24 May, 2011 at The Royal Society Kavli Centre. In press, 2011/2012. A. R. Ravishankara
Earth System Research Laboratory, Chemical Sciences Division, National Oceanic and Atmospheric Administration,
Boulder, CO, USA Disclaimer:
I am not talking as a co-Chair of WMO/ENEP SAP panel
Opinions expressed are mine and not necessarily those of NOAA<br>
Options to accelerate ozone recovery: ozone and climate benefits, J. S. Daniel, E. L. Fleming, G. J. M. Velders, C. H. Jackman, and A. R. Ravishankara, Atoms. Chem. Phys., 10, 7697-7707, 2010.
Ozone depletion due to N2O: influences of other gases, R. W. Portmann, J. S. Daniel, A. R. Ravishankara, Phil. Trans. .Royal Soc., B (Biology), The proceedings of the discussion meeting entitled ‘Nitrous oxide, the forgotten greenhouse gas’, held between 23-24 May, 2011 at The Royal Society Kavli Centre. In press, 2011/2012. A. R. Ravishankara
Earth System Research Laboratory, Chemical Sciences Division, National Oceanic and Atmospheric Administration,
Boulder, CO, USA Disclaimer:
I am not talking as a co-Chair of WMO/ENEP SAP panel
Opinions expressed are mine and not necessarily those of NOAA<br>
02
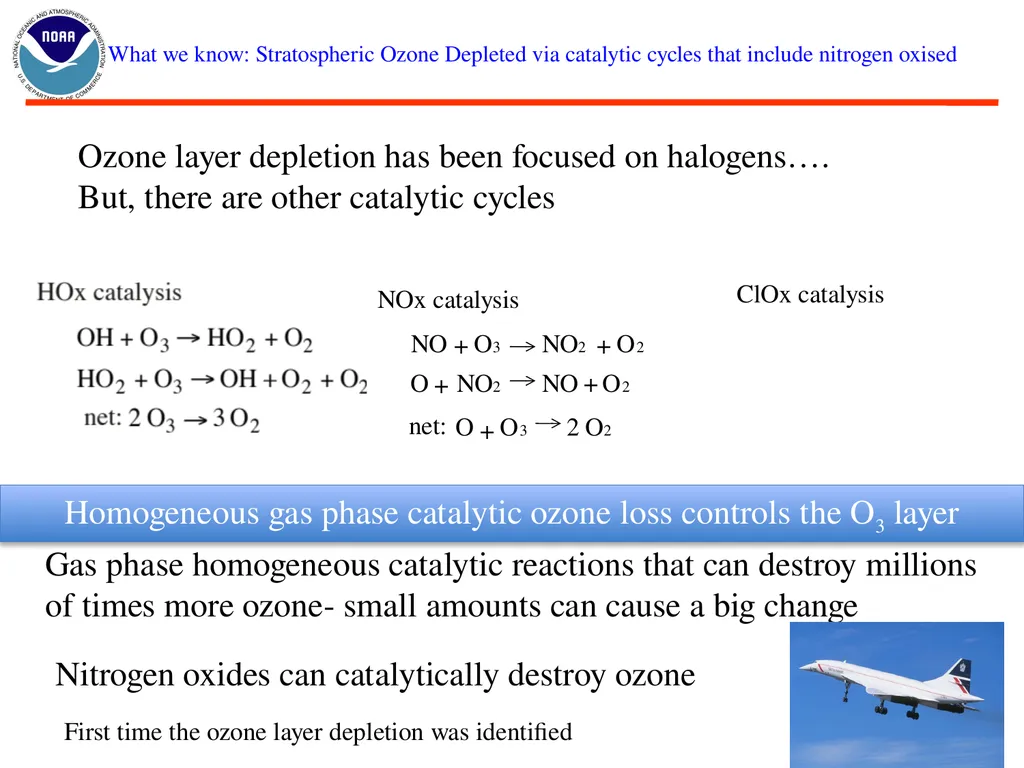
What we know: Stratospheric Ozone Depleted via catalytic cycles that include nitrogen oxised Homogeneous gas phase catalytic ozone loss controls the O3 layer Gas phase homogeneous catalytic reactions that can destroy millions of times more ozone- small amounts can cause a big change ClOx catalysis Nitrogen oxides can catalytically destroy ozone First time the ozone layer depletion was identified Ozone layer depletion has been focused on halogens….
But, there are other catalytic cycles<br>
But, there are other catalytic cycles<br>
03
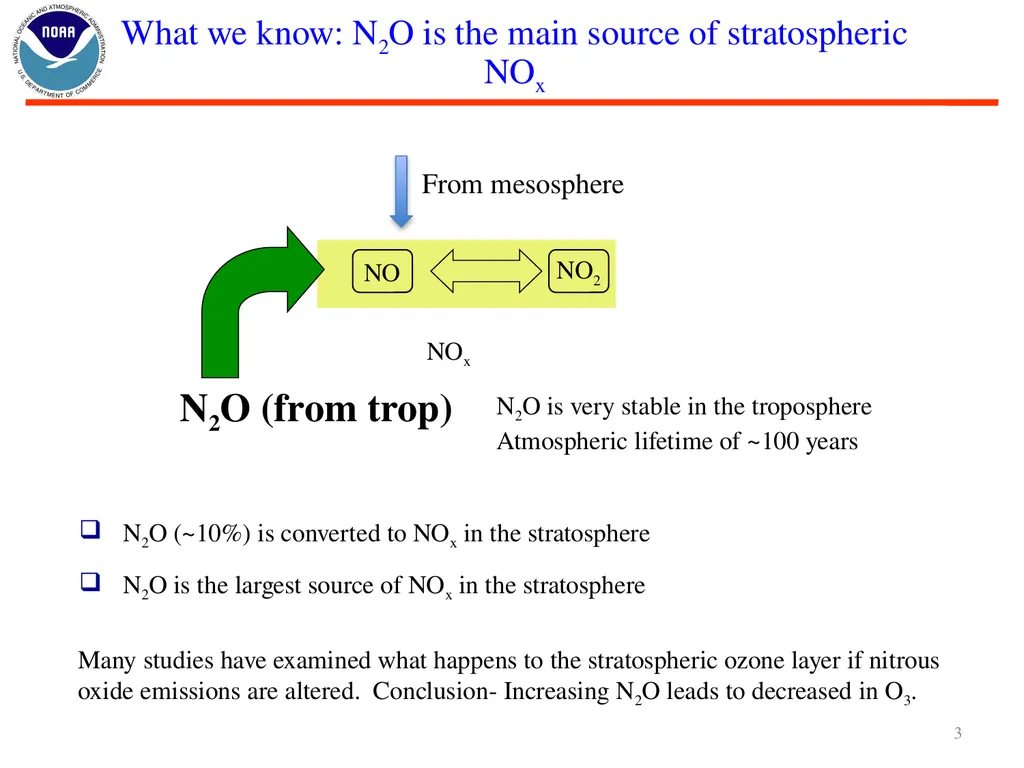
What we know: N2O is the main source of stratospheric NOx N2O (~10%) is converted to NOx in the stratosphere
N2O is the largest source of NOx in the stratosphere N2O (from trop) NO NO2 NOx From mesosphere N2O is very stable in the troposphere
Atmospheric lifetime of ~100 years Many studies have examined what happens to the stratospheric ozone layer if nitrous oxide emissions are altered. Conclusion- Increasing N2O leads to decreased in O3. 3<br>
N2O is the largest source of NOx in the stratosphere N2O (from trop) NO NO2 NOx From mesosphere N2O is very stable in the troposphere
Atmospheric lifetime of ~100 years Many studies have examined what happens to the stratospheric ozone layer if nitrous oxide emissions are altered. Conclusion- Increasing N2O leads to decreased in O3. 3<br>
04
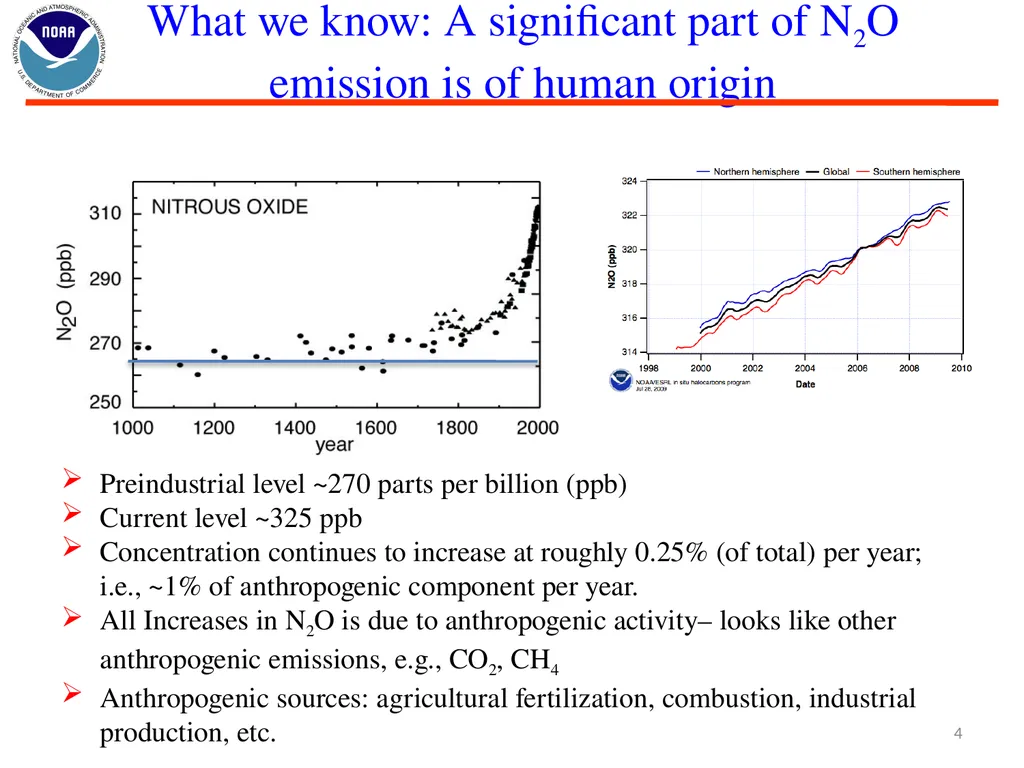
What we know: A significant part of N2O emission is of human origin Preindustrial level ~270 parts per billion (ppb)
Current level ~325 ppb
Concentration continues to increase at roughly 0.25% (of total) per year; i.e., ~1% of anthropogenic component per year.
All Increases in N2O is due to anthropogenic activity– looks like other anthropogenic emissions, e.g., CO2, CH4
Anthropogenic sources: agricultural fertilization, combustion, industrial production, etc. 4<br>
Current level ~325 ppb
Concentration continues to increase at roughly 0.25% (of total) per year; i.e., ~1% of anthropogenic component per year.
All Increases in N2O is due to anthropogenic activity– looks like other anthropogenic emissions, e.g., CO2, CH4
Anthropogenic sources: agricultural fertilization, combustion, industrial production, etc. 4<br>
05
What we know: Others have studied the effect of N2O increases on ozone layer Many studies have examined what happens to the stratospheric ozone layer if nitrous oxide emissions are altered
Examples:
Kinnison et al. (1988)
Randeniya et al. (2002)
Chipperfield and Feng (2003)
Konopka et al. (2007)
etc.
All indicate that ozone would decrease if N2O increases, as expected from emission trends 5<br>
Examples:
Kinnison et al. (1988)
Randeniya et al. (2002)
Chipperfield and Feng (2003)
Konopka et al. (2007)
etc.
All indicate that ozone would decrease if N2O increases, as expected from emission trends 5<br>
06
What we did 6 View anthropogenic N2O as a potential ozone depleting substance
- the same way as the ozone depleting substances (ODSs) controlled by the Montreal Protocol<br>
- the same way as the ozone depleting substances (ODSs) controlled by the Montreal Protocol<br>
07
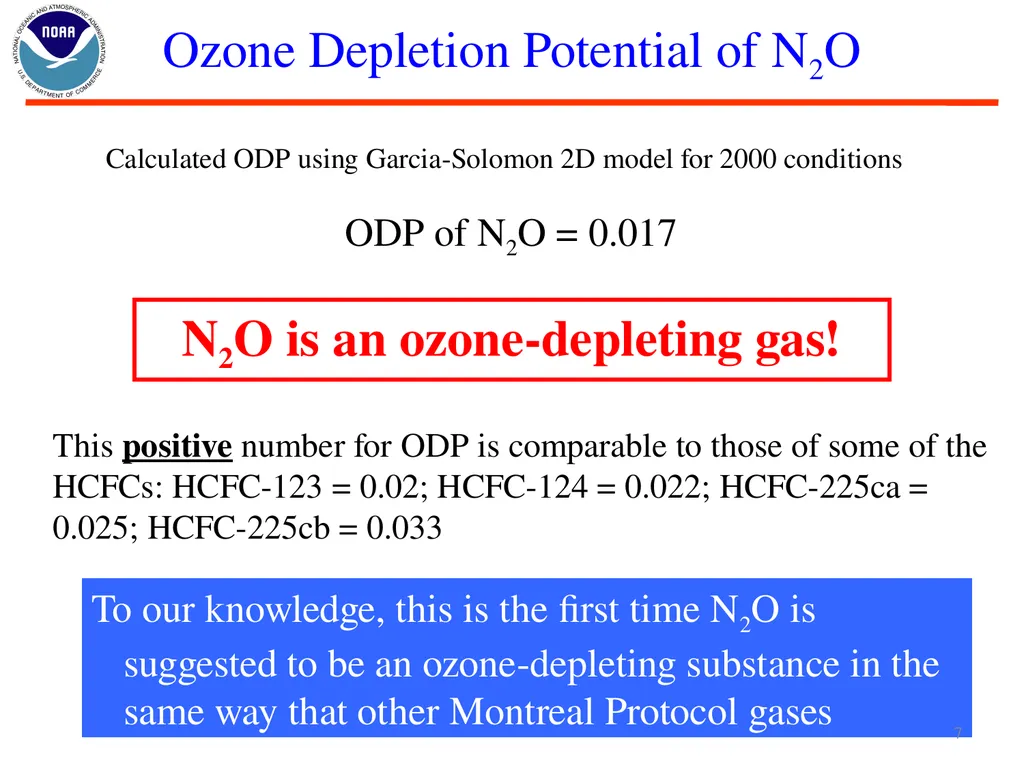
Ozone Depletion Potential of N2O This positive number for ODP is comparable to those of some of the HCFCs: HCFC-123 = 0.02; HCFC-124 = 0.022; HCFC-225ca = 0.025; HCFC-225cb = 0.033 Calculated ODP using Garcia-Solomon 2D model for 2000 conditions ODP of N2O = 0.017 N2O is an ozone-depleting gas! To our knowledge, this is the first time N2O is suggested to be an ozone-depleting substance in the same way that other Montreal Protocol gases 7<br>
08
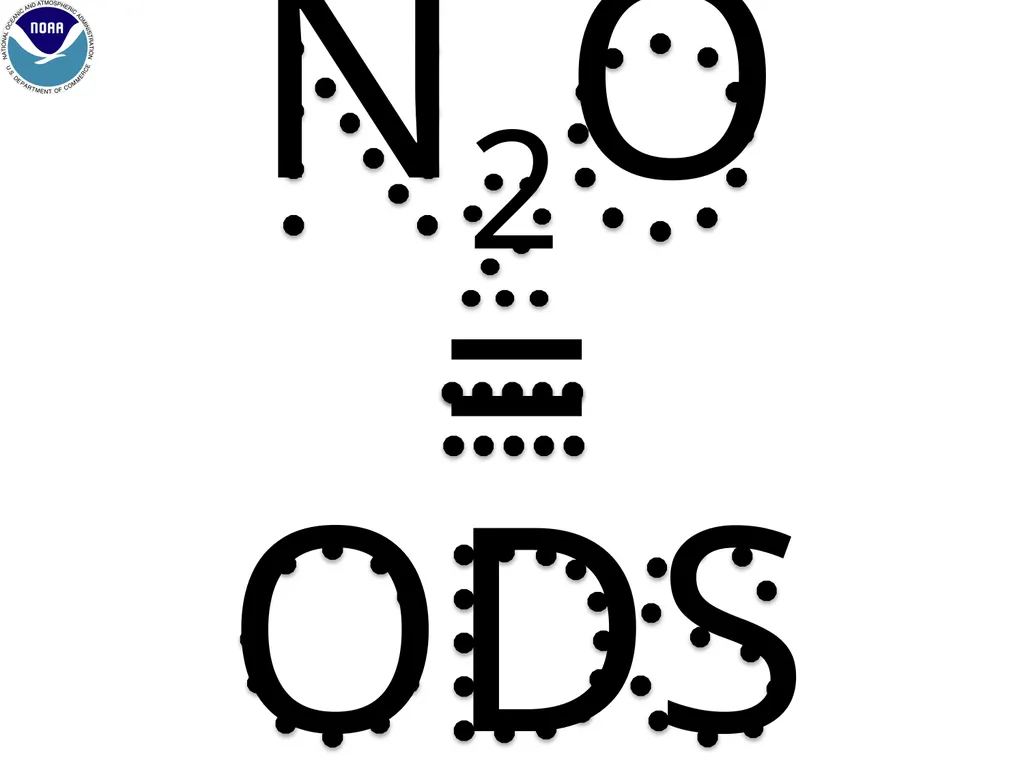
N2O
=
ODS<br>
=
ODS<br>
09
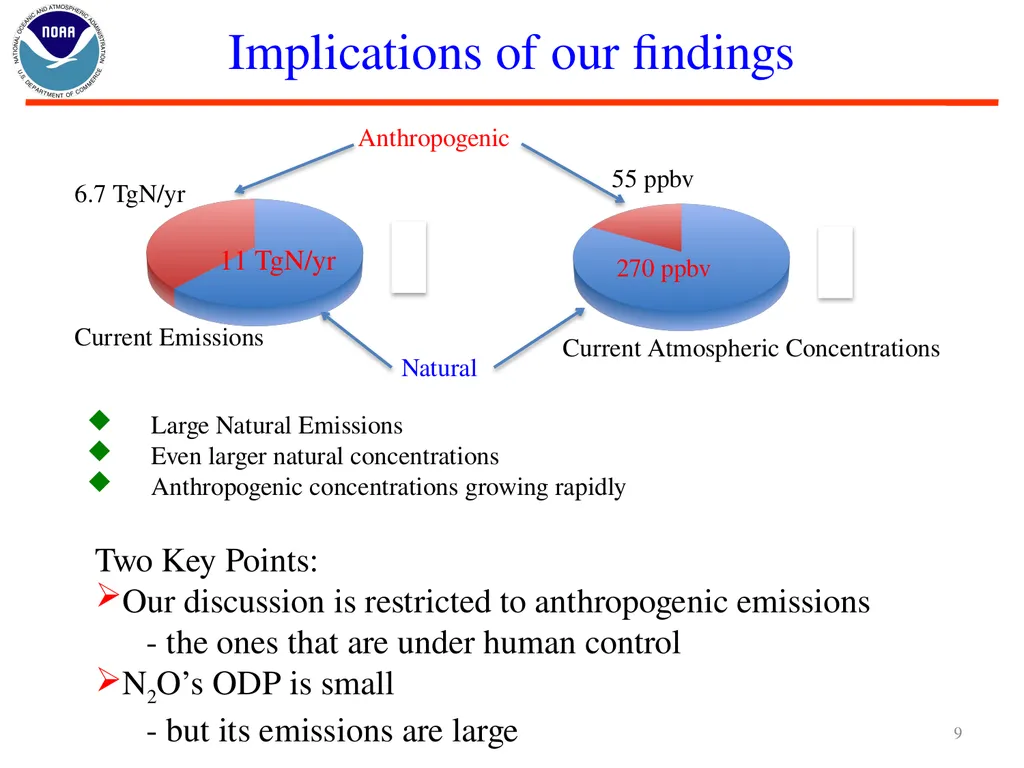
Implications of our findings Two Key Points:
Our discussion is restricted to anthropogenic emissions
- the ones that are under human control
N2O’s ODP is small
- but its emissions are large 9 Large Natural Emissions
Even larger natural concentrations
Anthropogenic concentrations growing rapidly<br>
Our discussion is restricted to anthropogenic emissions
- the ones that are under human control
N2O’s ODP is small
- but its emissions are large 9 Large Natural Emissions
Even larger natural concentrations
Anthropogenic concentrations growing rapidly<br>
10
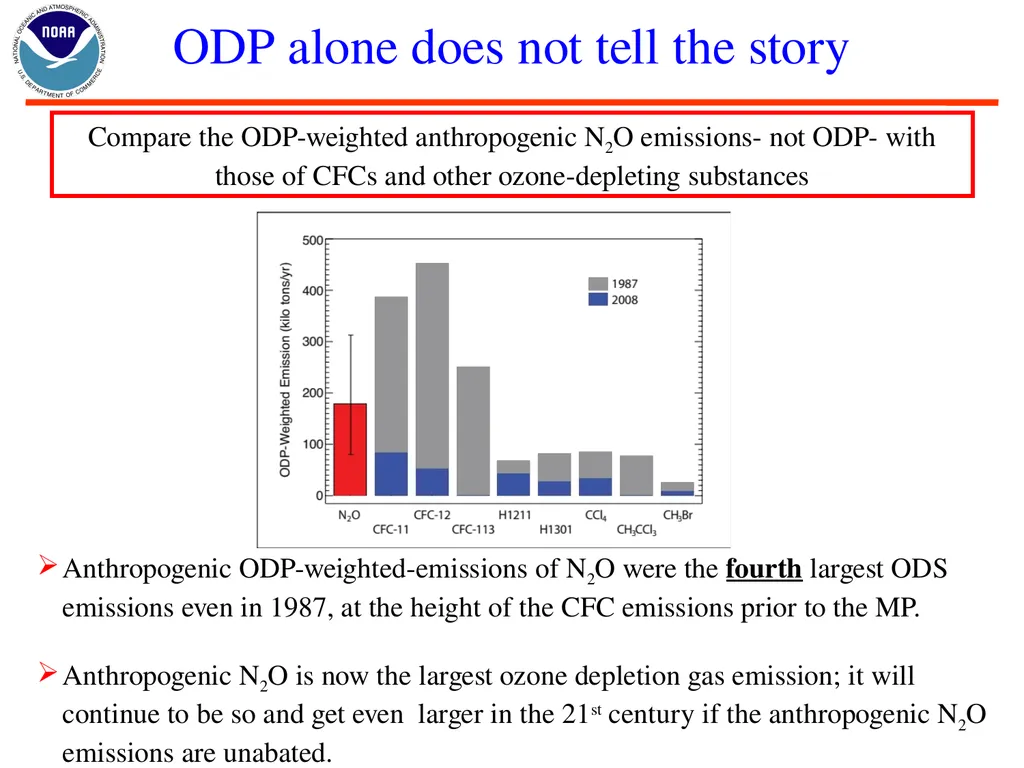
ODP alone does not tell the story Compare the ODP-weighted anthropogenic N2O emissions- not ODP- with those of CFCs and other ozone-depleting substances Anthropogenic ODP-weighted-emissions of N2O were the fourth largest ODS emissions even in 1987, at the height of the CFC emissions prior to the MP.
Anthropogenic N2O is now the largest ozone depletion gas emission; it will continue to be so and get even larger in the 21st century if the anthropogenic N2O emissions are unabated.<br>
Anthropogenic N2O is now the largest ozone depletion gas emission; it will continue to be so and get even larger in the 21st century if the anthropogenic N2O emissions are unabated.<br>
11
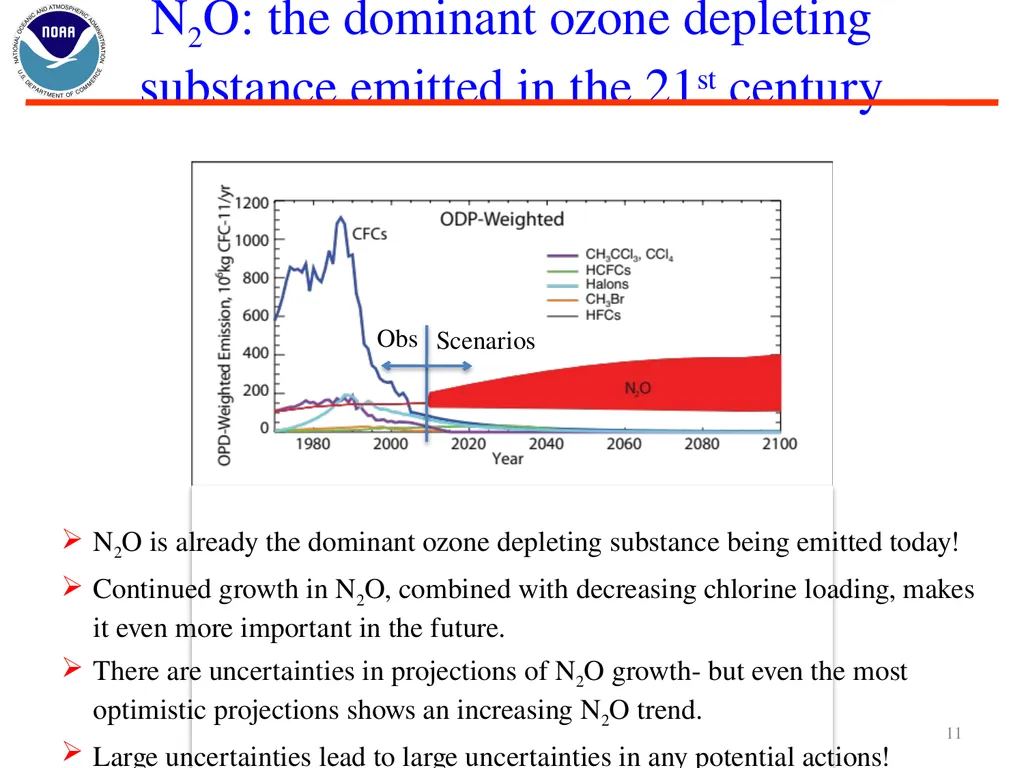
N2O: the dominant ozone depleting substance emitted in the 21st century N2O is already the dominant ozone depleting substance being emitted today!
Continued growth in N2O, combined with decreasing chlorine loading, makes it even more important in the future.
There are uncertainties in projections of N2O growth- but even the most optimistic projections shows an increasing N2O trend.
Large uncertainties lead to large uncertainties in any potential actions! 11 Obs Scenarios<br>
Continued growth in N2O, combined with decreasing chlorine loading, makes it even more important in the future.
There are uncertainties in projections of N2O growth- but even the most optimistic projections shows an increasing N2O trend.
Large uncertainties lead to large uncertainties in any potential actions! 11 Obs Scenarios<br>
12
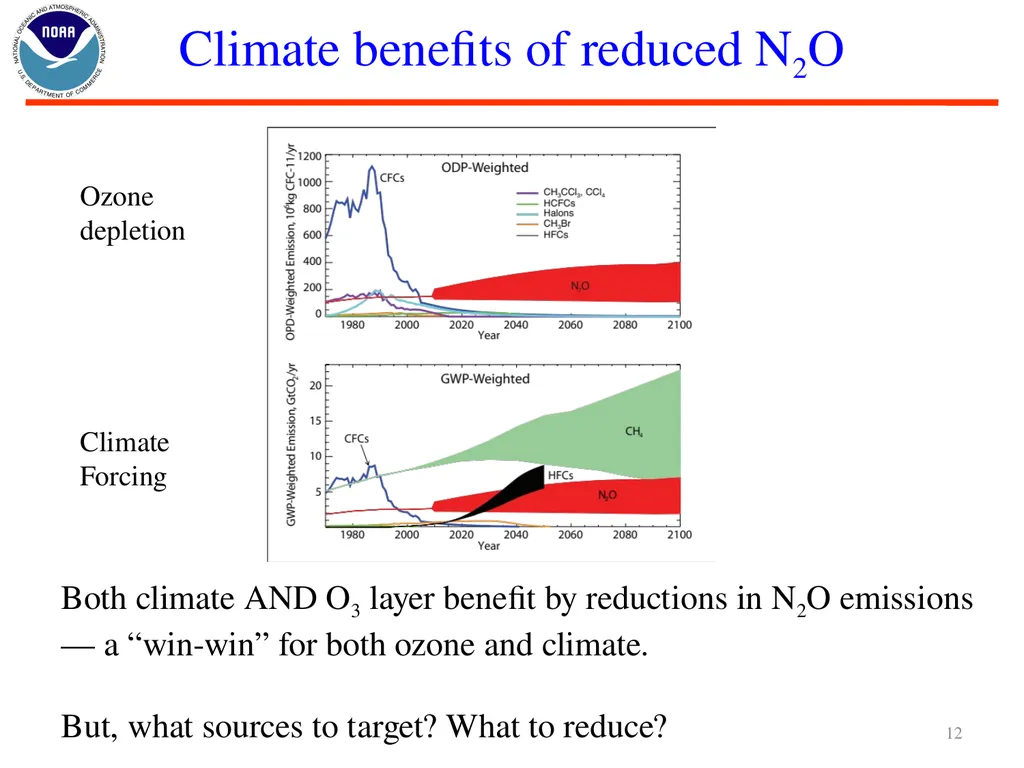
Climate benefits of reduced N2O Both climate AND O3 layer benefit by reductions in N2O emissions
— a “win-win” for both ozone and climate.
But, what sources to target? What to reduce? Ozone depletion Climate Forcing 12<br>
— a “win-win” for both ozone and climate.
But, what sources to target? What to reduce? Ozone depletion Climate Forcing 12<br>
13
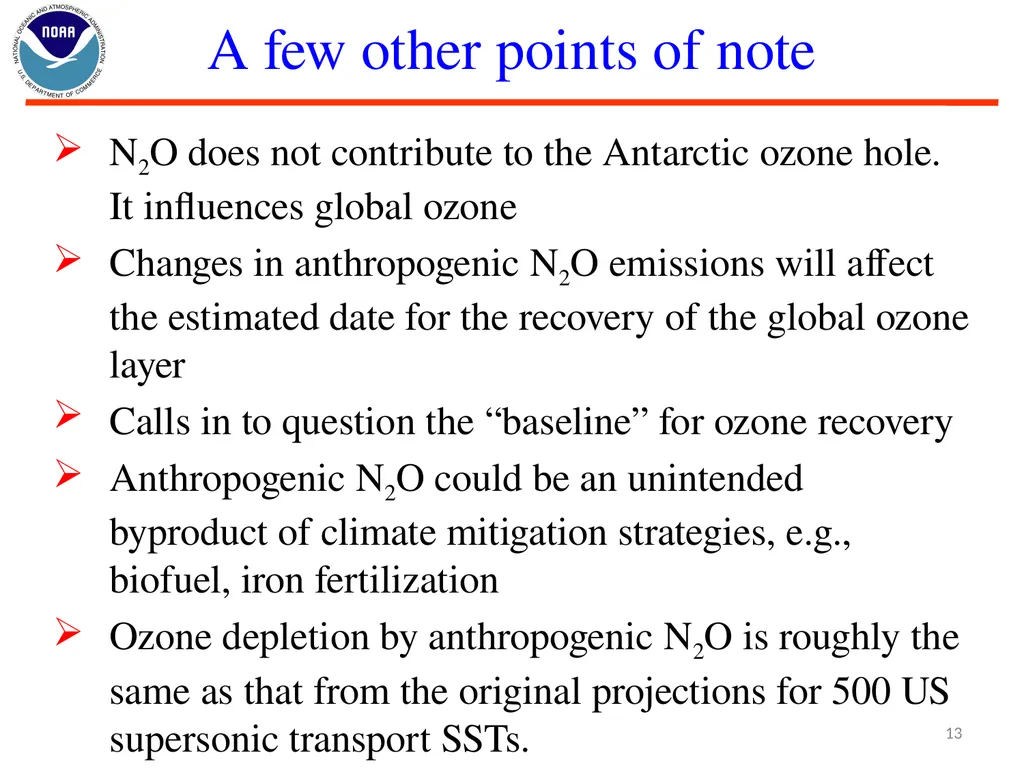
A few other points of note N2O does not contribute to the Antarctic ozone hole. It influences global ozone
Changes in anthropogenic N2O emissions will affect the estimated date for the recovery of the global ozone layer
Calls in to question the “baseline” for ozone recovery
Anthropogenic N2O could be an unintended byproduct of climate mitigation strategies, e.g., biofuel, iron fertilization
Ozone depletion by anthropogenic N2O is roughly the same as that from the original projections for 500 US supersonic transport SSTs. 13<br>
Changes in anthropogenic N2O emissions will affect the estimated date for the recovery of the global ozone layer
Calls in to question the “baseline” for ozone recovery
Anthropogenic N2O could be an unintended byproduct of climate mitigation strategies, e.g., biofuel, iron fertilization
Ozone depletion by anthropogenic N2O is roughly the same as that from the original projections for 500 US supersonic transport SSTs. 13<br>
14
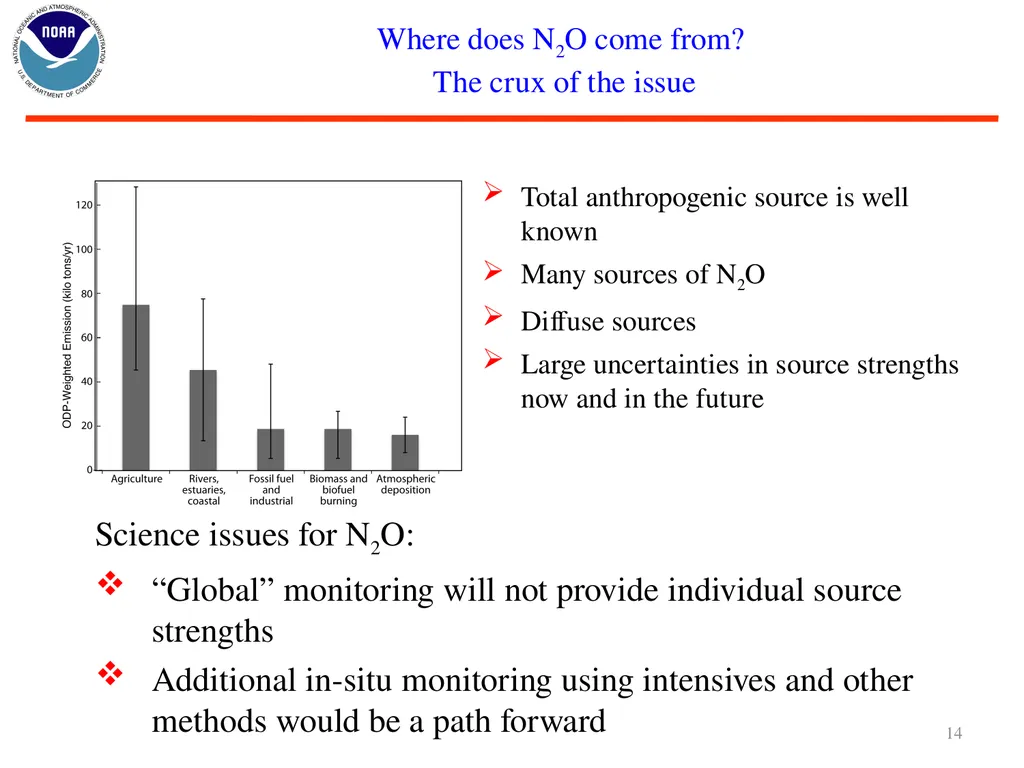
Where does N2O come from?
The crux of the issue Total anthropogenic source is well known
Many sources of N2O
Diffuse sources
Large uncertainties in source strengths now and in the future 14 Science issues for N2O:
“Global” monitoring will not provide individual source strengths
Additional in-situ monitoring using intensives and other methods would be a path forward<br>
Many sources of N2O
Diffuse sources
Large uncertainties in source strengths now and in the future 14 Science issues for N2O:
“Global” monitoring will not provide individual source strengths
Additional in-situ monitoring using intensives and other methods would be a path forward<br>
15
“Isolated” individual source contributions.
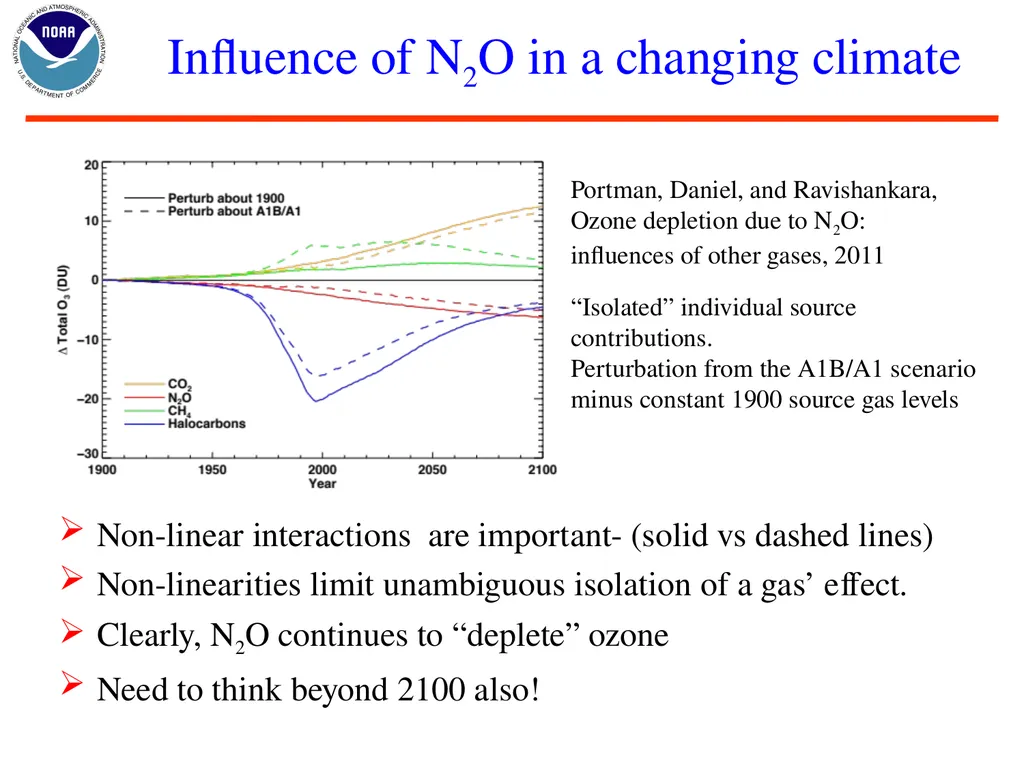
Perturbation from the A1B/A1 scenario minus constant 1900 source gas levels Influence of N2O in a changing climate Portman, Daniel, and Ravishankara, Ozone depletion due to N2O: influences of other gases, 2011 Non-linear interactions are important- (solid vs dashed lines)
Non-linearities limit unambiguous isolation of a gas’ effect.
Clearly, N2O continues to “deplete” ozone
Need to think beyond 2100 also!<br>
Perturbation from the A1B/A1 scenario minus constant 1900 source gas levels Influence of N2O in a changing climate Portman, Daniel, and Ravishankara, Ozone depletion due to N2O: influences of other gases, 2011 Non-linear interactions are important- (solid vs dashed lines)
Non-linearities limit unambiguous isolation of a gas’ effect.
Clearly, N2O continues to “deplete” ozone
Need to think beyond 2100 also!<br>
16
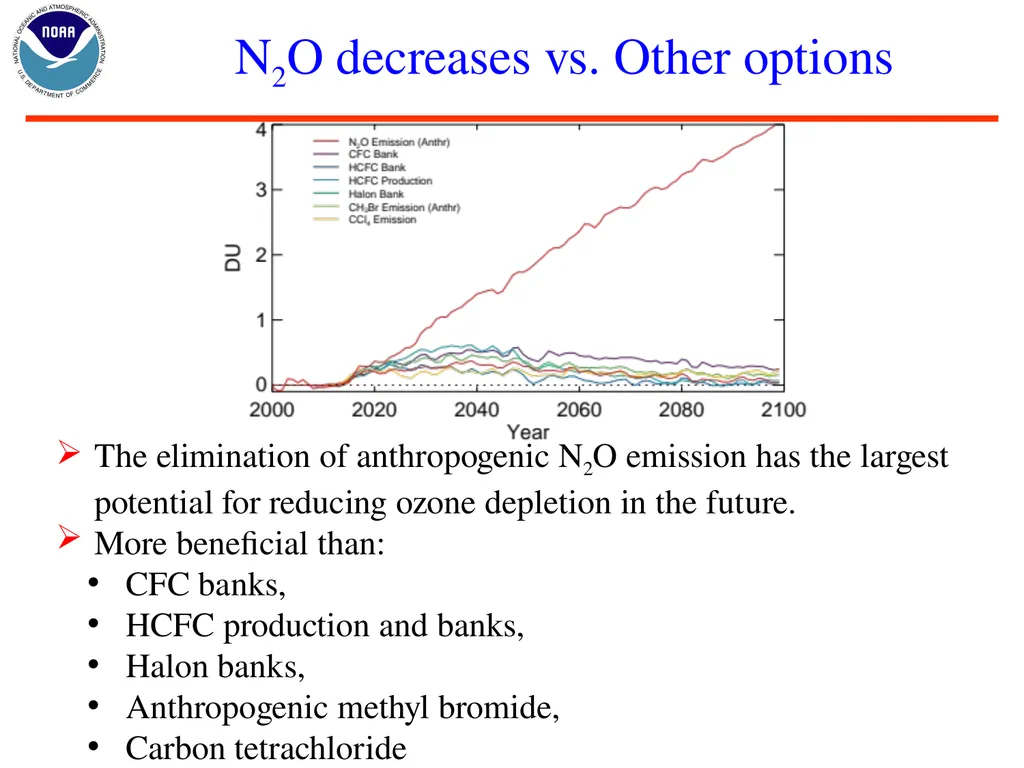
The elimination of anthropogenic N2O emission has the largest potential for reducing ozone depletion in the future.
More beneficial than:
CFC banks,
HCFC production and banks,
Halon banks,
Anthropogenic methyl bromide,
Carbon tetrachloride N2O decreases vs. Other options<br>
More beneficial than:
CFC banks,
HCFC production and banks,
Halon banks,
Anthropogenic methyl bromide,
Carbon tetrachloride N2O decreases vs. Other options<br>
17
Key Points of Our Studies Treated N2O like any other ozone-depleting substance (CFCs, Halons, methyl bromide,…). Calculated ODP. Compared ODP-weighted emissions of anthropogenic N2O to the ODP-weighted anthropogenic emissions of other ozone-depleting substances.
Looked at the influence of “climate change” on N2O’s ozone depletion. Compared Magnitudes of anthropogenic N2O-induced depletion with other standard measures- e.g., destruction of banks 17 1. Fact: NOx from N2O leads to ozone depletion; N2O is not regulated under the Montreal Protocol. Findings: Anthropogenic N2O is now the largest manmade ozone-depleting gas emission (a recent development owing to the successful abatement of CFCs and other ODSs under the Montreal Protocol!),
and it will remain so for the next century if anthropogenic emissions of N2O are unabated.<br>
Looked at the influence of “climate change” on N2O’s ozone depletion. Compared Magnitudes of anthropogenic N2O-induced depletion with other standard measures- e.g., destruction of banks 17 1. Fact: NOx from N2O leads to ozone depletion; N2O is not regulated under the Montreal Protocol. Findings: Anthropogenic N2O is now the largest manmade ozone-depleting gas emission (a recent development owing to the successful abatement of CFCs and other ODSs under the Montreal Protocol!),
and it will remain so for the next century if anthropogenic emissions of N2O are unabated.<br>
18
Thank you
for
your attention<br>
19
Backup slides<br>
20
What we know: Current state and outlook based on assessments Findings from 2002 and 2006 SAP of UNEP/WMO:
The Montreal Protocol is a success!
The chlorine (and bromine) containing ODSs are decreasing in the atmosphere
The ozone layer is expected to recover
It is showing signs of recovery
Climate change and atmospheric composition will influence the recovery 20 Ozone layer depletion has been focused on halogens….<br>
The Montreal Protocol is a success!
The chlorine (and bromine) containing ODSs are decreasing in the atmosphere
The ozone layer is expected to recover
It is showing signs of recovery
Climate change and atmospheric composition will influence the recovery 20 Ozone layer depletion has been focused on halogens….<br>
21
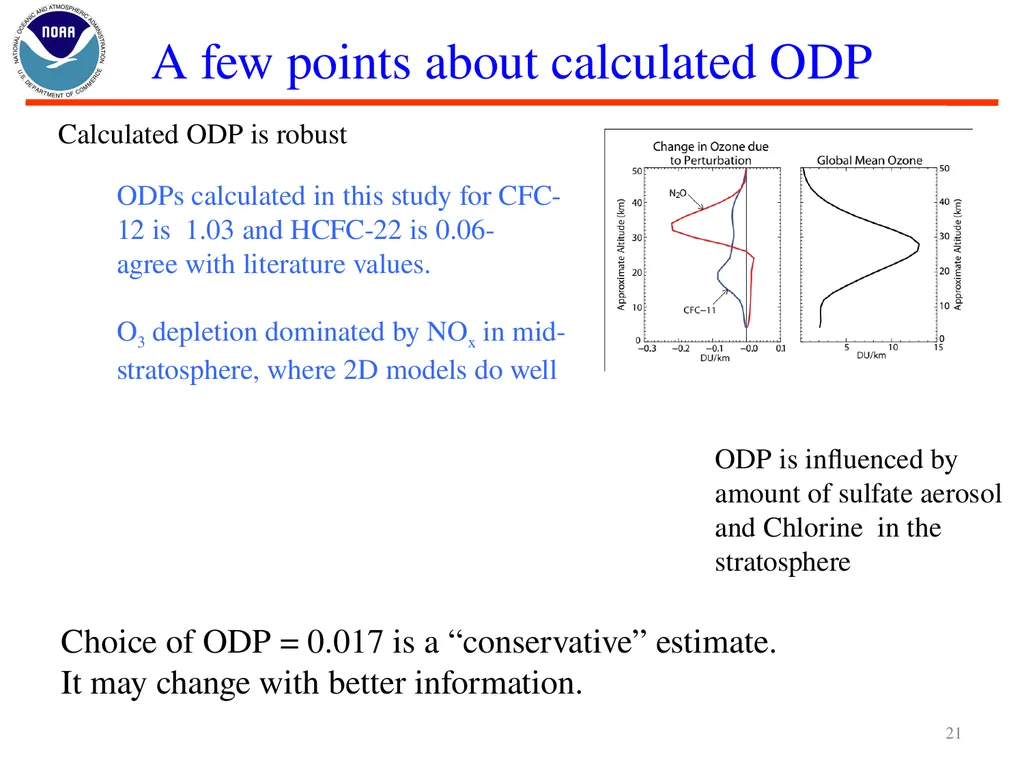
A few points about calculated ODP Calculated ODP is robust ODPs calculated in this study for CFC-12 is 1.03 and HCFC-22 is 0.06- agree with literature values. O3 depletion dominated by NOx in mid-stratosphere, where 2D models do well 21 Choice of ODP = 0.017 is a “conservative” estimate.
It may change with better information.<br>
It may change with better information.<br>
22
Why is the ODP of N2O ~0.02? Main reason for smaller value:
Only 10% of N2O is converted to NOx and while 3 Cl atoms are produced from CFC-11 (CFCl3) There are some differences in efficiency, fraction in active form, etc. that account for the other difference NOx catalysis is roughly similar in efficiency to that by ClOX 22<br>
Only 10% of N2O is converted to NOx and while 3 Cl atoms are produced from CFC-11 (CFCl3) There are some differences in efficiency, fraction in active form, etc. that account for the other difference NOx catalysis is roughly similar in efficiency to that by ClOX 22<br>
23
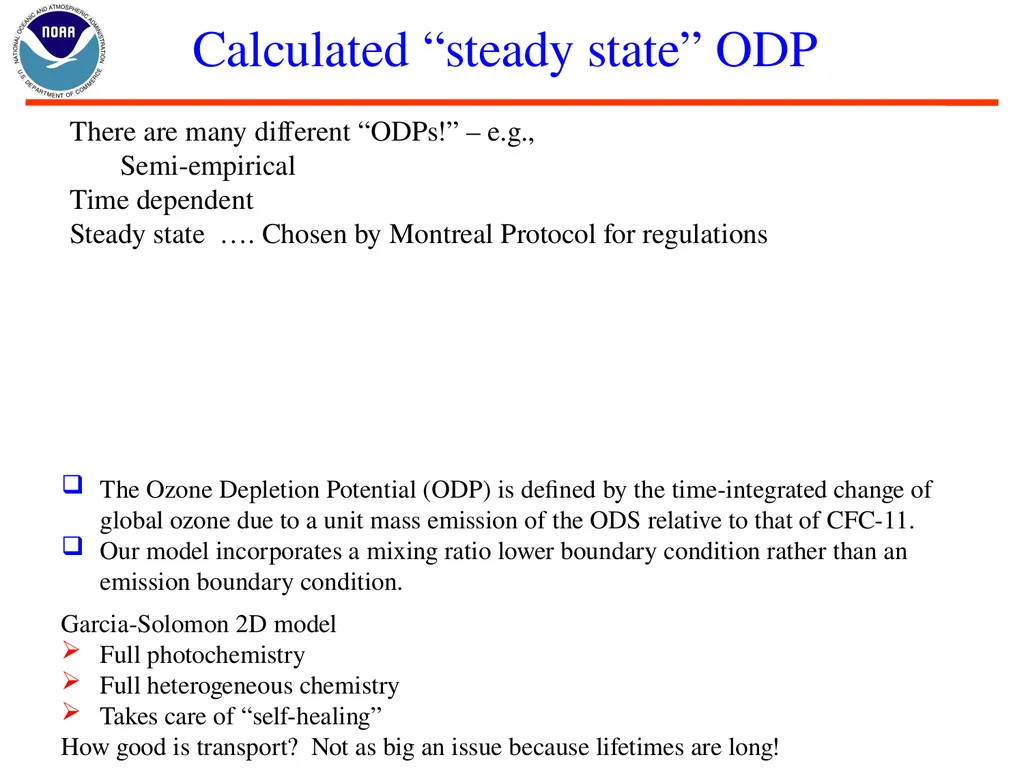
Calculated “steady state” ODP The Ozone Depletion Potential (ODP) is defined by the time-integrated change of global ozone due to a unit mass emission of the ODS relative to that of CFC-11.
Our model incorporates a mixing ratio lower boundary condition rather than an emission boundary condition. Garcia-Solomon 2D model
Full photochemistry
Full heterogeneous chemistry
Takes care of “self-healing”
How good is transport? Not as big an issue because lifetimes are long! There are many different “ODPs!” – e.g., Semi-empirical
Time dependent
Steady state …. Chosen by Montreal Protocol for regulations<br>
Our model incorporates a mixing ratio lower boundary condition rather than an emission boundary condition. Garcia-Solomon 2D model
Full photochemistry
Full heterogeneous chemistry
Takes care of “self-healing”
How good is transport? Not as big an issue because lifetimes are long! There are many different “ODPs!” – e.g., Semi-empirical
Time dependent
Steady state …. Chosen by Montreal Protocol for regulations<br>
24
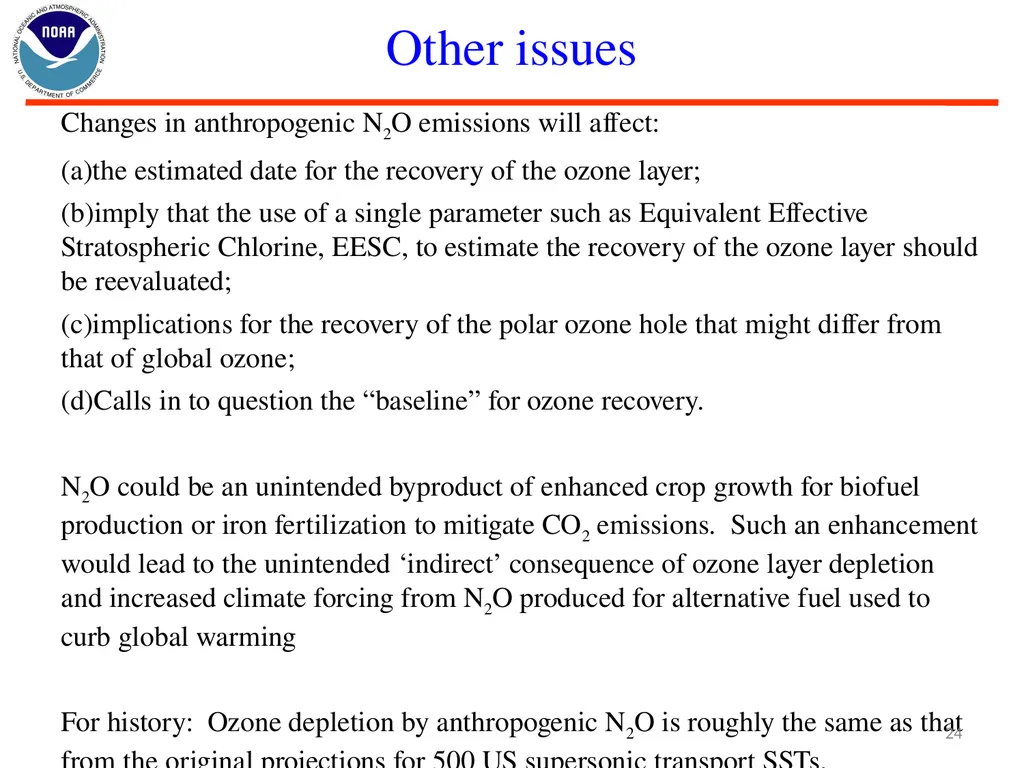
Other issues Changes in anthropogenic N2O emissions will affect:
the estimated date for the recovery of the ozone layer;
imply that the use of a single parameter such as Equivalent Effective Stratospheric Chlorine, EESC, to estimate the recovery of the ozone layer should be reevaluated;
implications for the recovery of the polar ozone hole that might differ from that of global ozone;
Calls in to question the “baseline” for ozone recovery.
N2O could be an unintended byproduct of enhanced crop growth for biofuel production or iron fertilization to mitigate CO2 emissions. Such an enhancement would lead to the unintended ‘indirect’ consequence of ozone layer depletion and increased climate forcing from N2O produced for alternative fuel used to curb global warming
For history: Ozone depletion by anthropogenic N2O is roughly the same as that from the original projections for 500 US supersonic transport SSTs. 24<br>
the estimated date for the recovery of the ozone layer;
imply that the use of a single parameter such as Equivalent Effective Stratospheric Chlorine, EESC, to estimate the recovery of the ozone layer should be reevaluated;
implications for the recovery of the polar ozone hole that might differ from that of global ozone;
Calls in to question the “baseline” for ozone recovery.
N2O could be an unintended byproduct of enhanced crop growth for biofuel production or iron fertilization to mitigate CO2 emissions. Such an enhancement would lead to the unintended ‘indirect’ consequence of ozone layer depletion and increased climate forcing from N2O produced for alternative fuel used to curb global warming
For history: Ozone depletion by anthropogenic N2O is roughly the same as that from the original projections for 500 US supersonic transport SSTs. 24<br>
25
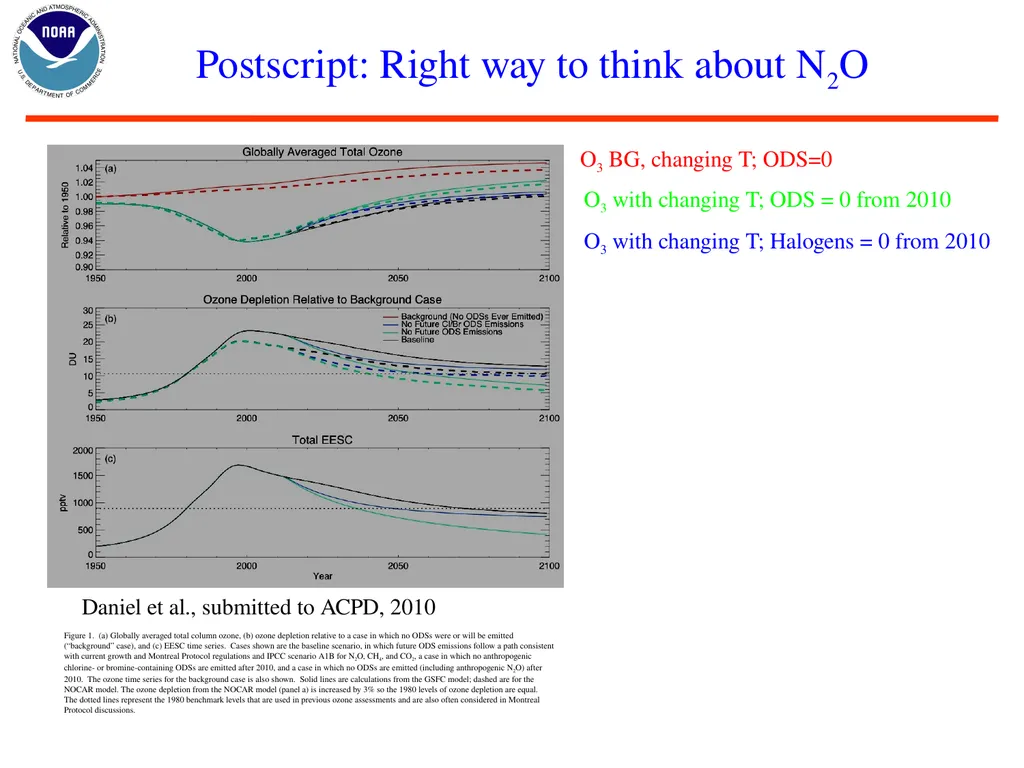
Daniel et al., submitted to ACPD, 2010 Postscript: Right way to think about N2O Figure 1. (a) Globally averaged total column ozone, (b) ozone depletion relative to a case in which no ODSs were or will be emitted (“background” case), and (c) EESC time series. Cases shown are the baseline scenario, in which future ODS emissions follow a path consistent with current growth and Montreal Protocol regulations and IPCC scenario A1B for N2O, CH4, and CO2, a case in which no anthropogenic chlorine- or bromine-containing ODSs are emitted after 2010, and a case in which no ODSs are emitted (including anthropogenic N2O) after 2010. The ozone time series for the background case is also shown. Solid lines are calculations from the GSFC model; dashed are for the NOCAR model. The ozone depletion from the NOCAR model (panel a) is increased by 3% so the 1980 levels of ozone depletion are equal. The dotted lines represent the 1980 benchmark levels that are used in previous ozone assessments and are also often considered in Montreal Protocol discussions. O3 BG, changing T; ODS=0 O3 with changing T; ODS = 0 from 2010 O3 with changing T; Halogens = 0 from 2010<br>
26
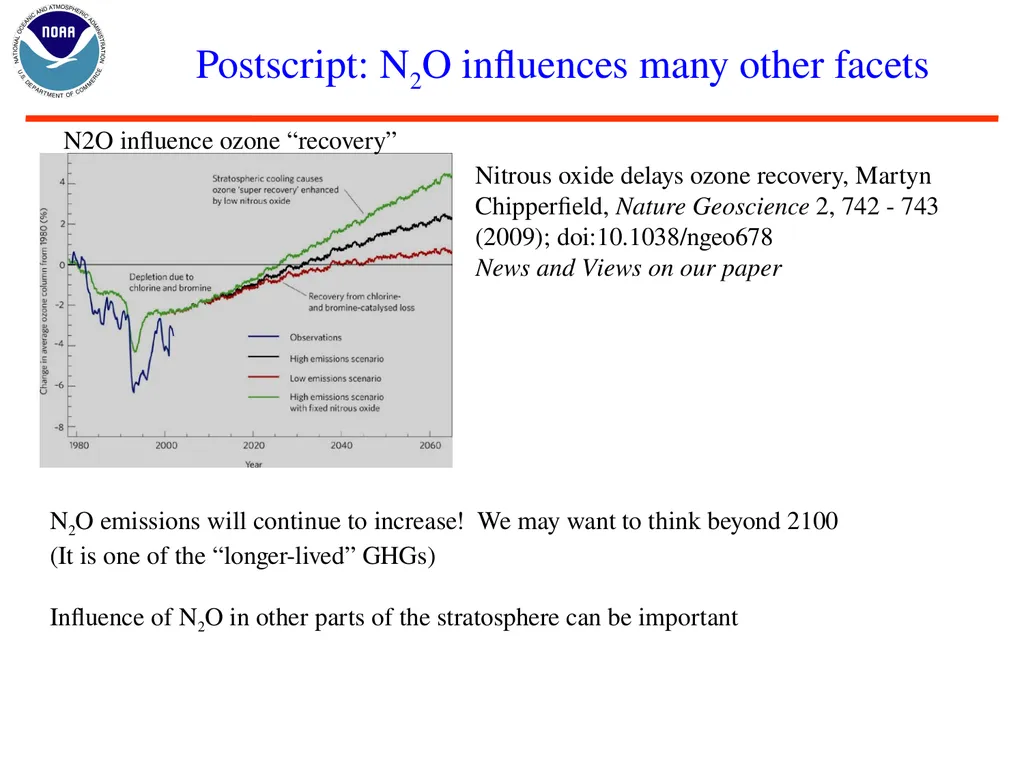
Postscript: N2O influences many other facets Nitrous oxide delays ozone recovery, Martyn Chipperfield, Nature Geoscience 2, 742 - 743 (2009); doi:10.1038/ngeo678
News and Views on our paper N2O influence ozone “recovery” N2O emissions will continue to increase! We may want to think beyond 2100
(It is one of the “longer-lived” GHGs)
Influence of N2O in other parts of the stratosphere can be important<br>
News and Views on our paper N2O influence ozone “recovery” N2O emissions will continue to increase! We may want to think beyond 2100
(It is one of the “longer-lived” GHGs)
Influence of N2O in other parts of the stratosphere can be important<br>