04
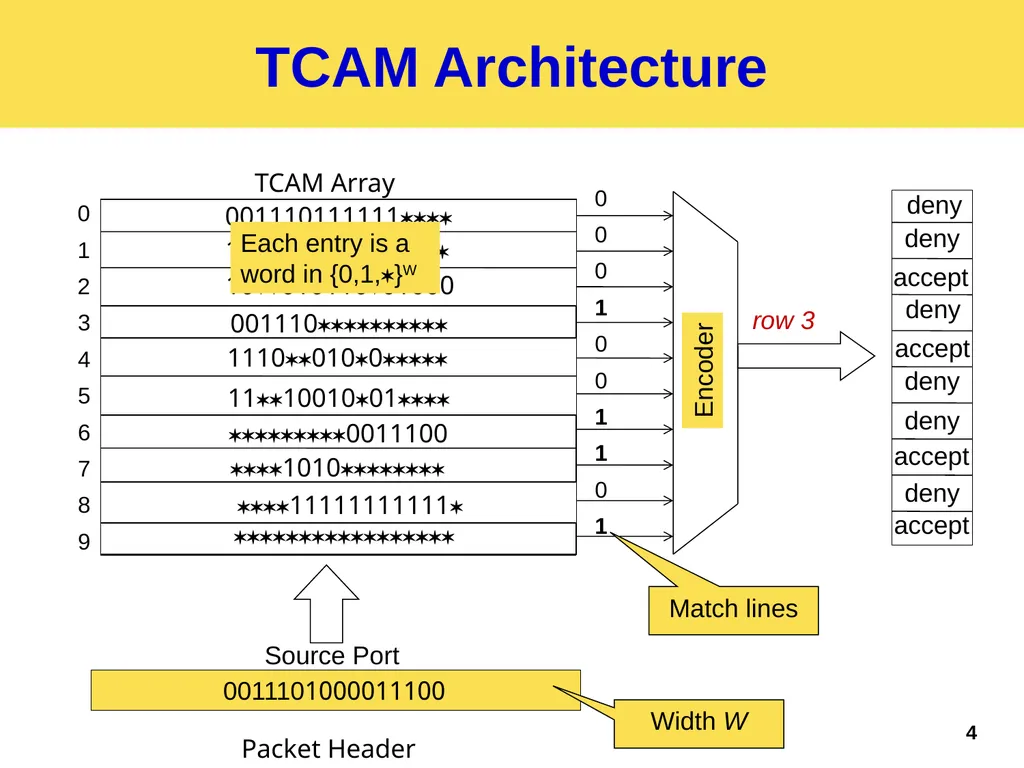
TCAM Architecture Encoder Match lines deny accept accept deny deny deny deny accept deny accept 001110111111 1000000110 1001011001000 001110 11100100 111001001 0011100 1010 11111111111 0011101000011100 row 3 Each entry is a word in {0,1,}W Packet Header TCAM Array Source Port Width W 4<br>
05
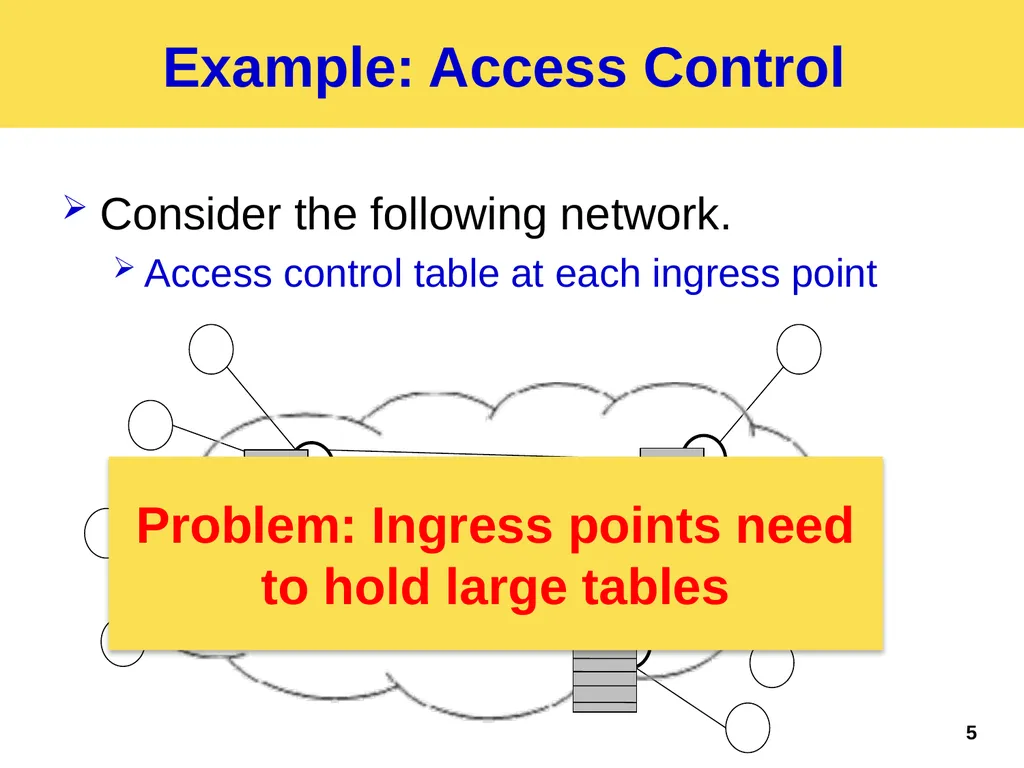
Example: Access Control Consider the following network.
Access control table at each ingress point Problem: Ingress points need
to hold large tables 5<br>
06
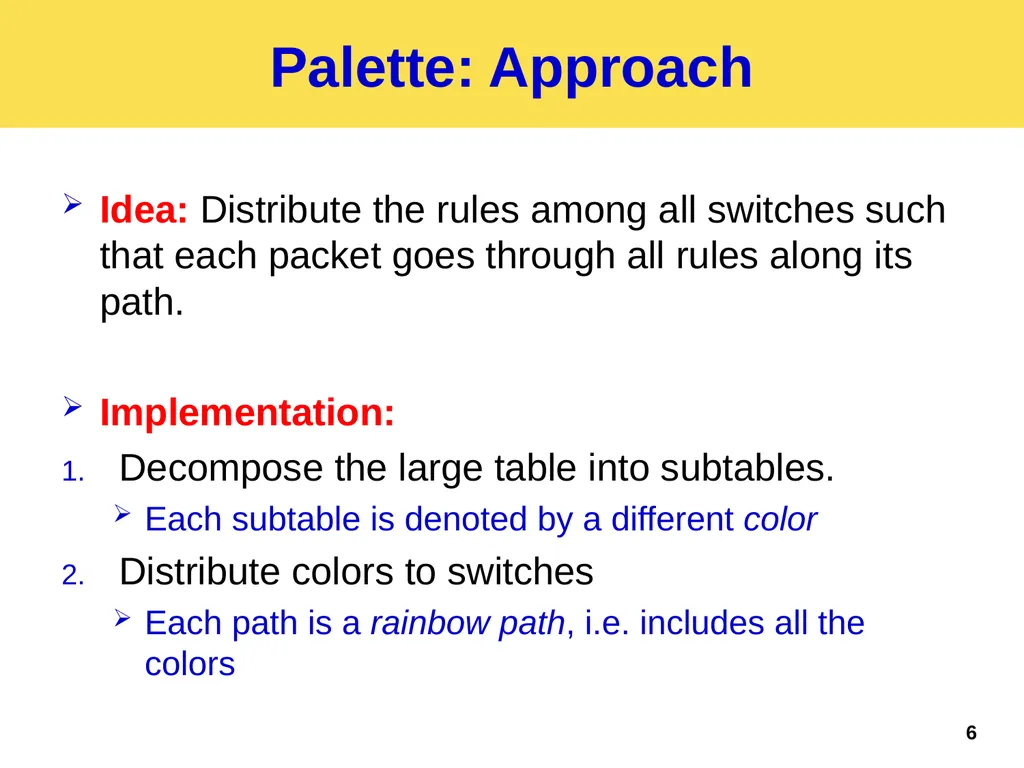
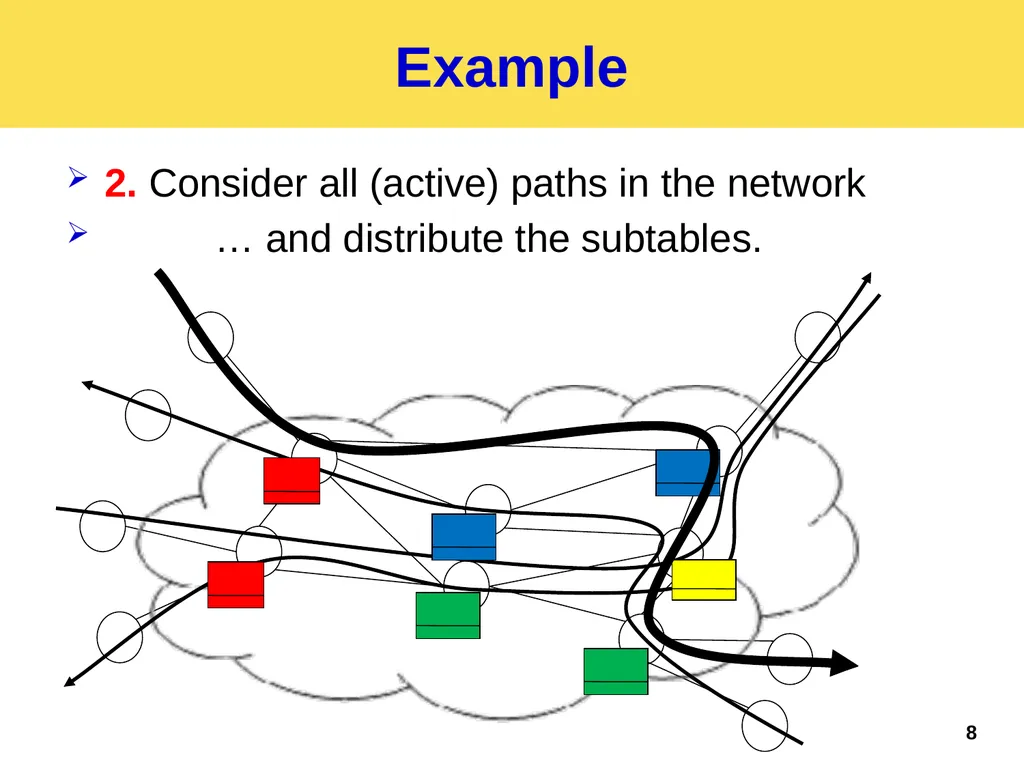
Palette: Approach Idea: Distribute the rules among all switches such that each packet goes through all rules along its path.
Implementation:
Decompose the large table into subtables.
Each subtable is denoted by a different color
Distribute colors to switches
Each path is a rainbow path, i.e. includes all the colors 6<br>
07
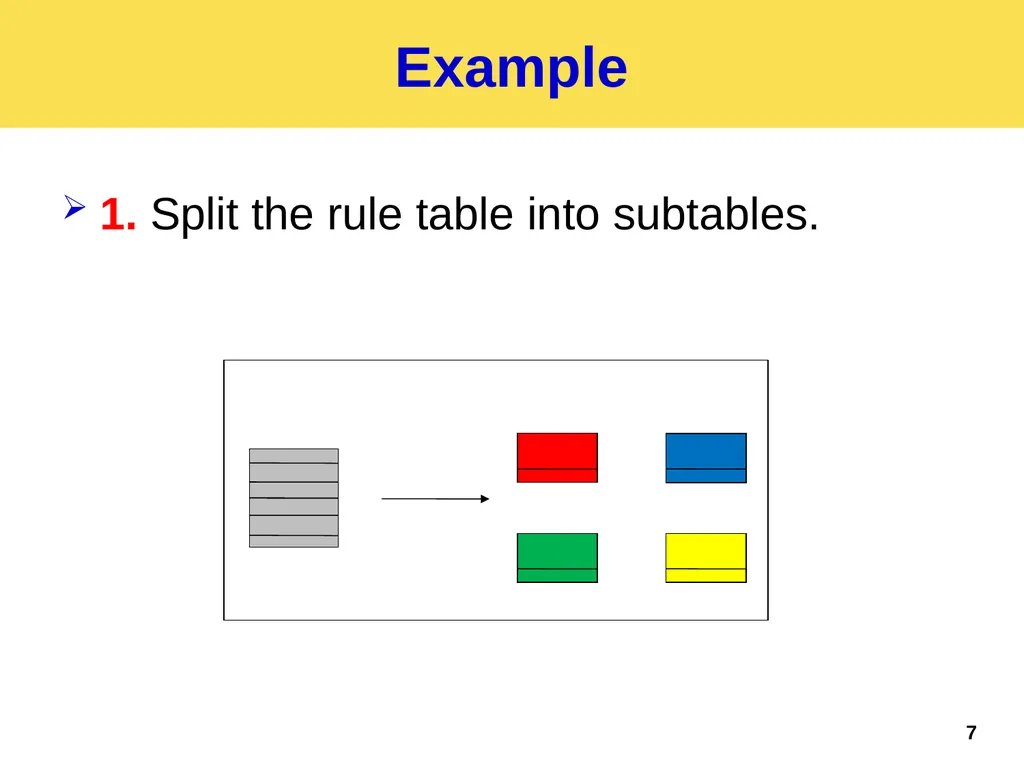
Example 1. Split the rule table into subtables. 7<br>
08
Example 2. Consider all (active) paths in the network
… and distribute the subtables. 8<br>
09
Related Work DIFANE (Yu et al.): Rule set is split into disjoint subsets and distributed to special switches.
Ingress switches redirect packets to the relevant switch.
If a rule is matched, it is stored in the ingress switch cache.
Causes management and redirection overhead (it can change the paths).
CSAMP (Sekar et al.): Each switch along the path handles only a (disjoint) subset of the packets.
Each switch still needs to hold the entire table. 9<br>
10
Main Results Table Decomposition
Pivot Bit Decomposition
Cut-Based Decomposition
Rainbow Path Problem
A Single color case
The multiple color case.
Evaluation 10<br>
11
Table Decomposition Dividing a large table into c subtables.
Order-oblivious: The order in which the smaller tables are accessed does not matter
Semantically-invariant: This global action of the network is the same as the one taken when using the initial single large table
Goal: minimize the largest subtable. 11<br>
12
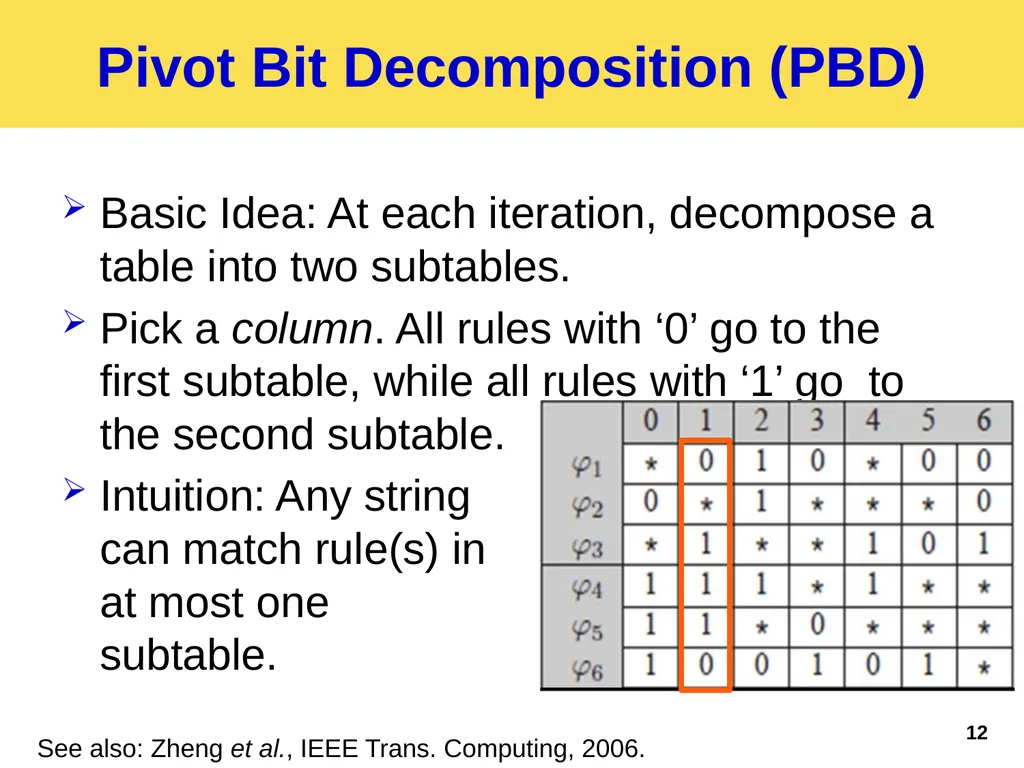
Pivot Bit Decomposition (PBD) Basic Idea: At each iteration, decompose a table into two subtables.
Pick a column. All rules with ‘0’ go to the first subtable, while all rules with ‘1’ go to the second subtable.
Intuition: Any string�can match rule(s) in�at most one �subtable. 12 See also: Zheng et al., IEEE Trans. Computing, 2006.<br>
13
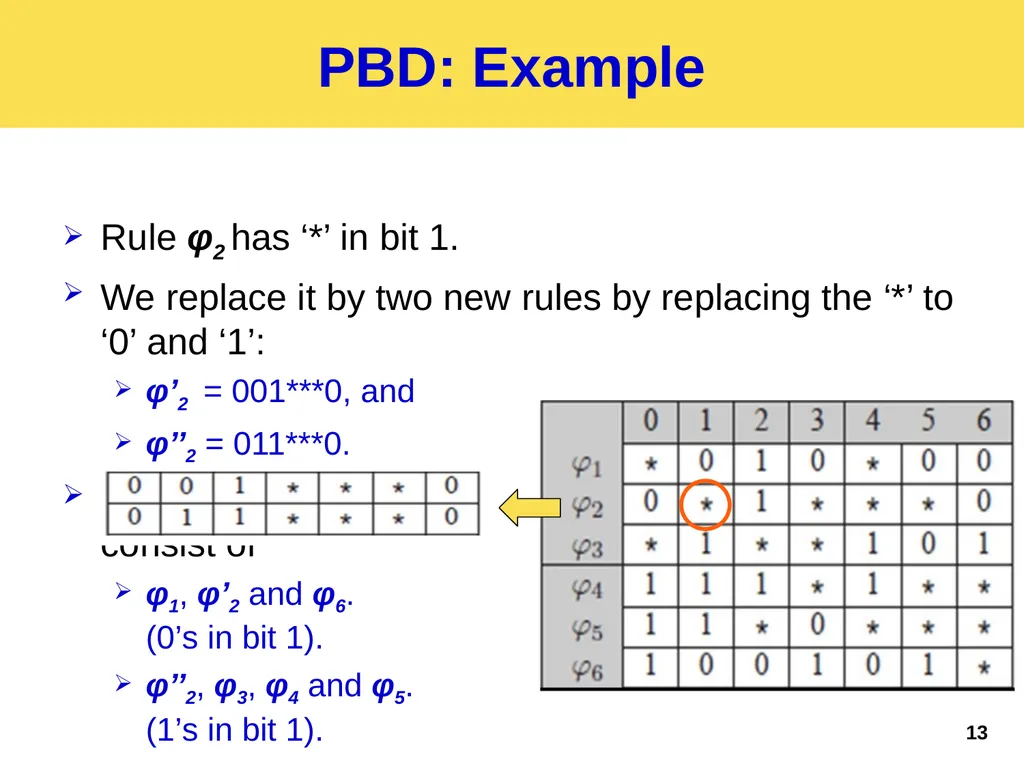
PBD: Example Rule φ2 has ‘*’ in bit 1.
We replace it by two new rules by replacing the ‘*’ to ‘0’ and ‘1’:
φ’2 = 001***0, and
φ’’2 = 011***0.
Resulting subtables�consist of
φ1, φ’2 and φ6. �(0’s in bit 1).
φ’’2, φ3, φ4 and φ5.�(1’s in bit 1). 13<br>
14
PBD Iteratively decomposing one subtable into two equivalent subtables.
At each iteration
Choose the bit that upon decomposition minimizes the larger resulting subtable.
Repeat this on one of the subtables, until c subtables exist. 14<br>
15
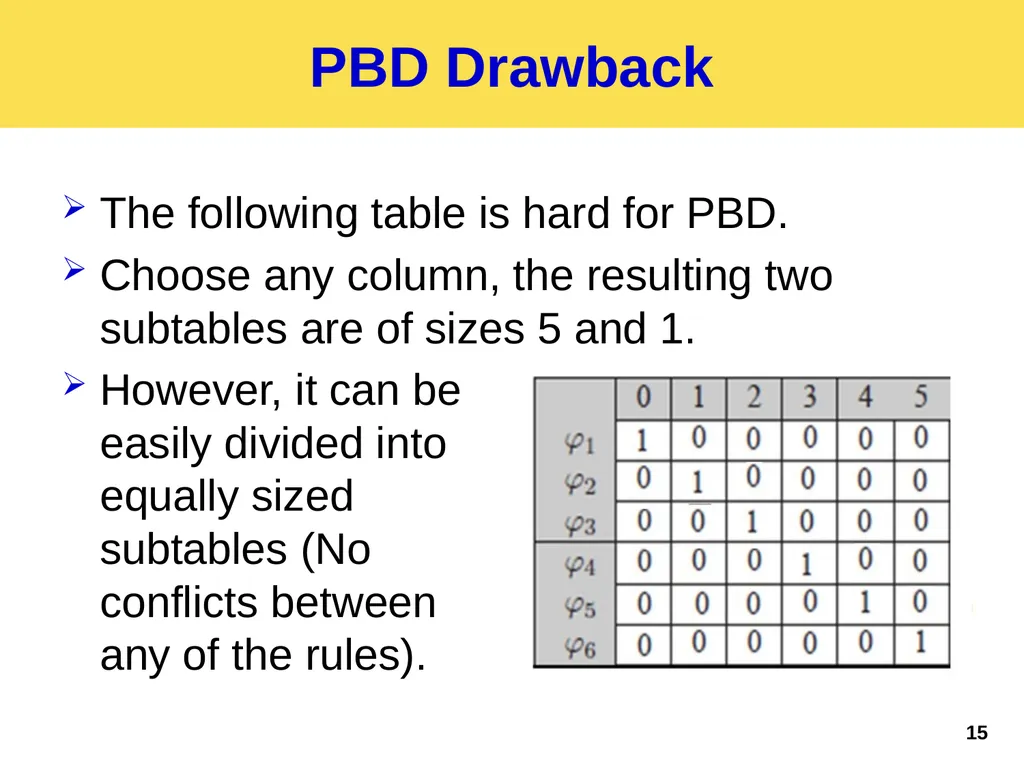
PBD Drawback The following table is hard for PBD.
Choose any column, the resulting two subtables are of sizes 5 and 1.
However, it can be�easily divided into�equally sized �subtables (No �conflicts between �any of the rules). 15<br>
16
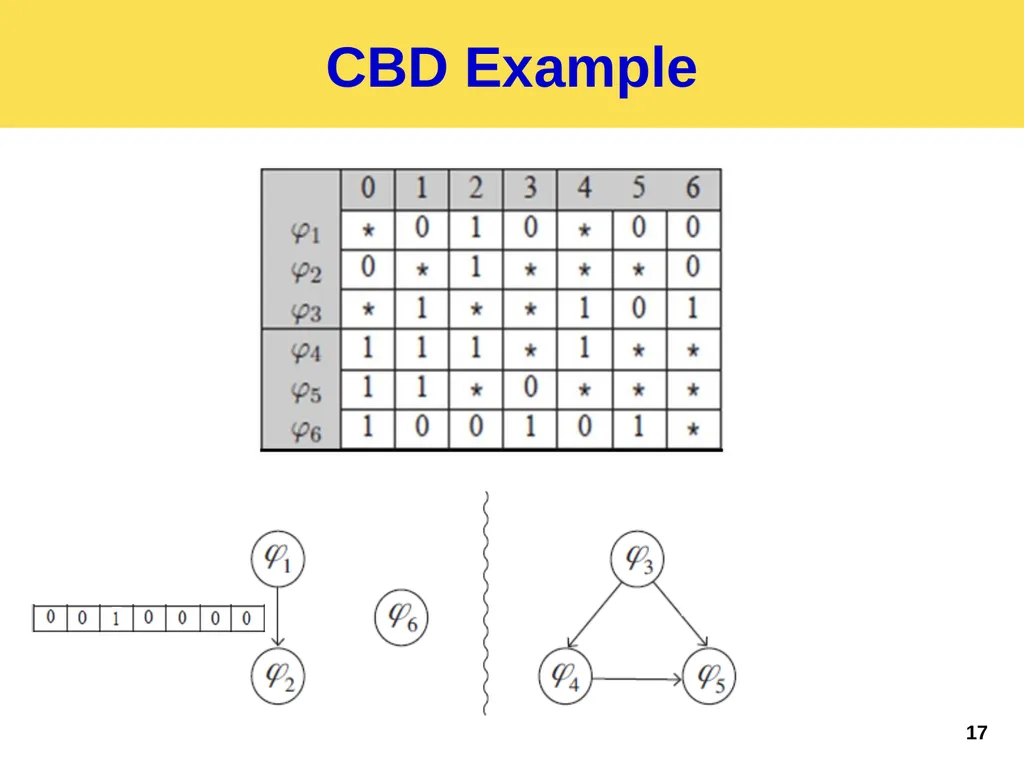
Cut-Based Decomposition (CBD) Decomposition is based on representing the set of rules in a directed dependency graph.
Nodes represent rules.
Edges represent dependency: an edge exists from u to v iff u has higher priority than v, and there is at least one key that matches both rules.
Goal: decompose the graph into c components (= subtables) with no edges between them. 16<br>
18
Cut-Based Decomposition (CBD) Decomposing the graph into c equally sized components is usually impossible and hard to approximate.
Allow two operations:
Breaking an edge between u and v: Replace v with a set of rules that have no conflict with u .
Node expansion: Given a set of t ‘*’ bits, replace it with 2t rules (like the duplication done in PBD). 18<br>
19
Cut-Based Decomposition (CBD) Iterative algorithm:
Partition the graph to c (almost) equally sized partitions, subject to minimizing the number of crossing edges.
NP-hard, use approximation (e.g., using METIS [2]).
Break some edges or expand nodes.
Repeat until a (relatively balanced) partition with no crossing edges is found. [2] http://glaros.dtc.umn.edu/gkhome/views/metis 19<br>
20
Main Results Table Decomposition
Pivot Bit Decomposition
Cut-Based Decomposition
Rainbow Path Problem
A single color case
The multiple color case.
Evaluation 20<br>
21
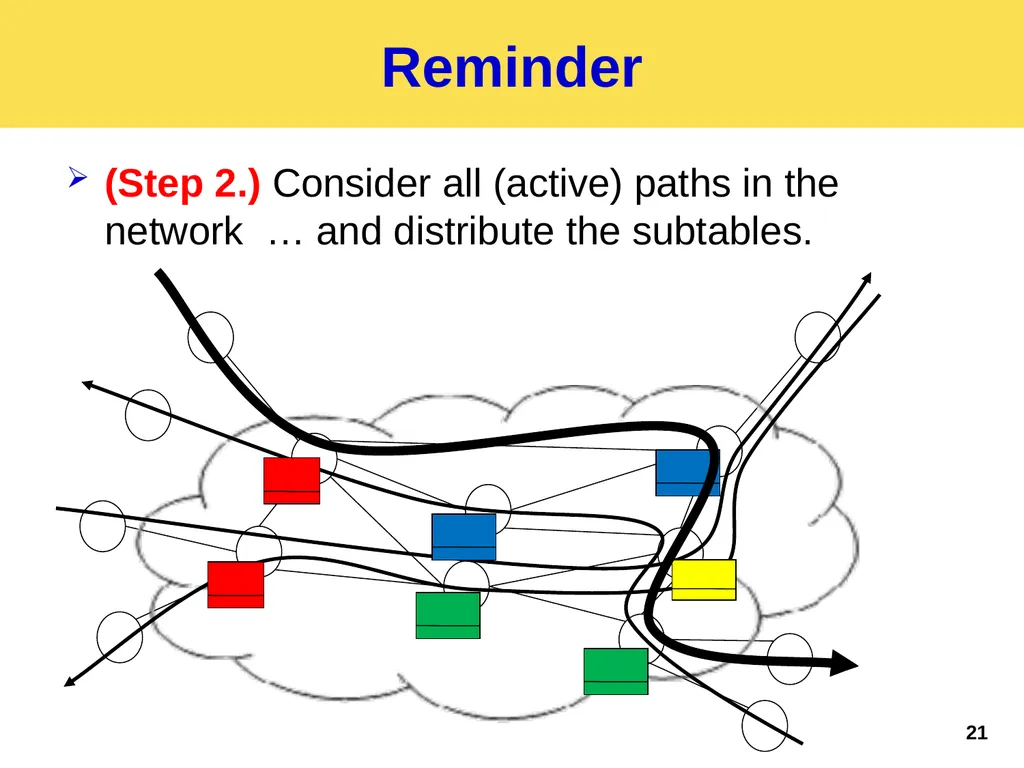
Reminder (Step 2.) Consider all (active) paths in the network … and distribute the subtables. 21<br>
22
Rainbow Path Problem Distribute the colors among switches (up to a single color for each switch), such that each path contains all colors.
Goal: maximize the number of colors c used.
NP-hard problem
Turn to greedy algorithms. 22<br>
23
1-GREEDY For each new color:
Color the (yet uncolored) switch that maximizes the number of paths going through the switch and not yet containing the new color.
Repeat this until all paths contain the new color.
Runs in time O(n2|P|), where n is the number of switches, and P is path set. 23<br>
24
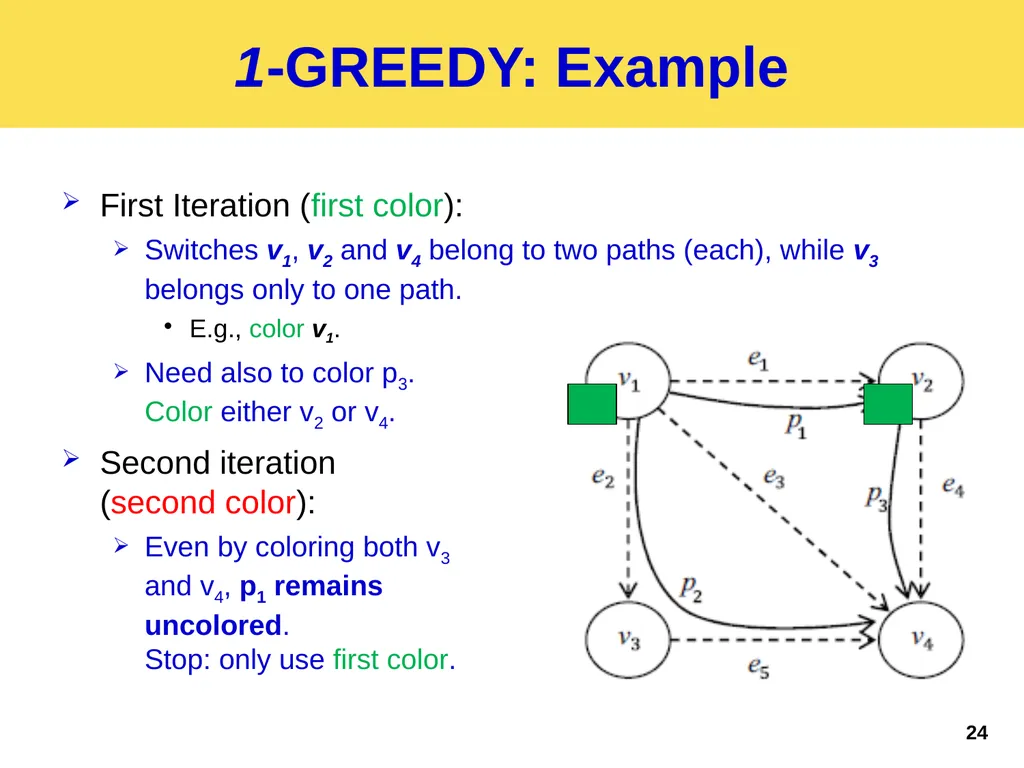
1-GREEDY: Example First Iteration (first color):
Switches v1, v2 and v4 belong to two paths (each), while v3 belongs only to one path.
E.g., color v1.
Need also to color p3. �Color either v2 or v4.
Second iteration �(second color):
Even by coloring both v3 �and v4, p1 remains �uncolored.�Stop: only use first color. 24<br>
25
q-GREEDY In q-GREEDY, at each (sub-)iteration, pick up to q switches that maximize the number of paths going through the switches and not yet containing the new color.
Runs in time O(nq+1|P|), where n is the number of switches, and P is the path set. 25<br>
26
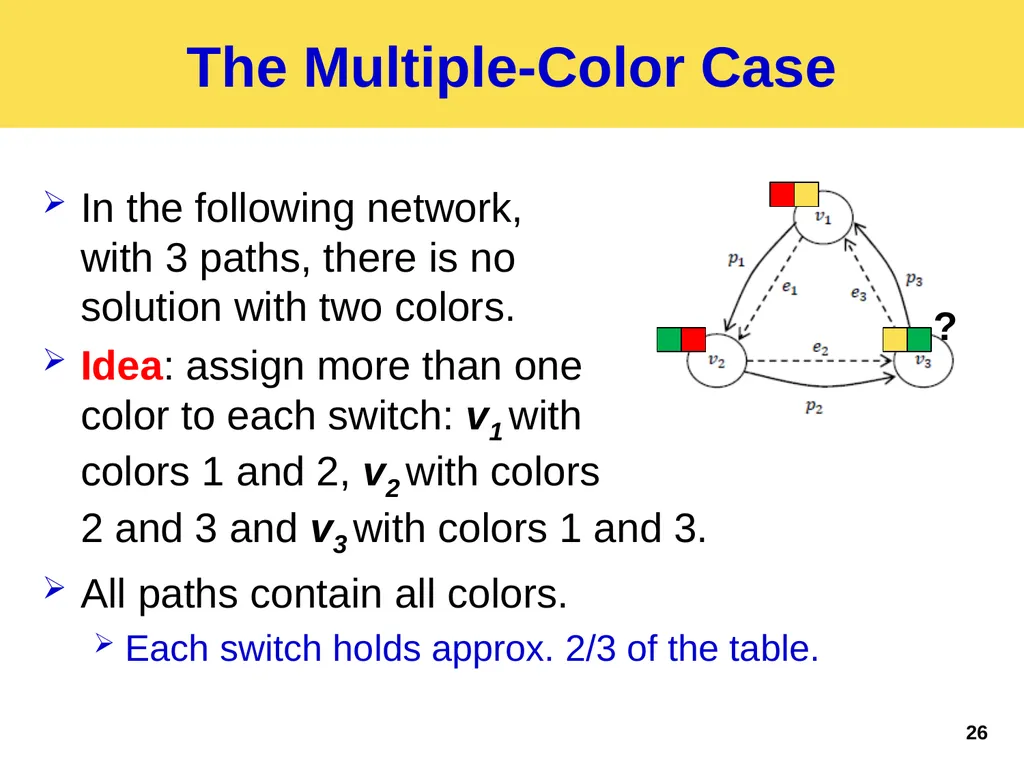
The Multiple-Color Case In the following network,�with 3 paths, there is no�solution with two colors.
Idea: assign more than one �color to each switch: v1 with �colors 1 and 2, v2 with colors �2 and 3 and v3 with colors 1 and 3.
All paths contain all colors.
Each switch holds approx. 2/3 of the table. ? 26<br>
27
The Multiple-Color Case Goal: Maximize the number of colors used, subject to a maximum number d of colors allowed in each switch.
Problem is NP-hard.
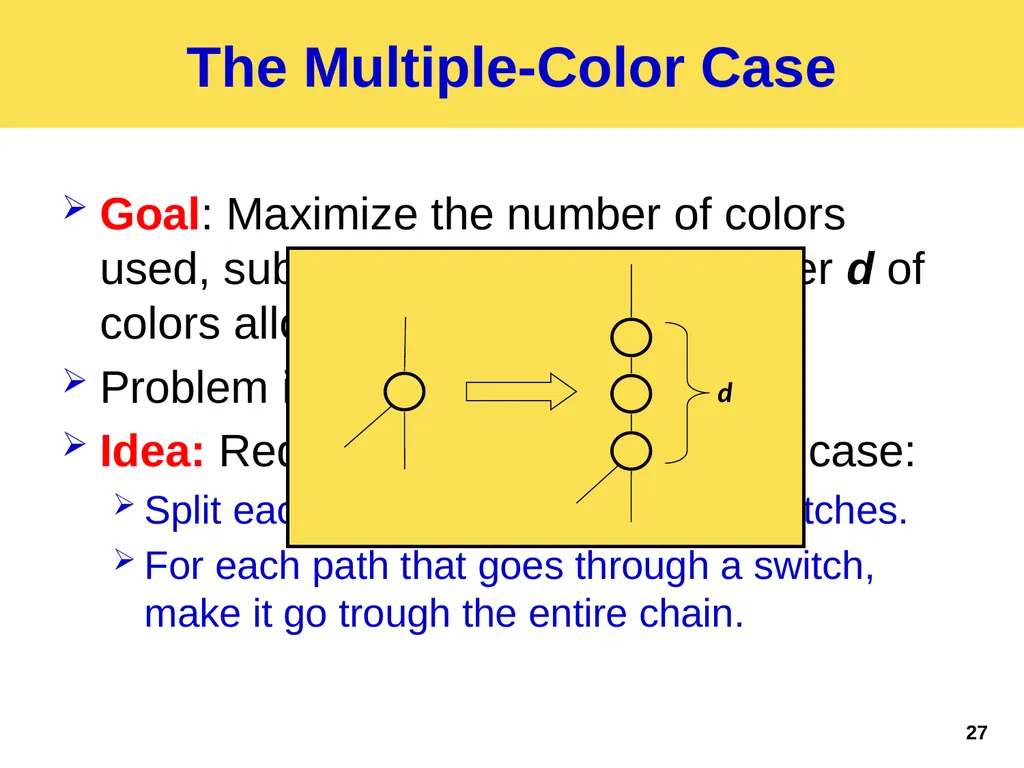
Idea: Reduction to the single-color case:
Split each switch into a chain of d switches.
For each path that goes through a switch, make it go trough the entire chain. 27<br>
28
Main Results Table Decomposition
Pivot Bit Decomposition
Cut-Based Decomposition
Rainbow Path Problem
A Single color case
The multiple color case.
Evaluation 28<br>
29
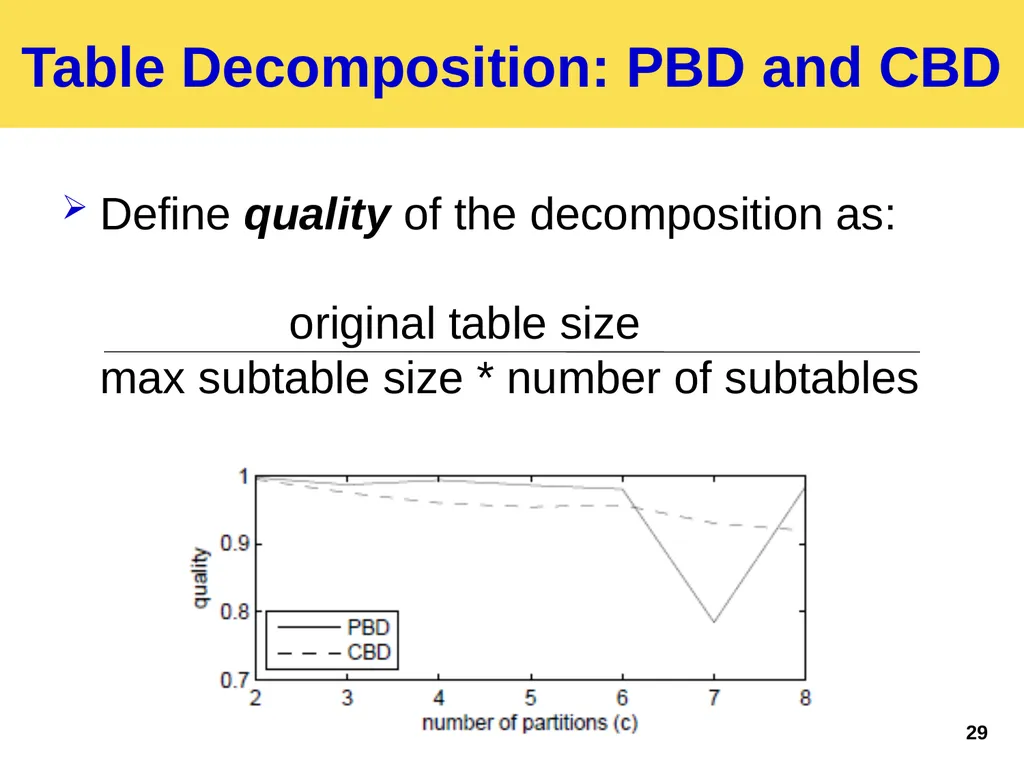
Table Decomposition: PBD and CBD Define quality of the decomposition as: �� original table size�max subtable size * number of subtables 29<br>
30
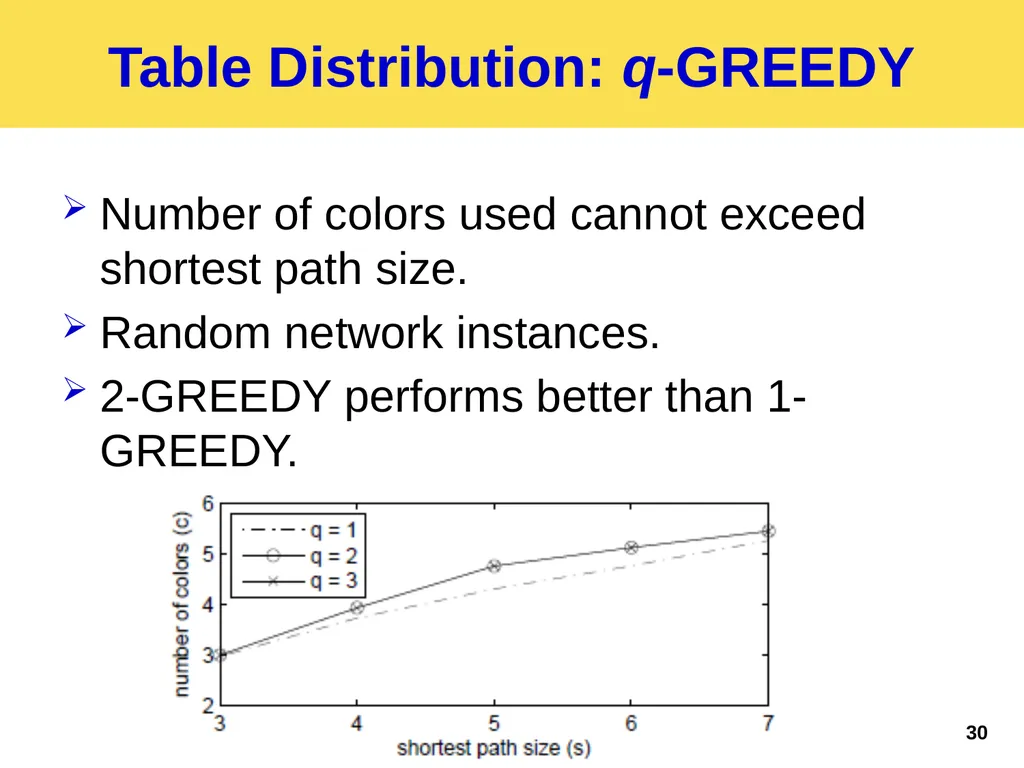
Table Distribution: q-GREEDY Number of colors used cannot exceed�shortest path size.
Random network instances.
2-GREEDY performs better than 1-GREEDY. 30<br>
31
Summary Practical distributed way of implementing access control with small tables:
Cut into subtables
Distribute the subtables 31<br>